


Languages
Pages
Legal


International Journal of Scientific & Engineering Research, Volume 6, Issue 4, April-2015 558
ISSN 2229-5518
IJSER © 2015
http://www.ijser.org
Development of wireless sensor network
system for LPG gas leakage detection system
T.H.Mujawar*1, V.D.Bachuwar*
2, M.S. Kasbe*
3, A.D. Shaligram** and L.P. Deshmukh*
4.
Abstract— Leakage of a gas in any sector may cause many health issues and hence in the work places it is to be cautioned against such disaster hap-
penings by implementing a safety system that can make an early alert to the users. This paper describes the development of wi reless sensor network for
LPG gas leakage detection. The proposed design includes: an Arduino Nano microcontroller, gas sensor and a XBee. The sensor node will detect a
minute concentration of the gas according to the voltage output of a sensor and also collects the gas leakage data thereby locating the specific area of
the sensor node. XBee sends the data from gas sensor to the monitoring system that is displayed on LabVIEW GUI. A GSM module was as a communi-
cation tool between the microcontroller unit and mobile phone unit. The system could be installed at any remote place and could be controlled by any
mobile phone supporting the SMS service. The reliability and productivity of the system are the key concerns and influence the design and development
choices for the system in terms of the hardware and software designs.
Index Terms— Arduino, Gas leakage detection, GSM shield,Gas leakage monitoring,RSSI, LabVIEW, XBee.
—————————— ——————————
1 INTRODUCTION
Natural gases such as liquefied petroleum gas (LPG) are wide-
ly used in industries. It is certainly possible that the gases may
leak and the system needs to be real time monitored. This pa-
per presents design and development of a wireless gas leakage
monitoring system by using the Arduino and XBee.
The system is configured in star type topology with devices
and sensors in it and then controls all the devices through a
gateway node with XBee network, and takes safety measures
to protect against serious risk. The proposed system uses XBee
as a wireless device, sensors and Arduino controller that not
only increases the system performance and but provides safe-
ty measures also.
In actual, the work was carried out using Arduino nano board,
MQ-2/MQ-6 gas sensor, XBee and a GSM module. The sensor
has excellent sensitivity combined with a quick response time
at low cost. Under gas leaked condition message to the author-
ized person or family member using Arduino GSM shield is
sent automatically.
Traditionally, gas leakage detection is monitored by a wired
sensor network, wherein power requirements and mainte-
nance cost are significantly high “[1]”.To overcome the limita-
tions of traditional system wireless sensor network is the best
choice. The high power requirement of wired sensor network
can be made simpler using WSN technology that uses differ-
ent protocol standards for short range wireless communica-
tion like Bluetooth, WI-Fi and Zigbee. Nowadays, Zigbee is
widely used in gas leakage monitoring applications for real
time monitoring of the threat area.
The monitoring of the proposed design is done through Lab-
VIEW “[2]”, [3]”. Also, GUI created using LabVIEW tool is
more interactive, facile and effective compared to the reported
methods.
2 SYSTEM ARCHITECTURE AND DESCRPTION
Many gas detecting systems are available which can detect
different levels of gas concentrations effectively. In this paper
we present a wireless sensor network for gas leak detection
based on a small-scale and low cost device those achieve Pro-
cessing, storing, sensing and communicating. The basic block
diagram of the proposed system is shown in figure 1.
Fig. 1. Block diagram of a wireless gas sensing s system
2.1 Wireless sensor node
The fundamental architecture of the WSN sensor node consists
IJSER
International Journal of Scientific & Engineering Research, Volume 6, Issue 4, April-2015 559
ISSN 2229-5518
IJSER © 2015
http://www.ijser.org
of a sensor unit, an analog signal conditioning unit, a compu-
tation unit and a wireless communication unit. The WSN
nodes were designed using these architectural tools.
Figure 2 shows a node prototype which is an Arduino board
that serves as a sensor node.
Fig.2 wireless sensor node
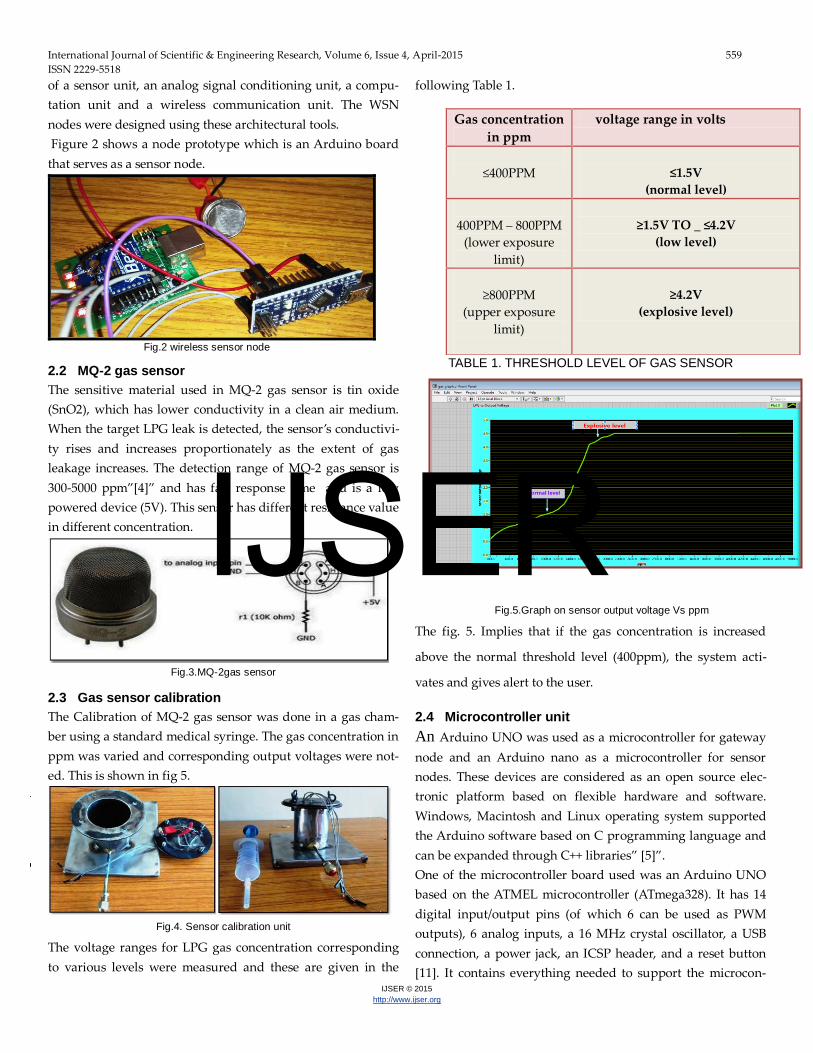
2.2 MQ-2 gas sensor
The sensitive material used in MQ-2 gas sensor is tin oxide
(SnO2), which has lower conductivity in a clean air medium.
When the target LPG leak is detected, the sensor’s conductivi-
ty rises and increases proportionately as the extent of gas
leakage increases. The detection range of MQ-2 gas sensor is
300-5000 ppm”[4]” and has fast response time and is a low
powered device (5V). This sensor has different resistance value
in different concentration.
Fig.3.MQ-2gas sensor
2.3 Gas sensor calibration
The Calibration of MQ-2 gas sensor was done in a gas cham-
ber using a standard medical syringe. The gas concentration in
ppm was varied and corresponding output voltages were not-
ed. This is shown in fig 5.
Fig.4. Sensor calibration unit
The voltage ranges for LPG gas concentration corresponding
to various levels were measured and these are given in the
following Table 1.
TABLE 1. THRESHOLD LEVEL OF GAS SENSOR
Fig.5.Graph on sensor output voltage Vs ppm
The fig. 5. Implies that if the gas concentration is increased
above the normal threshold level (400ppm), the system acti-
vates and gives alert to the user.
2.4 Microcontroller unit
An Arduino UNO was used as a microcontroller for gateway
node and an Arduino nano as a microcontroller for sensor
nodes. These devices are considered as an open source elec-
tronic platform based on flexible hardware and software.
Windows, Macintosh and Linux operating system supported
the Arduino software based on C programming language and
can be expanded through C++ libraries” [5]”.
One of the microcontroller board used was an Arduino UNO
based on the ATMEL microcontroller (ATmega328). It has 14
digital input/output pins (of which 6 can be used as PWM
outputs), 6 analog inputs, a 16 MHz crystal oscillator, a USB
connection, a power jack, an ICSP header, and a reset button
[11]. It contains everything needed to support the microcon-
Gas concentration
in ppm
voltage range in volts
≤400PPM
≤1.5V
(normal level)
400PPM – 800PPM
(lower exposure
limit)
≥1.5V TO _ ≤4.2V
(low level)
≥800PPM
(upper exposure
limit)
≥4.2V
(explosive level)
IJSER

International Journal of Scientific & Engineering Research, Volume 6, Issue 4, April-2015 560
ISSN 2229-5518
IJSER © 2015
http://www.ijser.org
troller; simply connect it to a computer with a USB cable or
power it with an AC-to-DC adapter or battery to get started.
Arduino nano is small, complete and breadboard-friendly
board based on ATMEGA 328 and works with Mini-B USB
cable instead of standard one. It has 14 digital input or output
pins (of which 6 can be used as PWM outputs), 6 analog in-
puts and a power jack, an ICSP header, and a reset button [5-6]
having number of facilities for communication with the com-
puter.
2.4 Zigbee transceiver
ZigBee is a set of specifications created specifically for control
and sensor networks. Built on IEEE 802.15.4, the standard for
low data rate wireless personal area networks (WPANs). It is a
low latency, low data rate, low cost, and low energy consump-
tion device. IEEE standard 802.15.4, which defines the physical
layer (PHY) and media access control (MAC) for low-rate
WPANs, restricts the data rate to 250 kbps in the global 2.4-
GHz Industrial, Scientific, Medical (ISM) band, while also
specifies low power consumption and cost. The Zigbee is a
program using X-CTU software.
2.5 Arduino GSM shield
The Arduino GSM shield allows an Arduino board to connect
to the internet, make/receive voice calls and send/receive SMS
messages. The shield uses a radio modem M10 by Quectel and
it is possible to communicate with the board using AT com-
mands. The shield establishes for software serial communica-
tion with the M10. Pin 2 is connected to the M10’s TX pin and
pin 3 to its RX pin. The modem's PWRKEY pin is connected to
Arduino pin 7.
The M10 is a Quad-band GSM/GPRS modem that works at
frequencies typically, at GSM 850MHz, GSM 900MHz, DCS
1800MHz and PCS 1900MHz. It supports TCP/UDP and HTTP
protocols through a GPRS connection. GPRS data downlink
and uplink transfer maximum speed is 85.6 kbps. The modem
can pull up to 2A of current at peak usage, which can occur
during data transmission. This current is provided through
the capacitor on the board's surface.
3 SOFTWARE APPROACH
3.1 Flowchart
The sensor node sends the output data from gas sensor to the
gateway node with the help of XBee transceiver. The Lab-
VIEW tool is provided for interfacing the hardware and soft-
ware parts. Then based on the threshold value set, the sensor
will keep on sensing the gas concentration, which is moni-
tored it on LabVIEW as shown in Fig. 6. Fig.6 is a flowchart
for a wireless gas leakage monitoring system.
Fig 6. Flowchart for wireless gas leakage monitoring system.
3.2 Arduino Programming for MQ-2
In this wireless gas leak detection system, the sensor is con-
nected to an analog port of the Arduino nano board (sensor
nodes)” [7]”, which measures various gas concentration at
ppm level and sends them to the Arduino UNO board (Gate-
way Node).The status of sensor nodes where the leakage exists
is shown in serial monitor window in a gateway node as be-
low (fig.7)
.
Fig. 7.Arduino programming for MQ-2
4 RESULT AND ANALYSIS
The present system was placed inside a room where a gas cyl-
inder was placed and leak detection was noted. The gas leak-
age response can be obtained and send to the mobile users
saved in Arduino GSM shield and also displayed on the moni-
toring system.
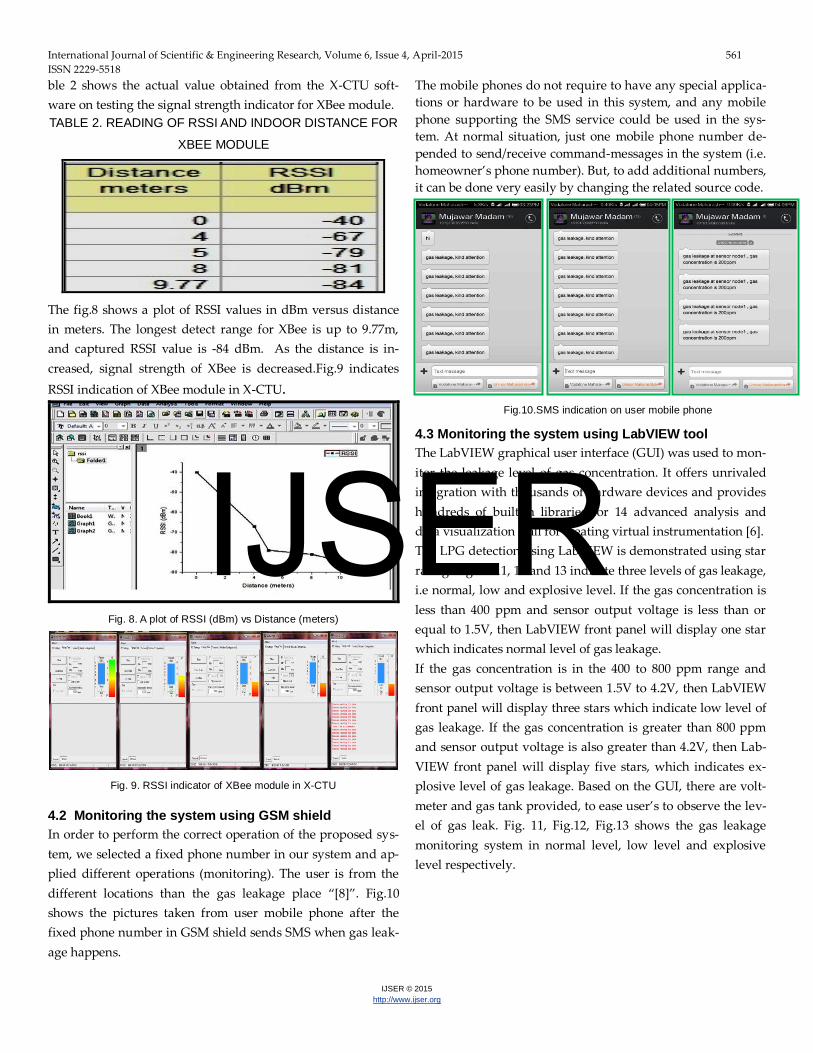
4.1 RSSI test of XBee module:
The signal strength indication of XBee series 2 was tested us-
ing USB to UART convertor connected to it and tested on con-
dition such that they are between the indoor of the room. Ta-
IJSER
International Journal of Scientific & Engineering Research, Volume 6, Issue 4, April-2015 561
ISSN 2229-5518
IJSER © 2015
http://www.ijser.org
ble 2 shows the actual value obtained from the X-CTU soft-
ware on testing the signal strength indicator for XBee module.
TABLE 2. READING OF RSSI AND INDOOR DISTANCE FOR
XBEE MODULE
The fig.8 shows a plot of RSSI values in dBm versus distance
in meters. The longest detect range for XBee is up to 9.77m,
and captured RSSI value is -84 dBm. As the distance is in-
creased, signal strength of XBee is decreased.Fig.9 indicates
RSSI indication of XBee module in X-CTU.
Fig. 8. A plot of RSSI (dBm) vs Distance (meters)
Fig. 9. RSSI indicator of XBee module in X-CTU
4.2 Monitoring the system using GSM shield
In order to perform the correct operation of the proposed sys-
tem, we selected a fixed phone number in our system and ap-
plied different operations (monitoring). The user is from the
different locations than the gas leakage place “[8]”. Fig.10
shows the pictures taken from user mobile phone after the
fixed phone number in GSM shield sends SMS when gas leak-
age happens.
The mobile phones do not require to have any special applica-
tions or hardware to be used in this system, and any mobile
phone supporting the SMS service could be used in the sys-
tem. At normal situation, just one mobile phone number de-
pended to send/receive command-messages in the system (i.e.
homeowner’s phone number). But, to add additional numbers,
it can be done very easily by changing the related source code.
Fig.10.SMS indication on user mobile phone
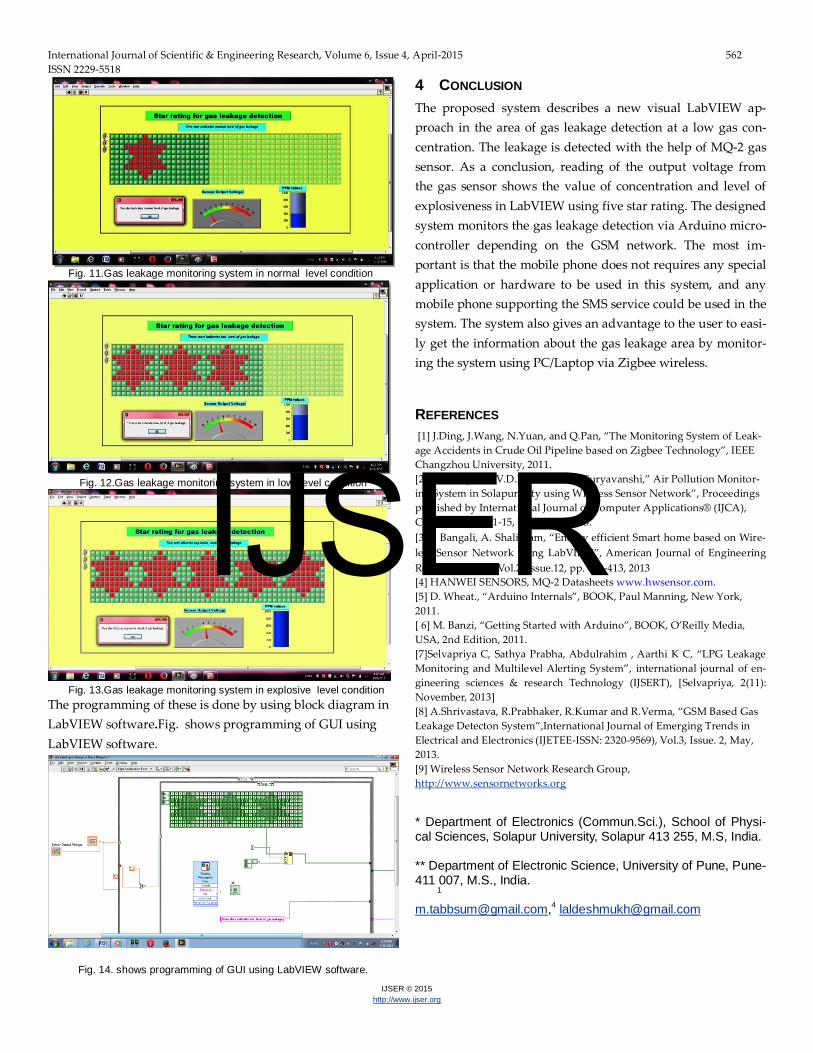
4.3 Monitoring the system using LabVIEW tool
The LabVIEW graphical user interface (GUI) was used to mon-
itor the leakage level of gas concentration. It offers unrivaled
integration with thousands of hardware devices and provides
hundreds of built-in libraries for 14 advanced analysis and
data visualization – all for creating virtual instrumentation [6].
The LPG detection using LabVIEW is demonstrated using star
rating. Figure 11, 12 and 13 indicate three levels of gas leakage,
i.e normal, low and explosive level. If the gas concentration is
less than 400 ppm and sensor output voltage is less than or
equal to 1.5V, then LabVIEW front panel will display one star
which indicates normal level of gas leakage.
If the gas concentration is in the 400 to 800 ppm range and
sensor output voltage is between 1.5V to 4.2V, then LabVIEW
front panel will display three stars which indicate low level of
gas leakage. If the gas concentration is greater than 800 ppm
and sensor output voltage is also greater than 4.2V, then Lab-
VIEW front panel will display five stars, which indicates ex-
plosive level of gas leakage. Based on the GUI, there are volt-
meter and gas tank provided, to ease user’s to observe the lev-
el of gas leak. Fig. 11, Fig.12, Fig.13 shows the gas leakage
monitoring system in normal level, low level and explosive
level respectively.
IJSER
International Journal of Scientific & Engineering Research, Volume 6, Issue 4, April-2015 562
ISSN 2229-5518
IJSER © 2015
http://www.ijser.org
Fig. 11.Gas leakage monitoring system in normal level condition
Fig. 12.Gas leakage monitoring system in low level condition
Fig. 13.Gas leakage monitoring system in explosive level condition
The programming of these is done by using block diagram in
LabVIEW software.Fig. shows programming of GUI using
LabVIEW software.
Fig. 14. shows programming of GUI using LabVIEW software.
4 CONCLUSION
The proposed system describes a new visual LabVIEW ap-
proach in the area of gas leakage detection at a low gas con-
centration. The leakage is detected with the help of MQ-2 gas
sensor. As a conclusion, reading of the output voltage from
the gas sensor shows the value of concentration and level of
explosiveness in LabVIEW using five star rating. The designed
system monitors the gas leakage detection via Arduino micro-
controller depending on the GSM network. The most im-
portant is that the mobile phone does not requires any special
application or hardware to be used in this system, and any
mobile phone supporting the SMS service could be used in the
system. The system also gives an advantage to the user to easi-
ly get the information about the gas leakage area by monitor-
ing the system using PC/Laptop via Zigbee wireless.
REFERENCES
[1] J.Ding, J.Wang, N.Yuan, and Q.Pan, “The Monitoring System of Leak-
age Accidents in Crude Oil Pipeline based on Zigbee Technology”, IEEE
Changzhou University, 2011.
[2] T.H.Mujawar,V.D.Bachuwar,S.S.Suryavanshi,” Air Pollution Monitor-
ing System in Solapur City using Wireless Sensor Network”, Proceedings
published by International Journal of Computer Applications® (IJCA),
CCSN-2013 (1):11-15, December 2013.
[3] J. Bangali, A. Shaligram, “Energy efficient Smart home based on Wire-
less Sensor Network using LabVIEW”, American Journal of Engineering
Research (AJER), Vol.2, Issue.12, pp. 409-413, 2013
[4] HANWEI SENSORS, MQ-2 Datasheets www.hwsensor.com.
[5] D. Wheat., “Arduino Internals”, BOOK, Paul Manning, New York,
2011.
[ 6] M. Banzi, “Getting Started with Arduino”, BOOK, O’Reilly Media,
USA, 2nd Edition, 2011.
[7]Selvapriya C, Sathya Prabha, Abdulrahim , Aarthi K C, “LPG Leakage
Monitoring and Multilevel Alerting System”, international journal of en-
gineering sciences & research Technology (IJSERT), [Selvapriya, 2(11):
November, 2013]
[8] A.Shrivastava, R.Prabhaker, R.Kumar and R.Verma, “GSM Based Gas
Leakage Detecton System”,International Journal of Emerging Trends in
Electrical and Electronics (IJETEE-ISSN: 2320-9569), Vol.3, Issue. 2, May,
2013.
[9] Wireless Sensor Network Research Group,
http://www.sensornetworks.org
* Department of Electronics (Commun.Sci.), School of Physi-cal Sciences, Solapur University, Solapur 413 255, M.S, India.
** Department of Electronic Science, University of Pune, Pune-411 007, M.S., India.
1
[email protected],4 [email protected]
IJSER

International Journal of Scientific & Engineering Research, Volume 6, Issue 4, April-2015 563
ISSN 2229-5518
IJSER © 2015
http://www.ijser.org
IJSER
Top Related