


Languages
Pages
Legal

APPROVED:
Jimmy K. Byrd, Major Professor Colleen M. Eddy, Minor Professor Jane B. Huffman, Committee Member Nancy Nelson, Chair, Department of Teacher
Education and Administration Jerry R. Thomas, Dean of the College of
Education Michael Monticino, Dean of the Robert B.
Toulouse School of Graduate Studies
DETERMINING FACTORS THAT INFLUENCE HIGH SCHOOL PRINCIPAL
TURNOVER OVER A FIVE YEAR PERIOD
Rebecca Replogle Sheppard, B.S., M.Ed.
Dissertation Prepared for the Degree of
DOCTOR OF EDUCATION
UNIVERSITY OF NORTH TEXAS
May 2010
Sheppard, Rebecca Replogle. Determining factors that influence high school
principal turnover over a five year period. Doctor of Education (Educational
Administration), May 2010, 106 pp., 15 tables, 4 illustrations, references, 89 titles.
The purpose of this study was to determine the effects of salary, compensation
and benefits, accountability, job stress, increased instructional responsibilities, changes
in student demographics, lack of support, politics, advancement opportunities and
promotion on tenure and turnover among high school principals in the state of Texas.
The participants in the study included 60 Texas high school principals who left a high
school principalship for a different high school principalship within the past 5 years. The
participants completed the Texas Principal Survey and data were analyzed using binary
logistic regression.
The data indicated that salary, compensation and benefits was a significant
factor in predicting an increase in the odds of principal turnover for principals who had
been in their prior principalship 5 or more years over principals who had been in their
prior principalship less than 5 years. Additionally, advancement opportunities was a
significant factor in predicting a decrease in the odds of principal turnover for principals
who had been in their prior principalship 5 or more years over principals who had been
in their prior principalship less than 5 years.
Responses from an open ended question asking principals why they left their
prior principalship suggested that principals left for reasons including new challenges,
lack of support and family. The results of this study support the need for continued
research in the area of principal turnover and provide insight to district superintendents,
school boards and principals.

ii
Copyright 2010
by
Rebecca Replogle Sheppard
ACKNOWLEDGEMENTS
The completion of this dissertation was a difficult journey – one in which the
reward was not the completion of the dissertation, but the reward was all that was
learned along the way. This journey would not have been completed without the support
of many people. First, I would like to thank my husband, David, for his encouragement
and patience during this process. I could never have completed this dissertation without
his support. Next, I would like to thank my son, Chris, who was completing his Ph.D.
during the same time and was always willing to listen and provide support and
inspiration during the frustrating times.
I would like to thank Dr. Jimmy Byrd, my committee chairman, for continually
pushing me and challenging me to produce a higher quality dissertation. I would also
like to thank Dr. Jane Huffman and Dr. Colleen Eddy for providing constructive
comments, guidance and support. I would like to acknowledge Celia McCall and other
members of the CIRA lab for their assistance with the statistics portion of the
dissertation.
I would also like to acknowledge my parents and step parents, Jim and Mary Lou
Replogle and Devona and Chuck Dollar for the encouragement and support they have
provided me throughout my life. They have all been very influential parts of my life.
I never could have completed this journey without the support of my friends. They
were always there to lift me up and lend a sympathetic ear. They provided
encouragement and pushed me to continue. Finally, I would like to acknowledge the
staff of DeSoto High School and Ruby Young Elementary who supported me throughout
this process.
iii

TABLE OF CONTENTS
Page ACKNOWLEDGEMENTS ............................................................................................... iii LIST OF TABLES ........................................................................................................... vii LIST OF FIGURES ........................................................................................................ viii Chapters
I. INTRODUCTION ....................................................................................... 1 Theoretical Framework ................................................................... 3 Additional Motivational Theories ..................................................... 4 Background ..................................................................................... 5 Statement of the Problem ............................................................... 7 Purpose and Research Question .................................................... 8 Significance of the Study ................................................................. 8 Limitations and Delimitations .......................................................... 8 Limitations ............................................................................. 9 Delimitations .......................................................................... 9 Definition of Terms ........................................................................ 10 Organization of the Study .............................................................. 10
II. REVIEW OF LITERATURE .................................................................... 12
Introduction ................................................................................... 12 Motivation Theory .......................................................................... 12
Maslow’s Hierarchy of Needs and Motivation Theory ......... 13 Hawthorne Studies ............................................................. 14 Herzberg’s Theory of Work and Motivation ........................ 15 Lawler-Porter Model ........................................................... 16
Leadership and Factors Related to Principal Turnover ................. 17 Salaries .............................................................................. 18 Increased Accountability..................................................... 18 Time Requirements and Increased Instructional Responsibilities .................................................................. 19
iv
Job Stress .......................................................................... 19 Changes in Student Demographics .................................... 20 Lack of Support .................................................................. 20 Bureaucracy, State Policies and Unfunded Mandates ....... 21
Research Studies Related to Principal Turnover........................... 21 Summary ....................................................................................... 33
III. METHODOLOGY .................................................................................... 35
Participants ................................................................................... 35 Procedures ......................................................................... 42
Research Method and Design ....................................................... 44 Dependent Variable ............................................................ 44 Independent Variables ....................................................... 45
Data Analysis ................................................................................ 47 Quantitative ........................................................................ 47 Qualitative .......................................................................... 47
Summary ....................................................................................... 48 IV. ANALYSIS ............................................................................................... 49
Univariate and Bivariate Analysis .................................................. 49
Univariate Analysis ............................................................. 49
Predictor Variable Ratings .................................................. 50
Bivariate Analysis ............................................................... 52
Independent Samples t-test ................................................ 55
Logistic Regression ....................................................................... 57
Overall Model Evaluation.................................................... 58
Statistical Tests of Individual Predictors ............................. 59
Additional Factors Related to Participants .................................... 61
Factors Influencing Participant Career Choice ................... 61
Principal Preparedness ...................................................... 63
Movement to a School Within or Outside Prior School
District ................................................................................ 66
Size of Previous School...................................................... 66
v
Hired from Within or Outside District for Prior
Principalship ....................................................................... 67
Open Ended Responses ............................................................... 68
Question 1 .......................................................................... 69
Question 2 .......................................................................... 70
Question 3 .......................................................................... 71
Question 4 .......................................................................... 72
Summary ....................................................................................... 74
V. FINDINGS, DISCUSSION AND RECOMMENDATIONS ......................... 76
Findings and Discussion ............................................................... 76
Recommendations for Future Research ....................................... 83
Conclusion .................................................................................... 84
Appendices
A. SURVEY .................................................................................................. 86 B. CONSENT NOTICE ................................................................................. 93 C. PARTICIPANTS RATINGS OF MOTIVATING FACTORS AND PEARSON
CHI SQUARES ........................................................................................ 95 REFERENCES .............................................................................................................. 99
vi
LIST OF TABLES
Page 1. Demographics of Sample ................................................................................... 37
2. Age and Number of Years in the High School Principalship ............................... 38
3. Educational Background and Preparedness ...................................................... 40
4. Other Background Information ............................................................................ 42
5. Descriptive Statistics of Study Variable .............................................................. 50
6. Point Bi-Serial Correlations for the 10 Predictor Variables and the Dichotomous Variable .............................................................................................................. 54
7. Independent Samples t-test ................................................................................ 56
8. The Observed and Predicted Frequencies for Principal Turnover by Logistic Regression ......................................................................................................... 58
9. Variables in the Equation .................................................................................... 61
10. Factors Influencing Participant Career Choice ................................................... 62
11. Independent Samples t-test – Career Choice ..................................................... 63
12. Preparedness ..................................................................................................... 65
13. Movement to School Within or Outside Prior District .......................................... 66
14. Size of Previous School ...................................................................................... 67
15. Hired from Within the District or Out of the District for Prior Principalship .......... 68
vii
viii
LIST OF FIGURES 1. Why did you become a principal? ....................................................................... 70
2. Least rewarding part of being a principal ............................................................ 71
3. Most rewarding part of being a principal ............................................................ 72
4. Why did you leave your prior position? ............................................................... 74

CHAPTER I
INTRODUCTION
The shortage of principals in the United States has caused nationwide concern
(National Association of Secondary School Principals (NAASP), 2000). Within the next
decade approximately 40% of the current principals will retire (NASSP, 2002). In
addition, the minimum expectation for principal retention is approximately three years
with 52% of principals leaving during that time (Fuller, Orr & Young, 2009). Principal
retention is also a concern for the state of Texas. In Texas, 52.2% of principals left their
principalship within a three year period from 2004 to 2007 with the highest turnover at
the high school level of 60.7%. From 1996 to 2008, the average tenure for high school
principals in Texas was 3.83 years (Young and Fuller, 2009).
The issue of high school principal turnover is important as increasing numbers of
research studies demonstrate that principals have an impact on teachers, schools and
student achievement (Leithwood & Jantzi, 2000; Hallenger & Heck, 1998). As principal
turnover increases, teacher turnover increases (Fuller, Young, & Baker, 2007). In short,
teacher turnover has a negative and independent impact on student achievement
(Fuller, Young & Baker, 2007; Levy, Field & Jablonski, 2007). While principal turnover
indirectly impacts student achievement, principal stability is necessary to foster positive
working conditions and trusting relationships. School reform strategies rely on the
fostering of small learning communities among students and staff. Time is needed for
these learning communities to mature and for principals to develop strong interpersonal
relationships. More succinctly, as evidenced by Fuller et al. (2007) who found that
school improvement requires time, principals must maintain their position for a minimum
1

of five years after the implementation of large scale change for the change to be
successful; therefore, retaining a principal for a minimum of 5 years is crucial to school
improvement (Fullan,1991).
The changing role of the principalship may be a leading factor in the rise of
principal turnover (Whaley, Cox & Cox, 2002). According to Goldman (1966), principals
in early public schools were mainly responsible for bookkeeping and clerical duties.
Since its conception over 100 years ago, the duties of the principal have become more
diverse and complicated. The principalship has evolved through the stages of school
master, head teacher, teacher principal, building principal, supervising principal to
instructional leader (Weiss, 1992).
Reports including A Nation at Risk: The Imperative for Educational Reform in
1983 and the 1986 Carnegie report, A Nation Prepared: Teachers for the Twenty-First
Century, challenged principals to become strong effective leaders for school reform.
The urgency of these reports called for the school principal to affect the climate and
culture of the school, become a change agent, empower others, and motivate students
and staff. The principal of today must juggle the complex role of a building manager and
instructional leader (Institute for Educational Leadership, 2000). As a building manager,
the principal must address personnel, discipline students, keep the hallways safe, order
supplies, take care of bus and cafeteria issues and comply with district and state
mandates. As an instructional leader, the principal must be involved in improving
teaching and learning on the campus.
The role of the principal as an instructional leader combined with other factors
including accountability, workload, job stress and demographic changes in students
2
contribute to the increase in principal turnover rates and lack of qualified replacements
(National Conference of State Legislatures, 2002). While there is evidence that the
length of tenure among principals impacts schools, virtually no study has determined
the factors that impact principal turnover. Therefore, the purpose of this study is to
determine if a relationship exists between job related factors and the length of tenure
and turnover of high school principals.
Theoretical Framework
Theories of motivation help explain what energizes and channels a person’s
behavior and also what sustains or terminates behaviors. Theories of motivation utilize
two basic approaches, content and process, to answer questions about human behavior
(Konnert & Augenstein, 1995). Content theories are based on the premise that things
within us generate motivation such as specific needs, motives, expectancies, incentives,
goals, and reinforcers (Hanson, 2003, Konnert & Augenstein, 1995). Content theories
also suggest that we are driven by deficits we feel in basic and learned needs. Once the
deficits are fulfilled, we move on to other needs (Hanson, 2003). Process theories
explore how behavior is initiated, channeled, sustained and terminated and suggest the
importance of understanding motivation as a cognitive process – that people make
choices that energize, sustain or terminate their behavior (Hanson, 2003, Konnert &
Augenstein, 1995). Administrators and superintendents who understand human
behavior and motivation as they relate to job satisfaction will be more effective in
maximizing human potential and making positive differences in the climate of the
schools (Webb & Norton, 2003).
3

In the early 1940s, Abraham Maslow began developing his theories of
motivation. The main premise of his theory is that human behavior is determined by
biological, cultural, and situational conditions or needs (Maslow, 1954). From the lowest
to highest needs, these needs are physiological, security, social, self-esteem, and self-
actualization. Needs that shape the motivation for individuals to act are dependent upon
the state of these conditions or the level in which the person currently exists. According
to Maslow (1954), a need is a potential motivator until it is at least partially met. As a
need is met, it becomes ineffective as a motivator and the next need on the hierarchy
becomes the motivator.
In 1957, Frederick Herzberg and three of his colleagues conducted a study on
job satisfaction (Herzberg, Mausener, Patterson, & Capwell, 1957). From this study,
they proposed a theory regarding job factors that motivate employees and hygiene
factors that affect dissatisfaction. Herzberg’s (1968) motivation theory is one of the early
content theories from which newer theories of motivation have been based. Such
theories attempt to explain factors that motivate individuals by identifying and satisfying
individuals needs and desires and the goals pursued to satisfy these desires (Ball,
2003). Herzberg’s theory on motivation and job satisfaction has been widely used to
examine job satisfaction and employee turnover; therefore, it is employed in the current
study to examine the factors that influence high school principal turnover.
Additional Motivation Theories
From 1927 through 1932, Mayo, Roethlisberger and Dickson began studies
based on a human relations approach. From their studies, they concluded that workers
tended to act as members of informal groups rather than individuals. Their studies also
4
indicated that nonmonetary rewards were important in increasing productivity and that
worker’s reactions to rewards and standards occurred for a group and not just
individuals (Mayo, 1933).
Porter and Lawler (1968) proposed the Lawler-Porter model of extrinsic and
intrinsic work motivation. Porter and Lawler promoted restructuring the work
environment so that good performance would lead to both extrinsic and intrinsic
rewards, which in turn would produce job satisfaction and decrease turnover in the
workplace.
Motivation theory as it relates to high school principal turnover was examined in
this study. Hygiene factors related to the job context, such as salary, policy, support,
changes in students and time requirements were explored. Motivators that relate to the
job such as workload and accountability were examined. Other factors, including job
stress and support from staff, parents and students which relate to Maslow’s hierarchy
of needs were considered.
Background
Few researchers have explored the issue of principal turnover. Akiba and
Reichardt (2004) examined the career paths taken by principals who left their
principalships. For principals who left their positions for a different principalship within or
outside the district, Akiba and Reichardt explored the relationship of predictor variables
on attrition and found a significant relationship between attrition and reading test scores.
Lower achievement scores predicted higher attrition of female principals. Similarly, a
study by Partlow (2007) investigated the relationships of building enrollment, student
attendance, pupil-teacher ratio, teacher attendance, student mobility, student
5
achievement in math and reading and superintendent turnover to principal turnover.
Partlow found that only math test scores were statistically significant in predicting
turnover. As student achievement increased, principal turnover decreased.
Gates, Ringel, Santibanez, Ghosh-Dastidar, and Brown (2006) sought to identify
school level or individual factors that impacted the probability that the principal would
either leave his job for a different job within the system, remain a principal at the same
school or remain a principal but change schools or districts. Experience was found to be
a significant predictor of the probability of principals changing jobs or leaving the
profession in North Carolina. Gates et al. (2006) also found that Hispanic principals
were more likely to change schools or positions.
During interviews with 12 principals who had voluntarily left their principalship,
Johnson (2005) found that 3 of the principals had no intention of leaving their positions
until a better opportunity arose and the remaining 9 principals were unsatisfied with their
current positions and sought other alternatives. Johnson also discovered that several
factors, including workload, bureaucracy, discipline and irate parents were contributors
to the principals’ dissatisfaction with their current position.
In addition to voluntary turnover of principals, a percentage of principals leave
their jobs involuntarily each year (Davis, 1997). Failure to communicate and lack of
ability to make good judgments and decisions were cited by superintendents as major
reasons why principals were terminated. Principals also failed when they were unable to
build trust and confidence among parents and teachers by attempting to please
everyone.
6
In summary, prior research indicates that achievement is a significant predictor of
principal turnover. Higher achievement scores lead to higher retention rates and lower
achievement scores lead to higher principal turnover. Experience was also found to be
a significant predictor of principal turnover. In addition, several factors including
discipline, bureaucracy, and workload can lead to job dissatisfaction.
Statement of the Problem
Much research has been conducted on teacher turnover while little research has
been conducted on principal turnover. Within the next decade, approximately 40% of
current principals will retire, creating a nationwide principal shortage (NASSP, 2002). In
addition, the high school principal turnover rate from 2004 to 2007 in the state of Texas
was 60.7% with an average tenure of 3.83 years (Young & Fuller, 2009). Increasing
numbers of research studies suggest that principals have an impact on teachers,
schools and student achievement (Leithwood & Jantzi, 2000; Prestine & Nelson, 2005).
Further, evidence suggests that principals must remain in a school for 5 years to impact
change (Fullan, 1991). Additionally, there are financial costs related to principal turnover
in terms of recruiting and training new principals as well as indirect costs related to
teacher turnover and decreased achievement (Fuller & Young, 2009). Studies indicate
that principal retention rates are influenced by the level of achievement in the schools
(Fuller & Young, 2009; Partlow, 2007; Akiba & Reichardt, 2004).
This research adds to the literature base by addressing specific job related
factors and their relationship to high school principal tenure and turnover. Results from
the study provide information to school superintendents and school boards to assist
them in decreasing principal turnover.
7
Purpose and Research Questions
The purpose of this study was to determine the effects of factors including salary,
compensation and benefits, accountability, job stress, increased instructional
responsibilities, changes in student demographics, lack of support, politics,
advancement opportunities and promotion on tenure and turnover of high school
principals in the state of Texas. The research question that guided this study was:
What are the factors that contribute to the length of tenure and turnover among
high school principals in Texas public schools?
Significance of Study
Some ways in which the education profession will benefit from the results of this
study are included in the following discussion. First, the results of the study will provide
information to superintendents and school boards who are attempting to reduce the
percentage or frequency of high school principal turnover in their district by identifying
factors that influence turnover. Information gained by the study can be used to bring
about changes in the expectations of the role of the high school principal (Pounder &
Crow, 1993).
Factors identified in the study can be used to assist districts in developing
stronger leadership development programs for high school principals (Zeliner, Ward,
McNamara, Gideon, Camacho & Edgewood, 2002). By identifying factors that influence
high school principal turnover, districts can provide more specific training to high school
principals to help them cope with the factors that they cannot control and help them to
become more proficient in the factors they can control. Finally, the results can be used
by university principal preparation programs and other certification agencies to help
8
better prepare principal candidates, specifically in the areas of time management and
job delegation (Pounder & Crow, 1993).
Limitations and Delimitations
Limitations
“Limitations are the built-in limits of the method you use to explore your question”
(Bryant, 2004, p 59). The limitations of this study are:
1. The time between the principals’ current principal position and their prior position
may have limited their recollection of the circumstances that influenced their
decision to leave their prior position.
2. The research may have been limited by the self reporting nature of the data
collection. Participants may have minimalized or embellished their responses.
Delimitations
“Delimitations are the factors that prevent you from claiming that your findings
are true for all people in all time and places” (Bryant, 2004, p.57). The delimitations of
this study are:
1. The principals in this study were limited to high school principals in Texas;
therefore, principals serving Grades Pre Kindergarten through Grade 8 were not
included. Principals outside the state of Texas were also not included in this
study.
2. This study surveyed high school principals who had been in the high school
principalship for at least 5 years in Texas and who had changed principal
positions during this 5 year period. Therefore principals who retired, left the
9
profession, promoted to a position outside the principalship or became a principal
within the past 5 years were not included in the study.
3. A database from the Texas Education Agency was accessed to determine which
Texas high school principals had been in the principalship from at least the 2004-
2005 school year through the 2008-2009 school year. Therefore, principals who
left the principalship in Texas between 2004 through 2009 to accept a
principalship in a different state were not included in the study.
Definition of Terms
• Factors- variables or occurrences that may contribute to or have an influence on principal turnover.
• Principal - school administrator: the head administrator of a school, especially a grade school or high school (MSN Encarta, 2009).
• Public high school – state funded educational organization containing grades 9-12 or 10-12 that provides free education.
• Tenure – the length of time in the position of principal in a single school.
• Turnover – the number of principals who leave the school and are replaced.
Organization of the Study
Chapter I served as an introduction to this study to identify the factors that
influence high school principal turnover. Due to increasing pressures and demands
placed on the current role of the principal, a study of these factors could provide
valuable information to superintendents, universities and other principal certification
agencies. Chapter II provides a literature review which includes motivation theory and
motivating factors related to turnover and a review of national and international research
studies.
10
11
Chapter III includes a restatement of the research question and definitions of
specific terms related to the research question. The research method and design are
discussed. Chapter III contains 4 tables. Chapter IV presents the results of the study
and includes 4 figures and 11 tables. Chapter V summarizes and discusses the results
and offers suggestions for future studies.
CHAPTER II
REVIEW OF LITERATURE
Introduction
The principal of today is faced with complex challenges of being the instructional
leader, creating a school wide vision, planning effective staff developments, hiring and
mentoring teachers, handling discipline, attending school events and many other details
associated with supervising a school (Richard, 2000). Additional roles of the principal
include: staff motivator, evaluator, fund raiser, business manager, counselor and
student role model (Whaley, Cox & Cox, 2002). In addition, today’s principal is
responsible for meeting and implementing curricular mandates to assure that all
students achieve high standards on high stakes assessments as well as meeting
additional requirements of No Child Left Behind (NCLB) ACT (Cushing, Kerrins, &
Johnstone, 2003). The changing role of the principalship may be a leading factor in the
rise of principal turnover (Whaley, Cox & Cox, 2002).
Motivation Theory
Retention and productivity of workers is a function of how well the worker is
motivated. The findings and research of Maslow (1954) and Herzberg et al. (1957)
provide the basis for much of the work in the field of human motivation. The work of
Maslow and Herzberg is among the first to record the factors leading to job satisfaction
and motivation (Lord, 2002). Additional theories of motivation evolved by adding
components to these early theories. One such model, called the Lawler-Porter model
expanded earlier models and contains intrinsic and extrinsic intervening variables
(Porter & Lawler, 1968). Administrators and superintendents who understand human
12
behavior and motivation and how human behavior and motivation relate to job
satisfaction are more effective in maximizing human potential and making positive
differences in the climate of the schools (Webb & Norton, 2003). Workers who are
happy and satisfied with their jobs are less likely to leave; therefore, motivation theory
can be used to explain why workers leave their jobs.
Maslow’s Hierarchy of Needs and Motivation Theory
The main premise of Maslow’s theory is that human behavior is determined by
cultural, biological, and situational conditions or needs and that job satisfaction can be
explained through a hierarchy of needs (Maslow, 1954). Maslow developed his theory of
motivation primarily through clinical observations. From the lowest to highest needs, the
needs are physiological, safety, social, self-esteem and self-actualization. The first level,
physiological, includes basic survival needs such as food, shelter, sex, sleep and water.
The second level consists of physical safety and financial security which includes the
protection of job security and the protection from illness, danger and economic disaster.
The third level, social needs, consists of needs that include love, friendship belonging
and acceptance by peers. Maslow describes the fourth level as the need for approval
and recognition of work and the need for self esteem, such as achievement,
independence and self confidence. The final level in Maslow’s hierarchy, self-
actualization, includes self-development, autonomy and self-direction. Needs that shape
the motivation for individuals to act are dependent upon the state of these conditions or
the level in which the person currently exists. According to Maslow (1954), a need is a
potential motivator until it is at least partially met. As a need is met, it becomes
ineffective as a motivator and the next need on the hierarchy becomes the motivator.
13
Hawthorne Studies
Until the late 1930s, it was assumed that the major factors behind employee
morale and motivation were physical working conditions and wages (Hanson, 2003).
During the period from 1935 to 1950, a shift in emphasis to a concern for human
relations was observed, in which the major assumption was that the fulfillment of
employee psychological and social needs motivated employees to work more
productively (Guthrie & Reed, 1991). The human relations approach stressed the
importance of human variables such as attitudes, feelings and the organization’s social
climate. These variables became apparent in the Hawthorne studies, which were
conducted by Mayo, Roethlisberger and Dickson from 1927 through 1932.
Initially, the purpose of the Hawthorne Studies was to examine whether or not
worker productivity could be improved through increased illumination in the work area.
The results of the study indicated that production increased and decreased without
direct relation to the intensity of the illumination (Mayo, 1933). Mayo and his colleagues
conducted related experiments regarding changes in working conditions such as room
temperature and the length of breaks and found similar results. Mayo and his
colleagues concluded that increases in the workers’ productivity were a function of
human factors and not a function of the variables they manipulated. It also became
evident in the study that the employees responded to the attention they received and to
the novelty of the study (Mayo, 1933, Roethlisberger & Dickson, 1939). Mayo and his
colleagues concluded that psychological and social factors significantly affect morale
and productivity, and managers or supervisors who understand employees’ beliefs,
needs, and expectations will be more successful in motivating them.
14
The most significant findings from the Hawthorne Studies included the discovery
that workers tend to act as members of informal groups rather than individuals. The
Hawthorne Studies demonstrated that group norms were as or more important than
administrative norms; that nonmonetary rewards were important in increasing
productivity and that reaction to rewards and standards occurs for a group, not just
individuals. An additional finding from the Hawthorne studies was that leaders who
awarded equal attention to task performance and consideration such as respect, trust,
concern and friendship were more effective as measured by worker satisfaction.
Herzberg’s Theory of Work and Motivation
Herzberg, Manser and Snyderman (1959) conducted a study using 203 randomly
selected engineers and accountants. Participants were interviewed and asked to
recount a time when they felt good and bad about their jobs and why they felt that way.
Through these interviews, Herzberg developed a two factor theory of motivation which
questioned whether different types of factors were responsible for bringing about job
dissatisfaction and satisfaction. According to Herzberg et al., two types of factors affect
motivation: hygiene factors and motivators. Hygiene factors motivate workers when they
are absent but have no perceived effect when present. They are things that when taken
away, workers take steps to get them back. Examples of hygiene factors include decent
working conditions, pay, security, benefits, policies and administration, and
interpersonal relationships. These factors are considered extrinsic motivators and are
related to the environment in which the job takes place or the factors surrounding the
job itself.
15
Motivators, according to Herzberg et al., are factors whose presence motivates
and leads to job satisfaction. Their absence does not cause any particular job
dissatisfaction; however their absence fails to motivate the worker. These factors focus
on the job itself and are intrinsic to the worker. Herzberg et al. maintained that
achievement and recognition on the job, the work, job responsibilities and job
advancement were the most important factors in increasing job satisfaction. In
comparison, hygiene factors determine dissatisfaction and motivators determine
satisfaction. These two scales are independent and a worker can rate high on both.
Because Herzberg’s theory has been widely used to examine job satisfaction, it should
be useful in the discussion of job satisfaction and principal turnover as identified in this
study.
The Lawler-Porter Model
In 1968, Porter and Lawler proposed the Lawler-Porter model of extrinsic and
intrinsic work motivation. The Lawler-Porter model is cyclical and contains
explicit intervening variables which incorporate extrinsic and intrinsic motivation.
Lawler and Porter (1968) contend that extrinsic motivation requires a channeling
between an activity and consequences such as verbal or tangible rewards; therefore,
satisfaction comes from the extrinsic consequences to which the activity leads
rather than the activity itself. Intrinsic motivation involves people performing
an activity because they find the activity interesting and gain satisfaction from the
activity itself. Porter and Lawler (1968) promoted a restructuring of the work
environment so that good performance would lead to both extrinsic and intrinsic
rewards, which in turn would produce job satisfaction and decrease turnover in the
workplace. The restructuring of the jobs included making jobs more intrinsically
16

rewarding by enlarging jobs to make jobs more interesting and by rewarding effective
performance through extrinsic rewards such as promotions or higher pay.
Motivation theory as it relates to high school principal tenure and turnover will be
discussed further in this study. Factors related to high school turnover including salary,
benefits and compensation, demographic changes in students, lack of support and
advancement opportunities will be addressed.
Leadership and Factors Related to Turnover
Leaders who awarded equal attention to task performance and consideration
such as respect, trust, concern and friendship were more effective as measured by
worker satisfaction (Mayo, 1933, Roethlisberger & Dickson, 1939). The leadership of a
school principal impacts the climate of the school, which in turn indirectly impacts school
achievement (Norton, 2002). Taylor and Tashakkori (1994) studied data from students
and teachers regarding school climate and found that school leadership was a major
factor in determining school climate. Additional studies over the years reinforced the fact
that healthy school climate positively impacts school achievement (Bulach & Malone,
1994; Winter & Sweeney, 1994; Paredes & Frazer, 1992). Exemplary schools have
effective leaders who engage all stakeholders; students, teachers, parents and other
staff members in school wide school reform that is effective and maintained over time.
However, despite the need for strong leaders, principal turnover and a lack of qualified
replacements appear to be increasing. Multiple expectations and the changing role of
the principal may be deterring prospective leaders (NCSL, 2002). Scarpa (2005) states,
“the problems related to attracting and retaining qualified administrators are problems
17
related to difficult work conditions, a lack of incentives, and an unmanageable range of
responsibilities” (p.27).
Several factors have aided in changing the role of the principal as well as
causing challenges to the principalship. These factors include salary, compensation and
benefits, accountability, time requirements, job stress, increased instructional
responsibilities, changes in student demographics, lack of support from parents,
students and central administration and politics (NCSL, 2002).
Salaries
The second level of Maslow’s hierarchy of needs (1954) contends that the need
for financial security must be met before people can move to the next level. The
difference in pay for a beginning principal and an experienced teacher is slim or
nonexistent (Cushing et al., 2003). When principal salaries are calculated on a daily or
hourly basis, there is often not a great difference between a principal’s pay and a
teacher’s pay, considering the number of hours a principal typically works in a day
compared to a teacher’s hours (Yerkes & Guaglianone, 1998). In looking at Herzberg’s
theory (1968), salary is not a motivator; however individuals will be dissatisfied with their
job if they believe they are not paid fairly.
Increased Accountability
More emphasis has been placed on the role of the principal as an instructional
leader, data analyst and curriculum developer. Legislation such as the No Child Left
Behind Act (NCLB) has broadened the role of the principal by implementing
assessments and standards for schools thus making school administration more
accountable for the performance of their students. The principal is expected to know
18
and implement best practices for increasing student learning (Whaley, Cox & Cox,
2002). Although principals are held accountable for the scores of their school, principals
typically have little control over instructional programs, hiring and budgets (Archer,
2003). Many administrators feel overrun by high expectations of the school district and
community, the complexity of the job and the workload (Yerkes & Guaglianone, 1998).
The emergence of high stakes testing and the expectations derived from high stakes
testing may contribute to job dissatisfaction. Dissatisfaction, as explained by Herzberg
(1968) is a hygiene factor which in turn can lead to turnover in the workplace.
Time Requirement and Increased Instructional Responsibilities
An additional hygiene factor (Herzberg, 1968), the amount of time principals
spend on the job, appears to be increasing. High School principals reported spending
an average of 62 hours a week on the job while elementary principals reported
spending an average of 52 hours per week at work (Magnuson, 2002). Long work
hours, extended summer contracts and after school responsibilities often take principals
away from home causing a toll on the principals’ personal lives (Kerrins, Cushing &
Johnstone, 2001). Unending supervision of afterschool and evening activities contribute
to the increase in the number of hours principals work, particularly at the high school
level (Yerkes & Guaglianone, 1998).
Job Stress
Job stress for principals comes from many different areas including high
accountability demands, public criticism and legal requirements. Physical security is the
second level of Maslow’s hierarchy (1954).This stress can lead to health issues such as
high blood pressure and weight gain (Cushing et al., 2003). Mountains of paperwork
19
created by district and state demands consume significant amounts of a principal’s time
thus adding to the stress of the principal (Yerkes & Guaglianone, 1998). An additional
stressor is the blame placed on the principal if reform demands and other targets are
not met (Cushing et al., 2003). Many principals feel that the stress caused by the
increasing demands of the job is not worth having the job (Hertling, 2001).
Changes in Student Demographics
Schools across the nation face increased pressures of providing an adequate
education to students who are more economically, linguistically, racially and
developmentally more diverse than in the past (Whaley, Cox & Cox, 2002). When
comparing socioeconomic status, race, family needs and academic needs, no two
schools have the same demographics or student population. Every school is unique;
therefore every principal faces a unique set of challenges and must be equipped with
the skills and knowledge for all students to be successful (Loeser, 2008). The fourth
level of Maslow’s hierarchy (1954) includes the need for self esteem, such as
achievement, independence and confidence.
Lack of Support
Principals want and need respect from others (Hopkins, 2003). Maslow describes
the fourth level of his hierarchy of needs is the need for approval and recognition of
work. Supporting this theory, Hertling (2001) maintained that lack of support from
parents and community along with negative comments from students and media
contribute to the lack of principal retention. Principals feel that they receive little support
from central administration which in turn causes them to feel unappreciated and alone
(Nakamura & Samuals, 2000; Bell, 2001). Mayo and his colleagues contend that
20
psychological and social factors significantly affect morale and productivity, and
supervisors who understand employees’ beliefs, needs, and expectations will be more
successful in motivating them.
Bureaucracy, State Policies and Unfunded Mandates
Autonomy is among the highest level of needs in Maslow’s hierarchy (1954). A
study conducted by Public Agenda (2001) found that bureaucracy and lack of autonomy
obstruct the principal’s ability to run schools effectively. Principals surveyed reported
that they needed more autonomy in rewarding good teachers and eliminating bad
teachers. More and more mandates are being enacted, yet adequate funding often does
not accompany the mandate (Whaley, Cox & Cox 2002). Principals must be able to
manage money and budgets effectively in order to meet state policies and mandates.
Public Agenda (2001) cited that 18% of superintendents and 13 % of principals reported
that funding is such a critical problem that only minimal progress could be achieved in
implementing unfunded mandates. Seventy-three percent of administrators and 72 % of
principals reported that progress could be made in carrying out unfunded mandates,
although lack of funding was a problem. Herzburg et al. (1957) identified policies as
hygiene issues which can cause frustration to employees if they are unclear,
unnecessary or if not everyone is expected to follow them.
Research Studies Related to Principal Turnover
In reviewing prior studies, Akiba and Reichardt (2004) examined the attrition of
elementary school principals and assistant principals from 1999 to 2001 using Colorado
state data. Specifically, age-specific attrition rates by gender, race and conditional
factors associated with the attrition of elementary school leaders were explored.
21
The data, collected from the Colorado Department of Education, included
information on 714 principals and assistant principals from 94 districts in 694
elementary schools. In order to examine the age group specific attrition rates by gender
and race, Akiba and Reichardt (2004) compared the attrition rates of minority, non
minority, male and female by 7 age categories; 35 or younger, 36 to 40, 41 to 45, 45 to
50, 51 to 55, 56 to 60 and 60 and above. For age 35 or younger, Akiba and Reichardt
found that minority participants had higher attrition rates at 40% compared to non-
minority participants at 20% and participants who were female had higher attrition rates
at 30% than male participants 23%. Likewise, for ages 56 to 60, minority participants
had higher attrition rates at 35% compared to non-minority participants at 18% and
female participants had higher attrition rates at 40% compared to male participants at
approximately 18%. Akiba and Reichardt conjectured that the higher female attrition
rate for ages 35 and younger was associated with the likelihood of younger females
leaving their positions to raise families and that higher attrition rates for female and
minorities in the 56 to 60 age group indicate that females and minorities retire earlier
than male and non minority leaders. According to Herzberg et al. (1957), “The
phenomenon of aging pervades all of man’s activities. The role we play and the status
we enjoy are often determined by age” (p. 5).
Akiba and Reichardt (2004) also examined the career paths taken by the
participants who left their positions between 1999 and 2000 and between 2000 and
2001. Between 1999 and 2000, 8% of the participants left their leadership positions or
moved to other states, 5% moved to schools in other districts while 13% moved to
different schools within the same district. Between 2000 and 2001, 9% of the
22
participants left their leadership positions, 4% moved to schools in a different district
and 10% moved to schools within the same district.
While examining predictors for school leader attrition, Akiba and Reichardt,
(2006) utilized multiple logistic regression analysis with movement as the dichotomous
dependent variable. Independent variables included demographic and professional
characteristics (ethnicity, age and education levels), working conditions (poverty level,
percentage of minority students, school size, school location, instructional expenditures
per student and administrative expenditures per student), school achievement, and
alternative opportunities and labor markets (salary difference, number of administrative
positions and labor markets within regions of Colorado). The predictors were analyzed
separately for males and females.
In the area of demographic and professional characteristics, Akiba and Reichardt
found that female leaders with a masters or specialist degree were less likely to move to
other schools than leaders holding a bachelors degree (B = -.737, p < .10), suggesting
that females with a masters degree had reached the highest level of Maslow’s hierarchy
(Maslow, 1954). For working conditions, Akiba and Reichardt discovered that male and
female leaders were more likely to leave large schools than middle size schools (B =
.794, p < .10 and B = .924, p < .01). In examining school achievement, Akiba and
Reichardt found that female leaders were 1.4 times more likely to change positions than
males based on the Colorado Student Assessment Program for 4th grade reading and
writing scores. Finally, male and female participants receiving large increases in their
salary were more likely to change positions.
23

Similarly, Partlow (2007) conducted a study exploring possible relationships of 8
contextual variables and principal turnover. Seven of the contextual variables were
organizational variables: building enrollment, student attendance, pupil-teacher ratio,
teacher attendance, student mobility and student achievement in math and reading.
Superintendent turnover was considered a school district variable. The variables were
extrinsic in nature and related to factors relating to the job (Herzberg, 1959).The
purpose of Partlow’s study was to examine the 8 variables in regards to principal
turnover frequency. Partlow defined principal turnover frequency as “the change of a
principal as well as the frequency with which this occurs” (p.15) or simply stated, the
number of principals in the building during a specified period of time.
Partlow (2007) analyzed 7 years of school data, from 1997 to 2003 using a
proportional, stratified, random sampling procedure to select 109 elementary schools in
southwest Ohio. To predict principal turnover frequency from the 8 variables, a multiple
stepwise regression equation was used. Partlow's findings indicated that of the 8
variables only student test scores in fourth grade math (R² = .067, F(1, 88) = 6.37, p <
.05) were statistically significant in prediction of principal turnover rate.
In 2007, Papa conducted a multivariate analysis to examine the determinants of
principal retention by studying the impact of salary, school characteristics and principal
traits on principal retention. Participants were divided into 2 categories: interdistrict,
which included newly hired non-urban principals who were either retained for at least 4
years or became a principal of a different school outside the district within the 4 years or
within-district which included newly hired urban principals who were either retained for
24

at least 4 years or became a principal of a different school within the district within the 4
years.
The results from the interdistrict multivariate analysis indicated that principals
hired from within the district who had less than 5 years of district experience were
60.8% (p = .01) less likely to be retained than principals hired with at least 5 years of
district experience. Results also indicated that the predicted probability of retaining a
principal hired from within the district with less than 5 years of district experience was
84.8% compared to 91.3% for principals hired from outside the district and 93.4% for
principals hired from outside the district with at least 5 years of district experience. Papa
concluded that the issue for retention was not an insider versus outsider issue but an
insider with little district experience versus the remaining principals.
The results from Papa’s study (2007) also indicated that the likelihood of
retention or non retention increased by 8.1% as a result of a $1000 increase in salary
associated with the retention or non retention. The same retention or non retention
decreased as the percentage of student enrollment, non-white students, LEP and
uncertified teachers increased within the school. Papa concluded that schools with
lower percentages of nonwhite students, LEP students, higher student enrollment, or
uncertified teachers and schools offering higher salaries were more desirable to
principals, all else equal.
The results from Papa’s multivariate within-district analysis were similar to the
results from the interdistrict analysis. The likelihood of retention or non-retention
increased by 11.9% as a result of a $1000 increase in salary and decreased as the
percentage of non-white students increased. Papa concluded that policy initiatives
25
aimed at providing funding to increase salaries for principals in disadvantaged schools
could compensate for the disparities between schools. This finding supports Herzberg’s
theory (1968) which indicated that salary is not a motivator; however individuals will be
dissatisfied with their job if they believe they are not paid fairly.
Herzberg et al., (1959) maintained that the work itself and job responsibilities
were among the most important factors relating to job satisfaction; therefore, attention
should be given to roles and responsibilities of jobs. The roles and responsibilities of
school principals are often treated as duties that all principals should do which creates
an overstated portrait of the principal’s job suggesting that if principals are to succeed,
they should take on an array of responsibilities (Portin, Schneider, DeArmond,
Gundlach & Washington University, 2003). Portin et al. (2003) examined what principals
actually do by studying the core roles for all principals regardless of the type of school,
how these roles differ among public, charter, magnet and private schools and how
training programs address the job demands. Through interviews and school visits, the
study team drew five major conclusions:
1. The core of the principal’s job is diagnosing his or her particular school’s needs and, given the resources and talents available, deciding how to meet them. 2. Regardless of school type-elementary or secondary or public or private-schools need leadership in seven critical areas: instructional, cultural, managerial, human resources, strategic, external development and micro political. 3. Principals are responsible for ensuring that leadership happens in all seven critical areas, but they do not have to provide it. Principals can be “one-man” bands, leaders of jazz combos, or orchestra conductors. 4. Governance matters, and a school’s governance structure affects the ways key leadership functions are performed. 5. Principals learn by doing. However trained, most principals think they learned the skills they need “on the job.” (p. 4,5)
26
Further, Gates et al. (2006) used administrative data from Illinois and North
Carolina from 1987-88 through 2000-01 to study principal mobility and turnover. A
longitudinal event history approach was used to examine the relationship between
individual characteristics and the school in which they worked. During the time period
examined, the principal turnover rate in Illinois was 14% and the turnover rate in North
Carolina was 18%.
In order to better understand principal turnover and mobility, Gates et al. used
multivariate analyses of the career transitions of school principals and a multinomial
logit modeling approach. In the study, the researchers were seeking to identify school
level or individual factors that would affect the probability that the principal would either
leave his job for a different job within the system, remain a principal in the same school,
or remain a principal but change schools. Many variables were studied were extrinsic
variables (Herzberg, 1959), including education/experience, gender, race, quality of the
undergraduate institution, region or urbanicity, and school characteristics.
In examining education and experience, Gates et al. found no effect on the
probability of principals leaving the system or changing schools. In Illinois, principals
with a master’s degree were less likely to change positions within the state system than
principals without an advanced degree (B = .06, p < .05). Experience was found to be a
significant predictor for all transitions; dropping out of the principalship, changing
schools and changing positions in Illinois and for the probability of changing schools or
dropping out in North Carolina. In Illinois, for experience, negative relationships were
found for the probability of changing schools or changing positions, suggesting that very
young or very old principals were least likely to change schools or positions. In the area
27
of gender in Illinois, Gates et al. found that on average female principals were 2.9%
more likely to leave the system and change positions than men (2.1%), however; the
results were not statistically significant.
In Illinois, a strong positive effect was found among Hispanic principals on the
probability of changing schools (B = .26, p < .05) and changing positions (B = .27, p <
.05) but not on leaving the system. No significant effects were found among black
principals or the quality of the undergraduate institution.
Gates et al. found that in Illinois, principals in urban areas of Chicago were less
likely (B = .47, p < .05) than principals in rural areas to leave the system but in urban
areas not including Chicago no statistical difference was found. A higher probability of
principals changing schools was found for urban areas of Chicago (B = .22, p < .05) but
lower probability was noted in the suburban areas of Chicago compared to rural areas.
The probability of changing positions was found to be higher for principals in rural areas
than for principals in the urban or suburban areas of Chicago. In North Carolina, a small
increase was found in the likelihood of principals in urban areas leaving the system (B =
.28, p < .05) and in changing schools and a small decrease was noted in the likelihood
of urban and non urban principals moving to non-principal positions.
The racial makeup of the students was a significant factor of the probability of
principals changing schools or positions. The percent of non-White students showed a
positive relationship to principals changing schools or positions in Illinois and North
Carolina. In North Carolina, schools with 0% minority had an average principal turnover
rate of 14% compared to 24% for schools with 100% minority students. For Illinois, the
percentiles were not as high, with a 13% turnover rate for schools with 0% minority
28

population and 16% for schools with 100% minority population. In Illinois, principals that
were the same race as the majority of their student population showed greater job
stability (B = .29, p < .01). School size in Illinois indicated a negative relationship to the
probability of principals leaving with each of the outcomes suggesting that larger
schools have a greater degree of principal stability than small schools. In North
Carolina, school size indicated a negative relationship for principals changing schools
but no relationship to other types of moves.
Finally, Johnson (2005) studied the experiences of 12 principals who had
voluntarily terminated their principalship. She applied the process of role exit
(Ebaugh,1998) to her study. This process contains four stages:
• First doubts – when the individual begins questioning staying in his current job. This may lead to feelings of dissatisfaction.
• Seeking alternatives- when the individual begins comparing his current role with other possible roles
• The turning point – when the person decides that it is no longer an option to stay in his current role
• Creating the ex-role –the individual combines the expectations and norms of old and new roles to create a consistent sense of self
Johnson (2006) found that nine of the principals were unsatisfied with their job
and sought other alternatives. Four of the exiters entered the principalship hoping to
help and influence the students but came up against many barriers which prevented
them from doing so. Three principals wanted to assist teachers with professional
development but found that their workload prevented them from providing instructional
leadership. Of the remaining two principals, one felt that the principalship took too much
of an emotional and physical toll; the other had family matters to contend with. The
exited principals also cited cultural issues, workload, bureaucracy, student discipline,
29
and irate parents as contributing factors to their job dissatisfaction. Four of the nine
principals recalled a specific turning point which influenced their decision to quit. For
one, the turning point occurred when, after two years of work, the staff voted down a
curriculum change. Other principals cited lack of support by their supervisors as their
turning point. The remaining 3 exiters were satisfied in their positions and had no
intentions of leaving until a better opportunity presented itself.
In order to reduce turnover, Johnson (2006) suggested that districts should
reduce the isolation principals feel when faced with challenges, reduce the principal’s
workload, provide effective leadership training and reduce the difference between the
accountability level expected by the principals and the lack of influence they have over
the factors that impact school success. Similar suggestions were made by Lawler-Porter
(1968) for restructuring the workplace in order to provide a balance between intrinsic
and extrinsic rewards.
In examining principal turnover, approximately 5% of principals leave their jobs
involuntarily each year, although few studies have been conducted in this area (Davis,
1997). A study in California asked superintendents to rank the top five reasons why
principals are fired (Davis, 1998). The most common response was a failure of
principals to communicate in a manner that would build positive relationships with
parents, students, colleagues and teachers. The second most common response by
superintendents was a failure of principals to make good judgments and decisions that
display a comprehensive understanding of school problems and issues.
Superintendents cited the inability of principals to build a strong base of support among
parents, community and teachers as the third most common reason that principals fail.
30

The failure of the principal to manage diverse political demands and pressure placed on
the school by community or school members was also cited by superintendents. Finally,
superintendents felt that principals fail when they are unable to build trust and
confidence among teachers and parents.
Similar to the United States, New Zealand began experiencing principal turnover
in their rural areas after the Tomorrow’s Schools educational reform was put in place
(Whittall & New Zealand, 2002). Between the years of 1990 and 2000, Whittall collected
data from a sample of 50 small rural primary schools. These schools had a total of 179
principals during the 10 year period with small rural schools (0 - 50 students) averaging
5.06 principals over the 10 year period, medium rural schools (51 – 100 students)
averaging 3.09 principals over the 10 year period and larger rural schools (101 - 150
students) averaging 3.09 principals over the 10 year period with the total average
number of years for principal tenure averaging 2.36 years. Data collected from the study
included the number of principal transitions for each school in the study, the departing
principal’s destinations and the reason for the departure using interviews, observations,
and other information obtained by associates. The data from the analysis of the
departing principal’s destination and the reason for the departure revealed that a small
number (19 or 14.17%) of principals were seeking promotions while 27 principals or
20.14% were seeking other careers. Schools which were located near larger cities had
lower transitions, but the transitions increased proportionately as the distance from the
cities increased from 8 principal appointments for schools located near the center of
town to 17 principal appointments for schools located in rural towns. In addition, conflict
31
(13 or 14%) and workload (33 or 36%) were significant factors for principals leaving the
principalship.
Additionally, Fraser and Brock (2006) conducted a study on principal retention
among Catholic school principals in New South Wales, Australia. Similar to Herzberg’s
Theory of Motivation which identified factors that caused satisfaction and dissatisfaction
in the workplace, Fraser and Brock were concerned first with identifying the incentives
or disincentives as they related to attracting and retaining quality principals. The
purpose of the study was to determine from the principals the type of environment that
allows for job satisfaction and the circumstances that would continue to attract the
principals to the job.
Fraser and Brock randomly selected 47 elementary and secondary principals to
participate in the study. Twenty principals agreed to participate and 17 principals agreed
to an additional telephone interview. A qualitative study was conducted using narrative
surveys and structured interviews based on themes which emerged from the surveys.
The following themes emerged from the analysis of the data:
• Factors that encourage job retention • Drawbacks of the principal’s role • Factors that prompted a change of schools • The ideal principal position (p. 431)
In examining the factors that encouraged job retention, the data revealed that
financial security was a significant factor, particularly for male principals. The need for
financial security is consistent with level 2 of Maslow’s hierarchy of needs (1954). Lack
of other opportunities within the Catholic schools was cited as a major reason for this.
Other factors included the principal’s commitment to Catholic education, commitment to
the church, commitment to learning and teaching and the continuing challenges of the
32
job. Male principals also indicated that having a vision or plan for the school was
another factor that contributed to their desire to stay in the principalship.
In the theme of drawbacks to the principal’s role, these principals indicated that
disincentives to the job included a sense of isolation, insufficient pay and compensation,
stress, issues with staff, demanding and dissatisfied parents, and unrealistic
expectations from supervisors. Sense of isolation included isolation from the staff due to
their position and isolation from their family due to night and daytime commitments.
Stress was generated mainly by non-educational tasks and responsibilities which
consumed much of the principal’s time. Principals also indicated that salary and
compensation were not equated with the role. Parent demands, lack of their support on
educational issues and threat of litigation were reported as major disincentives.
Although the data did not indicate that these disincentives caused principals to leave
their job, the continued presence of the disincentives may discourage teachers from
aspiring to become administrators.
Principals in this study reported changing schools because they no longer felt
satisfied in their current position. Other principals sited challenges of a new position or a
sense of renewal as incentives for changing schools. In some cases, principals left for
family or personal reasons.
The data indicated that the ideal job situation for a Catholic school principal
favored more support by higher authorities in the areas of special needs children, legal
liabilities, conflicts with unions and unprofessional staff. Principals indicated a need for
recognitions for a job well done and clearly defined expectations for the principal’s role.
33

Summary
Chapter II provided a review of the literature that included an overview of
motivation theory and leadership, as well as factors relating to principal turnover.
National and international studies were included in the review.
As evidenced in Chapter II, factors such as increased accountability, time
requirements and workload, salaries, job stress, policies, changes in student
demographics and lack of principal support contribute to the changing role of the
principal and principal turnover. These factors show a close relationship to the hygiene
factors and motivators identified by Herzberg as being contributors to job satisfaction or
dissatisfaction.
Principal turnover negatively affects teacher quality, teacher retention and
student achievement (Miller, 2009). Principal stability is critical for developing positive
working relationships and implementing change in schools (Fuller et al., 2008). In
response to principal turnover and lack of qualified applicants, school superintendents
and school boards are seeking options that will assist in retaining school principals. This
study strives to identify factors that can be used to predict principal turnover.
34
CHAPTER III
METHODOLOGY
The purpose of this study was to explore factors that contribute to the length of
tenure among high school principals in Texas public schools. Chapter 3 presents the
participant’s demographic and background information, participant selection process
and the research method and design. Further, the data collection instrument and
procedures for data collection are described. Finally, this chapter provides a summary
of the data analysis process. The research question that guided this study was:
What are the factors that contribute to the length of tenure and turnover among
high school principals in Texas public schools?
Participants
The sample consisted of 60 participants. This sample size was considered small
based on the “rules of thumb” as set forth by Thorndike and cited in Peng, So, Stage,
and St. John, (2002). Thorndike’s rules include using 50 participants plus the square of
the number of variables. Applying the “rules of thumb” to this study, the suggested
sample size for this study should be approximately 150 participants.
The participant demographics included 43 (71.7%) males and 17 (28.3%)
females as presented in Table 1. These percentages are representative of the gender
breakdown for high school principals in the state of Texas from 2006 – 2009 as
obtained through the Texas Education Agency which reported 69% male and 31%
female. Forty-three (71.7%) of the participants were White, 6 (10%) were African
American, 7 (11.7%) were Spanish American, 1 (1.7%) was Asian American while 3
(5%) were classified as “other.” The ethnic breakdown for high school principals from
35
36
2006 – 2009 according to information provided by the Texas Education Agency was:
74% White, 9.4% African American, 15.3% Hispanic, 0.1% Asian and 0.4% American
Indian which indicates that the ethnicity of the participants in the study were similar to
those for the state of Texas. The participants were initially divided into two groups to
provide further insight into the difference in the relationship between the independent
variables and the length of tenure in the job. Group 1 consisted of high school principals
who had been in their prior high school principalship 1 to 4 years before moving to a
new principalship. Four years were used as the cut point for Group 1 based on prior
research which indicated that 3.83 years was the average years of tenure for high
school principals in Texas (Young & Fuller, 2009). Group 2 consisted of high school
principals who had been in their prior high school principalship 5 to 15 years before
moving to a new high school principalship. The demographic make-up of Group 1 and
Group 2 were similar as indicted in Table 1.
The chi square of 11.27 (p < .01), as displayed in Table 1, for all participants in
the area of gender indicated that the participants were not evenly distributed. There
were significantly greater proportions of males than females. Similarly, the chi square of
102.00 in the area of ethnicity demonstrated that the participants were not evenly
distributed among the 5 ethnic groups included in the study. There were a significantly
larger proportion of White participants in comparison to the remaining race categories.
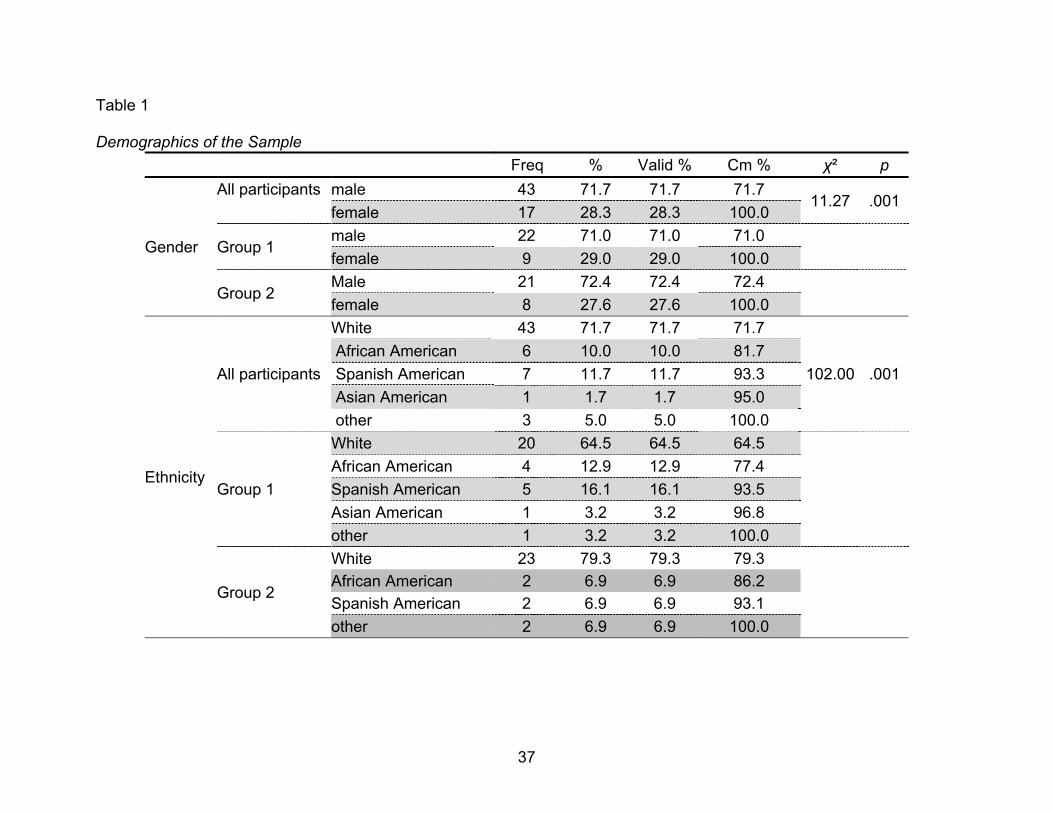
Table 1
Demographics of the Sample
Freq % Valid % Cm % χ² p
Gender
All participants male 43 71.7 71.7 71.7 11.27 .001
female 17 28.3 28.3 100.0
Group 1 male 22 71.0 71.0 71.0
female 9 29.0 29.0 100.0
Group 2 Male 21 72.4 72.4 72.4
female 8 27.6 27.6 100.0
Ethnicity
All participants
White 43 71.7 71.7 71.7
102.00 .001 African American 6 10.0 10.0 81.7 Spanish American 7 11.7 11.7 93.3 Asian American 1 1.7 1.7 95.0 other 3 5.0 5.0 100.0
Group 1
White 20 64.5 64.5 64.5
African American 4 12.9 12.9 77.4 Spanish American 5 16.1 16.1 93.5 Asian American 1 3.2 3.2 96.8 other 1 3.2 3.2 100.0
Group 2
White 23 79.3 79.3 79.3
African American 2 6.9 6.9 86.2 Spanish American 2 6.9 6.9 93.1 other 2 6.9 6.9 100.0
37
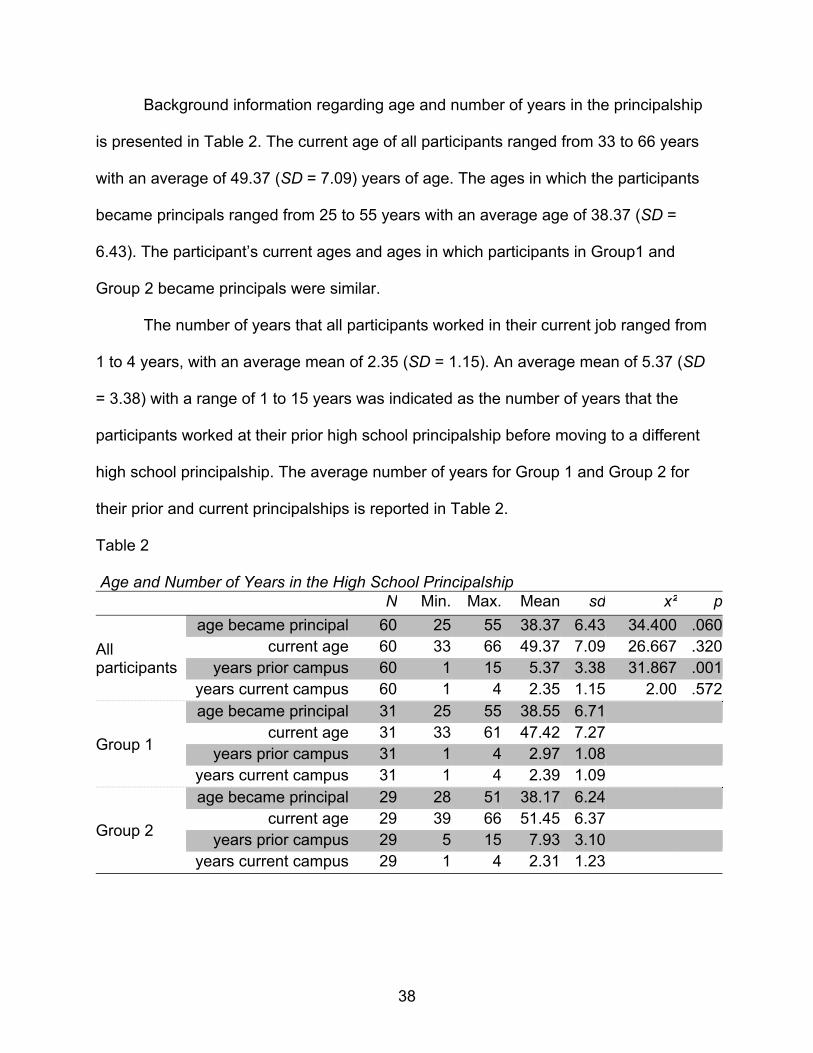
Background information regarding age and number of years in the principalship
is presented in Table 2. The current age of all participants ranged from 33 to 66 years
with an average of 49.37 (SD = 7.09) years of age. The ages in which the participants
became principals ranged from 25 to 55 years with an average age of 38.37 (SD =
6.43). The participant’s current ages and ages in which participants in Group1 and
Group 2 became principals were similar.
The number of years that all participants worked in their current job ranged from
1 to 4 years, with an average mean of 2.35 (SD = 1.15). An average mean of 5.37 (SD
= 3.38) with a range of 1 to 15 years was indicated as the number of years that the
participants worked at their prior high school principalship before moving to a different
high school principalship. The average number of years for Group 1 and Group 2 for
their prior and current principalships is reported in Table 2.
Table 2
Age and Number of Years in the High School Principalship N Min. Max. Mean sd x² p
All participants
age became principal 60 25 55 38.37 6.43 34.400 .060current age 60 33 66 49.37 7.09 26.667 .320
years prior campus 60 1 15 5.37 3.38 31.867 .001years current campus 60 1 4 2.35 1.15 2.00 .572
Group 1
age became principal 31 25 55 38.55 6.71current age 31 33 61 47.42 7.27
years prior campus 31 1 4 2.97 1.08years current campus 31 1 4 2.39 1.09
Group 2
age became principal 29 28 51 38.17 6.24current age 29 39 66 51.45 6.37
years prior campus 29 5 15 7.93 3.10years current campus 29 1 4 2.31 1.23
38
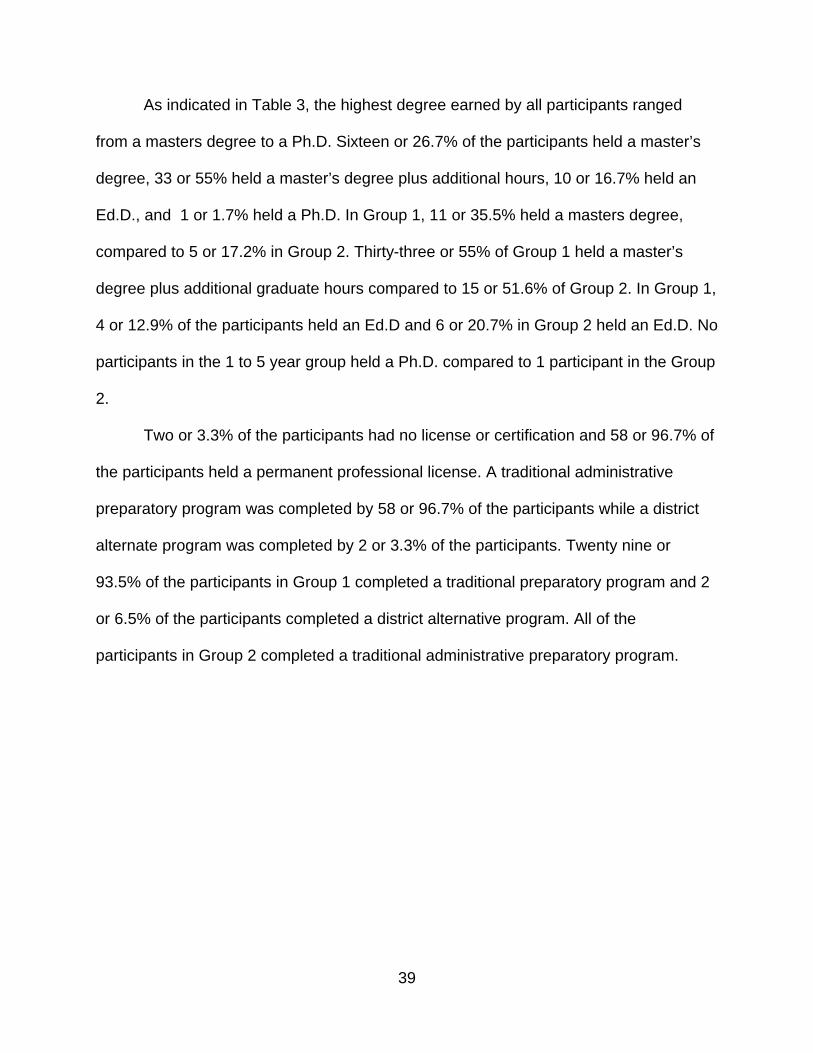
As indicated in Table 3, the highest degree earned by all participants ranged
from a masters degree to a Ph.D. Sixteen or 26.7% of the participants held a master’s
degree, 33 or 55% held a master’s degree plus additional hours, 10 or 16.7% held an
Ed.D., and 1 or 1.7% held a Ph.D. In Group 1, 11 or 35.5% held a masters degree,
compared to 5 or 17.2% in Group 2. Thirty-three or 55% of Group 1 held a master’s
degree plus additional graduate hours compared to 15 or 51.6% of Group 2. In Group 1,
4 or 12.9% of the participants held an Ed.D and 6 or 20.7% in Group 2 held an Ed.D. No
participants in the 1 to 5 year group held a Ph.D. compared to 1 participant in the Group
2.
Two or 3.3% of the participants had no license or certification and 58 or 96.7% of
the participants held a permanent professional license. A traditional administrative
preparatory program was completed by 58 or 96.7% of the participants while a district
alternate program was completed by 2 or 3.3% of the participants. Twenty nine or
93.5% of the participants in Group 1 completed a traditional preparatory program and 2
or 6.5% of the participants completed a district alternative program. All of the
participants in Group 2 completed a traditional administrative preparatory program.
39
Table 3 Educational Background, n=60 Freq
%Cumulative
%x² p
Education Level
All participants
Master's 16 26.7 26.7
36.400 .000Master's Plus 33 55.0 81.7
Ed.D 10 16.7 98.3Ph.D. 1 1.7 100.0
Group 1 Master's 11 35.5 35.5
Master's Plus 16 51.6 87.1Ed.D 4 12.9 100.0
Group 2
Master's 5 17.2 17.2Master's Plus 17 58.6 75.9
Ed.D 6 20.7 96.6Ph.D. 1 3.4 100.0
Certification
All participants
no license or certification 2 3.3 3.3 56.267 .000Permanent professional license 58 96.7 100.0
Group 1 no license or certification 1 3.2 3.2
Permanent professional license 30 96.8 100.0
Group 2 no license or certification 1 3.4 3.4
Permanent professional license 28 96.6 100.0
Leadership Program
All participants
traditional prep program 58 96.7 96.756.267 .000district alternate certification program 2 3.3 100.0
Group 1 traditional prep program 29 93.5 93.5
district alternate certification program 2 6.5 100.0Group 2 traditional prep program 29 100.0 100.0
40
The information displayed in Table 4 indicated that 2 of the participants or 3.3%
worked 30 to 40 hours per week in their prior job, 8 or 13.3% worked 40 to 50 hours per
week in their prior job, 25 or 41.7% worked 50 to 60 hours per week in their prior job
while 25 or 41.7% worked 60+ hours per week in their prior job. In Group 1, no
participants reported working 30-40 hours per week in their prior principalship compared
to 1 or 3.4% in Group 2. Four or 12.9% of the participants reported working 40 to 50
hours in Group 1 compared to 4 or 13.8% of the Group 2 who reported working 40 to 50
hours per week at their prior principalship. In Group 1, 15 or 48.4% participants reported
working 50 to 60 hours per week at their prior principalship while 9 or 31% from Group 2
reported working 50 to 60 hours per week at their prior principalship. Twelve or 38.7%
of the participants in Group 1 reported working 60+ hours per week in their prior
positions compared to 15 or 51.7% of Group 2. The resulting cross tabulation between
Group 1 and Group 2 for number of hours worked at the prior position returned a chi-
square of 2.770 (p > .05) suggesting that the number of hours worked among the 2
groups was similar. The number of hours worked by the participants in their current
position was similar to the number of hours the participants worked in their prior
position.
41
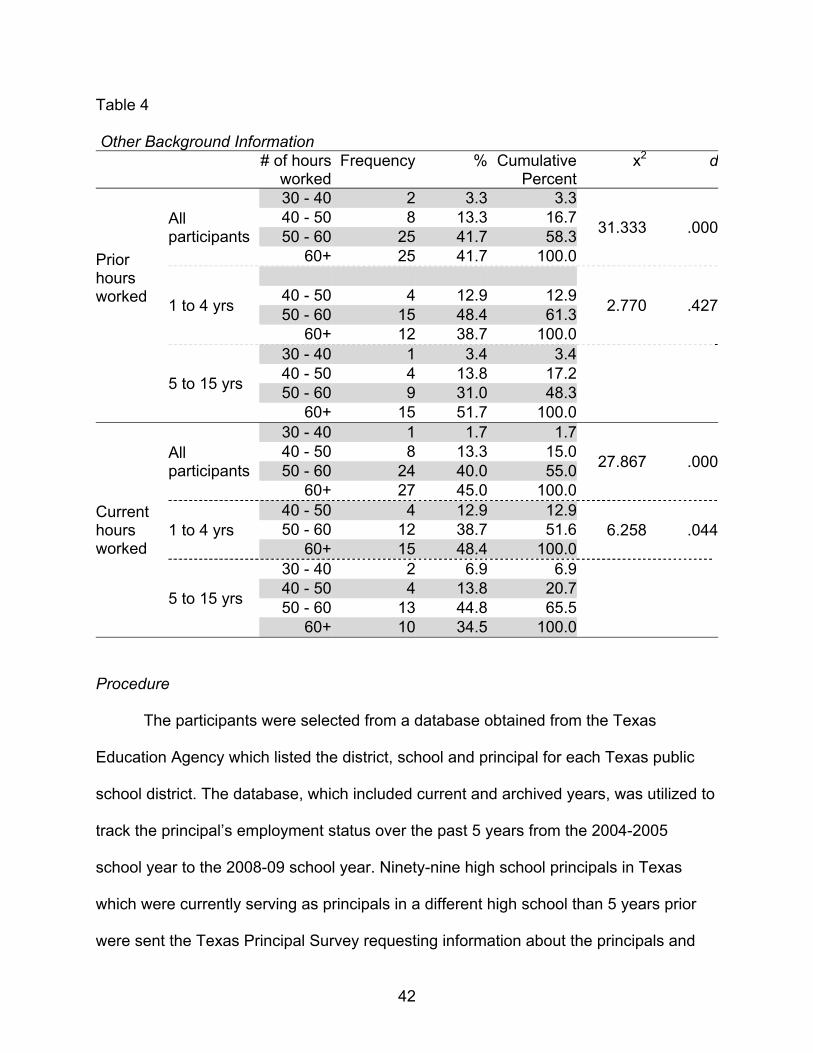
Table 4 Other Background Information
# of hoursworked
Frequency % CumulativePercent
x2 d
Prior hours worked
All participants
30 - 40 2 3.3 3.3
31.333 .00040 - 50 8 13.3 16.750 - 60 25 41.7 58.3
60+ 25 41.7 100.0
1 to 4 yrs 2.770 .42740 - 50 4 12.9 12.950 - 60 15 48.4 61.3
60+ 12 38.7 100.0
5 to 15 yrs
30 - 40 1 3.4 3.440 - 50 4 13.8 17.250 - 60 9 31.0 48.3
60+ 15 51.7 100.0
Current hours worked
All participants
30 - 40 1 1.7 1.7
27.867 .00040 - 50 8 13.3 15.050 - 60 24 40.0 55.0
60+ 27 45.0 100.0
1 to 4 yrs 40 - 50 4 12.9 12.9
6.258 .04450 - 60 12 38.7 51.660+ 15 48.4 100.0
5 to 15 yrs
30 - 40 2 6.9 6.940 - 50 4 13.8 20.750 - 60 13 44.8 65.5
60+ 10 34.5 100.0
Procedure
The participants were selected from a database obtained from the Texas
Education Agency which listed the district, school and principal for each Texas public
school district. The database, which included current and archived years, was utilized to
track the principal’s employment status over the past 5 years from the 2004-2005
school year to the 2008-09 school year. Ninety-nine high school principals in Texas
which were currently serving as principals in a different high school than 5 years prior
were sent the Texas Principal Survey requesting information about the principals and
42
their current and past positions (Appendix A). Each participant’s e-mail address was
entered into a database and participants received the survey electronically through
Survey Monkey which is a web-based survey tool found at www.surveymonkey.com
that allowed the participants to easily and quickly complete and submit the survey
online. The data that were obtained through the electronic survey were input into a
computer statistics program; Statistical Package for School Sciences (SPSS) Version
17.0. Data collected from the Texas Principal’s Survey were utilized to determine the
extent in which the factors included in the study motivated principals to leave their prior
job. Responses from the open ended questions were categorized into themes by 3
educators independently and then analyzed to determine the salient reasons that
principals left their prior position. Responses from the open ended questions were also
analyzed to gain additional information from the high school principals regarding the
least and most rewarding part of being a principal and why they became a principal. The
inter-rater reliability was .94.
A consent notice was included in the email (Appendix B). Data was handled
confidentially and no school name or principals’ were used in the process. A key that
linked participant information to their coded responses was developed using a Microsoft
Excel spreadsheet; that key was destroyed once data collection was completed. No
identifying information was included in any dissemination of data. Sixty (60.6%) of the
identified principals responded to the survey. In order to solicit responses to the survey,
principals who had not responded were sent the survey 4 times over a two week period.
At that point, all principals who had not responded were contacted by phone requesting
43
their participation. The survey was then sent 2 more times in attempts to gain additional
responses.
Research Method and Design
This study used a mixed method design to determine the motivating factors that
impacted high school principal turnover and tenure. Qualitative research was used to
“explain, and gain insight and understanding of phenomena through intensive collection
of narrative data” (Gay, 1996, p. 214). Quantitative research was used to “explain,
predict and/or control phenomena through focused collection of numerical data” (Gay,
1996, p. 214). The Texas Principal Survey, which was adapted from the Texas
Superintendent Survey developed by Byrd, Drews and Johnson (2006) was used.
Factors included in the survey are based on Herzberg’s (1968) hygiene factors and
motivators as they relate to job satisfaction or dissatisfaction and Maslow’s hierarchy of
needs (1954) as well as those identified in the literature review as influencing factors on
principal turnover or job satisfaction. The factors include salary, accountability, hours,
job stress, increased instructional responsibilities, changes in student demographics,
lack of support, politics, advancement opportunities and promotion.
Dependent Variable
The dependent variable utilized in this study of high school principals was the
length of tenure. Tenure is defined as the length of time in the position of principal in a
single school. Principals were asked to report the number of years they served in their
current positions during the timeframe of the survey. The principal is defined as the
“school administrator: the head administrator of a school, especially a grade school or
high school” (MSN Encarta, 2009). In this study, the dependent variable was
44
dichotomous, meaning the dependent variable had two values (Hinkle, 2003). The two
values for the dependent variable were 0 and 1.The value of 0 was assigned principals
who were in their prior high school position 1 to 4 years before moving to a different
high school principalship, referred to as Group 1, and a value of 1 was assigned to
principals who were in their prior high school principalship 5 to 15 year before moving to
a different high school principalship, referred to as Group 2. For the purposes of this
study, the dependent variable was referred to as “turnover.”
Independent Variables
Independent variables included motivating factors identified as possible
influences of principal tenure such as salary, benefits and compensation, accountability,
hours, job stress, increased instructional responsibilities, changes in student
demographics, lack of support, politics, advancement opportunities and promotion.
Instrumentation
The instrument used in this study was the 3-part self-administered Texas
Principal Survey (TPS). A self administered survey is a survey completed by
participants in the absence of an investigator (Mitchell & Jolley, 2004). The TPS was
adapted from the Texas Superintendent Survey (TSS), which was developed by Byrd,
Drews and Johnson (2006). Additional items on the questionnaire were developed
based upon a thorough review of the literature. In the development phase a group of
university professors and current, nonparticipating principals reviewed the survey and
made suggestions that enhanced content validity. This group consisted of 5 principals
and 3 university professors. Four members were males and 4 were females. One male
held a Ph.D. and 2 of the females held an Ed.D. The remaining members of the group
45

held an M.Ed. The adapted and revised TPS was piloted by 105 principals in Texas who
did not participate in the study to determine validity and reliability.
The first part of the survey was designed to gather background information about
the following: 2008 accountability rating, age of principal, ethnicity, gender, salary
range, level of education, certification and preparation program. The second section
contained questions pertaining to the principalship including how prepared the
participants were for the principalship, the principal’s career aspirations, influences on
the principal’s decision to become a principal, and how many years the participants
served in their current position. A 5 point Likert scale ranging from 1 = no influence, 2 =
of little influence, 3 = moderately influential, 4 = influential and 5= very influential was
utilized in Section 2 requesting participants to rate the influence of factors on their
decision to become a principal. The third section of the survey requested information
about the principal’s prior principal position. This information included the number of
years at the principal’s prior positions, size and location of prior school, and factors
which motivated the principal to change schools. A 4 point Likert scale was used for
participants to rate the influence of the factors on their decision to change schools. The
scale ranged from 1 = not at all, 2 = very little, 3 = to some extent, and 4 = to a great
extent. Similar to the interviews conducted by Herzberg et al., 4 open-ended questions
were included in this study in order to gain information regarding the least rewarding
and most rewarding part of being a principal, why participants became a principal and
why participants left their prior principalship.
46
Data Analysis
Quantitative
Descriptive statistics and binary logistic regression were utilized to examine the
data from the quantitative section of the survey. Descriptive statistics were used to
present simple quantitative descriptions of the data. Logistic regression contends with
the relationships among the variables, with one predictor being the dichotomous
dependent variable while the other variables are independent or predictor variables
(Huck, 2000) Binary logistic regression was utilized to predict the probability of the
outcome for each of the predictor variables or in this study the probability that a principal
left their prior position due to each variable.
Qualitative
A qualitative study uses non-numerical data to answer a research question,
typically through interviews, written responses, records, pictures or observed behavior
(Christensen, 2001). Qualitative research, defined broadly, means "any kind of research
that produces findings not arrived at by means of statistical procedures or other means
of quantification" (Strauss & Corbin, 1990, p. 17) and instead, the type of research that
produces findings derived from real-world settings where the "phenomenon of interest
unfold naturally" (Patton, 2001, p. 39). For the qualitative portion of the survey, open
ended questions were utilized which asked the principal why they became a principal,
the most and least rewarding part of becoming a principal and why they left their prior
position. The responses gathered from each principal were analyzed for themes or
patterns.
47
The responses were categorized by 3 educators for inter-rater reliability. The
educators were provided a brief training over the process and were provided an
example. The educators categorized the themes independently, then were brought
together to gain consensus on differing themes. While obtaining consensus among
raters increases the likelihood of yielding credible findings, the interpretations from the
educators might differ from the authentic interpretations of the participants from the
study; therefore the analysis of the data may contain subjective bias (Morse, 1997). The
themes were then given a code and the educators categorized the responses into the
themes by coding the responses to the appropriate theme. Inter-rater reliability was .94.
Summary
The purpose of Chapter III was to discuss the methods utilized to determine
motivating factors associated with principal tenure and turnover. In sum, for selecting
participants, generating data and analyzing data, the following steps were taken:
1. Participants were selected utilizing a Texas state database containing current
and archived employment status.
2. Descriptive statistics were used to generate data regarding demographic and
background information with reference to the participants.
3. Data were gathered utilizing the edited and revised TPS and manipulated
through SPSS.
4. Data were analyzed through a mixed method design using binary logistic
regression and open ended questions.
48
CHAPTER IV
ANALYSIS
The purpose of the present study was to determine factors that impact tenure
and turnover of high school principals in the state of Texas. This study examined the
effects of 10 variables on principal turnover during a 5 year period. Univariate analysis
was utilized to describe the 10 variables. A point bi-serial correlation was conducted to
determine the strength of the relationship between each of the variables included in the
study. Ratings by participants on the variables were reported and a t-test for
independent samples was conducted to determine mean differences. Binary logistic
regression was the mode of analysis used in this study. Eleven tables and 4 figures are
included in Chapter IV.
Univariate and Bivarate Analysis
Univariate Analysis Univariate analysis was utilized to describe each predictor variable. Table 5
provides descriptive statistics for the variables examined in the study. Among the
variables examined, the largest means were associated with advancement opportunities
with a mean of 2.55 (SD = 1.20) and salary and compensation with a mean of 2.37 (SD
= 1.12). Demographic and economic changes in students had the lowest average mean
of 1.62 (SD = 0.83) suggesting changes in students had the least amount of influence
on principal turnover in relation to the remaining variables. Skewness and kurtosis
indicate how the distribution of the variables deviates from a normal distribution (Park,
2008). Values of zero indicate normal distribution of data for kurtosis and skewness. As
the data move farther away from zero, the data are more likely to be farther away from
the normal distribution. A normal skew is symmetrical and the values of the mean,
49
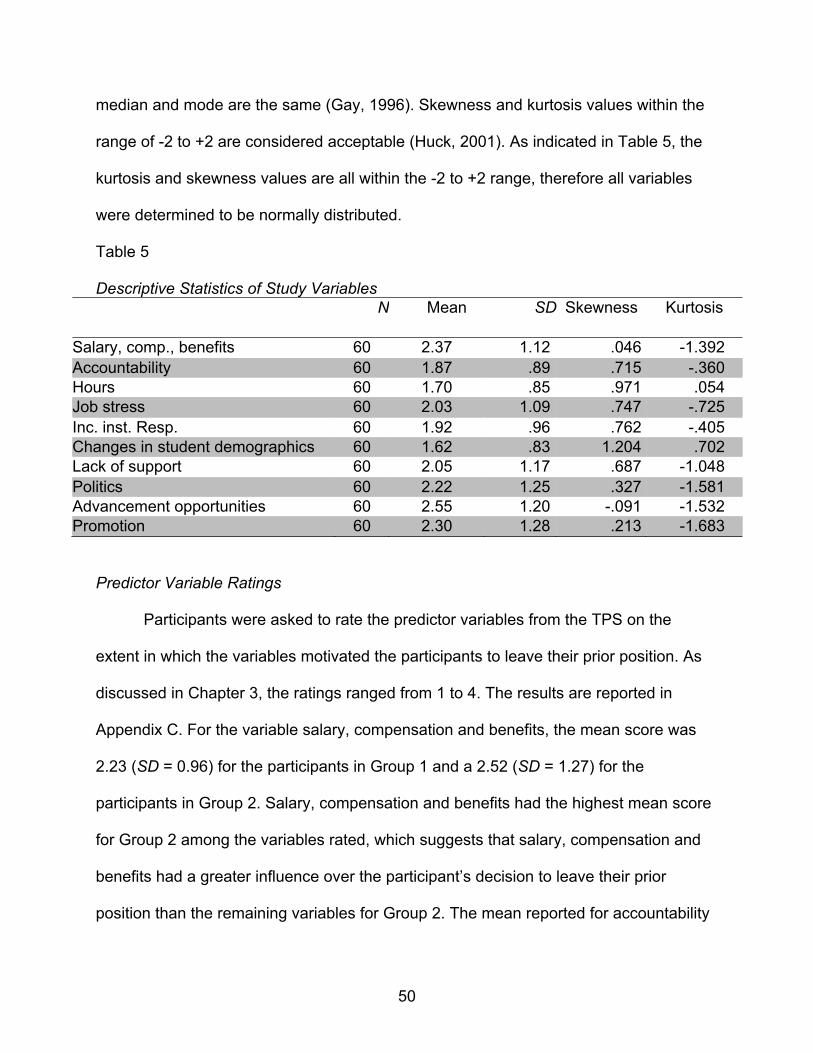
median and mode are the same (Gay, 1996). Skewness and kurtosis values within the
range of -2 to +2 are considered acceptable (Huck, 2001). As indicated in Table 5, the
kurtosis and skewness values are all within the -2 to +2 range, therefore all variables
were determined to be normally distributed.
Table 5 Descriptive Statistics of Study Variables
N Mean SD Skewness Kurtosis
Salary, comp., benefits 60 2.37 1.12 .046 -1.392 Accountability 60 1.87 .89 .715 -.360 Hours 60 1.70 .85 .971 .054 Job stress 60 2.03 1.09 .747 -.725 Inc. inst. Resp. 60 1.92 .96 .762 -.405 Changes in student demographics 60 1.62 .83 1.204 .702 Lack of support 60 2.05 1.17 .687 -1.048 Politics 60 2.22 1.25 .327 -1.581 Advancement opportunities 60 2.55 1.20 -.091 -1.532 Promotion 60 2.30 1.28 .213 -1.683
Predictor Variable Ratings
Participants were asked to rate the predictor variables from the TPS on the
extent in which the variables motivated the participants to leave their prior position. As
discussed in Chapter 3, the ratings ranged from 1 to 4. The results are reported in
Appendix C. For the variable salary, compensation and benefits, the mean score was
2.23 (SD = 0.96) for the participants in Group 1 and a 2.52 (SD = 1.27) for the
participants in Group 2. Salary, compensation and benefits had the highest mean score
for Group 2 among the variables rated, which suggests that salary, compensation and
benefits had a greater influence over the participant’s decision to leave their prior
position than the remaining variables for Group 2. The mean reported for accountability
50
was 2.10 (SD = 0.98) for Group 1 compared to 1.62 (SD = 0.73) for the Group 2. The
mean results regarding the number of hours worked was similar for both groups with a
mean of 1.77 (SD = 0.92) for Group 1 and a mean of 1.62 (SD = 0.78) for Group 2. The
average rating for job stress among Group 1 was 2.23 (SD = 1.20) compared to 1.83
(SD = 0.93) among Group 2. The mean for increased instructional responsibilities was
2.02 (SD = 1.08) for the participants in Group 1 and 1.79 (SD = 0.82) for the participants
in Group 2. The participants in both groups rated changes in student demographics the
lowest as to the extent in which it motivated the participants to change positions with a
mean of 1.68 (SD = 0.83) for Group 1 and 1.55 (SD = 0.83) for Group 2 which suggests
that changes in student demographics had the least influence on the participant’s
decision to leave their prior position. Lack of support had a mean of 2.39 (SD = 1.28) for
Group 1 and a lower mean for Group 2 at 1.69 (SD = 0.93). The variable politics had a
mean of 2.45 (SD = 1.23) for Group 1 and a mean of 1.97 (SD = 1.24) for Group 2. The
participants in Group 1 rated advancement opportunities the highest with a mean of
2.97 (SD = 1.26), suggesting that advancement opportunities had a greater influence on
the participant’s decision to leave their prior position than the other variables rated for
group 1. For Group 2, the mean was 2.10 (SD = 1.08) for the variable advancement
opportunities. Promotion returned a mean of 2.55 (SD = 1.26) for Group 1 and 2.03 (SD
= 1.27) for Group 2.
A crosstab with a Pearson chi-square test was used to determine the relationship
between the 10 predictor variables and the dichotomous variable, turnover. The
purpose of a Pearson chi-square test is to analyze categorical or dichotomous data
(Gall et al., 1996). As indicated in Appendix C, 3 of the predictor variables, salary,
51

compensation and benefits, promotion and advancement opportunities, returned p
values less than .05. The remaining predictor variables had p values greater than .05
and therefore could have been excluded in the logistic regression analysis. However,
they were included in the model based on theoretical and practical considerations
(Norŭsis, 2006).
Bivariate Analysis
A point bi-serial correlation analysis was conducted to determine the strength of
relationship between each of the variables included in the study. Point bi-serial
correlations are employed when one variable is dichotomous and a second variable is
continuous. Point bi-serial values range between -1.00 to +1.00 (Varma, nd.). A value
close to 0 indicates that there is no relationship between the two variables while values
closer to +1 and -1 indicate a strong positive (+1) or strong inverse (-1) relationship. In
the current study, point bi-serial values ranged from -.227 to +.363. The results
displayed in Table 6 show that statistically significant correlations ranged from rpb =
.269 (p < .05) between turnover and accountability and rpb = .300 (p < .05) between
turnover and lack of support to rpb = .363 (p < .05) between turnover and advancement
opportunities. A desirable point bi-serial correlation is +.20 and up, which indicates that
the statistically significant correlations are good, but considered small. The effect size,
which is calculated by squaring the rpb for turnover and accountability was .072,
indicating that accountability explained approximately 7% of the variance in principal
turnover. The effect size for turnover and lack of support was .09, indicating that lack of
support explained approximately 9% of the variance in principal turnover. For turnover
and advancement opportunities, the effect size was .131, indicating that advancement
52
opportunities explained 13% of the variance in principal turnover. Effect sizes ranging
between 1% and 8% are considered small sized effects, effect sizes ranging between
9% and 24% are considered medium sized effects while effect sizes above 25% are
considered high (Valentine & Cooper, 2003).
53

Table 6 Point Bi-Serial Correlations for the Ten Predictor Variables and the Dichotomous Variable
S A H JS IR C LS P AD PR T
Salary (S) 1.00
Accountability (A) .203 1.00
Hours spent (H) .082 .237 1.00
Job stress (JS) -.121 .214 .469** 1.00
Inc. inst. resp. (IR) .108 .461** .363** .424** 1.00
changes in student dem. (C) -.010 .344** .075 .335** .301** 1.00
lack of support (LS)
-.208 .185 .254 .557** .154 .283* 1.00
Politics (P) -.227 .118 .206 .568** .255* .263* .653** 1.00
Advancement opportunities (AD)
.289* .434* .082 -.001 .290* -.109 -.020 -.058 1.00
Promotion (PR) .383** .273 .224 .056 .186 .130 .203 .190 . 620** 1.00
Turnover (T) .131 .269* -.091 .184 .125 .077 .300* .196 .363* .202 1.00
N = 60; *p < .05 (two-tailed); **p < .01 (two-tailed)
54

Independent Samples t-test
A t-test for independent samples was conducted to determine if statistically
significant mean differences existed between Group 1 and Group 2 for each of the 10
variables. As indicated in Appendix C and Table 7, there was a significant difference in
the scores for Group 1 (M = 2.10, SD = 0.98) and Group 2 (M = 1.62, SD = 0.73) for the
variable accountability; t(58) = 2.127, p = .038. For the variable lack of support, there
was a significant mean difference in the scores of Group 1 (M = 2.39, SD = .1.28) and
Group 2 (M = 1.69, SD = 0.93); t(54.683) = 2.423, p = .019. The mean difference for the
variable advancement opportunities for Group 1 (M = 2.92, SD = 1.17) and Group 2 (M
= 2.10, SD = 1.08) was significant t (58) = 2.969, p = .004. No statistically significant
mean difference was found for the remaining 7 variables. The statistically significant
mean difference for the variables accountability, lack of support and advancement
opportunities suggests that these variables had a greater than expected influence on
the Group 1 participant’s decision to leave their prior principalship. A plausible
explanation for the results would be that the participants in Group 1 had not yet satisfied
level 4 esteem needs on Maslow’s hierarchy of needs and were still seeking attention,
recognition and autonomy.
55
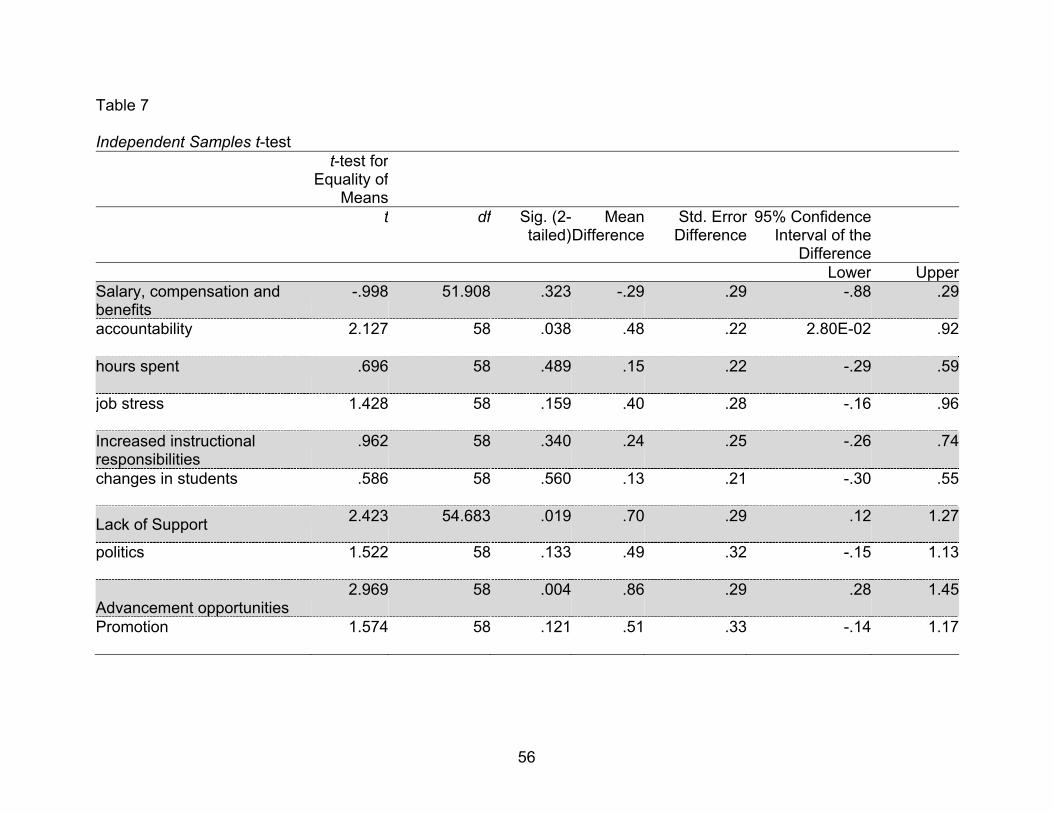
Table 7
Independent Samples t-test t-test for
Equality of Means
t df Sig. (2-tailed)
Mean Difference
Std. Error Difference
95% Confidence Interval of the
DifferenceLower Upper
Salary, compensation and benefits
-.998 51.908 .323 -.29 .29 -.88 .29
accountability
2.127 58 .038 .48 .22 2.80E-02 .92
hours spent
.696 58 .489 .15 .22 -.29 .59
job stress
1.428 58 .159 .40 .28 -.16 .96
Increased instructional responsibilities
.962 58 .340 .24 .25 -.26 .74
changes in students
.586 58 .560 .13 .21 -.30 .55
Lack of Support 2.423 54.683 .019 .70 .29 .12 1.27
politics
1.522 58 .133 .49 .32 -.15 1.13
Advancement opportunities
2.969 58 .004 .86 .29 .28 1.45
Promotion
1.574 58 .121 .51 .33 -.14 1.17
56
Logistic Regression
A binary logistic regression model was used to predict or explain the discrete
outcome from a set of predictor variables and a dichotomous variable (Tabachnick &
Fidell, 2000). Logistic regression contends with the relationships among the variables,
with the dichotomous predictor being the dependent variables while the other variables
are independent or predictor variables (Huck, 2000).
The null model included 60 cases. In the null model, the percentage of cases
predicted correctly was 51.7%. In the full model, which included the predictor variables,
the overall accuracy increased to 78.3% with 80.6% of Group 1 and 75.9% of Group 2
predicted accurately, as reported in Table 8. The data indicate that the model classified
78.3% of the cases correctly. However; as noted by Norŭsis (2006):
The percentage of cases correctly classified is a poor indicator of model fit, since It does not necessarily depend on how well a model fits. It ignores the actual probability values, replacing them with a cutoff value. It’s also possible to add a highly significant variable to the model and have the correct classification rate decrease. (p. 344) Table 8 assessed the performance of the model by cross tabulating the observed
response categories with the predicted response categories. The observed column
indicates the number of participants from Group 1 and Group 2 that are observed in the
dependent variable. The predicted column indicates the predicted values of the
dependent variable (Group 1 or Group 2) based on the full logistic regression model
(Annotated Stata Output: Logistic Regression). The sensitivity for the participants was
high, with 25 out of 31 participants from Group 1 predicted correctly with a sensitivity of
80.6% [25 / (25 + 6)]. The sensitivity refers to the proportion of actual events that are
correctly identified as such (Peng, Lee & Ingersoll, 2002). The specificity was also high,
57
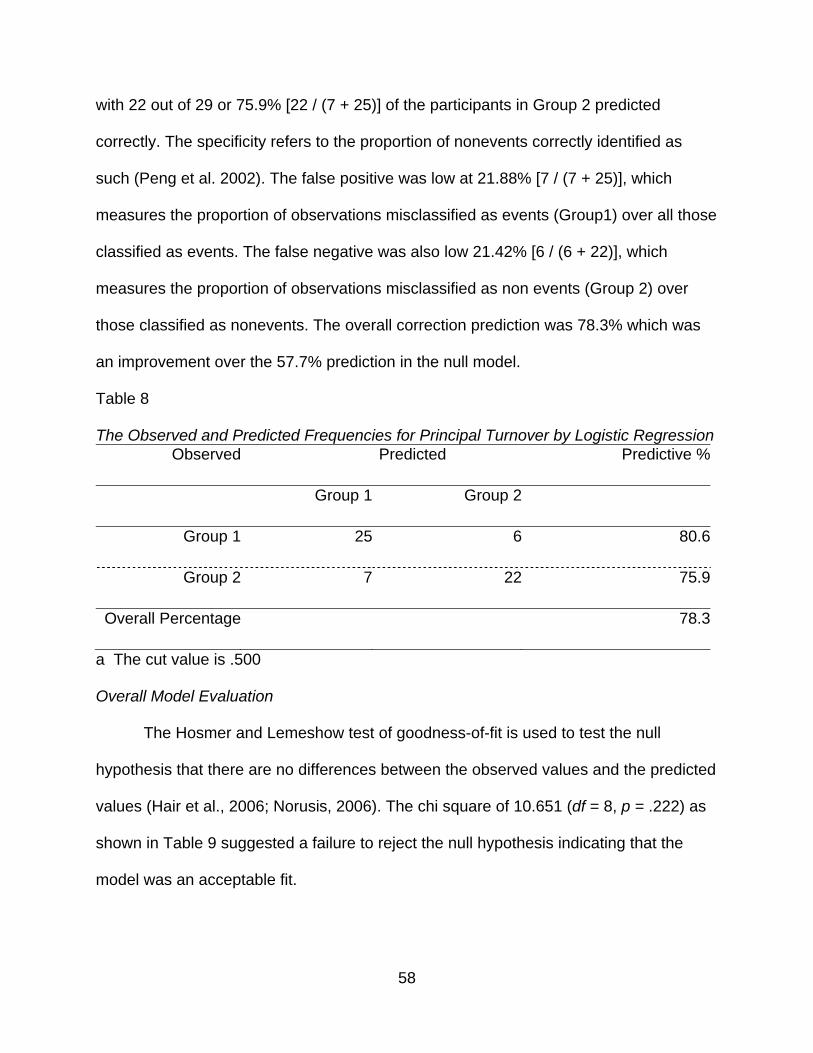
with 22 out of 29 or 75.9% [22 / (7 + 25)] of the participants in Group 2 predicted
correctly. The specificity refers to the proportion of nonevents correctly identified as
such (Peng et al. 2002). The false positive was low at 21.88% [7 / (7 + 25)], which
measures the proportion of observations misclassified as events (Group1) over all those
classified as events. The false negative was also low 21.42% [6 / (6 + 22)], which
measures the proportion of observations misclassified as non events (Group 2) over
those classified as nonevents. The overall correction prediction was 78.3% which was
an improvement over the 57.7% prediction in the null model.
Table 8 The Observed and Predicted Frequencies for Principal Turnover by Logistic Regression
Observed Predicted Predictive %
Group 1 Group 2
Group 1 25 6 80.6
Group 2 7 22 75.9
Overall Percentage 78.3
a The cut value is .500 Overall Model Evaluation
The Hosmer and Lemeshow test of goodness-of-fit is used to test the null
hypothesis that there are no differences between the observed values and the predicted
values (Hair et al., 2006; Norusis, 2006). The chi square of 10.651 (df = 8, p = .222) as
shown in Table 9 suggested a failure to reject the null hypothesis indicating that the
model was an acceptable fit.
58

Statistical Tests of Individual Predictors
A Wald statistic was used to measure each variable. The ratio of the coefficient
(B) to S.E., squared, equals the Wald statistic (Center for Family and Demographic
Research, 2006). If the Wald statistic is less than .05, then the parameter is useful to
the model.
As indicated in Table 9, two of the ten predictor variables were statistically
significant: salary, compensation and benefits and advancement opportunities. The
remaining 8 variables were not statistically significant (p > .05). Salary, compensation
and benefits was found to be a significant predictor variable for principal turnover with p
= .045. The Exp(B) or odds ratio of 2.14, which is an exponentiation of the B coefficient,
was used to predict the change in odds for a unit increase in salary, benefits and
compensation. When Exp(B) is greater than 1, increasing values of the variable salary,
benefits and compensation correspond to increasing odds of the occurrence of turnover
(Center of Family and Demographic Research, 2006). The odds of participants from
Group 2 leaving their principalship due to salary was 2.14 (Exp(B) = 2.14) times more
than for participants in group 1. This can also be interpreted as a one-unit change in
salary, compensation and benefits would increase the odds of principal turnover by a
multiple of 2.14 or 114% (Exp(B -1 x 100 or 2.139 - 1 x 100) for principals in Group 2
over principals in Group 1 (Pampel, 2000). In examining the 95% confidence interval,
the risk of turnover due to salary, compensation and benefits ranged from 1.019 to
4.490 times greater for participants in Group 2 than Group 1. With 95% confidence, a
one-unit change in the predictor variable salary, compensation and benefits would
increase the odds of principal turnover, holding all other predictor variable constant
59
(Garson, 2006a). Herzberg (1959) theory provides a plausible explanation for this result
in that salary is a hygiene factor. Hygiene factors can cause dissatisfaction; therefore, if
participants in Group 2 did not feel that they were provided appropriate raises or
compensated well for their work the longer they remained in their position, the
participants would become dissatisfied with their salary and seek positions with higher
salaries.
The variable advancement opportunities was statistically significant (p = .041).
When Exp(B) is less than 1, increasing values of the variable correspond to decreasing
odds of the event’s occurrence (Center of Family and Demographic Research, 2006). A
one unit change in advancement opportunities would decrease the odds of principal
turnover by a multiple of .44 (Exp(B) = .441) or 56% (.441 - 1 x 100) for principals in
Group 2 over principals in Group 1. In examining the 95% confidence interval the risk of
turnover due to advancement opportunities for Group 2 was .20 to .97 times less than
Group 1. With 95% confidence a one-unit change in the value of the independent
variable advancement opportunities would decrease the odds of the principal turnover,
holding all other independent variables constant (Garson, 2006a). A plausible
explanation for this result would be that participants from Group 2 had reached level 5
(self-actualization) of Maslow’s hierarchy and were self-fulfilled in their position,
whereas participants from Group 1 were on level 4 (esteem) and felt they had not yet
achieved their potential.
60
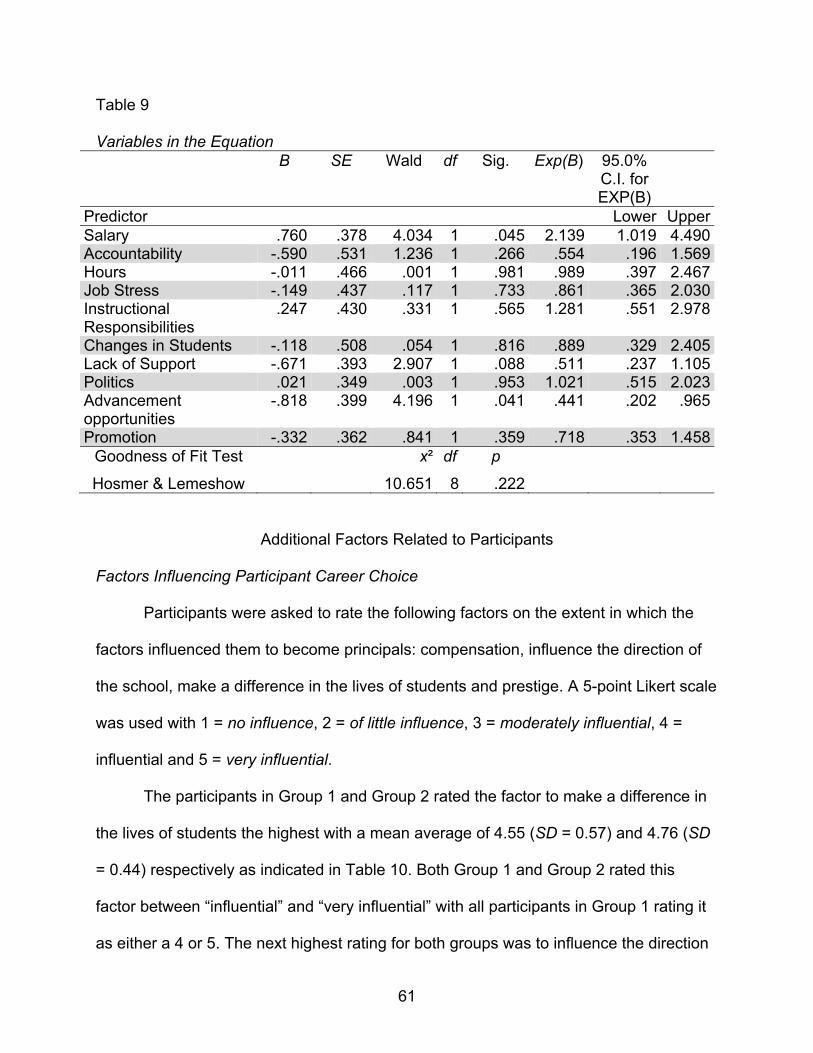
Table 9 Variables in the Equation
B SE Wald df Sig. Exp(B) 95.0% C.I. for EXP(B)
Predictor Lower UpperSalary .760 .378 4.034 1 .045 2.139 1.019 4.490Accountability -.590 .531 1.236 1 .266 .554 .196 1.569Hours -.011 .466 .001 1 .981 .989 .397 2.467Job Stress -.149 .437 .117 1 .733 .861 .365 2.030Instructional Responsibilities
.247 .430 .331 1 .565 1.281 .551 2.978
Changes in Students -.118 .508 .054 1 .816 .889 .329 2.405Lack of Support -.671 .393 2.907 1 .088 .511 .237 1.105Politics .021 .349 .003 1 .953 1.021 .515 2.023Advancement opportunities
-.818 .399 4.196 1 .041 .441 .202 .965
Promotion -.332 .362 .841 1 .359 .718 .353 1.458Goodness of Fit Test x² df p
Hosmer & Lemeshow 10.651 8 .222
Additional Factors Related to Participants
Factors Influencing Participant Career Choice
Participants were asked to rate the following factors on the extent in which the
factors influenced them to become principals: compensation, influence the direction of
the school, make a difference in the lives of students and prestige. A 5-point Likert scale
was used with 1 = no influence, 2 = of little influence, 3 = moderately influential, 4 =
influential and 5 = very influential.
The participants in Group 1 and Group 2 rated the factor to make a difference in
the lives of students the highest with a mean average of 4.55 (SD = 0.57) and 4.76 (SD
= 0.44) respectively as indicated in Table 10. Both Group 1 and Group 2 rated this
factor between “influential” and “very influential” with all participants in Group 1 rating it
as either a 4 or 5. The next highest rating for both groups was to influence the direction
61
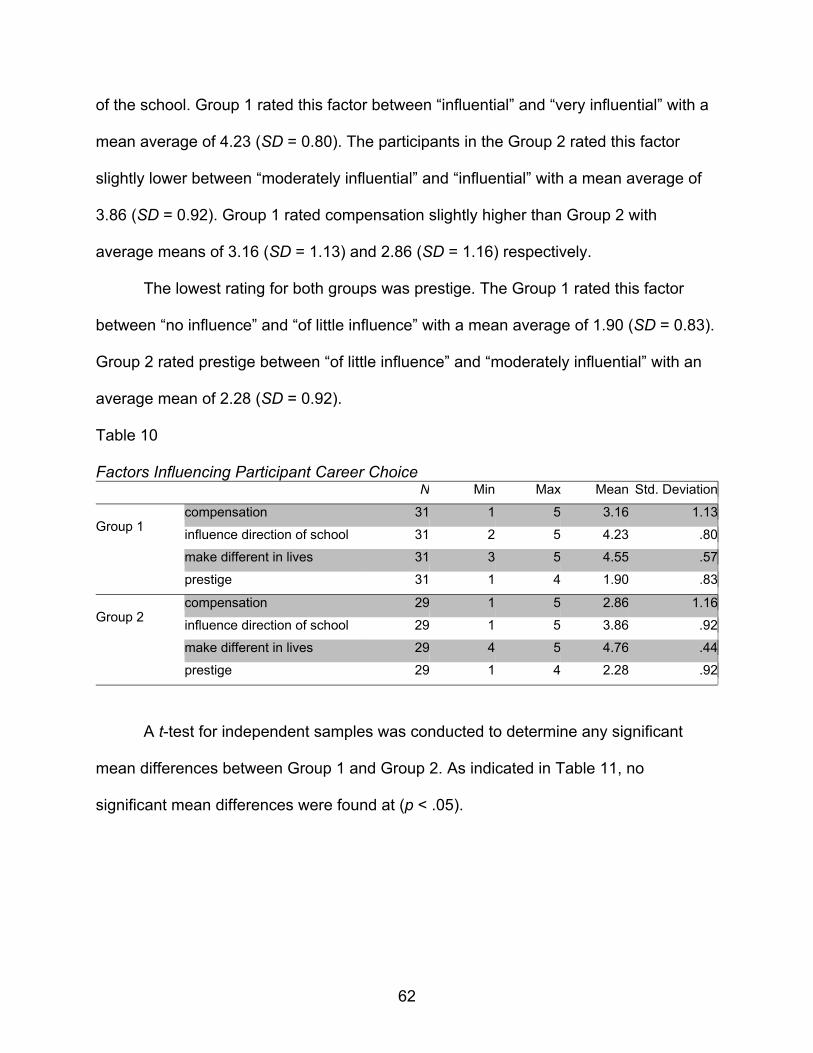
of the school. Group 1 rated this factor between “influential” and “very influential” with a
mean average of 4.23 (SD = 0.80). The participants in the Group 2 rated this factor
slightly lower between “moderately influential” and “influential” with a mean average of
3.86 (SD = 0.92). Group 1 rated compensation slightly higher than Group 2 with
average means of 3.16 (SD = 1.13) and 2.86 (SD = 1.16) respectively.
The lowest rating for both groups was prestige. The Group 1 rated this factor
between “no influence” and “of little influence” with a mean average of 1.90 (SD = 0.83).
Group 2 rated prestige between “of little influence” and “moderately influential” with an
average mean of 2.28 (SD = 0.92).
Table 10
Factors Influencing Participant Career Choice N Min Max Mean Std. Deviation
Group 1
compensation 31 1 5 3.16 1.13
influence direction of school 31 2 5 4.23 .80
make different in lives 31 3 5 4.55 .57
prestige 31 1 4 1.90 .83
Group 2
compensation 29 1 5 2.86 1.16
influence direction of school 29 1 5 3.86 .92
make different in lives 29 4 5 4.76 .44
prestige 29 1 4 2.28 .92
A t-test for independent samples was conducted to determine any significant
mean differences between Group 1 and Group 2. As indicated in Table 11, no
significant mean differences were found at (p < .05).
62
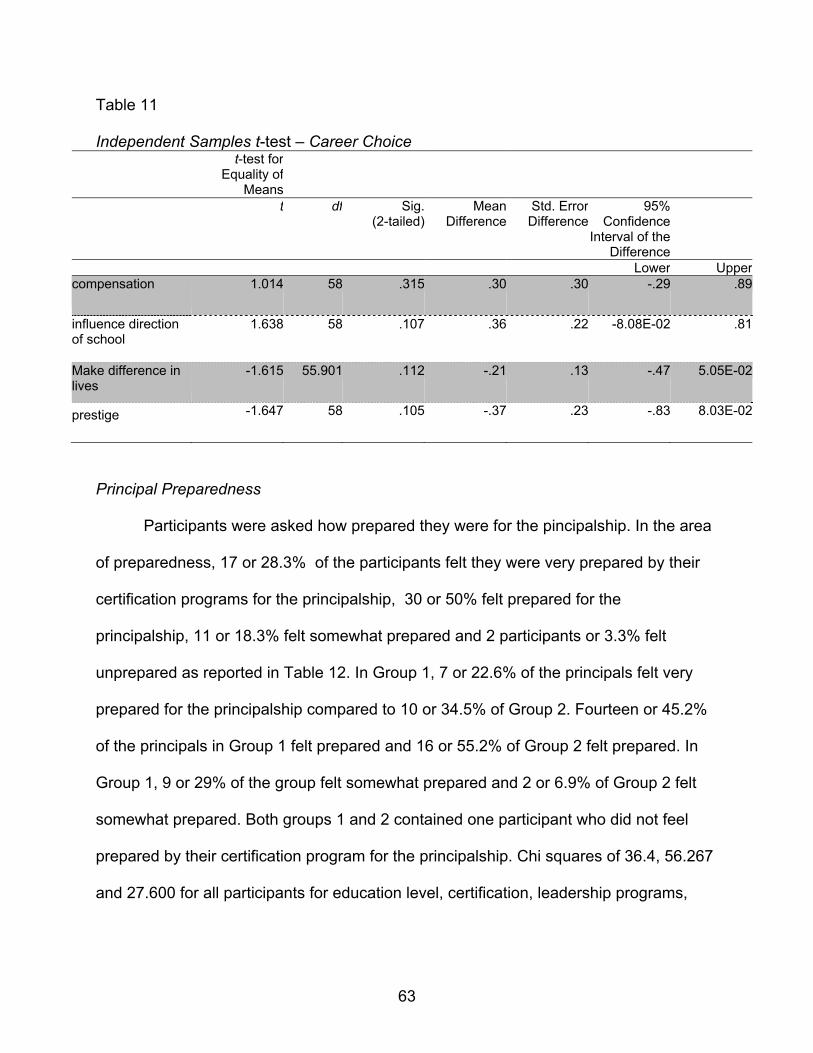
Table 11
Independent Samples t-test – Career Choice t-test for
Equality of Means
t df Sig. (2-tailed)
Mean Difference
Std. ErrorDifference
95% Confidence
Interval of the Difference
Lower Uppercompensation
1.014 58 .315 .30 .30 -.29 .89
influence direction of school
1.638 58 .107 .36 .22 -8.08E-02 .81
Make difference in lives
-1.615 55.901 .112 -.21 .13 -.47 5.05E-02
prestige
-1.647 58 .105 -.37 .23 -.83 8.03E-02
Principal Preparedness
Participants were asked how prepared they were for the pincipalship. In the area
of preparedness, 17 or 28.3% of the participants felt they were very prepared by their
certification programs for the principalship, 30 or 50% felt prepared for the
principalship, 11 or 18.3% felt somewhat prepared and 2 participants or 3.3% felt
unprepared as reported in Table 12. In Group 1, 7 or 22.6% of the principals felt very
prepared for the principalship compared to 10 or 34.5% of Group 2. Fourteen or 45.2%
of the principals in Group 1 felt prepared and 16 or 55.2% of Group 2 felt prepared. In
Group 1, 9 or 29% of the group felt somewhat prepared and 2 or 6.9% of Group 2 felt
somewhat prepared. Both groups 1 and 2 contained one participant who did not feel
prepared by their certification program for the principalship. Chi squares of 36.4, 56.267
and 27.600 for all participants for education level, certification, leadership programs,
63

64
and principal preparedness indicated that the frequencies are not normally distributed
across the categories.
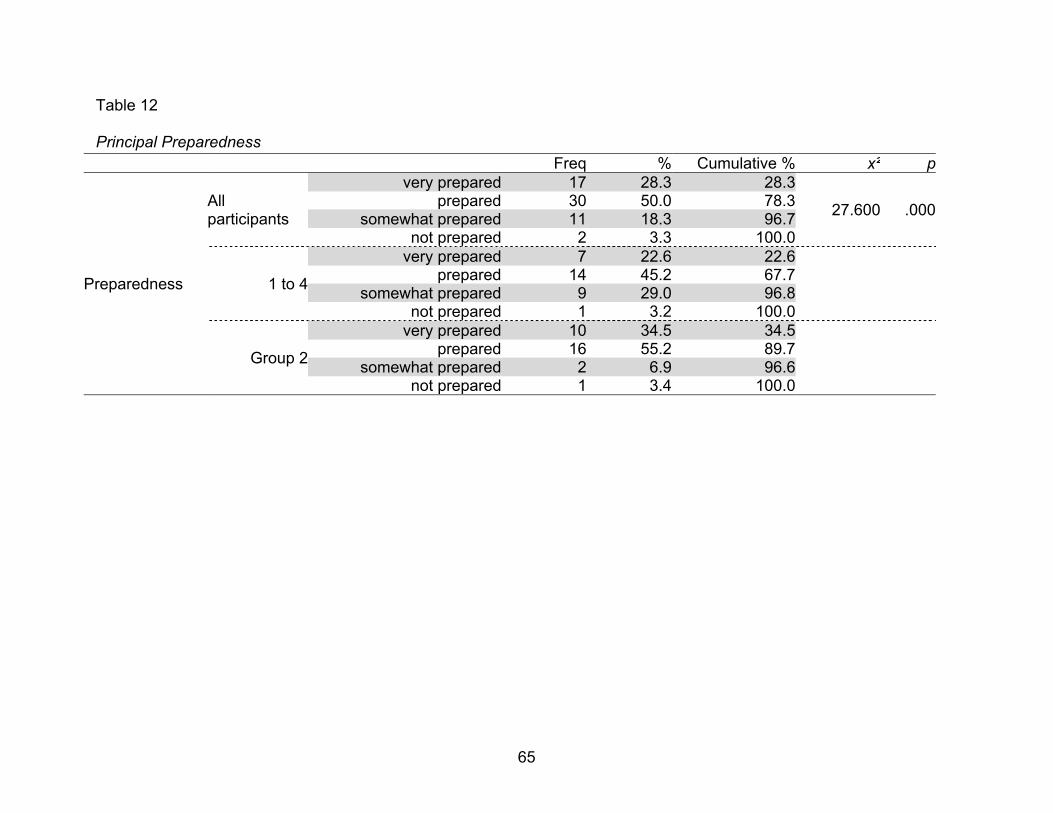
Table 12
Principal Preparedness Freq % Cumulative % x² p
Preparedness
All participants
very prepared 17 28.3 28.3
27.600 .000prepared 30 50.0 78.3somewhat prepared 11 18.3 96.7
not prepared 2 3.3 100.0
1 to 4
very prepared 7 22.6 22.6prepared 14 45.2 67.7
somewhat prepared 9 29.0 96.8not prepared 1 3.2 100.0
Group 2
very prepared 10 34.5 34.5prepared 16 55.2 89.7
somewhat prepared 2 6.9 96.6not prepared 1 3.4 100.0
65
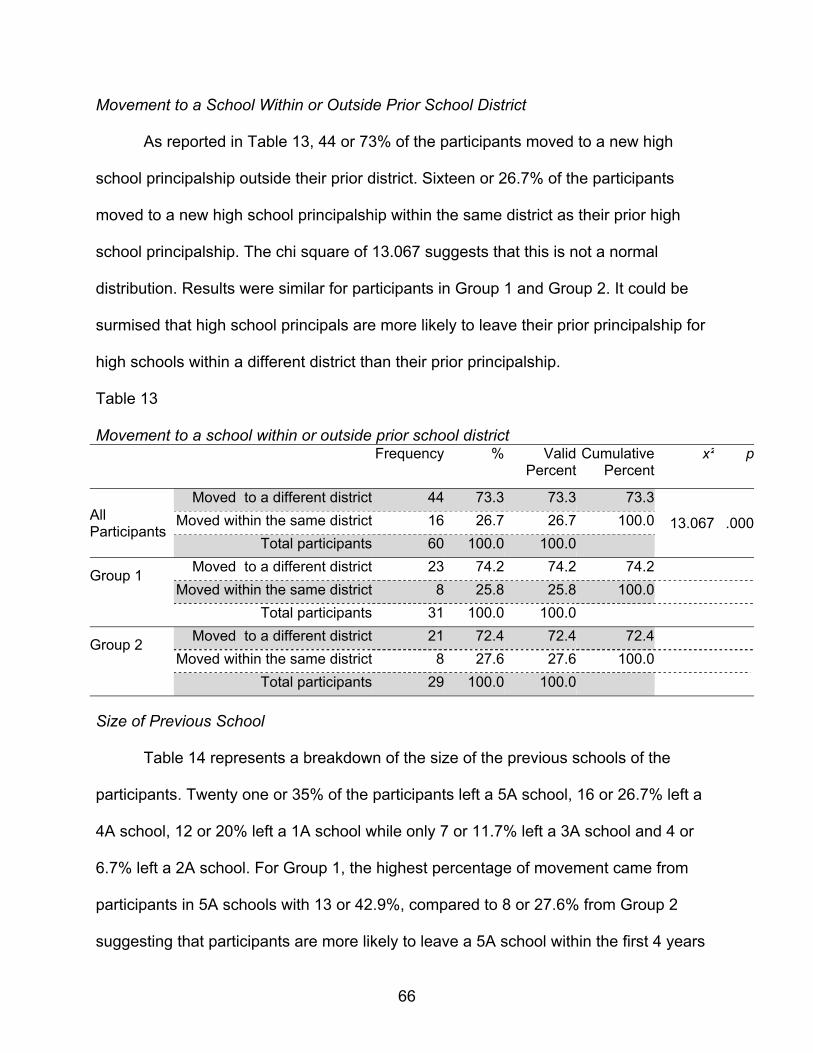
Movement to a School Within or Outside Prior School District
As reported in Table 13, 44 or 73% of the participants moved to a new high
school principalship outside their prior district. Sixteen or 26.7% of the participants
moved to a new high school principalship within the same district as their prior high
school principalship. The chi square of 13.067 suggests that this is not a normal
distribution. Results were similar for participants in Group 1 and Group 2. It could be
surmised that high school principals are more likely to leave their prior principalship for
high schools within a different district than their prior principalship.
Table 13
Movement to a school within or outside prior school district Frequency % Valid
PercentCumulative
Percentx² p
All Participants
Moved to a different district 44 73.3 73.3 73.3
13.067 .000Moved within the same district 16 26.7 26.7 100.0Total participants 60 100.0 100.0
Group 1
Moved to a different district 23 74.2 74.2 74.2Moved within the same district 8 25.8 25.8 100.0
Total participants 31 100.0 100.0
Group 2
Moved to a different district 21 72.4 72.4 72.4Moved within the same district 8 27.6 27.6 100.0
Total participants 29 100.0 100.0 Size of Previous School
Table 14 represents a breakdown of the size of the previous schools of the
participants. Twenty one or 35% of the participants left a 5A school, 16 or 26.7% left a
4A school, 12 or 20% left a 1A school while only 7 or 11.7% left a 3A school and 4 or
6.7% left a 2A school. For Group 1, the highest percentage of movement came from
participants in 5A schools with 13 or 42.9%, compared to 8 or 27.6% from Group 2
suggesting that participants are more likely to leave a 5A school within the first 4 years
66
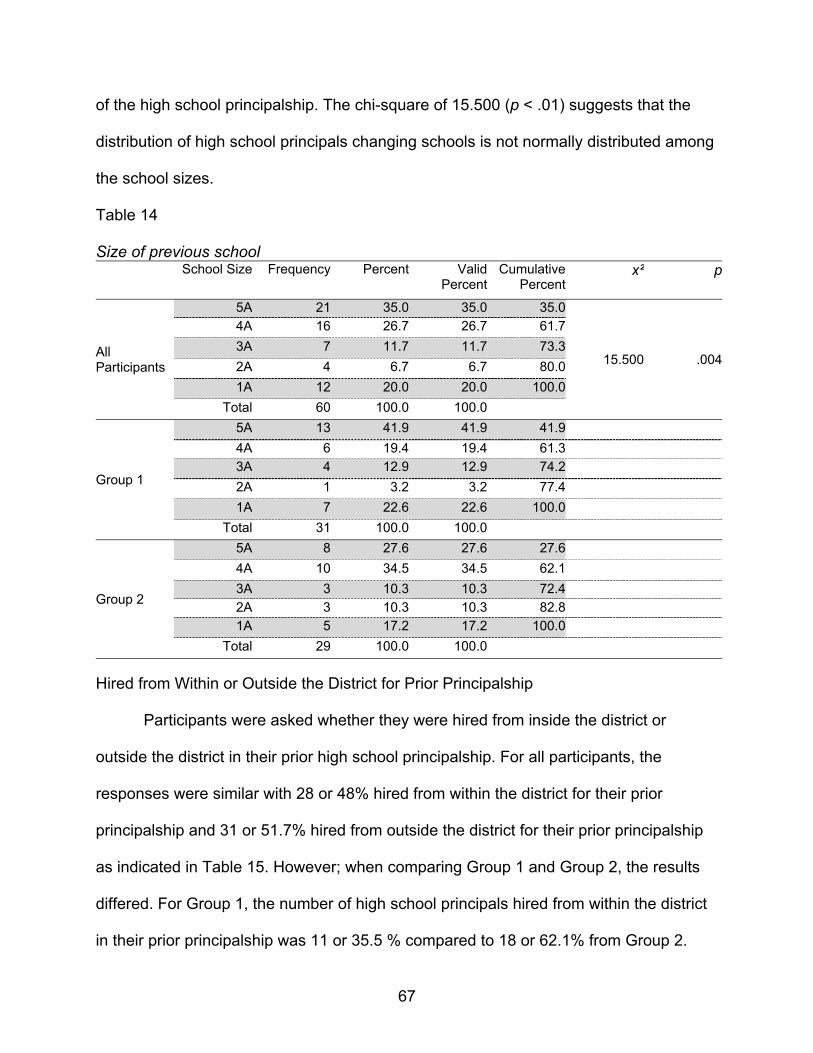
of the high school principalship. The chi-square of 15.500 (p < .01) suggests that the
distribution of high school principals changing schools is not normally distributed among
the school sizes.
Table 14 Size of previous school
School Size Frequency Percent Valid Percent
Cumulative Percent
x² p
All Participants
5A 21 35.0 35.0 35.0
15.500 .004
4A 16 26.7 26.7 61.73A 7 11.7 11.7 73.32A 4 6.7 6.7 80.01A 12 20.0 20.0 100.0
Total 60 100.0 100.0
Group 1
5A 13 41.9 41.9 41.94A 6 19.4 19.4 61.33A 4 12.9 12.9 74.22A 1 3.2 3.2 77.41A 7 22.6 22.6 100.0
Total 31 100.0 100.0
Group 2
5A 8 27.6 27.6 27.64A 10 34.5 34.5 62.13A 3 10.3 10.3 72.42A 3 10.3 10.3 82.81A 5 17.2 17.2 100.0
Total 29 100.0 100.0 Hired from Within or Outside the District for Prior Principalship
Participants were asked whether they were hired from inside the district or
outside the district in their prior high school principalship. For all participants, the
responses were similar with 28 or 48% hired from within the district for their prior
principalship and 31 or 51.7% hired from outside the district for their prior principalship
as indicated in Table 15. However; when comparing Group 1 and Group 2, the results
differed. For Group 1, the number of high school principals hired from within the district
in their prior principalship was 11 or 35.5 % compared to 18 or 62.1% from Group 2.
67

The number of high school principals hired from outside the district for Group 1 was 20
or 64.5% compared to 11 or 37.9% from Group 2. The findings suggest that participants
hired from outside the district are more likely to change high school principal positions
within the first 4 years of the principalship whereas principals hired from within the
district are more likely to change high school principal positions during or after 5 years
in the position. The chi-square of 0.067 (p > .05) implies that the distribution between
participants hired from within or outside the district is a normal distribution.
Table 15 Hired from within or outside the district for prior principalship
Frequency Percent Valid Percent
Cumulative Percent
x² p
All participants
Hired from within 29 48.3 48.3 48.3 .067 .797Hired from outside 31 51.7 51.7 100.0
Total 60 100.0 100.0
Group 1
Hired from within 11 35.5 35.5 35.5Hired from outside 20 64.5 64.5 100.0
Total 31 100.0 100.0
Group 2
Hired from within 18 62.1 62.1 62.1Hired from outside 11 37.9 37.9 100.0
Total 29 100.0 100.0
Open Ended Responses
The TPS contained 4 open ended questions in which the participants were asked
to respond:
1. Why did you become a principal?
2. What is the least rewarding part of being a principal?
3. What is the most rewarding part of being a principal?
4. Why did you leave your prior position?
68
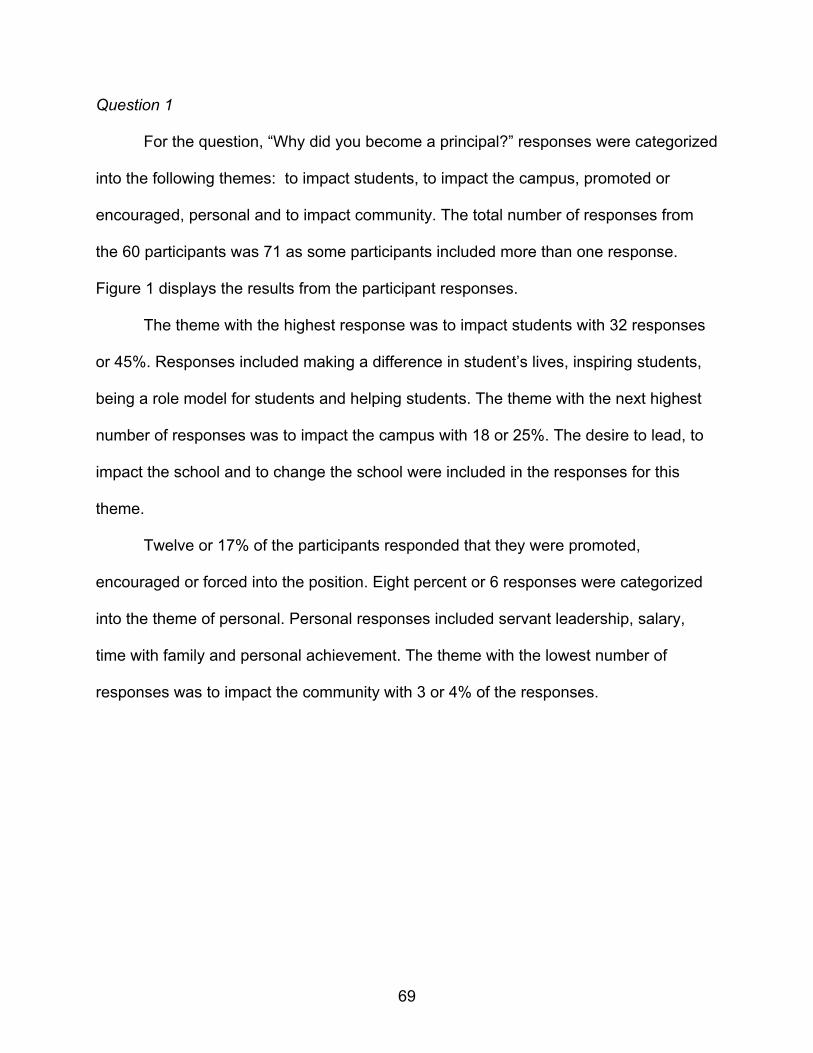
Question 1
For the question, “Why did you become a principal?” responses were categorized
into the following themes: to impact students, to impact the campus, promoted or
encouraged, personal and to impact community. The total number of responses from
the 60 participants was 71 as some participants included more than one response.
Figure 1 displays the results from the participant responses.
The theme with the highest response was to impact students with 32 responses
or 45%. Responses included making a difference in student’s lives, inspiring students,
being a role model for students and helping students. The theme with the next highest
number of responses was to impact the campus with 18 or 25%. The desire to lead, to
impact the school and to change the school were included in the responses for this
theme.
Twelve or 17% of the participants responded that they were promoted,
encouraged or forced into the position. Eight percent or 6 responses were categorized
into the theme of personal. Personal responses included servant leadership, salary,
time with family and personal achievement. The theme with the lowest number of
responses was to impact the community with 3 or 4% of the responses.
69

Figure 1. Why did you become a principal?
Question 2
For the open ended question, “What is the least rewarding part of being a
principal?” 6 themes emerged from the 76 responses: job stressors, parent issues,
issues with other adults, politics and lack of support, testing and accountability, and
student issues. Twenty-one or 28% participants responded that job stressors such as
time requirements, long meetings and emotional stress were the least rewarding parts
of being a principal.
Parent issues including irate parents, cheerleader parents and uncaring parents
comprised 14 or 18% of the total responses as displayed in Figure 2. Thirteen or 17% of
the responses were categorized as issues with other adults. Responses included
terminating staff, dealing with difficult adults and lack of commitment by adults.
70
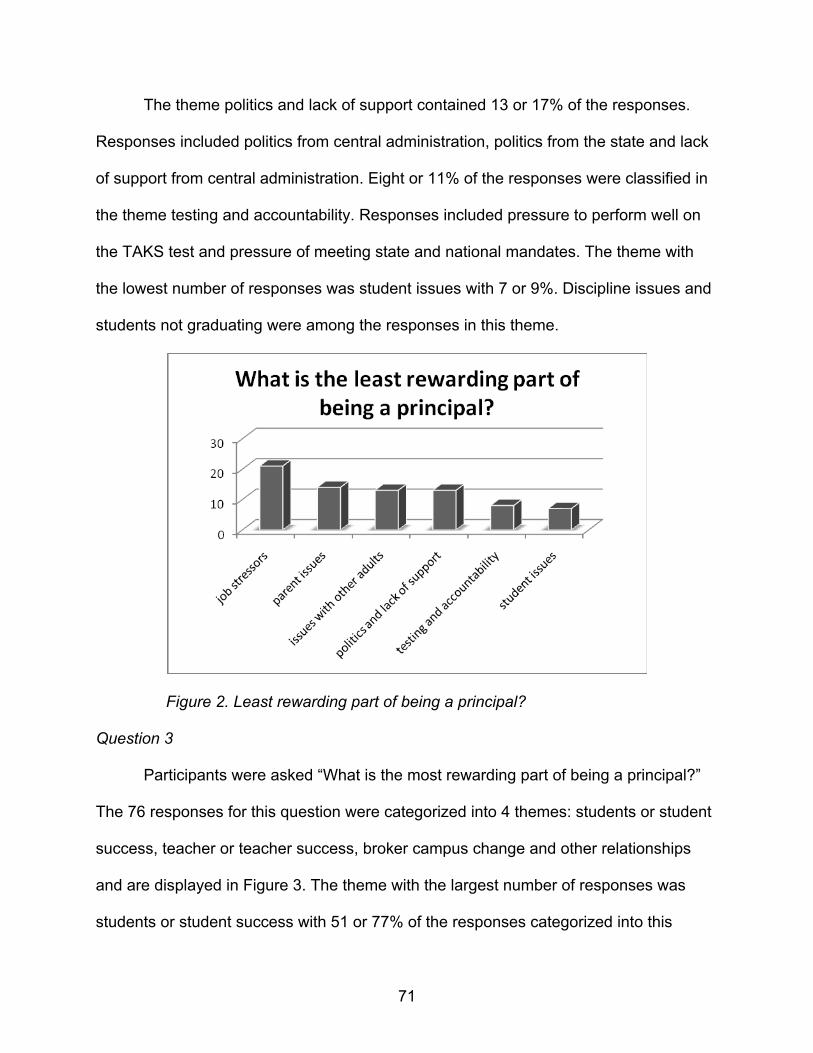
The theme politics and lack of support contained 13 or 17% of the responses.
Responses included politics from central administration, politics from the state and lack
of support from central administration. Eight or 11% of the responses were classified in
the theme testing and accountability. Responses included pressure to perform well on
the TAKS test and pressure of meeting state and national mandates. The theme with
the lowest number of responses was student issues with 7 or 9%. Discipline issues and
students not graduating were among the responses in this theme.
Figure 2. Least rewarding part of being a principal?
Question 3
Participants were asked “What is the most rewarding part of being a principal?”
The 76 responses for this question were categorized into 4 themes: students or student
success, teacher or teacher success, broker campus change and other relationships
and are displayed in Figure 3. The theme with the largest number of responses was
students or student success with 51 or 77% of the responses categorized into this
71
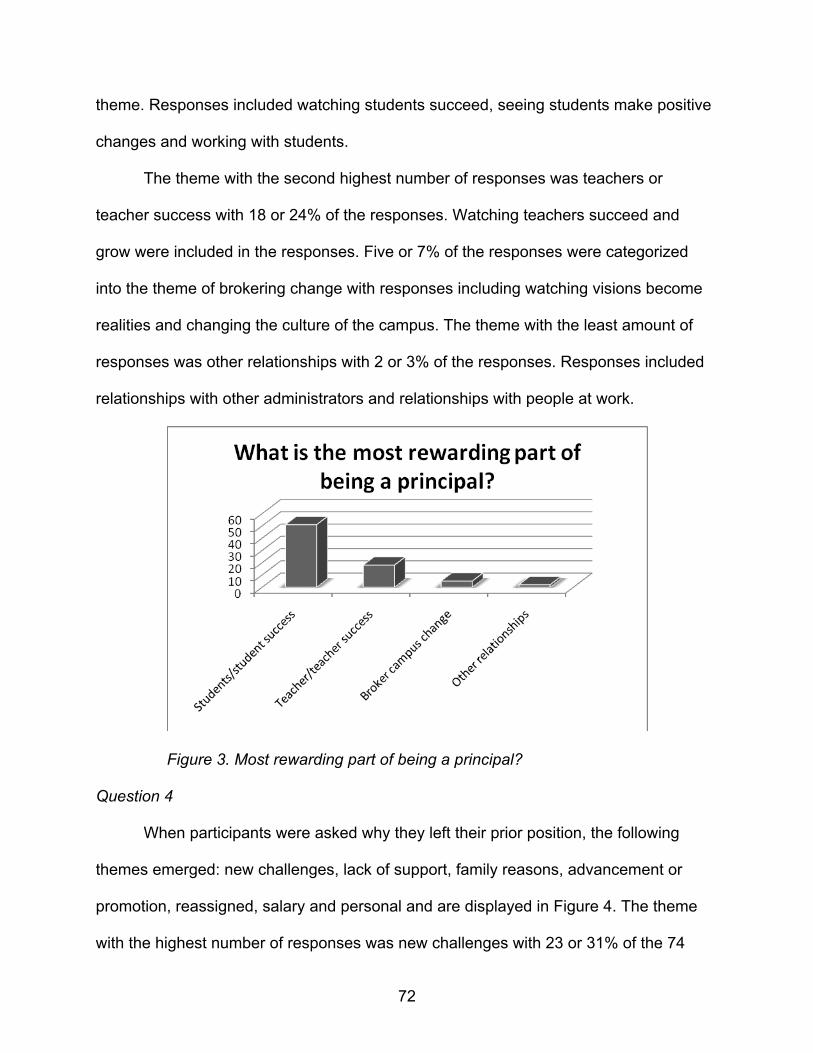
theme. Responses included watching students succeed, seeing students make positive
changes and working with students.
The theme with the second highest number of responses was teachers or
teacher success with 18 or 24% of the responses. Watching teachers succeed and
grow were included in the responses. Five or 7% of the responses were categorized
into the theme of brokering change with responses including watching visions become
realities and changing the culture of the campus. The theme with the least amount of
responses was other relationships with 2 or 3% of the responses. Responses included
relationships with other administrators and relationships with people at work.
Figure 3. Most rewarding part of being a principal?
Question 4
When participants were asked why they left their prior position, the following
themes emerged: new challenges, lack of support, family reasons, advancement or
promotion, reassigned, salary and personal and are displayed in Figure 4. The theme
with the highest number of responses was new challenges with 23 or 31% of the 74
72

responses. Moving to larger districts and change were among the reasons given by the
participants.
The theme with the next highest responses was lack of support with 15 or 20% of
the responses. Among the reasons given by the respondents were: lack of support by
the superintendent, lack of support by central administration and changes in the school
board.
The theme, family reasons, was comprised of 10 or 14% of the responses.
Responses included being closer to family or home, work in the community in which
they lived and that the change was better for their own children. Nine or 12% of the
responses were categorized into the theme of personal. Responses in this theme
included leaving to pursue a degree in higher education, pressures and campus
closure. One respondent stated accountability and testing as the reason for leaving.
The theme, promotion, included 8 or 11% of the responses. Responses included
that respondents were recruited or promoted. Five or 7% of the responses were
categorized into the theme salary. The theme with the fewest responses was
reassignment while 4 or 5% of the respondents stated that they were reassigned.
73
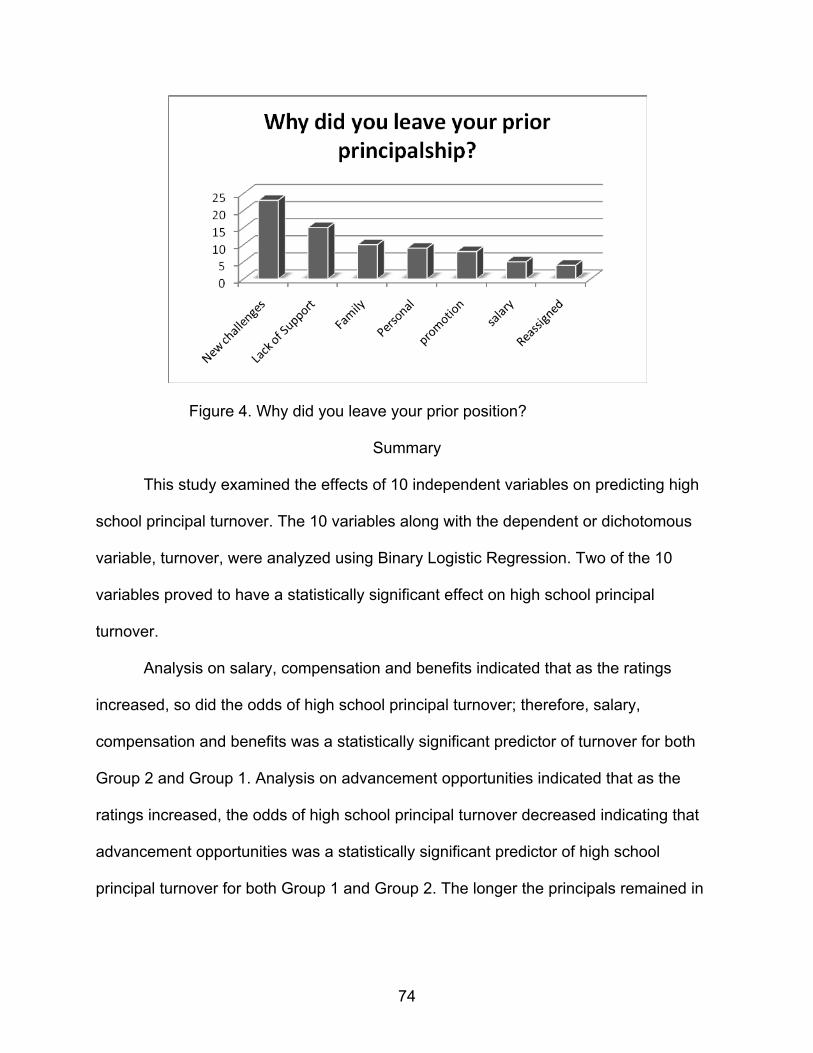
Figure 4. Why did you leave your prior position?
Summary
This study examined the effects of 10 independent variables on predicting high
school principal turnover. The 10 variables along with the dependent or dichotomous
variable, turnover, were analyzed using Binary Logistic Regression. Two of the 10
variables proved to have a statistically significant effect on high school principal
turnover.
Analysis on salary, compensation and benefits indicated that as the ratings
increased, so did the odds of high school principal turnover; therefore, salary,
compensation and benefits was a statistically significant predictor of turnover for both
Group 2 and Group 1. Analysis on advancement opportunities indicated that as the
ratings increased, the odds of high school principal turnover decreased indicating that
advancement opportunities was a statistically significant predictor of high school
principal turnover for both Group 1 and Group 2. The longer the principals remained in
74
the high school principalship, the odds decreased that the principal would leave their
principalship.
Responses from the opened ended questions suggested that participants
became principals to impact the students, campus and community in addition to salary,
personal reasons and promotion. Participants reported that the least rewarding part of
being a principal was handling issues with parents, students, staff and other adults. Also
lack of support, politics, and job stressors were also cited as the least rewarding part of
being a principal. Student and teacher success, brokering change and developing
relationships were cited as the most rewarding part of being a principal by the
participants. Participants reported leaving their prior position for change or promotion,
lack of support, family, personal reasons, salary and reassignment.
75
CHAPTER V
FINDINGS, DISCUSSION AND RECOMMENDATIONS
The purpose of the present study was to determine factors that impact tenure
and turnover of high school principals in the state of Texas. The factors included in the
study were salary, compensation and benefits, accountability, job stress, increased
instructional responsibilities, changes in student demographics, lack of support, politics,
advancement opportunities and promotion. This study also analyzed the results of four
open ended questions.
Chapter V summarizes the findings of the study. Relevant implications and
conclusions are drawn based on these findings. Additionally, recommendations for
future research are based on these findings and are centered around the following
research question:
What are the factors that contribute to the length of tenure among high school
principals in Texas public schools?
Findings and Discussion
The results from the logistic regression analysis indicated that the factor salary,
compensation and benefits was a statistically significant predictor of high school
principal turnover. As demonstrated by this study, the odds of high school principal
turnover due to salary were 2.14 times more likely for participants in who had remained
in their principalship for 5 or more years than for participant who remained in their
principalship for less than 5 years.This finding suggests that the longer a high school
principal remains in a principalship, the more likely the principal is to leave due to
salary.
76
The results obtained for salary, benefits and compensation were similar to the
results found in prior studies, namely Akiba and Reichardt (2004), Frazer and Brock
(2006) and Papa (2007). Akiba and Reichardt (2004) found that male and female
participants receiving large increases in their salaries were more likely to move to a
different school. Papa (2007) concluded that the likelihood of interdistrict principal
retention or non retention increased by 8.1% as a result of a $1000 increase in salary
and the likelihood of within district principal retention or non retention increased by
11.5% as a result of $1000 increase in pay. In other words, if the principal received the
pay increase in their current job, the retention rate increased 8.1%. If the principal was
offered the pay increase through changing positions within the district or out of the
district, then non retention or turnover increased 8.1%
The finding of salary, compensation and benefits as a predictor for high school
principal turnover is relevant to the theoretical framework of motivation theory. Herzberg
et al. (1968) concluded that salary was not a motivator; however, individuals become
dissatisfied with their jobs if not paid fairly. According to Herzberg (1968b),
administrators must make sure that employee salaries are sufficient, if not, then
employees will leave the organization. Supporting the Herzberg’s theory, findings by
Fraser and Brock (2006) revealed that financial security was a significant factor for job
retention. The pay difference for a beginning principal and an experienced teacher is
slim or nonexistent. When principal salaries are calculated on a daily or hourly basis,
there is often not a great difference between principal pay and teacher pay, considering
the number of hours a principal typically works in a day compared to teacher hours
(Cushing et al., 2003; Yerkes & Guaglianone, 1998), thus creating job dissatisfaction.
77
Financial security is at the second level of Maslow’s hierarchy of needs (1954).
According to Maslow, needs must be met one level before an individual can move to the
next level. The finding of salary, compensation and benefits for a predictor of high
school principal turnover would suggest that principals were on the second level of
Maslow’s hierarchy of needs. However, since salary, compensation and benefits
increased the odds of turnover the longer the participants remained in their prior high
school principalship, it could be surmised the participants were at a higher level on
Maslow’s hierarchy and were satisfied with their positions but were enticed to leave by
higher salaries.
In order to address the problem of high school principal turnover due to salary,
benefits and compensation, one implication for decreasing the odds of high school
turnover due to salary would be for district superintendents and school boards to ensure
that high school principal salaries in their school district are comparable to high school
principal salaries in the area and throughout the state. In addition, superintendents and
school boards should have clear policies related to salaries, benefits and pay raises.
The results from this study also indicated that the factor advancement
opportunities was a significant factor in predicting high school principal turnover. As
demonstrated in this study, the odds of high school principal turnover due to
advancement opportunities were .44 less likely for participants in Group 2 than for
participant in Group 1. This finding suggests that the opportunity for advancement is a
better predictor for high school principal turnover for principals in the early years of their
principalship and that advancement opportunities becomes less of a predictor of
turnover the longer the participants remained in their prior high school principalship.
78

Few studies have considered advancement opportunities as related to principal
turnover. The finding of advancement opportunities as it relates to high school principal
turnover is relevant to the theoretical framework of motivation theory. Herzberg et al.
(1959) maintained that opportunities for job advancement and growth were important
motivators in increasing job satisfaction. Herzberg et al. contended that individuals have
a psychological need to grow and that this need is fulfilled by opportunities that lead to
growth. Herzberg et al. maintained that workers should be placed in situations where
they can achieve and be recognized for their achievement and responsibilities so that
they can grow and advance.
Advancement is among level 4, esteem needs and level 5, self actualization of
Maslow’s hierarchy of needs (1954). Maslow contends that providing opportunities for
advancement and job titles that indicate that employees have achieved a high level of
status within the organization are means of satisfying employee esteem needs.
Additionally, providing growth opportunities assist in satisfying self-actualization needs.
The finding from this study that the odds of high school principal turnover decreased
due to advancement opportunities the longer the principal remained in their position
could be explained through Maslow’s hierarchy. It could be surmised that high school
principals who stay in the principalship for 5 years or longer have reached level 5 of
Maslow’s hierarchy and have satisfied their self actualization needs and are comfortable
in their position as a building principal. Alternately, it could be surmised that high school
principals who leave their positions within the first 4 years of employment are still trying
to reach level 4 of Maslow’s hierarchy and do not feel that they have reached their full
potential. Additionally, it could be conjectured that if a principal desires advancement,
79
they will work toward that advancement early in their career and seek changes in their
careers that will ultimately lead to the advancement.
To address the issue of high school principal turnover due to advancement
opportunities district superintendents should provide training and development
opportunities within the district that will allow high school principals to advance. It should
be noted that this is a short term solution to high school principal turnover. If districts
train and develop principals for advancement, then it could be assumed that they will
eventually leave the principalship for advancement.
Participants were requested to respond to 4 open ended questions. For the open
ended question asking why participants became principals, responses were categorized
into 6 themes: to impact students, to impact the campus, promoted or encouraged,
salary, personal and to impact the community. The theme with the highest response
was to impact students with thirty-two or 45% of the responses. The next highest theme
was to impact the campus with 8 or 25% of the responses. These two themes are
closely related as they involve serving and impacting others and support Maslow’s
hierarchy of needs. It could be surmised that participants reporting impacting students
and impacting campus as to why they became a principal are on level 3 of Maslow’s
hierarchy and are attempting to meet relationship and belonging needs or it could be
conjectured that participants are on level 4 or 5 of Maslow’s hierarchy and are
attempting to meet esteem needs or have already reached self-actualization. Newer
models of Maslow’s hierarchy include additional levels although Maslow never
recognized these levels. The 8th level, transcendence, incorporates helping others
80
achieve self-actualization. It is possible that principals responding to impact students
and campus are on the 8th level.
When participants were asked to report the least rewarding part of being a
principal, approximately 14 or 28% of the respondents cited job stressors such as
paperwork, meetings and hours as the least rewarding part of being a principal. The
themes parent issues, issues with other adults and politics and bureaucracy were
evenly distributed with 18% and 17% of the responses categorized into these themes.
The remaining responses were categorized into the themes of lack of support, testing
and accountability and student issues. According to Herzberg (1959) responses such as
politics, lack of support, working with parents and other adults, and conditions of the job
itself such as hours and paperwork are hygiene factors, which much be addressed in
order to create an environment where job satisfaction and motivation are possible. In
relation to high school principal turnover and job satisfaction, possible implications for
school superintendents and school board members would be to ensure that policies are
easily understood, fair and applied equally. Also, meetings and paperwork should be
concise and to the point. High school principals should receive training in time
management and learn which jobs can be delegated to other employees within the
school.
Fifty-one percent of the respondents cited students or student success as the
most rewarding part of being a principal while 24% of the responses were categorized
into the theme of teachers or teacher success. The remaining responses were
categorized into the themes of brokering campus change and relationships with other
adults. These responses support Herzberg’s theory (1959) that principals feel that the
81
work itself is important and meaningful. These responses are considered motivators;
therefore, their presence motivates and leads to job satisfaction but their absence does
not particularly cause job dissatisfaction. Intrinsic responses including student and
teacher success would suggest that participants had reached level 5 on Maslow’s
hierarchy (1954). By recognizing and sharing success stories of the principals,
superintendents and school boards could increase the satisfaction of the high school
principals in relationship to their job.
For the open ended question asking why participants left their prior position, the
theme with the highest percentage of responses was change. This response included
the need for change, new challenges and moving to a larger district. Thirty one percent
or 23 out of 74 responses were categorized into this theme. This response supports the
theoretical framework of motivation theory. Herzberg et al. (1959) maintained workers
were satisfied when they were being adequately challenged. Maslow (1954) contended
that self-actualization needs may be satisfied by assigning interesting and challenging
work. Other themes emerging from the responses for this question included lack of
support, family, personal, promotion, reassignment and salary. Note that only 5 or 7% of
the respondents reported salary as a response to why they left their prior principalship.
This result conflicts with the results in this study from logistic regression which found
salary, compensation and benefits to be a significant predictor of turnover. This
difference could be explained by the fact that a Likert scale was used for rating salary
as to the extent in which it motivated participants to leave their principalship and not a
rank, therefore allowing participants to rate any of the variables included in the study
high, low or the same. For the open ended question, most participants provided only
82
one response suggesting that they provided the response that had the most influence
on leaving their prior principalship.
In order to address the problem of high school principal turnover based on the
responses from this question, superintendents and school boards should seek ways of
adequately challenging school principals and provide timely feedback to principals on
how they are doing. However; superintendents should be cautious not to overload
principals with challenges that are too difficult or time consuming.
Recommendations for Future Research
While the results from this study supported prior research and added new data to
the study of principal turnover, these results possess limitations. The data from this
study was limited to the state of Texas. While it can be surmised that these results could
be applied to other states that are similar to Texas caution should be taken in applying
these results to states with different characteristics and demographics from Texas.
Additional studies are recommended utilizing data from other states.
Second, data from this study was limited to high school principals. Studies
focusing on elementary or middle school principals may produce different results.
Therefore it is suggested the additional studies be conducted utilizing data from
elementary and middle schools.
The sample size for this study was small. Only 99 high school principals in Texas
met the qualifications for inclusion in the study, with approximately 60% completing the
TPS. Although it can be assumed that the sample was representative of high school
principals, different results could be obtained by utilizing a larger sample size. It is
suggested that the study be duplicated utilizing a larger sample size.
83

Achievement was not included in this study as related to student test scores.
Prior research studies by Parlow (2007) and Akiba and Reichardt (2004) indicated a
relationship between achievement and principal turnover. This study could be repeated
adding the Texas Assessment of Knowledge and Skills (TAKS) as an independent
variable to determine the effect of student test scores in Texas on high school principal
turnover.
Finally, the survey included only high school principals who moved from one high
school principalship to a different high school principalship. Therefore, high school
principals who left the principalship for positions other than high school principal
positions or left to pursue other career opportunities outside of education were not
included in the survey. Studies focusing on high school principals who left the
principalship for other positions or for career opportunities are likely to produce different
results and could add to the current literature on principal turnover.
Conclusion
In summary, only salary and advancement opportunities were statistically
significant predictors of high school principal turnover among the 10 variables included
in the study. Of the open ended responses asking why participants became a principal,
impacting students, campus and community were among the themes of the categorized
responses. Job stressors, issues with parents and other adults, politics, and lack of
support were among the least rewarding part of being a principal while student and
teacher success were among the highest responses of the most rewarding part of being
a principal. Of the 8 themes from the open ended question asking why principals left
their prior position, the theme with the largest percentage or responses was change.
84
85
Other themes included lack of support, family, personal, promotion, reassignment and
salary. Theories of motivation were used to explain the results and responses to the
study. Recommendations for future research were discussed.
APPENDIX A
TEXAS PRINCIPAL SURVEY
86

Texas Principal SurveyTexas Principal SurveyTexas Principal SurveyTexas Principal Survey
Background Information
1.
Your participation in this survey is voluntary and you may choose to end your participation at any time. In addition, your
answers are confidential as your name or school will not be used in the research paper and there are no foreseeable
risks to you for your participation in the survey. The researcher will have access to the key that links participant
information to their coded responses; that key will be destroyed once the data collection is complete. Data will be
reported in the aggregate and not attributed directly to one person.
1. School accountability rating for the 2007-2008 school year: *
2. Your current age:
*
3. Age at which you first became a principal:
*
4. Including this year, how many total years have you served as a principal?
*
5. What was your primary teaching area of certification prior to becoming a principal?
*
6. Ethnicity:
7. Sex*
Exemplary
nmlkj Recognized
nmlkj Acceptable
nmlkj Academically
Unacceptablenmlkj
White
gfedc
African American
gfedc
Spanish-American
gfedc
Asian-American
gfedc
Native American
gfedc
Other
gfedc
Male
nmlkj Female
nmlkj

Texas Principal SurveyTexas Principal SurveyTexas Principal SurveyTexas Principal Survey
8. Salary Range:*
9. Highest level of education:*
10. From where did you receive your principal's certification?(University name and state)
*
11. What building level/school leader certification/license do you hold?
12. Which best describes your formal leadership preparation program?
13. What is your current campus level?
less than $60,000
nmlkj
$60,000 to $64,999
nmlkj
$65,000 to $69,999
nmlkj
$70,000 to $74,999
nmlkj
$75,000 to $79,999
nmlkj
$80,000 to $84,999
nmlkj
$85,000 to $89,999
nmlkj
$90,000 to $94,999
nmlkj
$95,000 to $99,999
nmlkj
$100,000 and over
nmlkj
Bachelor's Plus
nmlkj Master's
nmlkj Master's Plus
nmlkj Ed.D.
nmlkj Ph.D.
nmlkj
I do not hold a license or certification for a school leader or principal position.
nmlkj
Permanent professional license (including 5 year and lifetime).
nmlkj
Temporary certificate to allow employment as a building leader.
nmlkj
A traditional preparation program from an institution of higher education.
gfedc
An alternative certification program through the district.
gfedc
An alternative certification progrm offered by an agency or organization (non-district/non-university).
gfedc
Other
gfedc
Elementary
gfedc
Intermediate
gfedc
Middle School
gfedc
Junior High
gfedc
Freshman Campus
gfedc
High School 9-12
gfedc
High School 10-12
gfedc
High School 7-12
gfedc
other
gfedc
Other (please specify)
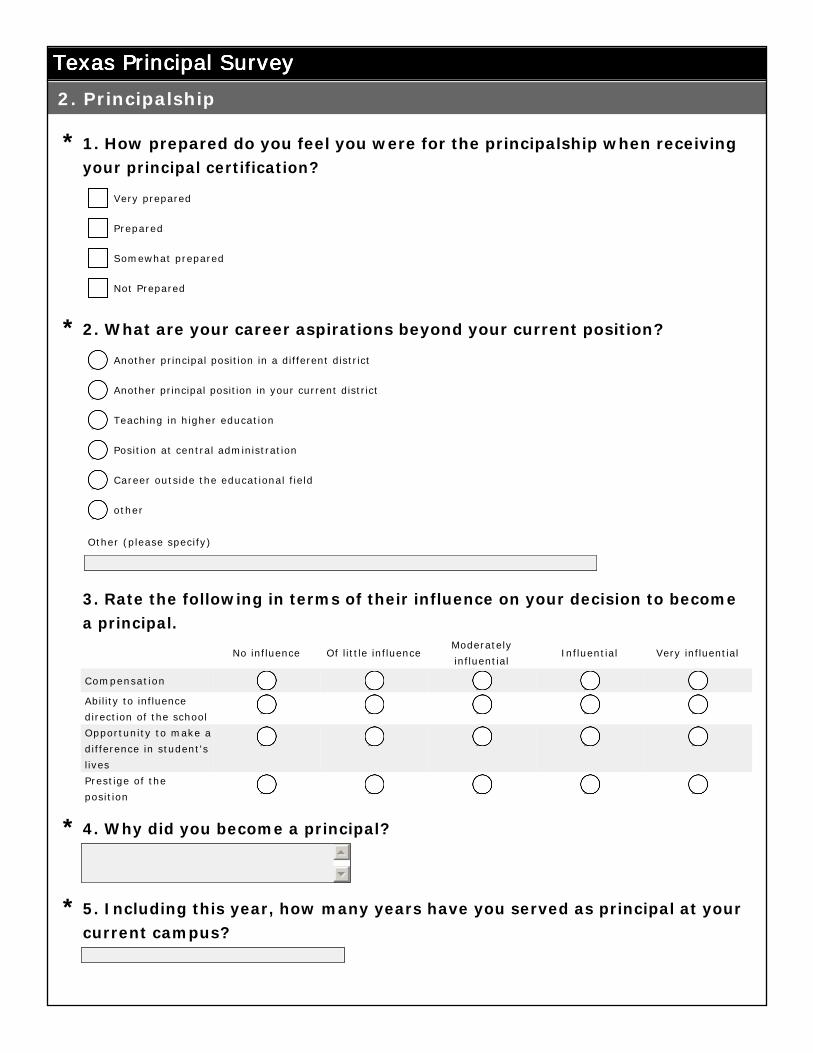
Texas Principal SurveyTexas Principal SurveyTexas Principal SurveyTexas Principal Survey
2. Principalship
1. How prepared do you feel you were for the principalship when receiving your principal certification?
*
2. What are your career aspirations beyond your current position?*
3. Rate the following in terms of their influence on your decision to become a principal.
No influence Of little influenceModerately
influentialInfluential Very influential
Compensation nmlkj nmlkj nmlkj nmlkj nmlkj
Ability to influence
direction of the schoolnmlkj nmlkj nmlkj nmlkj nmlkj
Opportunity to make a
difference in student's
lives
nmlkj nmlkj nmlkj nmlkj nmlkj
Prestige of the
positionnmlkj nmlkj nmlkj nmlkj nmlkj
4. Why did you become a principal?
*
5. Including this year, how many years have you served as principal at your current campus?
*
Very prepared
gfedc
Prepared
gfedc
Somewhat prepared
gfedc
Not Prepared
gfedc
Another principal position in a different district
nmlkj
Another principal position in your current district
nmlkj
Teaching in higher education
nmlkj
Position at central administration
nmlkj
Career outside the educational field
nmlkj
other
nmlkj
Other (please specify)

Texas Principal SurveyTexas Principal SurveyTexas Principal SurveyTexas Principal Survey
6. How many hours a week do you currently work as an administrator?*
7. Have you worked outside of the state of Texas as a principal?*
8. What is the most rewarding or best part of the principalship?
*
9. What is the least rewarding or worst part of the principalship?
*
20-30
gfedc
30-40
gfedc
40-50
gfedc
50-60
gfedc
60+
gfedc
yes
gfedc
no
gfedc
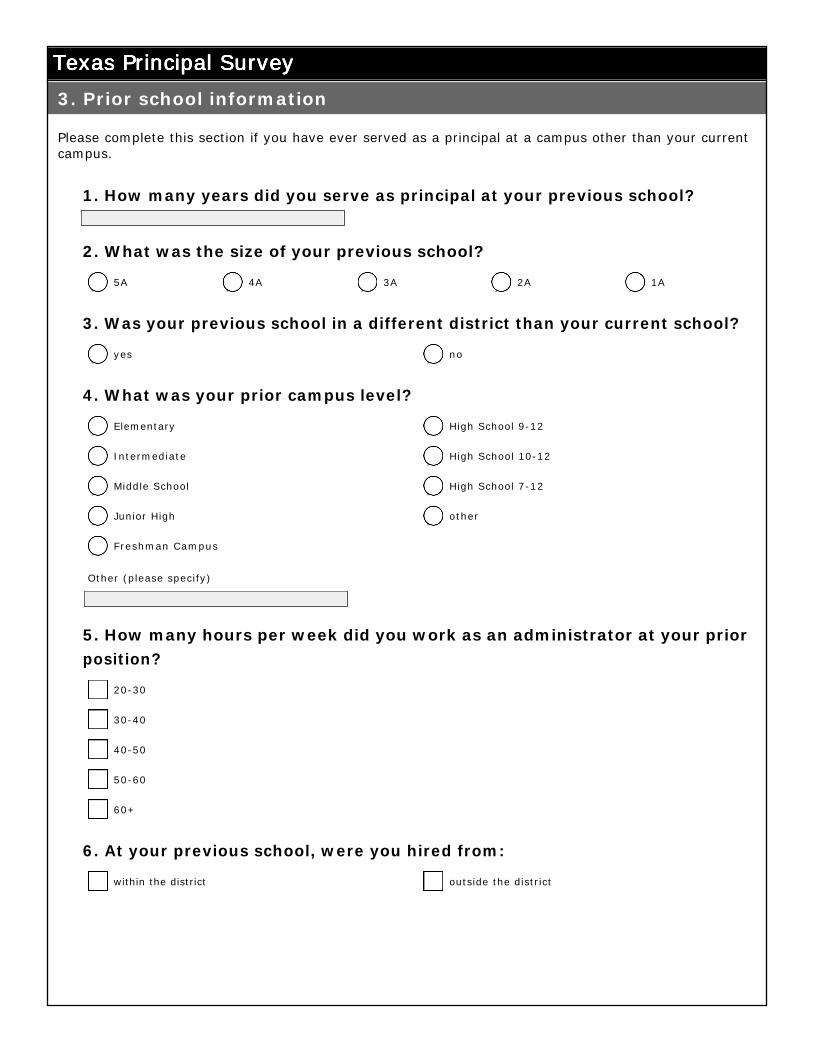
Texas Principal SurveyTexas Principal SurveyTexas Principal SurveyTexas Principal Survey
Please complete this section if you have ever served as a principal at a campus other than your current campus.
3. Prior school information
1. How many years did you serve as principal at your previous school?
2. What was the size of your previous school?
3. Was your previous school in a different district than your current school?
4. What was your prior campus level?
5. How many hours per week did you work as an administrator at your prior position?
6. At your previous school, were you hired from:
5A
nmlkj 4A
nmlkj 3A
nmlkj 2A
nmlkj 1A
nmlkj
yes
nmlkj no
nmlkj
Elementary
nmlkj
Intermediate
nmlkj
Middle School
nmlkj
Junior High
nmlkj
Freshman Campus
nmlkj
High School 9-12
nmlkj
High School 10-12
nmlkj
High School 7-12
nmlkj
other
nmlkj
Other (please specify)
20-30
gfedc
30-40
gfedc
40-50
gfedc
50-60
gfedc
60+
gfedc
within the district
gfedc outside the district
gfedc
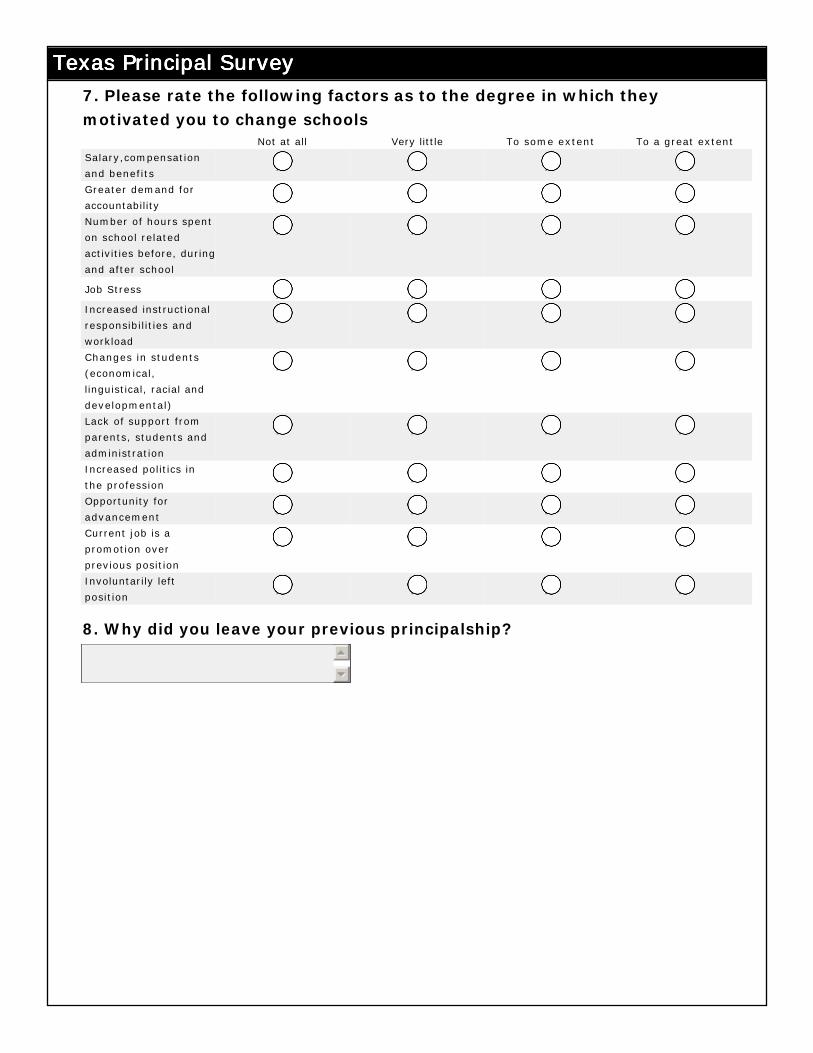
Texas Principal SurveyTexas Principal SurveyTexas Principal SurveyTexas Principal Survey7. Please rate the following factors as to the degree in which they motivated you to change schools
Not at all Very little To some extent To a great extent
Salary,compensation
and benefitsnmlkj nmlkj nmlkj nmlkj
Greater demand for
accountabilitynmlkj nmlkj nmlkj nmlkj
Number of hours spent
on school related
activities before, during
and after school
nmlkj nmlkj nmlkj nmlkj
Job Stress nmlkj nmlkj nmlkj nmlkj
Increased instructional
responsibilities and
workload
nmlkj nmlkj nmlkj nmlkj
Changes in students
(economical,
linguistical, racial and
developmental)
nmlkj nmlkj nmlkj nmlkj
Lack of support from
parents, students and
administration
nmlkj nmlkj nmlkj nmlkj
Increased politics in
the professionnmlkj nmlkj nmlkj nmlkj
Opportunity for
advancementnmlkj nmlkj nmlkj nmlkj
Current job is a
promotion over
previous position
nmlkj nmlkj nmlkj nmlkj
Involuntarily left
positionnmlkj nmlkj nmlkj nmlkj
8. Why did you leave your previous principalship?
APPENDIX B
CONSENT NOTICE
93


95
APPENDIX C
PARTICIPANT’S RATINGS OF MOTIVATING FACTORS AND
PEARSON CHI-SQUARES
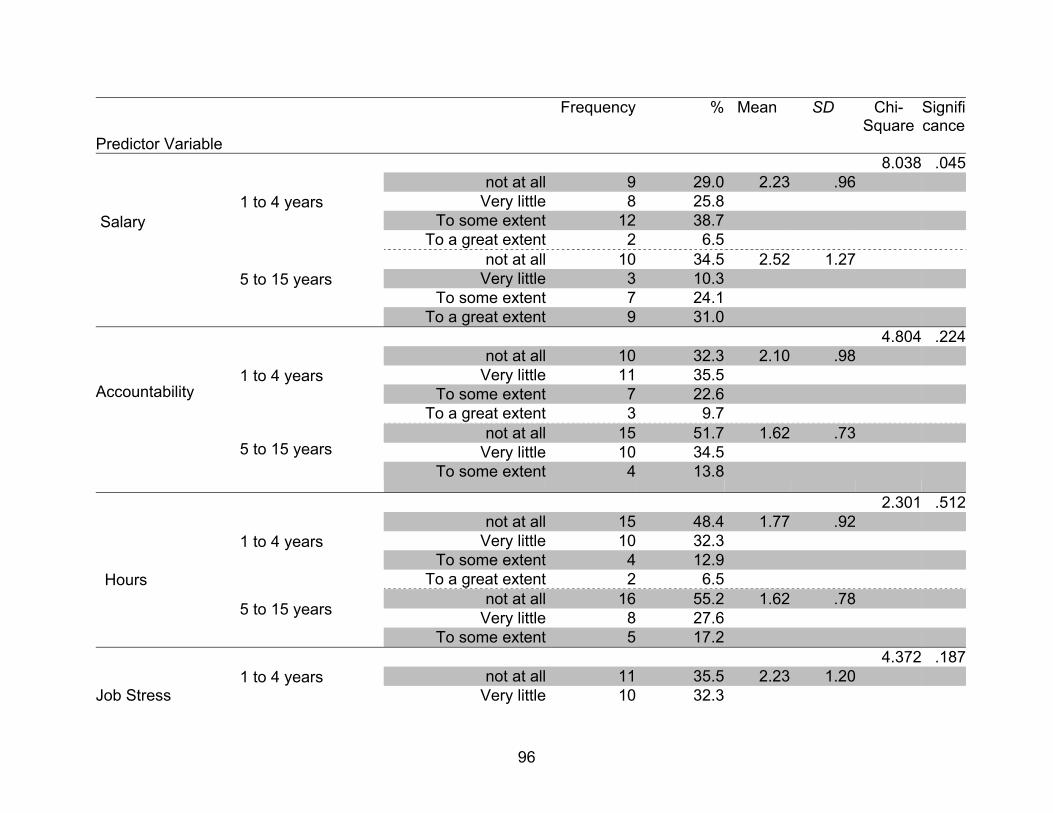
Predictor Variable
Frequency % Mean SD Chi-Square
Significance
Salary
8.038 .045
1 to 4 years
not at all 9 29.0 2.23 .96Very little 8 25.8
To some extent 12 38.7To a great extent 2 6.5
5 to 15 years
not at all 10 34.5 2.52 1.27Very little 3 10.3
To some extent 7 24.1To a great extent 9 31.0
Accountability
4.804 .224
1 to 4 years
not at all 10 32.3 2.10 .98Very little 11 35.5
To some extent 7 22.6To a great extent 3 9.7
5 to 15 years
not at all 15 51.7 1.62 .73Very little 10 34.5
To some extent 4 13.8
2.301 .512
Hours
1 to 4 years
not at all 15 48.4 1.77 .92Very little 10 32.3
To some extent 4 12.9To a great extent 2 6.5
5 to 15 years
not at all 16 55.2 1.62 .78Very little 8 27.6
To some extent 5 17.2 4.372 .187 Job Stress
1 to 4 years
not at all 11 35.5 2.23 1.20Very little 10 32.3
96
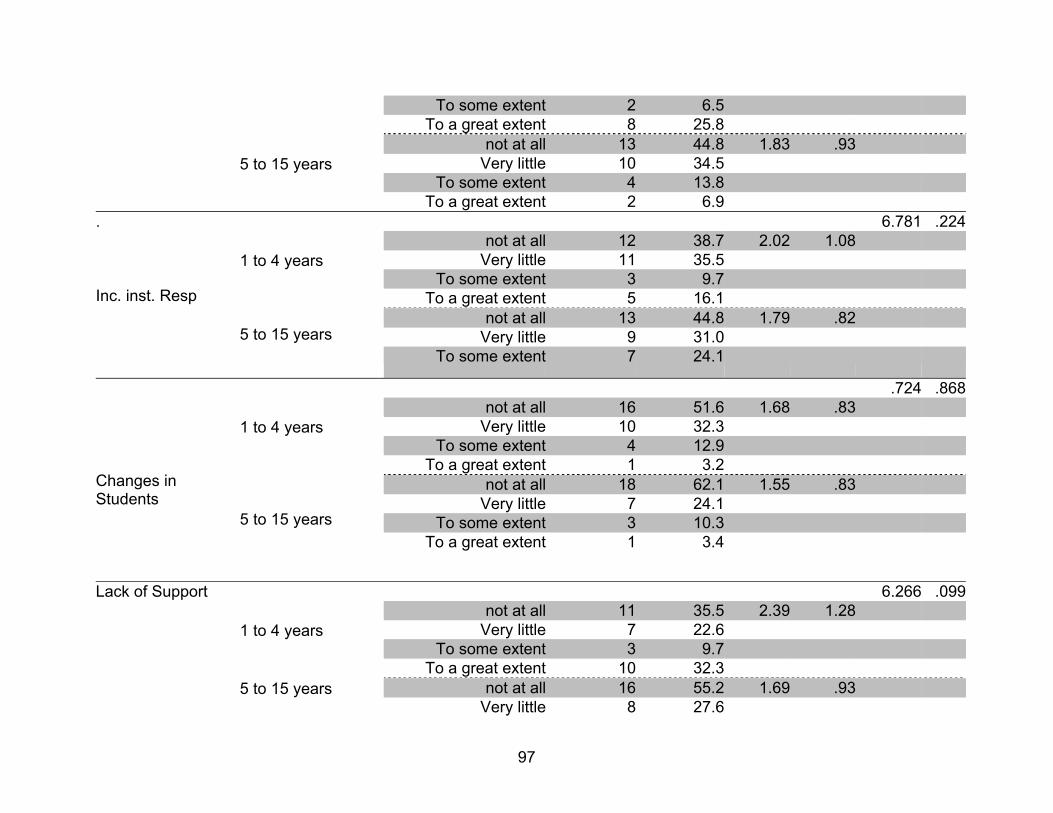
To some extent 2 6.5To a great extent 8 25.8
5 to 15 years
not at all 13 44.8 1.83 .93Very little 10 34.5
To some extent 4 13.8To a great extent 2 6.9
. 6.781 .224 Inc. inst. Resp
1 to 4 years
not at all 12 38.7 2.02 1.08Very little 11 35.5
To some extent 3 9.7To a great extent 5 16.1
5 to 15 years
not at all 13 44.8 1.79 .82Very little 9 31.0
To some extent 7 24.1
.724 .868 Changes in Students
1 to 4 years
not at all 16 51.6 1.68 .83Very little 10 32.3
To some extent 4 12.9To a great extent 1 3.2
5 to 15 years
not at all 18 62.1 1.55 .83Very little 7 24.1
To some extent 3 10.3To a great extent 1 3.4
Lack of Support 6.266 .099
1 to 4 years
not at all 11 35.5 2.39 1.28Very little 7 22.6
To some extent 3 9.7To a great extent 10 32.3
5 to 15 years
not at all 16 55.2 1.69 .93Very little 8 27.6
97
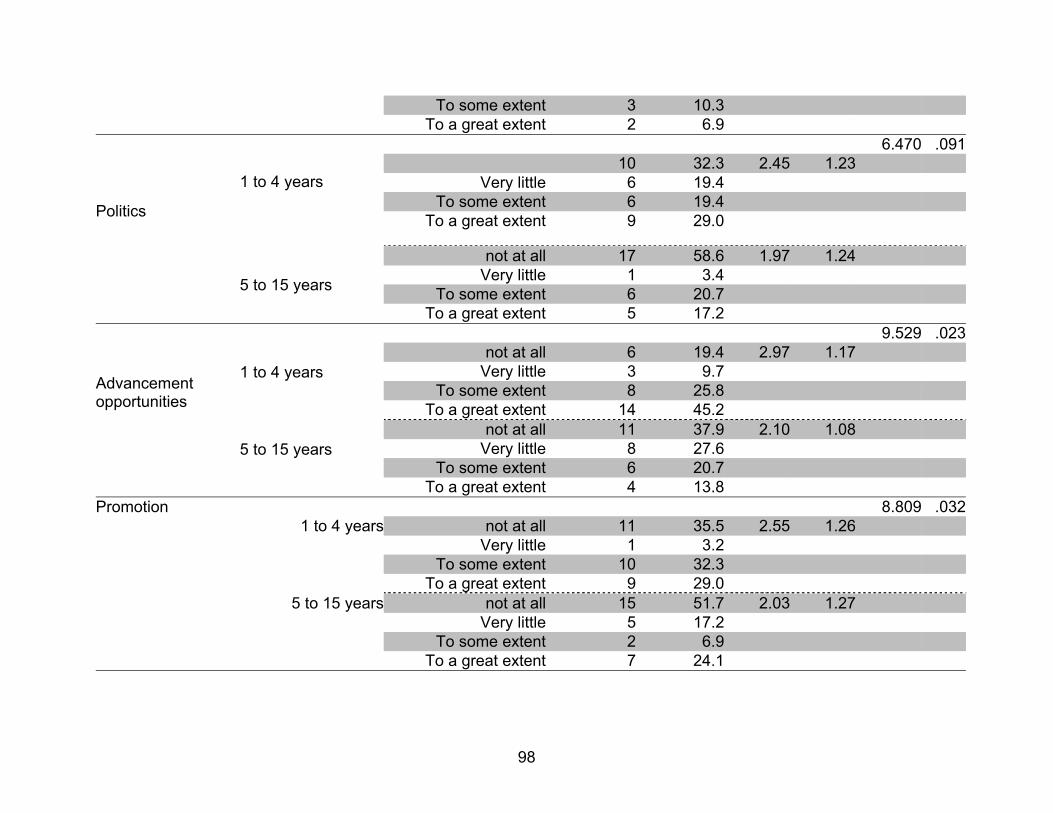
98
To some extent 3 10.3To a great extent 2 6.9
6.470 .091
Politics
1 to 4 years
10 32.3 2.45 1.23Very little 6 19.4
To some extent 6 19.4To a great extent 9 29.0
5 to 15 years
not at all 17 58.6 1.97 1.24Very little 1 3.4
To some extent 6 20.7To a great extent 5 17.2
9.529 .023
Advancement opportunities
1 to 4 years
not at all 6 19.4 2.97 1.17Very little 3 9.7
To some extent 8 25.8To a great extent 14 45.2
5 to 15 years
not at all 11 37.9 2.10 1.08Very little 8 27.6
To some extent 6 20.7To a great extent 4 13.8
Promotion 8.809 .0321 to 4 years not at all 11 35.5 2.55 1.26
Very little 1 3.2To some extent 10 32.3
To a great extent 9 29.05 to 15 years not at all 15 51.7 2.03 1.27
Very little 5 17.2To some extent 2 6.9
To a great extent 7 24.1
REFERENCES
Akiba, M., & Reichhardt, R. (2004, April 24). What predicts the mobility of elementary? school leaders? An analysis of longitudinal data in Colorado, Education Policy Analysis Archives, 12(18). Retrieved February 14, 2010 from http//epaa.asu.edu/epaa/v12n18/.
Annotated SPSS output; Logistic Regression. UCLA: Academic Technology Services, Statistical Consulting Group. Retrieved February 1, 2010 from http://www.ats.ucla.edu/stat/spss/output/logistic.htm Archer, J. (2003, April 16). Study finds good supply of principals, but not for all types
of school. Education Week, 22(31), 7. Retrieved January 11, 2008 from MasterFILE Premier database.
Archer, J. (2003, June 4). Debate heating up on how to lure top-notch principals. Education Week, 22(39), 1. Retrieved January 11, 2008, from MasterFILE Premier database.
Ball, J. (2003). Understanding Herzberg’s motivation theory. Retrieved December 1, 2008 from http://www.accaglobal.com/students/publications/student_accountant/archive/2003/40/1010721
Bell, E. (2001). Schools’ principal shortage: Fewer teachers want the job’s growing challenges. Retrieved January 9, 2008 from SFGate.com.
Bryant, M. T. (2004). The portable dissertation advisor. Thousand Oaks, CA: Corwin
Press. Byrd, J., Drews, C., & Johnson, C. (2006). Factors impacting superintendent turnover:
Lessons from the field. NCPEA Education Leadership Review, 7(2), 11. Retrieved January 11, 2008 from http://enx.org/content/m14507/1.1/
Bulach, C.R., & Malone, B. (1994). The relationship of school climate to the implementation of school reform. ERS Spectrum, 12(4), 3-8
Christensen, L.B. (2001). Experimental methodology (8th ed.). Needham Heights, Massachusetts: Allyn & Bacon.
Cushing, K., Kerrins, J., & Johnstone, T. (2003, May). Disappearing principals. Leadership, 32(5), 28. Retrieved January 11, 2008 from MasterFILE Premier database.
Davis, S. (1997, November). The principal's paradox: Remaining secure in a precarious position. NASSP Bulletin, 81(592), 73. Retrieved March 2, 2008, from Academic Search Complete database.
99
Davis, S. (1998, January 1). Why do principals get fired? Principal, 28, 34. (ERIC Document Reproduction Service No. EJ575246) Retrieved March 22, 2008, from ERIC database.
Epstein, J. (n.d.). School/family/community partnerships: caring for the children we
share. Phi Delta Kappan, 76, 701-712. Retrieved February 3, 2009, from Readers Guide Abstracts database.
Fraser, J., & Brock, B. (2006, June). Catholic school principal job satisfaction: Keys to retention and recruitment. Catholic Education: A Journal of Inquiry & Practice, 9(4), 425-440. Retrieved December 3, 2008, from Academic Search Complete database.
Fuller, E.J., Orr, M.T., & Young, M.D. (2008, March). The revolving door of the
principalship. IMPLICATIONS from UCEA, 1-2. Retrieved November 20, 2009 from http://www.ucea.org/storage/implications/ImplicationsMar2008.pdf
Fuller, E.J., Young, M.D., & Baker, B. (2007. April). The relationship between principal
characteristics, principal turnover, teacher quality, and student achievement. Presented at the annual meeting of the University Council of Educational Administration, Alexandria, VA.
Fuller, E.J. & Young, M.D. (2009, Summer). Tenure and retention of newly hired
principals in Texas. Texas High School Project. Retrieved February 15, 2010 from http://www.ucea.org/storage/principal/IB%201_Principal%20Tenure%20and%20Retention%20in%20Texas%20of%20Newly%20Hired%20Principals_10_8_09.pdf
Fullan, M. (1991). The new meaning of educational change. New York: Teachers College Press. Gall, M.D., Gall, J.P. & Borg, W.R. (2003). Educational research an introduction (7th
ed.). Boston: Allyn and Bacon. Garson, G. D. (2006). Correlation. Raleigh: North Carolina State University. Retrieved
March 14, 2009 from http://www2.chass.ncsu.edu/garson/pa765/correl.htm
Gates, S., Ringel, J., Santibanez, L., Guarino, C., Ghosh-Dastidar, B., & Brown, A.
(2006, June). Mobility and turnover among school principals. Economics of Education Review, 25(3), 289-302. Retrieved December 13, 2007 from www.sciencedirect.com
Gay, L. R. (1996). Educational research (5th ed.). Edgewood Cliffs, New Jersey: Merrill
100
Goldman, S. (1966). The school principal. New York: Center for Applied Research in Education. Guthrie, J. W., & Reed, R. J. (1991). Educational administrations and policy (2nd ed.).
Needham Heights, MA: Allyn and Bacon. Hair J. F., Anderson, R. E., Tatham, R. l., & Black, W. C. (2006). Multivariate data
analysis (6th ed.). Upper Saddle River: Prentice-Hall. Hallinger, P., & Heck, R. (1998). Exploring the principal's contribution to school
effectiveness: 1980-1995. School Effectiveness & School Improvement, 9(2), 157. Retrieved from Academic Search Complete database.
Hanson, E. M. (2003). Educational administration and organization (5th ed.). New York: Pearson Educational Inc. Hertling, E. (2001). Retaining principals. Eric Digest, 147. (ERIC Document
Reproduction Service No. ED454567). Retrieved December 18, 2007 from ERIC Database.
Herzberg, F. (1968a, January-February). One more time. How do you motivate employees? Harvard Business Review, 54-62. Herzberg, F. (1968ab). Work and the nature of man. London: Crosby Herzberg, F., Mausener, B., Patterson, R. O., & Capwell, D. F. (1957). Job attitude:
Review of research and opinion. Pittsburgh, PA: Psychological Services of Pittsburgh.
Herzberg, F., Mausener, B., & Snyderman, B. (1959). The motivation to work. New York: John Wiley & Sons.
Hinkle, D., Wiersma, W., & Jurs, S. (2003). Applied statistics for the behavioral sciences. (5th ed.). Boston, MA: Houghton Mifflin Company.
Hopkins, G. (2003). From the principal files: The principal shortage – why doesn’t
anyone want the job? Retrieved January 11, 2008 from www. Educationworld.com/a_admin/admin/admin197.shtml.
Huck, S. (2000). Reading statistics and research (3rd ed). New York: Longman. Institute for Educational Leadership. (2000). Leadership for student learning:
Reinventing the principalship. A report of the Task Force on the Principalship. Washington, D.C.: IEL. Retrieved May 19, 2009 from http://www.iel.org/programs/21st/reports/principal.pdf
101
Johnson, L. (2005). Why principals quit: There are many reasons why principals voluntarily leave the positions they worked so hard to earn. Principal, 84(3), 21-23..
Kerrins, J., Cushing, K., & Johnstone, T. (2001). Anticipated vacancies, hiring practices, and new principal competencies in school district in the state of California, 1997-2003. Educational Leadership and Administration: Teaching and Program Development, 13, 73-87.
Konnert, M. W., & Augenstein, J. J. (1995). The school superintendency: Leading education into the 21st century. Lancaster, Pennsylvania: Technomic Publishing, Inc.
Leithwood, K., & Jantzi, D. (2000) Principal and teacher leader effects: A replication.
School Leadership and Management, 20(4), 415 – 434. Retrieved January 10, 2010 from http://libproxy.library.unt.edu:2055/ehost/pdf?vid=8&hid=13&sid=1dcfde60-9cd2-4f97-8b39-455d6ab7414a%40sessionmgr13
Levy, A., Fields, E., & Jablonski, E. (2006).Overview of research: What we know and don’t know about the consequences of science and math teacher turnover. Paper presented at the NCTAF Symposium on the Scope and Consequences of K-12 Science Mathematics Teacher Turnover.
Loeser, J. (2008). School leadership. Great Neck Publishing, 1-7. Retrieved February 1, 2009, from Research Starters - Education database. Lord, M. (2002, January 28). Teaching America. U.S. News & World Report, 132(3), 28. Retrieved December 3, 2008, from Academic Search Complete database. Magnuson, P. (2002). Erase stress. Communicator, 12, 1-2. Maslow, A. H. (1954). Motivation and personality. New York: Harper & Brothers. Mayo, E. (1933). The human problems of an industrial civilization. New York: Macmillan. Miller, A. (2009). Principal turnover, student achievement and teacher retention.
Retrieved March 1, 2009 from http://www.ers.princeton.edu/Miller.pdf Mitchell, M., & Jolley, J. (2004). Research design explained (5th ed.). Belmont, CA:
Wadsworth/Thompson. Morse, J. M. (1997). Perfectly healthy, but dead; The myth of inter-rater reliability.
Qualitative Health Research, 7(4), 445-447.
102
MSN Encarta (2009). Dictionary. Retrieved February 4, 2009 from http://encarta.msn.com/dictionary_/principal.html Nakamura, D., & Samuels, C. A. (2000). In schools, changes at the top: Area faces
shortages of new principals. The Washington Post, p. A01. National Association of Secondary School Principals (2000, December). The principal
shortage. Retrieved January 5, 2010 from http://www.principals.org/Portals/0/Content/26771.pdf
National Association of Secondary School Principals. (2002). The principal. Retrieved January 5, 2010 from http://www.principals.org/Content.aspx?topic=47100
National Commission on Excellence in Education (NCEE) (1983). A nation at risk: The
importance of educational reform. Retrieved September 1, 2008 from http://www.ed.gov/pubs/NatAtRisk/index.html
National Conference of State Legislatures. (2002, January 1). The role of school leadership in improving student achievement. (ERIC Document Reproduction Service No. ED479288). Retrieved January 11, 2008 from ERIC database.
Northwest Regional Educational Laboratory. (2003). Building trust with schools and
diverse families [Electronic Version]. Office of Planning and Service Coordination. U. S. Department of Education (Contract – ED-01-CO-0013. Portland OR; NWREL. Retrieved March 23, 2008 from http://www.nwrel.org/request/2003dec/trust.pdf.
Norton, M. (2002). Let’s keep our quality school principals on the job. High School
Journal, 86(2), 50. Retrieved December 13, 2007 from MasterFILE Premier database.
Norušis, M. J. (2005). SPSS 14.0 guide to data analysis. Upper Saddle River, NJ:
Prentice Hall. Papa Jr. F. (2007). Why do principals change schools? A multivariate analysis of
principal retention. Leadership & Policy in Schools, 6(3), 267-290. Retrieved March 6, 2010 from Academic Search Complete.
Park, Hun Myoung. 2008. Univariate analysis and normality test
using SAS, Stata, and SPSS. Working Paper. The University Information Technology Services (UITS) Center for Statistical and Mathematical Computing, Indiana University. Retrieved February 10, 2010 from http://www.indiana.edu/~statmath/stat/all/normality/index.html
Paredes, V., & Frazer, L. (1992). School climate in AISD. Austin, TX; Independent School District, Office of Research and Evaluation.
103
Partlow, M. (2007). Contextual factors related to elementary principal turnover. Planning and Changing, 38(1/2), 60-76. Retrieved December 13, 2007 from Education Research Complete database.
Patton, M. Q. (2001). Qualitative evaluation and research methods (3rd ed.). Thousand
Oaks, CA: Sage Publications, Inc. Peng, C., Lee, K., & Ingersoll, G. (2002). An introduction to logistic regression analysis
and reporting. Journal of Educational Research, 96(1), 3. Retrieved September 10, 2009 from MasterFILE Premier database.
Porter, L. W., & Lawler, E. E. III. (1968). Managerial attitudes and performance. Homewood, IL: Irwin-Dorsey. Portin, B. (2004, April). The roles that principals play. Educational Leadership, 61(7),
14-18. Retrieved January 29, 2008, from Academic Search Complete Database.
Portin, B., Schneider, P., DeArmond, M., Gundlach, L., & Washington Univ. (2003, September 1). Making sense of leading schools: A study of school principalship. (ERIC Document Reproduction Service No. ED481977). Retrieved January 29, 2008, from ERIC clearinghouse.
Pounder, D., & Crow, G. (2005, May). Sustaining the pipeline of school administrators. Educational Leadership, 62(8), 56-60. Retrieved January 21, 2008, from Education Research Complete database.
Pulbic Agenda. (2001, November). Politics and bureaucracy not lack of funding are
chief irritants for superintendents and principals. Retrieved February 19, 2010 from http://www.publicagenda.org/
Rhodes, C., & Brundrett, M. (2006, July). The identification, development,
succession and retention of leadership talent in contextually different primary schools: a case study located within the English West Midlands. School Leadership & Management, 26(3), 269-287. Retrieved January 21, 2008, from Academic Search Complete database.
Richard, A. (2000). Panel calls for fresh look at duties facing principals. Education Week, November 1, 1-5. Retrieved January 6, 2008 from www.edweek.org Roethlisberger, F. & Dickson, W. (1939). Management and the worker. Cambridge, MA: Harvard University Press.
Scarpa, S. (2005). Principals need more guidance for success. District Administration,
21(5), 17. Strauss, A., & Corbin, J. (1990). Basics of qualitative research: Grounded theory
104
Procedures and techniques. Newbury Park, CA: Sage Publications, Inc. Tabachnick, B., & Fidel, L. (2000). Using multivariate statistics (4th ed.).Boston, MA:
Allyn and Bacon. Task Force on Teaching As a Profession. (1986). A nation prepared: Teaching for the
21st Century. New York: Carnegie Forum on Education and the Economy. Taylor, D.L., & Tashakkori, A. (1994). Predicting teacher’s sense of efficacy and job
satisfaction using school climate and participatory decision making. Paper presented at the annual meeting of the Southwest Research Association, San Antonio, Texas.
Texas Education Agency. (2008). Academic Excellence Indicator System reports. Retrieved December 16, 2008 from http://ritter.tea.state.tx.us/perfreport/aeis/2008/state.html
Valentine, J. C., & Cooper, H. (2003). Effect size substantive interpretation guidelines:
Issues in the interpretation of effect sizes. Washington, DC: What Works Clearinghouse. Retrieved January 15, 2010 from http://ies.ed.gov/ncee/wwc/pdf/essig.pdf
Webb, L.D., & Norton, M.S. (2003). Human resources administration: Personnel issues
and needs in education. Upper Saddle River, New Jersey: Pearson Education. Inc. Weiss, M. (1992, December). Reducing poverty. Current, Retrieved December 3, 2008, from Academic Search Complete database. Whaley, Cox, J., & Cox, C. (2002). Developing the effective teacher, hiring, evaluation,
and retention practices for the school administrator. Gaithersburg, Maryland: Aspen Publications.
Whittall, M., New Zealand. (2002, May 1). Principal retention and patterns in a cross- section of New Zealand rural school, May 1990-May 2000. (ERIC Document Reproduction Service No. ED466895). Retrieved December 13, 2007 from ERIC database.
Winter, J.S., & Sweeney, J. (1994). Improving school climate: Administrators are the
key. NASSP Bulletin, 73, 65-69.
Yerkes, D., & Guaglianone, C. (1998, January 1). Where have all the high school administrators gone?. Thrust for Educational Leadership 28, 10-14. (Eric Document Reproduction Service No. EJ575255). Retrieved December 18, 2007 from ERIC database.
105

106
Young, M., & Fuller, E. (2009, April). Tenure and retention of newly hired principals in Texas. Paper presented for the annual meeting of the American Education Research Association. Retrieved February 15, 2009 from http://www.ucea.org/storage/principal/AERA%202009_Principal%20Tenure%20and%20Retention%20in%20Texas%20of%20Newly%20Hired%20Principals.pdf
Zellner, L., Ward, S., McNamara, P., Gideon, B., Camacho, S., & Edgewood,
S. (2002), The loneliest job in town: Sculpting the recruitment and retention of the principal. (ERIC Document Reproduction Service No. ED468348). Retrieved December 18, 2007 from ERIC database.
Top Related