


Languages
Pages
Legal


Daniel SabinElectrotek Concepts, Beverly, Massachusetts, USA
Cristiana Dimitriu, John Foglio, and Frank DohertyThe Consolidated Edison Company of New York, USA
Detection, Location, and Analysis of Permanent and Incipient Faults at Con Edison

The Consolidated Edison Company of New York
• New York City and Westchester• Headquarters in Manhattan• 3.3 million Electric Customers• System Peak Load:13322 MW
on July 19, 2013• 62 Area Substations• 83 Secondary Networks and
Non-Network Load Pockets• 2247 Distribution Feeders• 87% System is Underground

Fault Detection and Analysis at Con Edison
• Location & Analysis of Permanent Faults on Network Feeders– Employs Waveforms from Bus-Level Power Quality
Monitors and Feeder Overcurrent Protection Digital Relays– Displays Estimated Fault Location in Tables and Maps
• Alarming on Faults in Out-of-Service Cable Fed by Network• Alarming on Potential Tap Changer Misoperation• Incipient Fault Detection, Notification, and Location• Overhead Fault Location for Momentary Faults
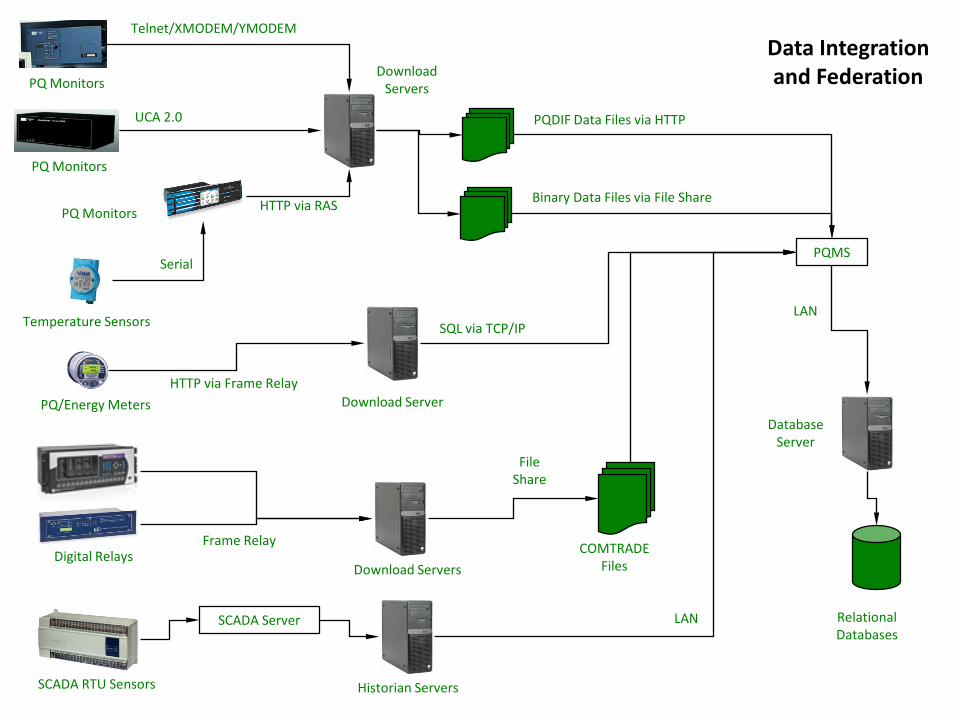
PQ Monitors
RelationalDatabases
PQMS
DatabaseServer
HTTP via RASPQ Monitors
DownloadServers
Telnet/XMODEM/YMODEM
PQDIF Data Files via HTTP
PQ Monitors
UCA 2.0
LAN
PQ/Energy MetersHTTP via Frame Relay
Download Server
Download ServersDigital Relays COMTRADE
Files
FileShare
SQL via TCP/IP
Historian ServersSCADA RTU Sensors
LAN
Frame Relay
SCADA Server
Data Integrationand Federation
Temperature Sensors
Serial
Binary Data Files via File Share

Area SubstationTransformer
Primary Feeders Secondary Network
A
B
C
Single Line to Ground Fault
• PQ Monitors at Low Side of Many Area Substation Transformers
• Digital Relay Data Available at 20% of Primary Feeders

Example SLG Fault Recorded by PQ Monitor at Area Substation
1A
-1.0
-0.5
0
0.5
1.0
-2
0
2
4
0 0.05 0.10 0.15
SHERMN4N - 9/9/2012 18:59:01.6880I²t=28.85 kA²·s
OperationPoint Name SCBX54N.DXTime Stamp 9/9/2012 18:59:05.0012Value S_CREEK BKR 54N 1X23Description CLOSE-TRIP
Volta
ge (p
u)Cu
rren
t (kA
)
Time (s)
Va Vb Vc Ia Ib Ic
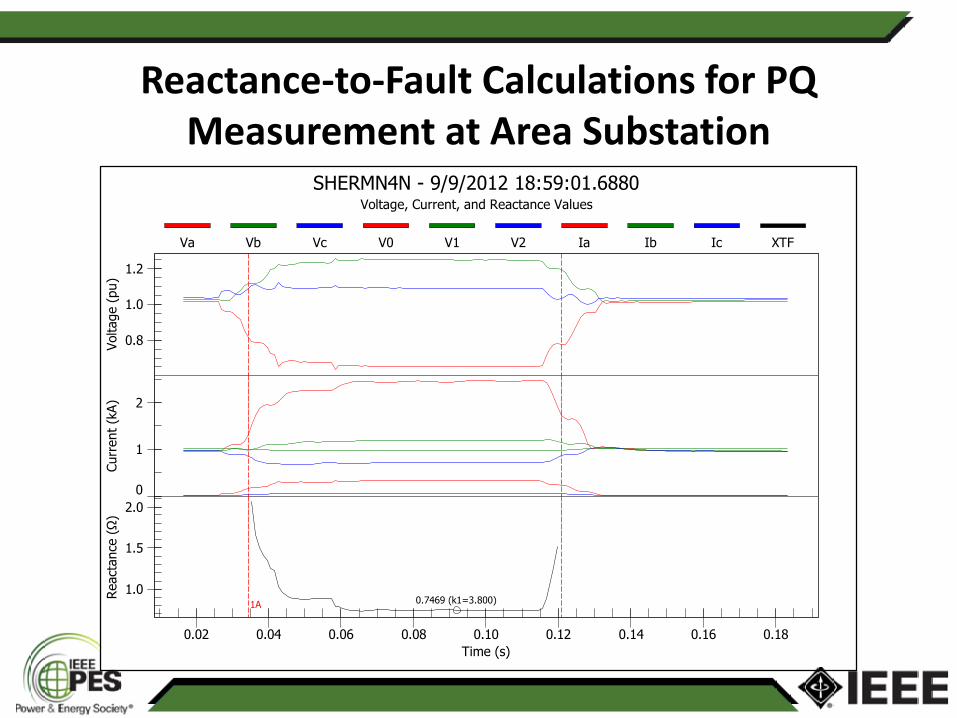
Reactance-to-Fault Calculations for PQ Measurement at Area Substation
1A 0.7469 (k1=3.800)
0.8
1.0
1.2
0
1
2
1.0
1.5
2.0
0.02 0.04 0.06 0.08 0.10 0.12 0.14 0.16 0.18
SHERMN4N - 9/9/2012 18:59:01.6880Voltage, Current, and Reactance Values
Volta
ge (p
u)Cu
rren
t (kA
)Re
acta
nce
(Ω)
Time (s)
Va Vb Vc V0 V1 V2 Ia Ib Ic XTF

Predicted Location of Fault by Matching Measured Reactance to Reactance of Circuit Model

Visualized Location of Fault

Distribution Fault Location Results
• On average, use of the reactance-to-fault method for fault location saves one hour per feeder restoration job
• Mitigates use of capacitive discharge thumpers and DC hi-pot
Year 0-1 MH 1-3 MH 3-5 MH 5-10 MH > 10 MH
2009 64% 24% 5% 2% 6%
2010 67% 14% 5% 3% 11%
2011 64% 20% 8% 3% 5%
Summer 2012 76% 14% 4% 4% 1%
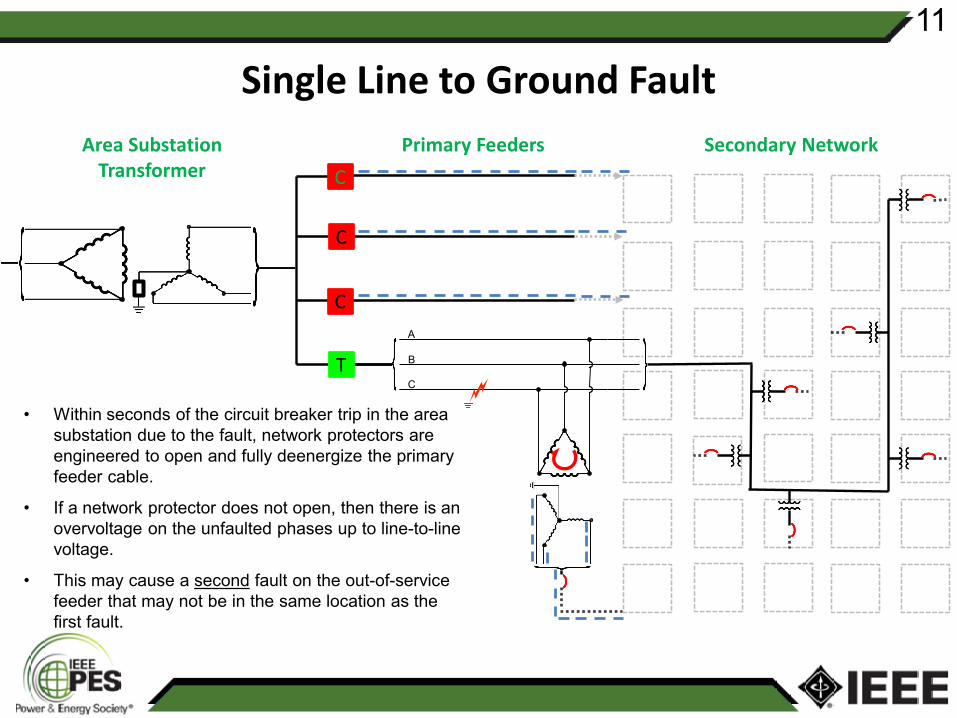
Single Line to Ground Fault
C
T
C
C
Area Substation Transformer
Primary Feeders Secondary Network
A
B
C
• Within seconds of the circuit breaker trip in the area substation due to the fault, network protectors are engineered to open and fully deenergize the primary feeder cable.
• If a network protector does not open, then there is an overvoltage on the unfaulted phases up to line-to-line voltage.
• This may cause a second fault on the out-of-service feeder that may not be in the same location as the first fault.
11

Capturing Waveforms during Second Faults and Sending Notifications
Secondary Network• Two Voltage Sags Recorded
by PQ Monitors at “Master Point”
• Only One SCADA OperationArea Substations• SLG Fault with Zero-
Sequence• Subsequent Negative-
Sequence Overcurrent• One SCADA Operation
PQ Monitor Retrofitted with Negative-Sequence Filter
12

Measurement of Second Fault Initiation Triggered by Negative-Sequence Filter
-100
-50
0
50
100
-2000
-1000
0
1000
2000
0 1 2 3 4 5 6 7 8 9 10 11
Volta
ge (%
)Cu
rren
t (A)
Time (c)
Va Vb Vc Ia Ib Ic
-2000
-1500
-1000
-500
0
500
1000
1500
2000
0 1 2 3 4 5 6 7 8 9 10 11
Curr
ent (
A)
Time (c)
Ia Ib Ic
Bonus: Lots of other potential problems can be captured by I2 triggering.
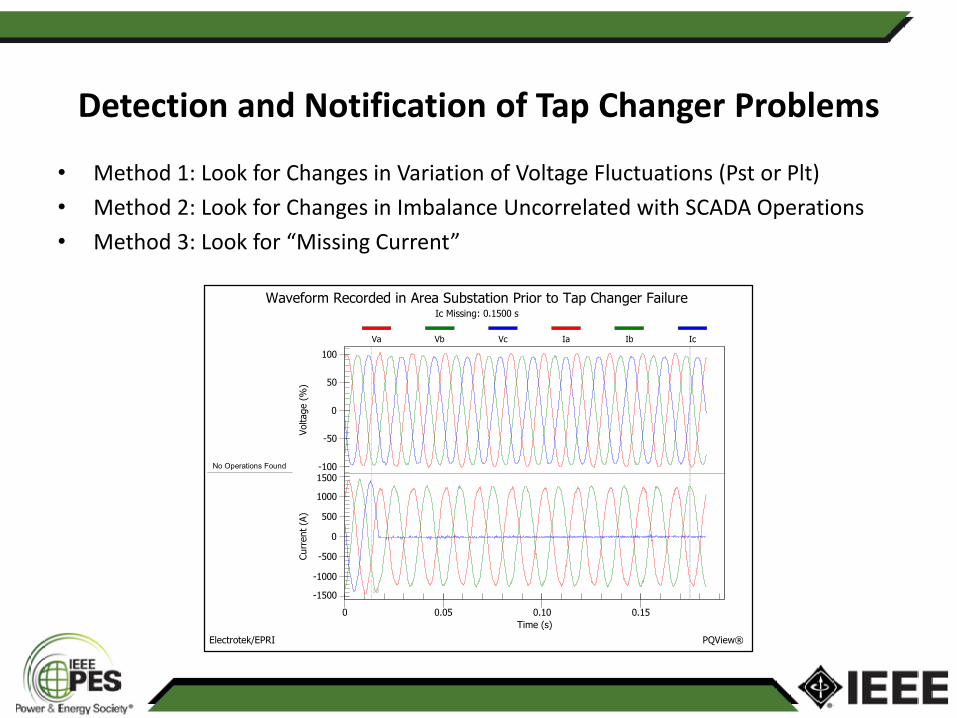
Detection and Notification of Tap Changer Problems
• Method 1: Look for Changes in Variation of Voltage Fluctuations (Pst or Plt)• Method 2: Look for Changes in Imbalance Uncorrelated with SCADA Operations• Method 3: Look for “Missing Current”
I0
-100
-50
0
50
100
-1500
-1000
-500
0
500
1000
1500
0 0.05 0.10 0.15
Waveform Recorded in Area Substation Prior to Tap Changer FailureIc Missing: 0.1500 s
Electrotek/EPRI PQView®
No Operations Found
Volta
ge (%
)Cu
rren
t (A)
Time (s)
Va Vb Vc Ia Ib Ic

Incipient Fault Identification and Notification
-1.0
-0.5
0
0.5
1.0
-2
0
2
4
0.5 1.0 1.5 2.0 2.5
Multiple Subcycle Faults - Possible Precursor to Permanent Fault
Volta
ge (p
u)Cu
rren
t (kA
)
Time (s)
Va Vb Vc Ia Ib Ic

Incipient Subcycle Fault LocationUsing Time-Domain Estimation
-1.0
-0.5
0
0.5
1.0
-3
-2
-1
0
0.35 0.40 0.45 0.50 0.55
Subcycle Incipient Fault
Volta
ge (p
u)Cu
rren
t (kA
)
Time (s)
Va Vb Vc Ia Ib Ic
Estimated XTF: 0.3235 Ω
Actual XTF: 0.3221 Ω
-1.0
-0.5
0
0.5
1.0
-5
0
5
10
0.35 0.40 0.45 0.50 0.55 0.60 0.65 0.70 0.75
Subsequent Permanent Fault
Volta
ge (p
u)Cu
rren
t (kA
)
Time (s)
Va Vb Vc Ia Ib Ic
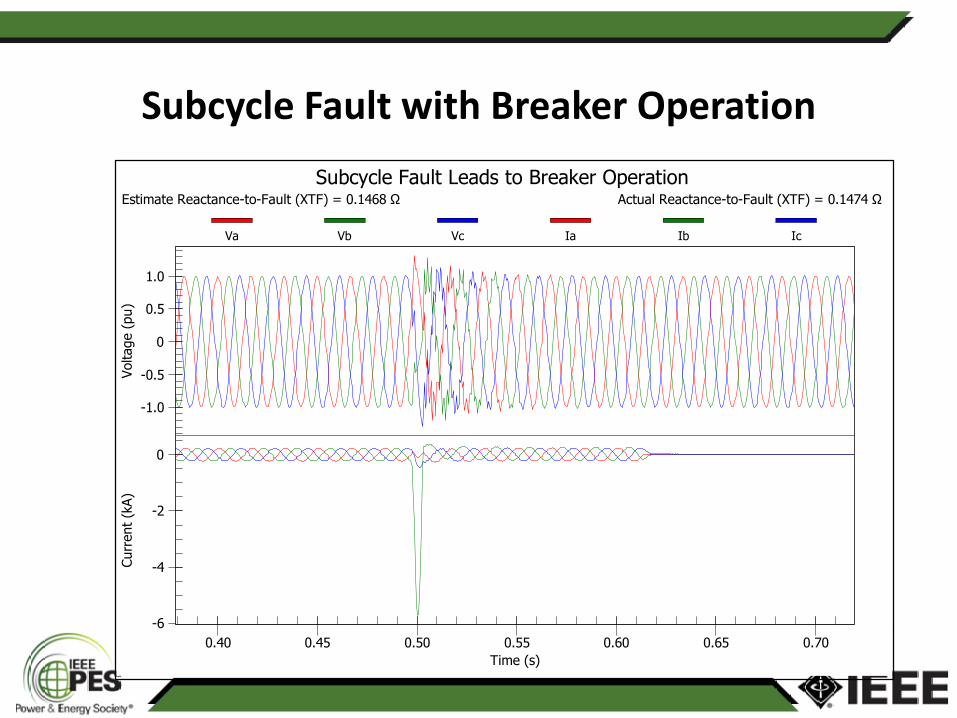
Subcycle Fault with Breaker Operation
-1.0
-0.5
0
0.5
1.0
-6
-4
-2
0
0.40 0.45 0.50 0.55 0.60 0.65 0.70
Subcycle Fault Leads to Breaker OperationEstimate Reactance-to-Fault (XTF) = 0.1468 Ω Actual Reactance-to-Fault (XTF) = 0.1474 Ω
Volta
ge (p
u)Cu
rren
t (kA
)
Time (s)
Va Vb Vc Ia Ib Ic

What’s Next: Fault Location in Overhead Distribution System
• New power quality monitors installed in Queens as part of the American Recovery and Reinvestment Act– New monitors installed to complete a pilot project on overhead fault location
with a primary goal to locate problem line sections or equipment after measuring momentary faults
• Radial feeder models from integrated from on company modeling software in 2013• SCADA correlation added in January 2014• Both resistance-to-fault and reactance-to-fault
will be explored• The project includes display of the feeders
using aerial imagery with one-line feeder overlays

For more information:Dan Sabin: [email protected] Dimitriu: [email protected] Foglio: [email protected] Doherty: [email protected]
Top Related