


Languages
Pages
Legal


Data SnapShot Series 1.0March 2015
DATA SNAPSHOTRush County
2
Hometown Collaboration InitiativeThis report has been produced by the Purdue Center for Regional Development as a part of the Indiana Hometown Collaboration Initiative (HCI). HCI is funded, in part, by the Indiana Office of Community and Rural Affairs.
Table of contents
Introduction01Demography02
Economy03Labor Market04

Purpose
About Rush County
01introductio
n

5
Purpose
This document provides information and data about Rush County that can be used to guide local decision-making activities.
The Data SnapShot showcases a variety of demographic, economic and labor market information that local leaders, community organizations and others can use to gain a better perspective on current conditions and opportunities in their county.
To strengthen the value and usability of the information, we showcase the data using a variety of visual tools such as charts, graphs and tables. In addition, we offer key points about the data as a way of assisting the user with the interpretation of the information presented.
Finally, short takeaway messages are offered at the end of each section in order to highlight some of the more salient findings.
Introduction
section 01
6
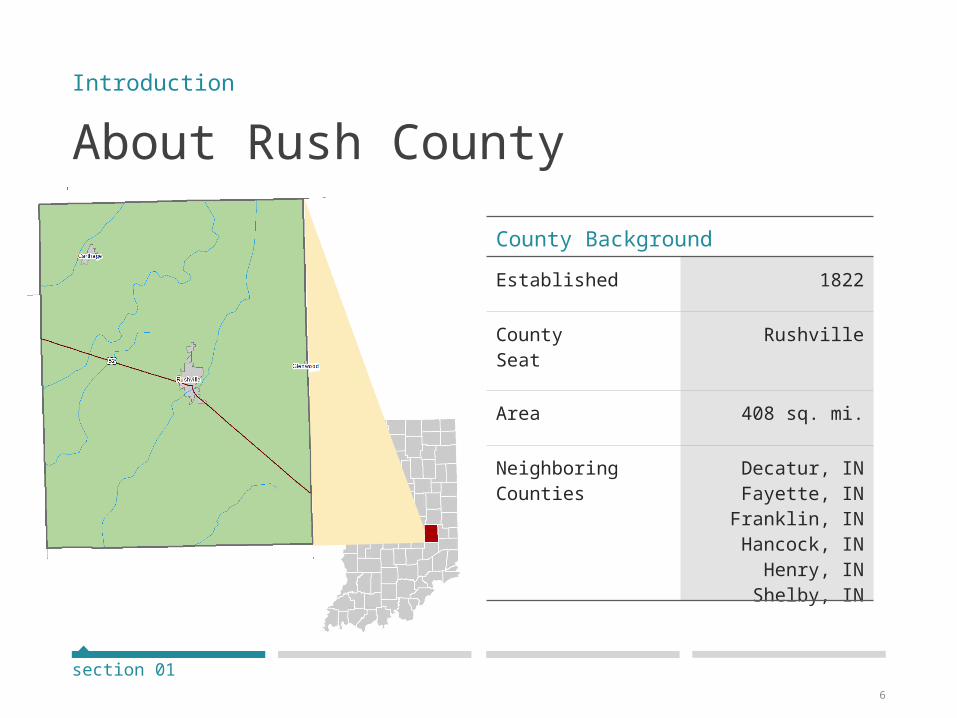
About Rush CountyIntroduction
section 01
County Background
Established 1822
CountySeat
Rushville
Area 408 sq. mi.
NeighboringCounties
Decatur, INFayette, INFranklin, IN
Hancock, INHenry, IN
Shelby, IN
Population change
Population pyramids
Race
Ethnicity
Educational attainment
Takeaways
02demograp
hy
8
18,261
17,392 17,0
04 16,551
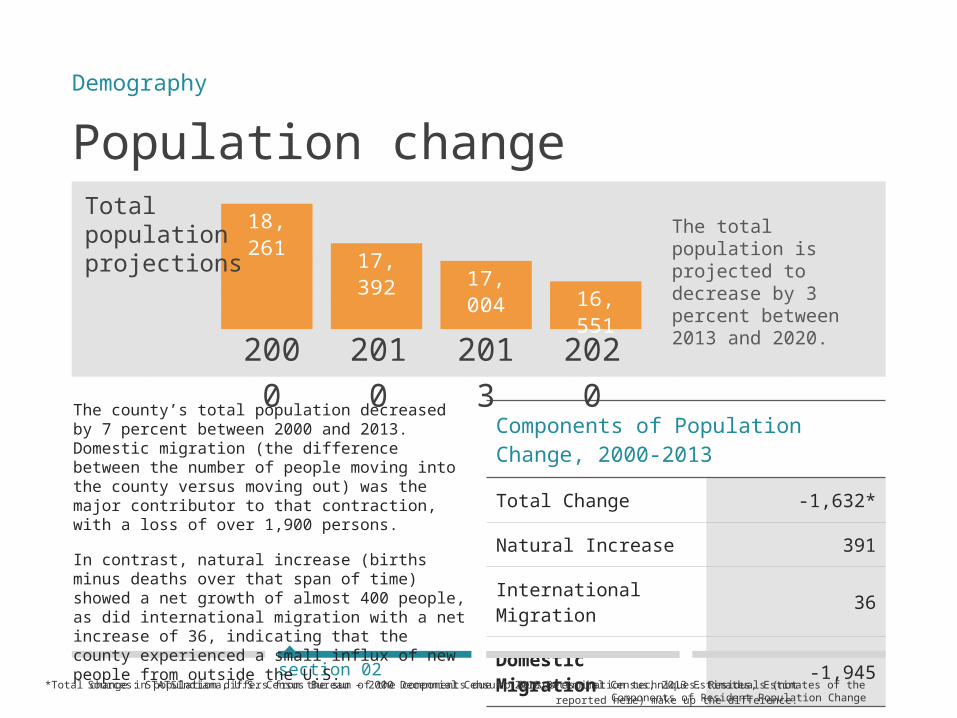
Population change
Components of Population Change, 2000-2013
Total Change -1,632*
Natural Increase 391
International Migration
36
Domestic Migration
-1,945
The total population is projected to decrease by 3 percent between 2013 and 2020.
Demography
Sources: STATSIndiana, U.S. Census Bureau – 2000 Decennial Census, 2010 Decennial Census, 2013 Estimates, Estimates of the Components of Resident Population Change
section 02
The county’s total population decreased by 7 percent between 2000 and 2013. Domestic migration (the difference between the number of people moving into the county versus moving out) was the major contributor to that contraction, with a loss of over 1,900 persons.
In contrast, natural increase (births minus deaths over that span of time) showed a net growth of almost 400 people, as did international migration with a net increase of 36, indicating that the county experienced a small influx of new people from outside the U.S.
Total population projections
2000
2010
2013
2020
*Total change in population differs from the sum of the components due to Census estimation techniques. Residuals (not reported here) make up the difference.
9
0-9
10-19
20-29
30-39
40-49
50-59
60-69
70-79
80+
9 6 3 0 3 6 9
6.0%
7.1%
5.4%
5.5%
7.1%
7.8%
5.3%
3.4%
1.7%
5.8%
6.9%
5.4%
5.5%
6.6%
7.7%
5.8%
4.0%
2.9%
Percent of Total PopulationA
ge C
oh
ort
0-9
10-19
20-29
30-39
40-49
50-59
60-69
70-79
80+
9 6 3 0 3 6 9
7.7%
7.3%
5.8%
7.3%
7.6%
5.4%
3.9%
2.9%
1.3%
7.0%
7.1%
5.5%
7.4%
7.4%
5.4%
4.4%
4.0%
2.8%
Percent of Total Population
Ag
e C
oh
ort
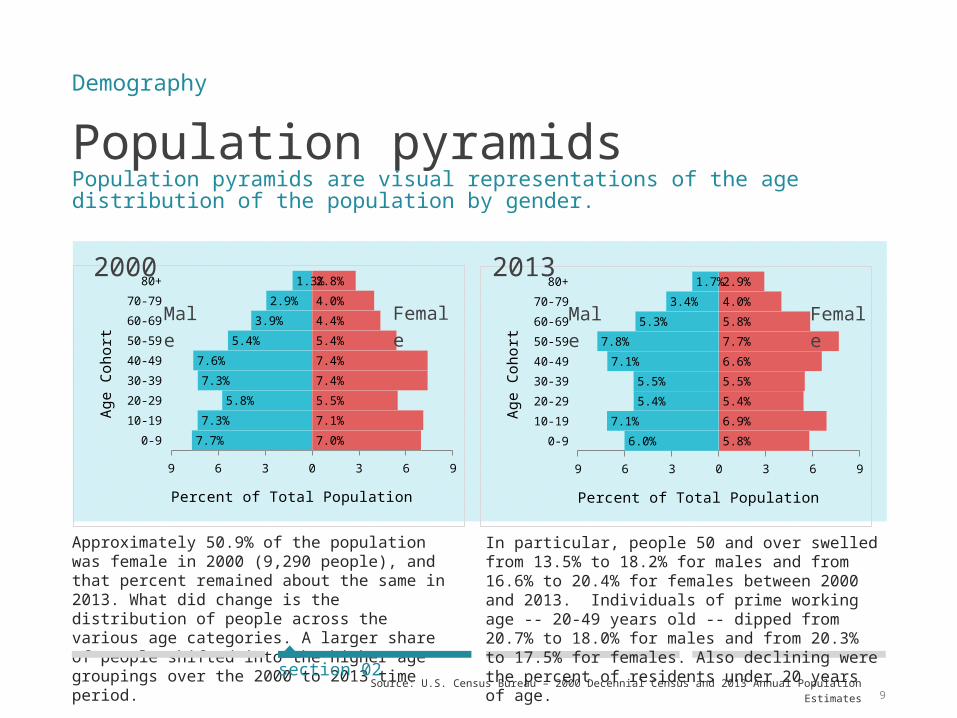
Population pyramidsPopulation pyramids are visual representations of the age distribution of the population by gender.
Approximately 50.9% of the population was female in 2000 (9,290 people), and that percent remained about the same in 2013. What did change is the distribution of people across the various age categories. A larger share of people shifted into the higher age groupings over the 2000 to 2013 time period.
Demography
Source: U.S. Census Bureau – 2000 Decennial Census and 2013 Annual Population Estimates
section 02
In particular, people 50 and over swelled from 13.5% to 18.2% for males and from 16.6% to 20.4% for females between 2000 and 2013. Individuals of prime working age -- 20-49 years old -- dipped from 20.7% to 18.0% for males and from 20.3% to 17.5% for females. Also declining were the percent of residents under 20 years of age.
Male
Female
20132000
Male
Female
10
White98%
Black
Asian
Native
Two or More Races
White98%
Black
Asian
Native
Two or More Races
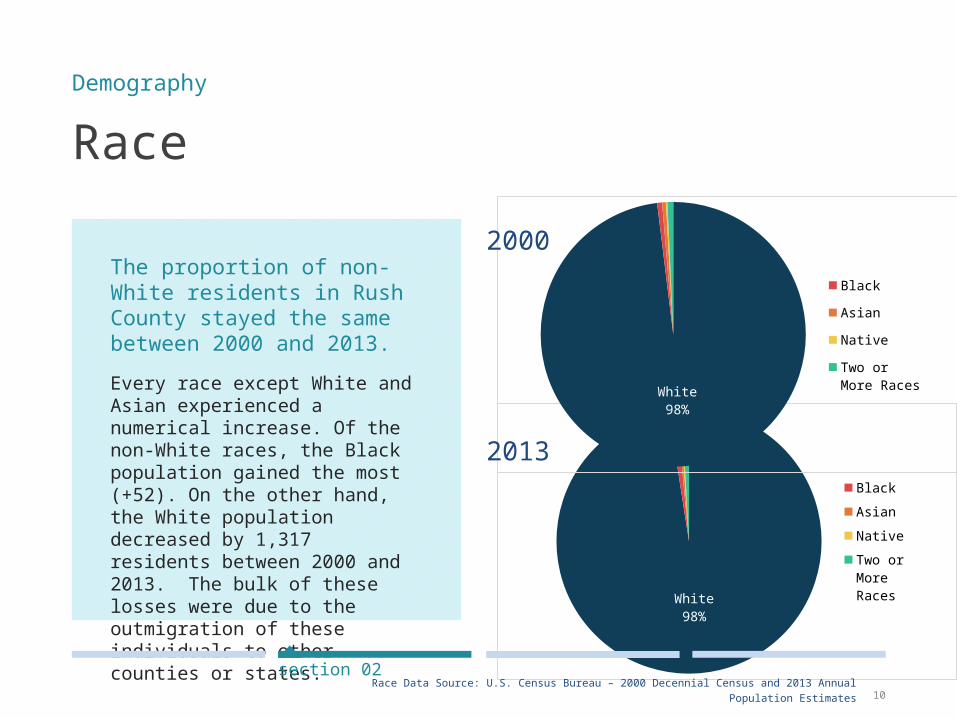
Race
The proportion of non-White residents in Rush County stayed the same between 2000 and 2013.
Every race except White and Asian experienced a numerical increase. Of the non-White races, the Black population gained the most (+52). On the other hand, the White population decreased by 1,317 residents between 2000 and 2013. The bulk of these losses were due to the outmigration of these individuals to other counties or states.
Demography
Race Data Source: U.S. Census Bureau – 2000 Decennial Census and 2013 Annual Population Estimates
section 02
2000
2013
11
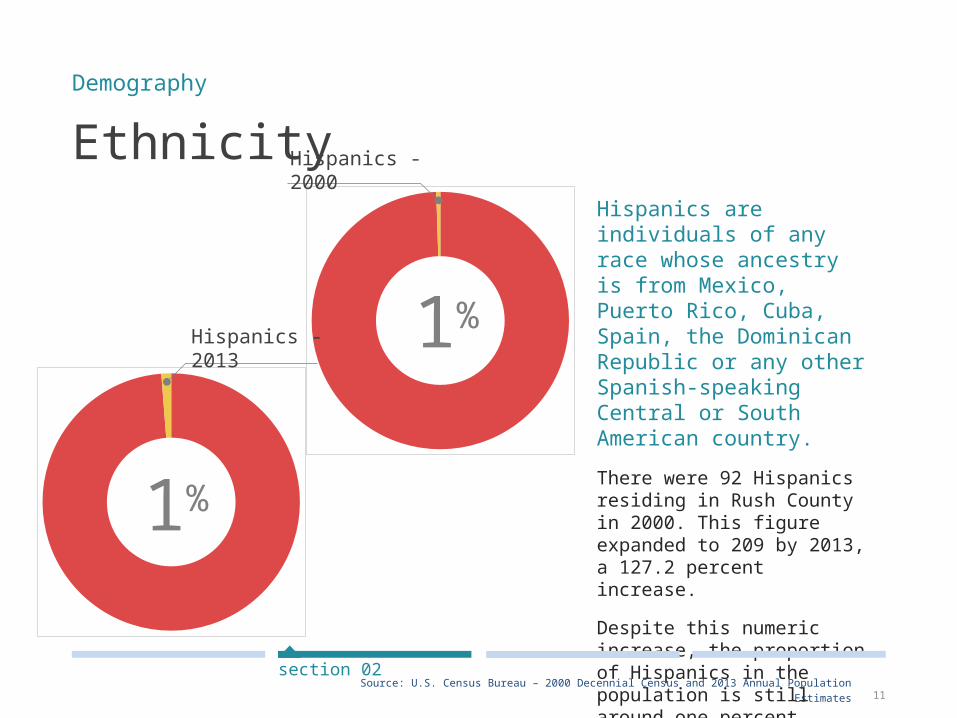
EthnicityHispanics are individuals of any race whose ancestry is from Mexico, Puerto Rico, Cuba, Spain, the Dominican Republic or any other Spanish-speaking Central or South American country.
There were 92 Hispanics residing in Rush County in 2000. This figure expanded to 209 by 2013, a 127.2 percent increase.
Despite this numeric increase, the proportion of Hispanics in the population is still around one percent.
Demography
Source: U.S. Census Bureau – 2000 Decennial Census and 2013 Annual Population Estimates
section 02
1%
1%
Hispanics - 2000
Hispanics - 2013
12
No High School;
20%
High School; 51%Some Col-lege; 14%
Asso-ciate's Degree;
4%
Bachelor's Degree or More; 10%
No High School;
13%
High School;
49%
Some Col-lege; 18%
Asso-ciate's Degree;
5%
Bachelor's Degree or More; 15%
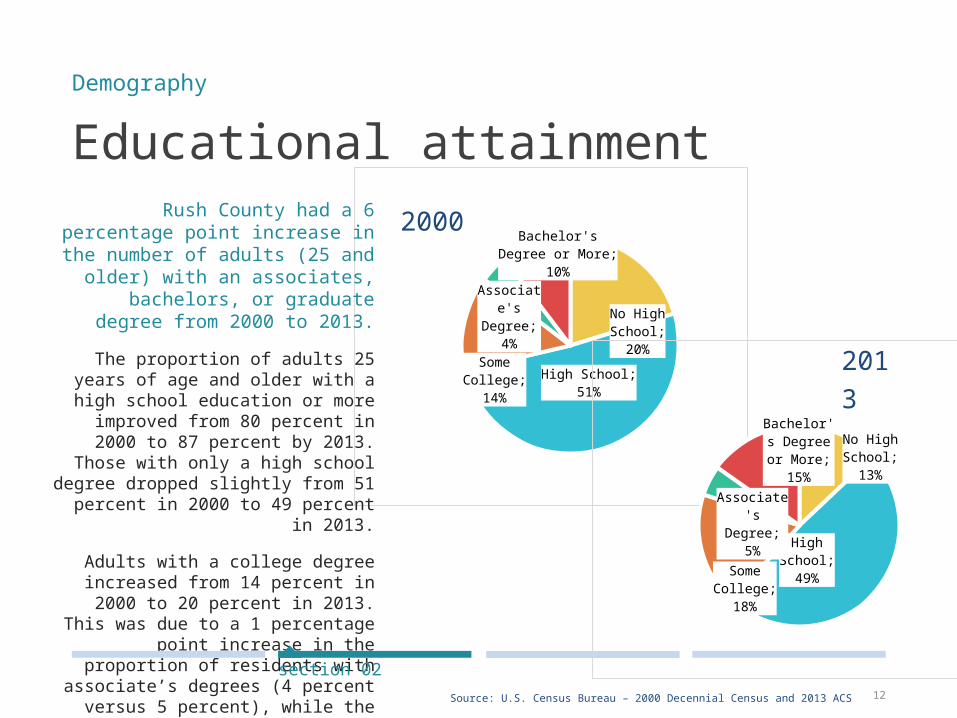
Educational attainment Rush County had a 6 percentage point increase in the number of
adults (25 and older) with an associates, bachelors, or
graduate degree from 2000 to 2013.
The proportion of adults 25 years of age and older with a high school
education or more improved from 80 percent in 2000 to 87 percent by
2013. Those with only a high school degree dropped slightly from 51 percent in 2000 to 49 percent in
2013.
Adults with a college degree increased from 14 percent in 2000 to
20 percent in 2013. This was due to a 1 percentage point increase in the
proportion of residents with associate’s degrees (4 percent
versus 5 percent), while the proportion of adults with at least a
bachelor's degree increased from 10 percent to 15 percent, a 5 percentage point growth.
.
Demography
Source: U.S. Census Bureau – 2000 Decennial Census and 2013 ACS
section 02
2000
2013

13
Takeaways The population of Rush County is expected to fall over the next few years, and, if past trends hold, that decrease will be largely due to domestic out-migration (more people moved out of the county for other U.S. locations than moved into the county).
In examining the composition of Rush County’s population, one finds an aging population in which the largest age group of workers (50-59) is nearing retirement age. Additionally, the number of men and women of prime working age (20-29, 30-39 and 40-49) is slowly declining. The racial and ethnic diversity of Rush County has not changed since 2000 and remains primarily white and non-Hispanic. In order to maintain the size of the labor force, Rush County will be challenged to find a way to retain and attract individuals and families of prime working age to the county.
The educational attainment of adults 25 and over has improved since 2000, but the percent of adults with a high school education remains sizable (at 49%). Taking time to assess whether local economic development opportunities might be impeded by the presence of a sizable number of adults with a terminal high school degree may be worthy of attention. While 1 in 5 adult residents of the county have an associates, bachelors, or higher education, this figure is about 12 percent below the figure for the state of Indiana as a whole.
Rush County may wish to assess the workforce skills of workers with a high school education only. Enhancing their skills so that they match the needs of local businesses and industries may be a worthy investment.
Demography
section 02

Establishments
Industries
Occupations
Income and poverty
Takeaways
03economy
15
Establishments
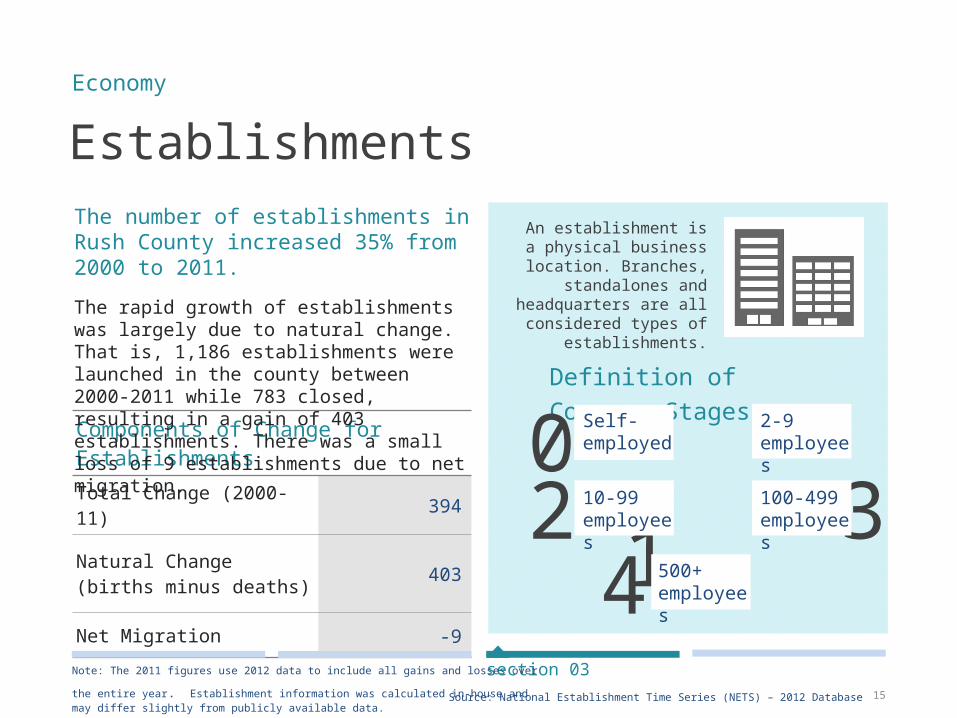
Components of Change for Establishments
Total Change (2000-11) 394
Natural Change (births minus deaths) 403
Net Migration -9
The number of establishments in Rush County increased 35% from 2000 to 2011.
The rapid growth of establishments was largely due to natural change. That is, 1,186 establishments were launched in the county between 2000-2011 while 783 closed, resulting in a gain of 403 establishments. There was a small loss of 9 establishments due to net migration.
Economy
Source: National Establishment Time Series (NETS) – 2012 Database
section 03
An establishment is a physical business
location. Branches, standalones and
headquarters are all considered types of
establishments.
Definition of Company Stages
0 12 3
4
Self-employed
2-9 employees
10-99employees
100-499employees
500+employees
Note: The 2011 figures use 2012 data to include all gains and losses over the entire
year. Establishment information was calculated in-house and may differ slightly from publicly available data.
16
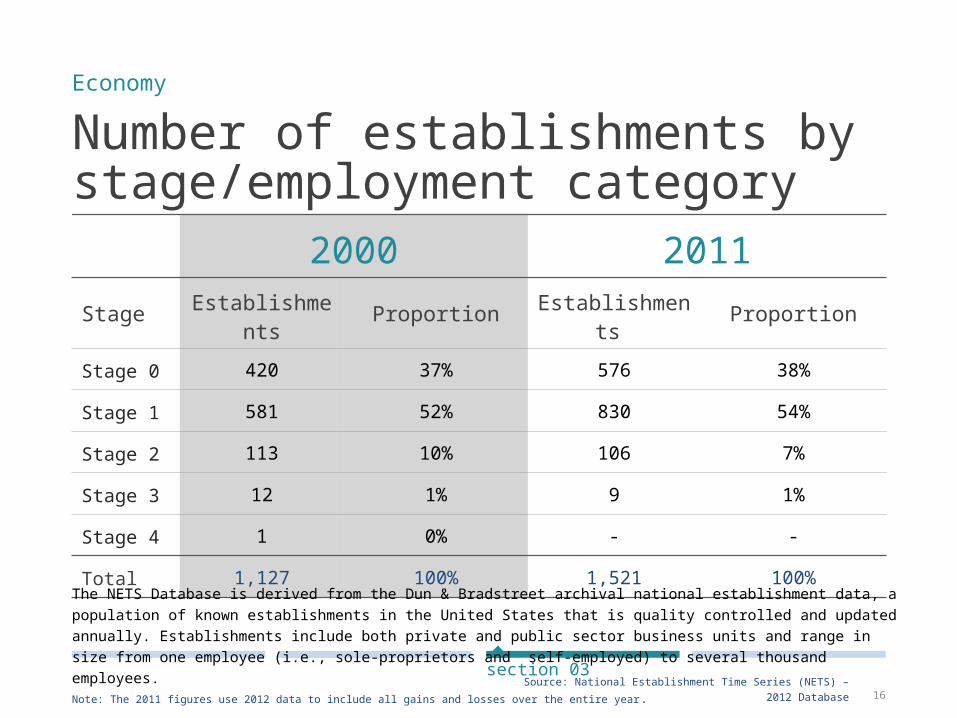
Number of establishments by stage/employment category
Economy
Source: National Establishment Time Series (NETS) – 2012 Database
section 03
2000 2011
Stage Establishments Proportion Establishment
s Proportion
Stage 0 420 37% 576 38%
Stage 1 581 52% 830 54%
Stage 2 113 10% 106 7%
Stage 3 12 1% 9 1%
Stage 4 1 0% - -
Total 1,127 100% 1,521 100%
Note: The 2011 figures use 2012 data to include all gains and losses over the entire year.
The NETS Database is derived from the Dun & Bradstreet archival national establishment data, a population of known establishments in the United States that is quality controlled and updated annually. Establishments include both private and public sector business units and range in size from one employee (i.e., sole-proprietors and self-employed) to several thousand employees.
17
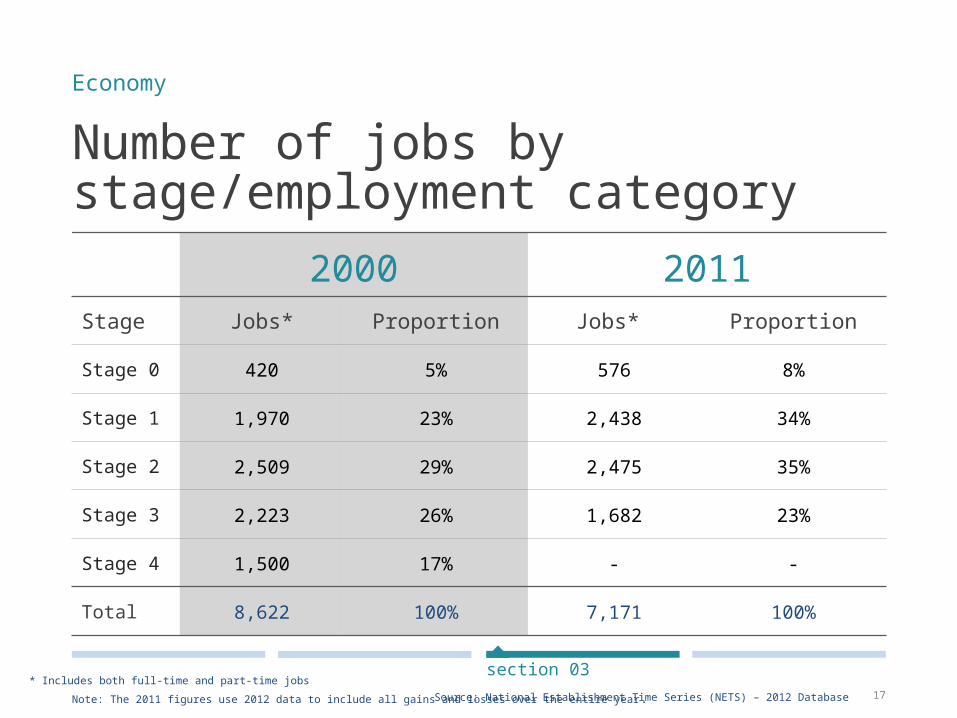
Number of jobs by stage/employment category
Economy
Source: National Establishment Time Series (NETS) – 2012 Database
section 03
2000 2011Stage Jobs* Proportion Jobs* Proportion
Stage 0 420 5% 576 8%
Stage 1 1,970 23% 2,438 34%
Stage 2 2,509 29% 2,475 35%
Stage 3 2,223 26% 1,682 23%
Stage 4 1,500 17% - -
Total 8,622 100% 7,171 100%
Note: The 2011 figures use 2012 data to include all gains and losses over the entire year.* Includes both full-time and part-time jobs
18
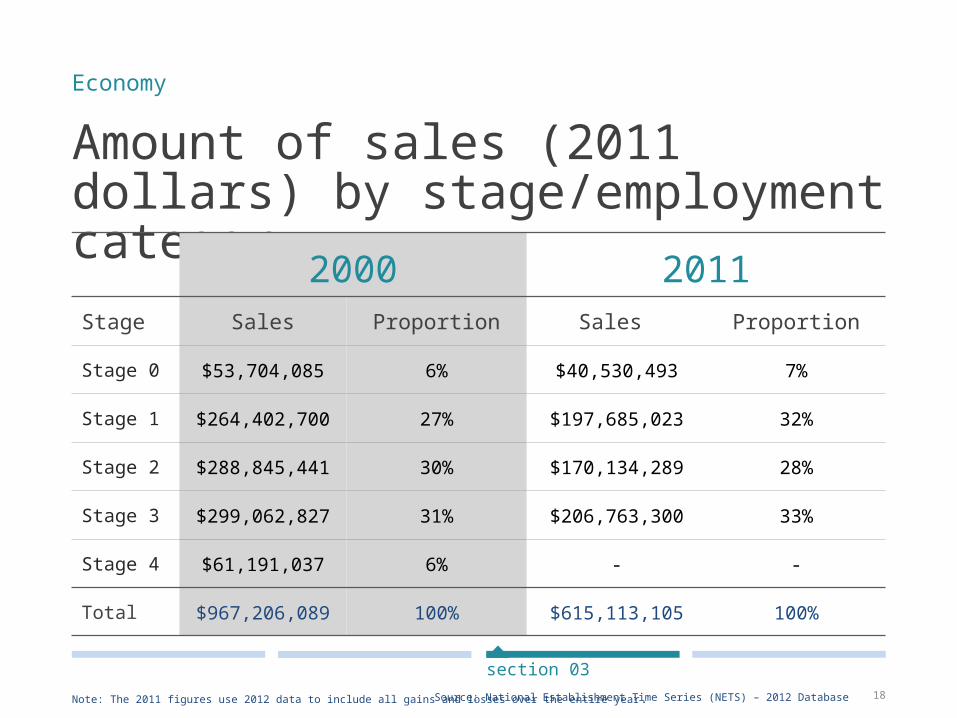
Amount of sales (2011 dollars) by stage/employment category
Economy
Source: National Establishment Time Series (NETS) – 2012 Database
section 03
2000 2011Stage Sales Proportion Sales Proportion
Stage 0 $53,704,085 6% $40,530,493 7%
Stage 1 $264,402,700 27% $197,685,023 32%
Stage 2 $288,845,441 30% $170,134,289 28%
Stage 3 $299,062,827 31% $206,763,300 33%
Stage 4 $61,191,037 6% - -
Total $967,206,089 100% $615,113,105 100%
Note: The 2011 figures use 2012 data to include all gains and losses over the entire year.
19
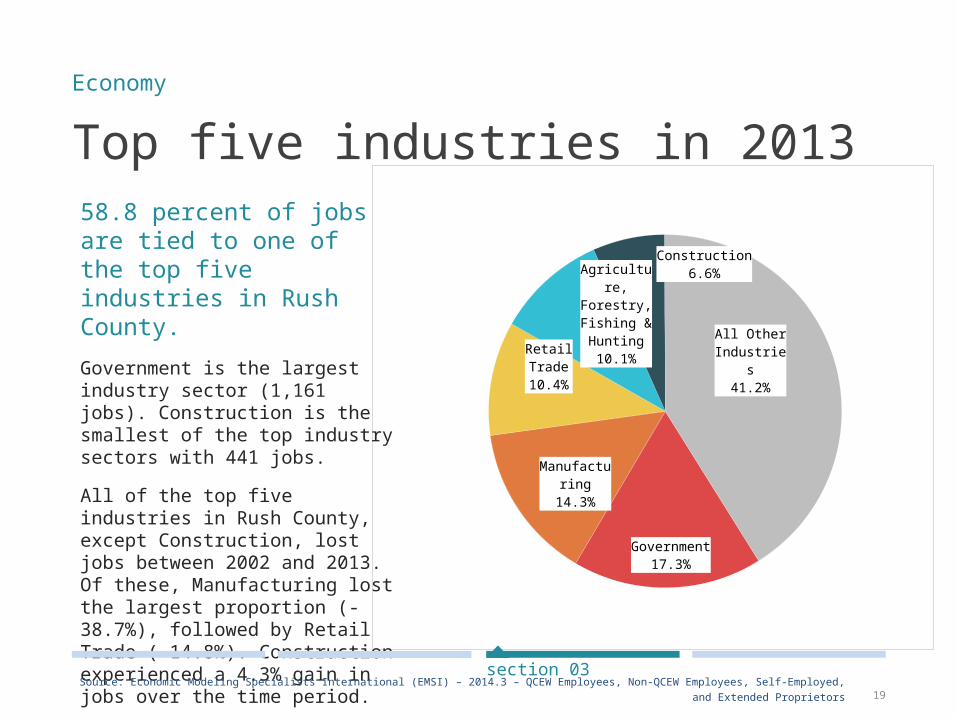
Government17.3%
Manufacturing14.3%
Retail Trade10.4%
Agriculture, Forestry, Fish-ing & Hunting
10.1%
Construction6.6%
All Other Industries
41.2%
Top five industries in 201358.8 percent of jobs are tied to one of the top five industries in Rush County.
Government is the largest industry sector (1,161 jobs). Construction is the smallest of the top industry sectors with 441 jobs.
All of the top five industries in Rush County, except Construction, lost jobs between 2002 and 2013. Of these, Manufacturing lost the largest proportion (-38.7%), followed by Retail Trade (-14.8%). Construction experienced a 4.3% gain in jobs over the time period.
Economy
Source: Economic Modeling Specialists International (EMSI) – 2014.3 – QCEW Employees, Non-QCEW Employees, Self-Employed, and Extended Proprietors
section 03
20
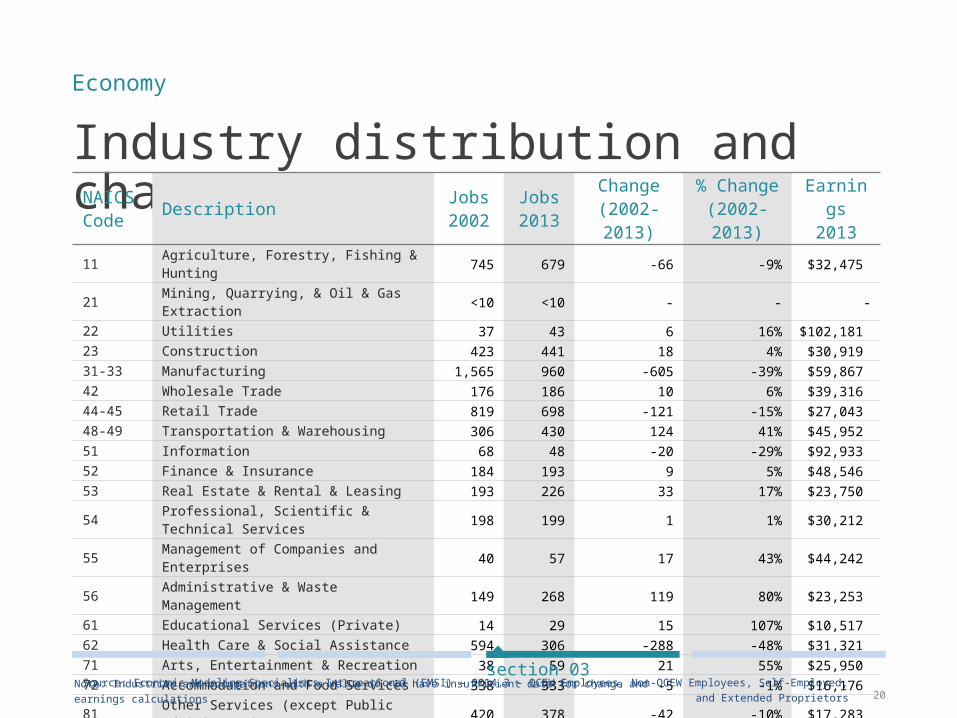
Industry distribution and changeNAICS Code Description Jobs
2002Jobs 2013
Change (2002-2013)
% Change (2002-2013)
Earnings 2013
11 Agriculture, Forestry, Fishing & Hunting 745 679 -66 -9% $32,475
21Mining, Quarrying, & Oil & Gas Extraction <10 <10 - - -
22 Utilities 37 43 6 16% $102,181 23 Construction 423 441 18 4% $30,919 31-33 Manufacturing 1,565 960 -605 -39% $59,867 42 Wholesale Trade 176 186 10 6% $39,316 44-45 Retail Trade 819 698 -121 -15% $27,043 48-49 Transportation & Warehousing 306 430 124 41% $45,952 51 Information 68 48 -20 -29% $92,933 52 Finance & Insurance 184 193 9 5% $48,546 53 Real Estate & Rental & Leasing 193 226 33 17% $23,750
54Professional, Scientific & Technical Services 198 199 1 1% $30,212
55Management of Companies and Enterprises 40 57 17 43% $44,242
56 Administrative & Waste Management 149 268 119 80% $23,253 61 Educational Services (Private) 14 29 15 107% $10,517 62 Health Care & Social Assistance 594 306 -288 -48% $31,321 71 Arts, Entertainment & Recreation 38 59 21 55% $25,950 72 Accommodation and Food Services 338 333 -5 -1% $16,176
81Other Services (except Public Administration) 420 378 -42 -10% $17,283
90 Government 1,242 1,161 -81 -7% $44,469 99 Unclassified Industry 0 0 0 0% $0 All Total 7,555 6,702 -853 -11% $37,673
Economy
Source: Economic Modeling Specialists International (EMSI) – 2014.3 – QCEW Employees, Non-QCEW Employees, Self-Employed, and Extended Proprietors
section 03Note: Industries and occupations with a value of <10 have insufficient data for change and earnings calculations.
21
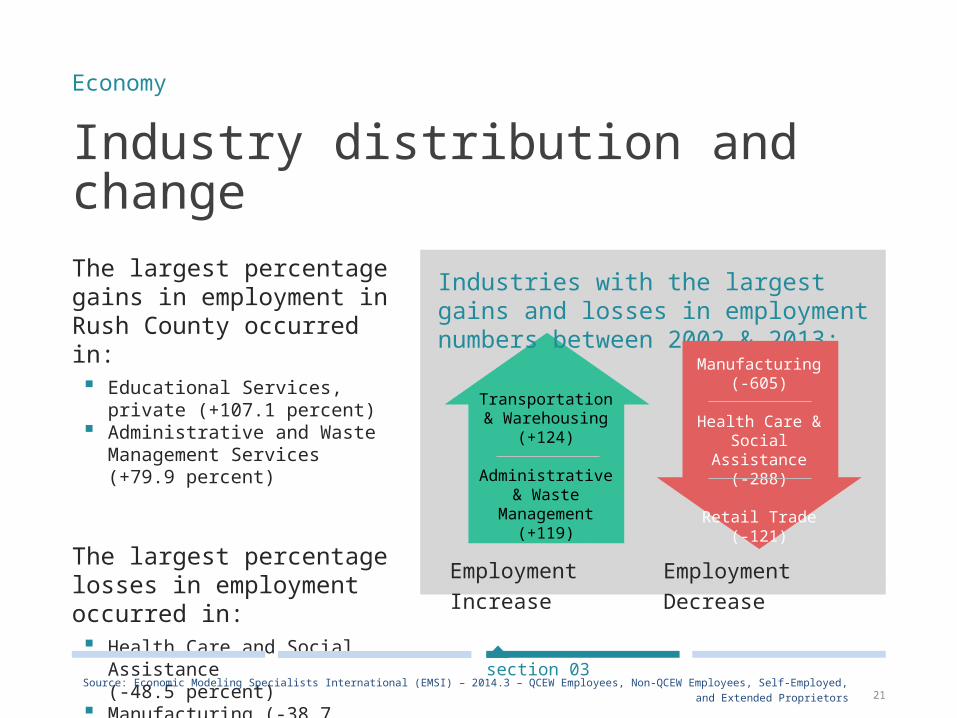
Industry distribution and change
The largest percentage gains in employment in Rush County occurred in: Educational Services, private
(+107.1 percent) Administrative and Waste
Management Services (+79.9 percent)
The largest percentage losses in employment occurred in: Health Care and Social
Assistance(-48.5 percent)
Manufacturing (-38.7 percent)
Economy
Source: Economic Modeling Specialists International (EMSI) – 2014.3 – QCEW Employees, Non-QCEW Employees, Self-Employed, and Extended Proprietors
section 03
Employment Increase
Employment Decrease
Industries with the largest gains and losses in employment numbers between 2002 & 2013:
Transportation & Warehousing
(+124)
Administrative & Waste
Management(+119)
Manufacturing(-605)
Health Care & Social
Assistance(-288)
Retail Trade(-121)
22
Management11.6%
Sales & Re-lated 11.3%
Production 11.2%
Office & Administra-tive Support
10.4%
Transportation & Material Moving
8.9%
All Other Occupations
46.6%
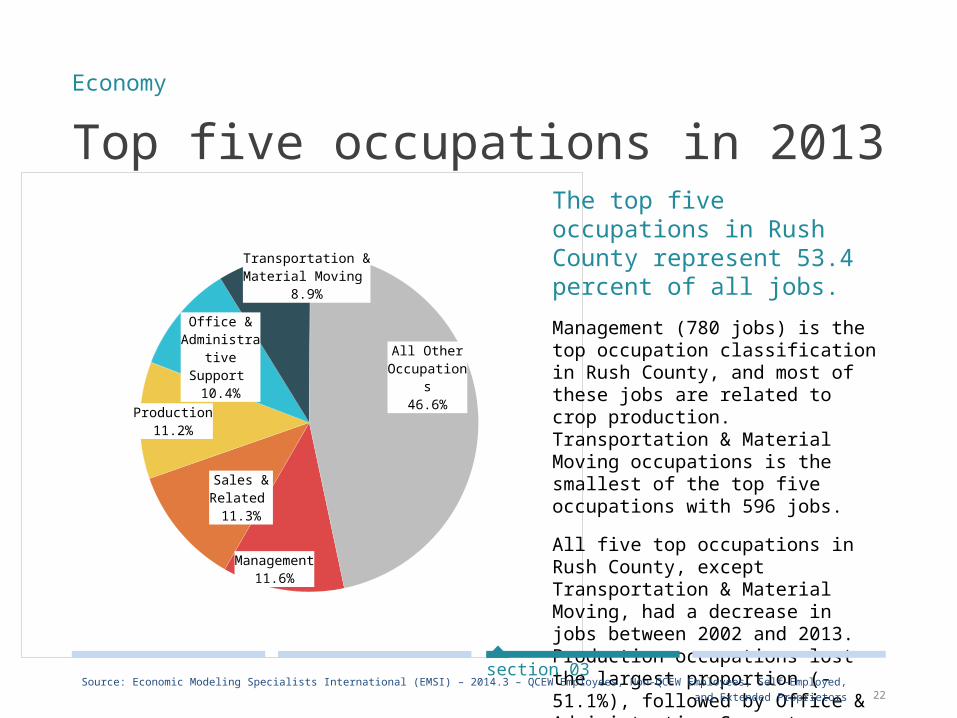
Top five occupations in 2013The top five occupations in Rush County represent 53.4 percent of all jobs.
Management (780 jobs) is the top occupation classification in Rush County, and most of these jobs are related to crop production. Transportation & Material Moving occupations is the smallest of the top five occupations with 596 jobs.
All five top occupations in Rush County, except Transportation & Material Moving, had a decrease in jobs between 2002 and 2013. Production occupations lost the largest proportion (-51.1%), followed by Office & Administrative Support occupations (-19.1%). Transportation & Material Moving occupations had a 9.6% increase in jobs over the time period.
Economy
Source: Economic Modeling Specialists International (EMSI) – 2014.3 – QCEW Employees, Non-QCEW Employees, Self-Employed, and Extended Proprietors
section 03

23
SOC Description Jobs
2002Jobs 2013
Change (2002-2013)
% Change (2002-2013)
Hourly Earnings
201311 Management 870 780 -90 -10% $18.17 13 Business & Financial Operations 217 196 -21 -10% $23.31 15 Computer & Mathematical 42 33 -9 -21% $24.14 17 Architecture & Engineering 83 56 -27 -33% $26.14 19 Life, Physical & Social Science 20 17 -3 -15% $23.48 21 Community & Social Service 145 66 -79 -54% $18.98 23 Legal 31 28 -3 -10% $33.55 25 Education, Training & Library 318 394 76 24% $17.70
27Arts, Design, Entertainment, Sports & Media 119 106 -13 -11% $16.61
29 Health Care Practitioners & Technical 303 256 -47 -16% $25.01 31 Health Care Support 165 133 -32 -19% $11.24 33 Protective Service 139 96 -43 -31% $16.00 35 Food Preparation & Serving Related 403 382 -21 -5% $9.58
37Building & Grounds Cleaning Maintenance 219 255 36 16% $10.01
39 Personal Care & Service 281 232 -49 -17% $9.29 41 Sales & Related 812 760 -52 -6% $13.40 43 Office & Administrative Support 830 697 -133 -16% $14.30 45 Farming, Fishing & Forestry 116 124 8 7% $13.63 47 Construction & Extraction 369 367 -2 -1% $15.27 49 Installation, Maintenance & Repair 317 288 -29 -9% $17.88 51 Production 1,132 749 -383 -34% $15.90 53 Transportation & Material Moving 539 596 57 11% $15.78 55 Military 59 55 -4 -7% $19.29 99 Unclassified 26 38 12 46% $20.30 All Total 7,555 6,702 -853 -11% $15.79
Occupation distribution and change
Economy
Source: Economic Modeling Specialists International (EMSI) – 2014.3 – QCEW Employees, Non-QCEW Employees, Self-Employed, and Extended Proprietors
section 03Note: Industries and occupations with a value of <10 have insufficient data for change and earnings calculations.

24
Occupation distribution and change
Economy
Source: Economic Modeling Specialists International (EMSI) – 2014.3 – QCEW Employees, Non-QCEW Employees, Self-Employed, and Extended Proprietors
section 03
The largest percentage gains in employment in Rush County occurred in: Unclassified (+46.2 percent) Education, Training, & Library
(+23.9 percent)
The largest percentage loss in employment occurred in: Community and Social Service
(-54.5 percent) Production (-33.8 percent)
Occupations with the largest gains and losses in employment numbers between 2002 & 2013:
Education, Training &
Library(+76)
Transportation & Material Moving
(+57)
Production(-383)
Office & Administrative
(-133)
Employment Increase
Employment Decrease
25
Income and poverty
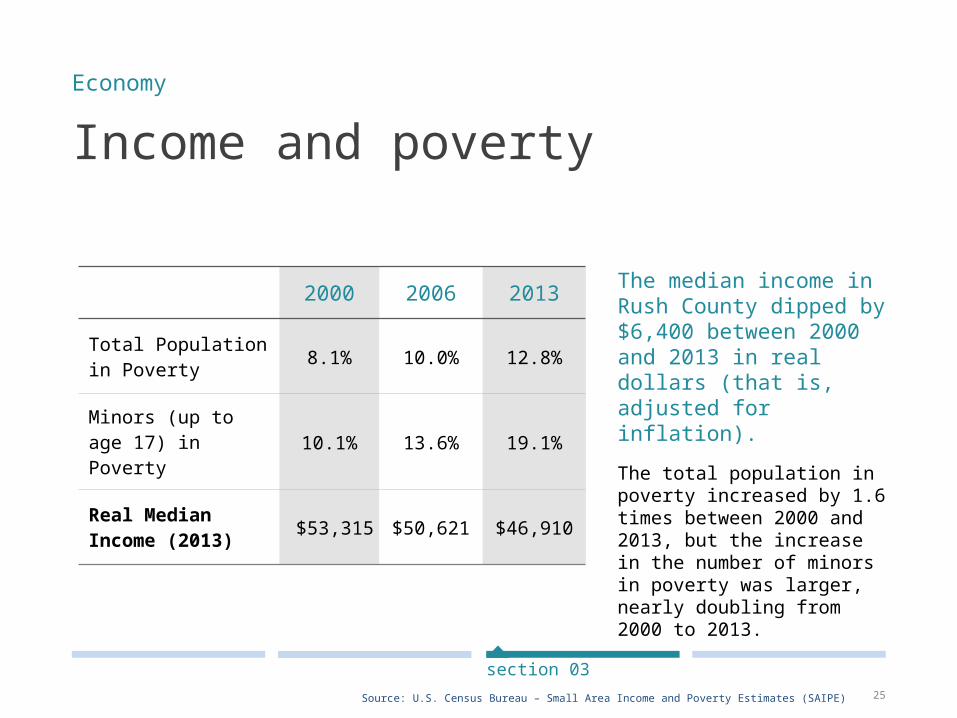
2000 2006 2013
Total Population in Poverty 8.1% 10.0% 12.8%
Minors (up to age 17) in Poverty 10.1% 13.6% 19.1%
Real Median Income (2013) $53,315 $50,621 $46,910
The median income in Rush County dipped by $6,400 between 2000 and 2013 in real dollars (that is, adjusted for inflation).
The total population in poverty increased by 1.6 times between 2000 and 2013, but the increase in the number of minors in poverty was larger, nearly doubling from 2000 to 2013.
Economy
Source: U.S. Census Bureau – Small Area Income and Poverty Estimates (SAIPE)
section 03

26
2000
2001
2002
2003
2004
2005
2006
2007
2008
2009
2010
2011
2012
2013
42,000
44,000
46,000
48,000
50,000
52,000
54,000
0
4
8
12
16
20
24
Real M
edia
n Inco
me (
2013 d
olla
rs)
Popula
tion in
Pove
rty
(perc
ent)
Median In-come
Minors in Poverty
All Ages in Poverty
Income and povertyMedian income in Rush County has been on a decline since 2004, although it is now improving. Poverty rates for adults and minors have stabilized over the past two years, although the rates remain high relative to the early 2000s.
Economy
Source: U.S. Census Bureau – Small Area Income and Poverty Estimates (SAIPE)
section 03

27
Takeaways Growth in the number of establishments in Rush County occurred in businesses having fewer than 10 employees (the self-employed and Stage 1 enterprises), components of the local economy that are often overlooked by local leaders.
Rush County might consider focusing on economic development efforts that seek to strengthen high-growth Stage 1 and 2 establishments, since they employ several people and capture sizable sales, although these sales have suffered in recent years. The number of establishments that have gone out of business is sizable, offering an opportunity to consider ways to help more establishments survive and thrive.
Real median income has gradually decreased and poverty has increased in Rush County since 2000. While poverty rates for minors and the total population have stabilized since 2010, they remain considerably higher than was the case in 2000.
The decline in real median income experienced between 2004 and 2013 may be tied to employment changes in various industries in the county during that time period. The largest employment loss occurred in an industry paying average earnings of $60,000 and occupations paying $15/hour to $20/hour between 2000 and 2013. At the same time, most of the industries that experienced job gains paid average earnings of $24,000 to $46,000 and very few occupations gained jobs. Without question, the nation’s difficult economic times during the 2007-09 period did seem to leave its mark in Rush County.
No doubt, the ability of Rush County to capture good paying jobs will depend on the availability of a well-trained and educated workforce, something that may be challenging in light of the smaller percentage of adults in the county with an associates degree or higher. Ensuring that a skilled workforce is available to support the key industries in the county will be important to the economic stability of the county.
Economy
section 03

Labor force and unemployment
Commuteshed
Laborshed
Takeaways
04labor
market
29
Labor force and unemployment
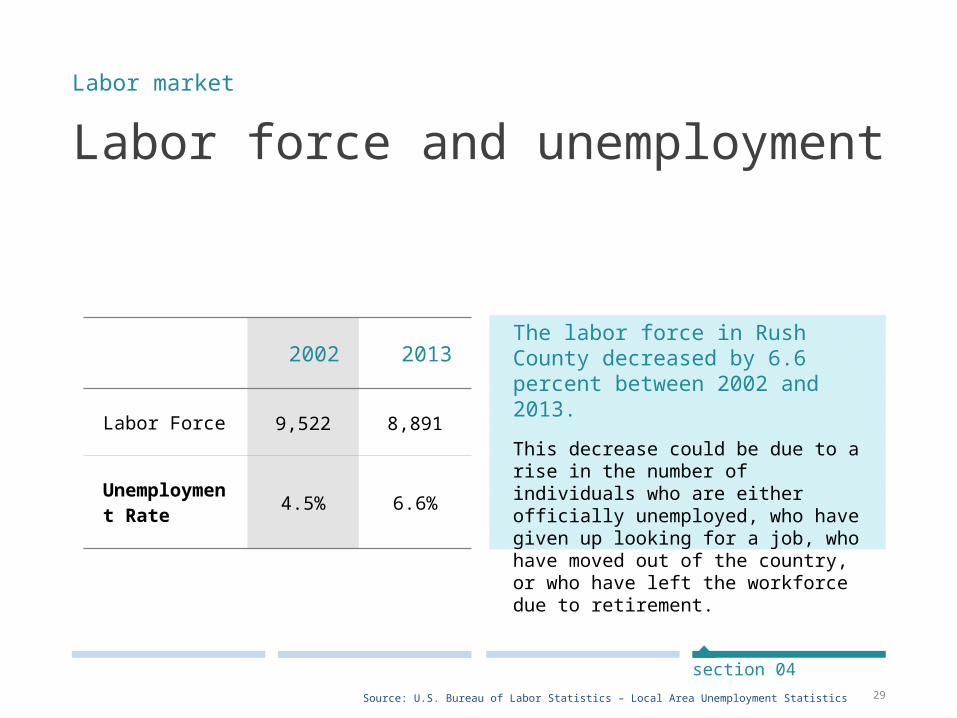
2002 2013
Labor Force 9,522 8,891
Unemployment Rate 4.5% 6.6%
The labor force in Rush County decreased by 6.6 percent between 2002 and 2013.
This decrease could be due to a rise in the number of individuals who are either officially unemployed, who have given up looking for a job, who have moved out of the country, or who have left the workforce due to retirement.
Labor market
Source: U.S. Bureau of Labor Statistics – Local Area Unemployment Statistics
section 04
30
20002001
20022003
20042005
20062007
20082009
20102011
20122013
0.0
2.0
4.0
6.0
8.0
10.0
12.0
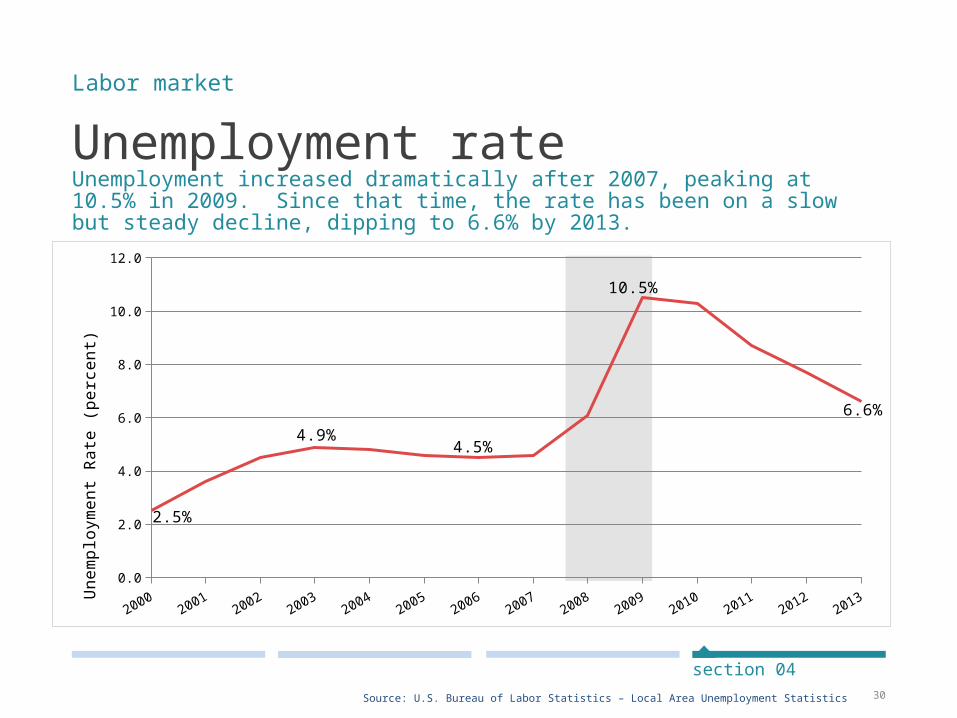
2.5%
4.9%4.5%
10.5%
6.6%
Unem
plo
yment
Rate
(perc
ent)
Unemployment rateUnemployment increased dramatically after 2007, peaking at 10.5% in 2009. Since that time, the rate has been on a slow but steady decline, dipping to 6.6% by 2013.
Labor market
Source: U.S. Bureau of Labor Statistics – Local Area Unemployment Statistics
section 04
31
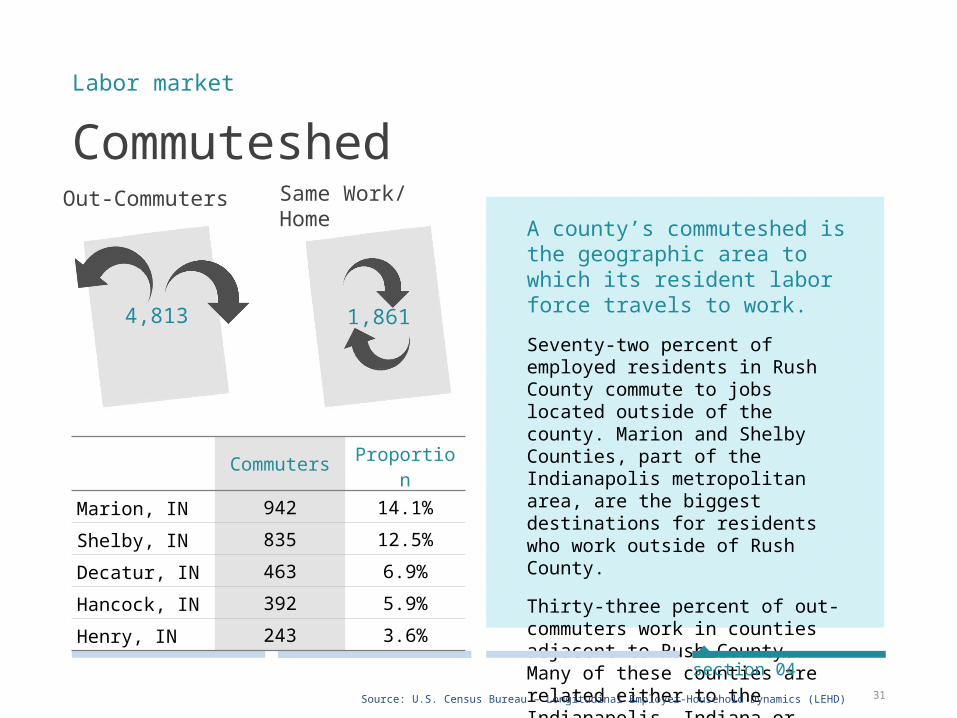
Commuteshed
A county’s commuteshed is the geographic area to which its resident labor force travels to work.
Seventy-two percent of employed residents in Rush County commute to jobs located outside of the county. Marion and Shelby Counties, part of the Indianapolis metropolitan area, are the biggest destinations for residents who work outside of Rush County.
Thirty-three percent of out-commuters work in counties adjacent to Rush County. Many of these counties are related either to the Indianapolis, Indiana or Cincinnati, Ohio metropolitan areas.
Labor market
Source: U.S. Census Bureau – Longitudinal Employer-Household Dynamics (LEHD)
section 04
4,813
Out-Commuters
1,861
Same Work/Home
Commuters Proportion
Marion, IN 942 14.1%
Shelby, IN 835 12.5%
Decatur, IN 463 6.9%
Hancock, IN 392 5.9%
Henry, IN 243 3.6%
32
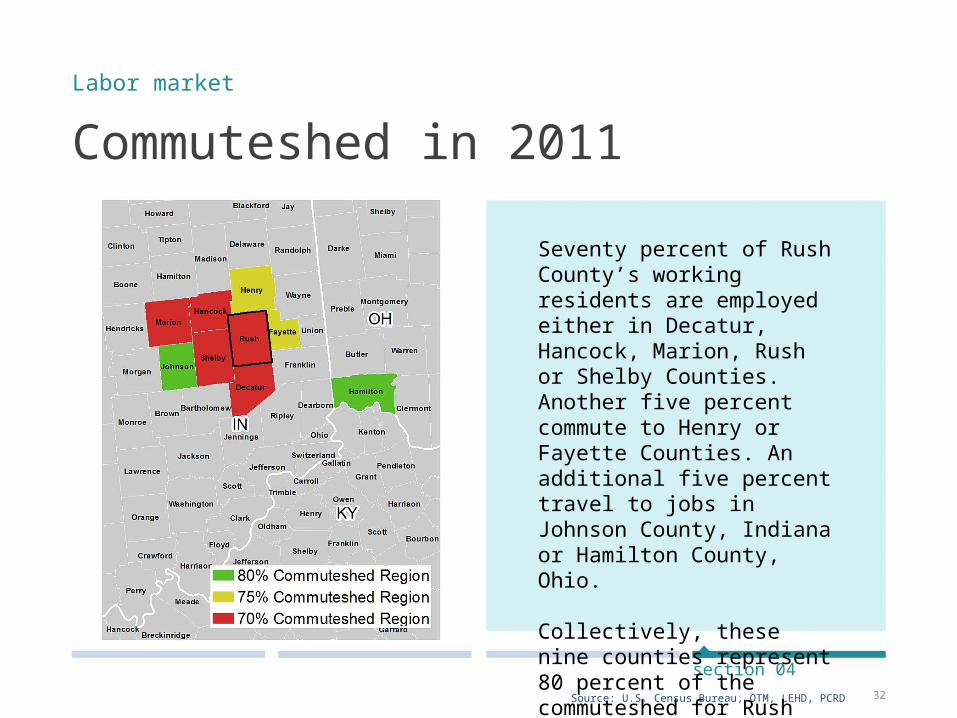
Commuteshed in 2011Labor market
section 04
Source: U.S. Census Bureau, OTM, LEHD, PCRD
Seventy percent of Rush County’s working residents are employed either in Decatur, Hancock, Marion, Rush or Shelby Counties. Another five percent commute to Henry or Fayette Counties. An additional five percent travel to jobs in Johnson County, Indiana or Hamilton County, Ohio.
Collectively, these nine counties represent 80 percent of the commuteshed for Rush County.
33
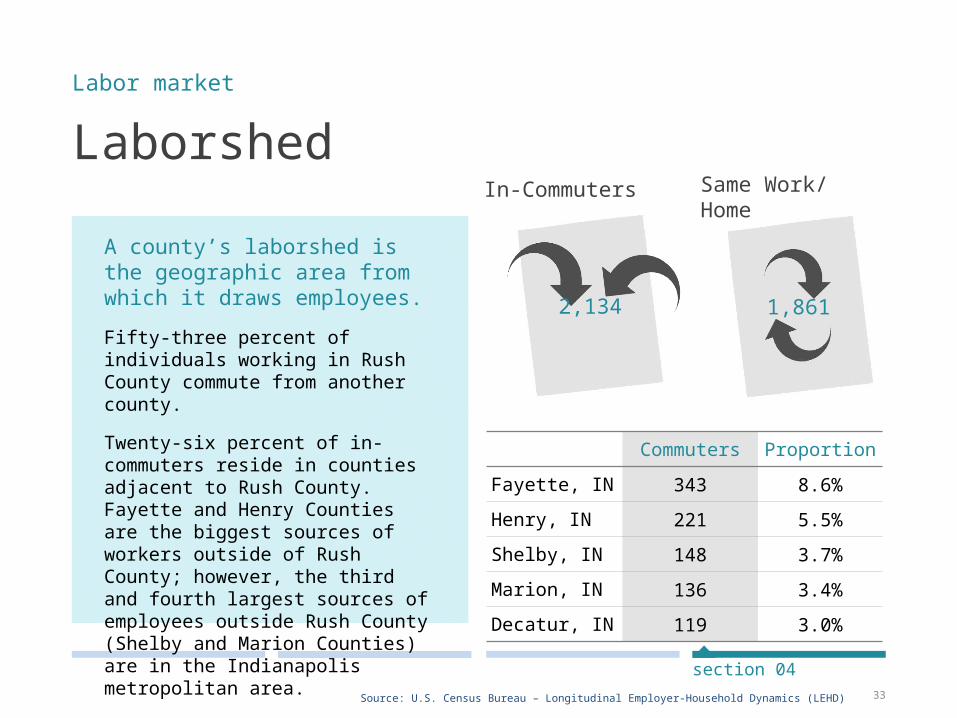
Laborshed
Commuters Proportion
Fayette, IN 343 8.6%
Henry, IN 221 5.5%
Shelby, IN 148 3.7%
Marion, IN 136 3.4%
Decatur, IN 119 3.0%
Labor market
Source: U.S. Census Bureau – Longitudinal Employer-Household Dynamics (LEHD)
section 04
2,134
In-Commuters
1,861
Same Work/Home
A county’s laborshed is the geographic area from which it draws employees.
Fifty-three percent of individuals working in Rush County commute from another county.
Twenty-six percent of in-commuters reside in counties adjacent to Rush County. Fayette and Henry Counties are the biggest sources of workers outside of Rush County; however, the third and fourth largest sources of employees outside Rush County (Shelby and Marion Counties) are in the Indianapolis metropolitan area.
34
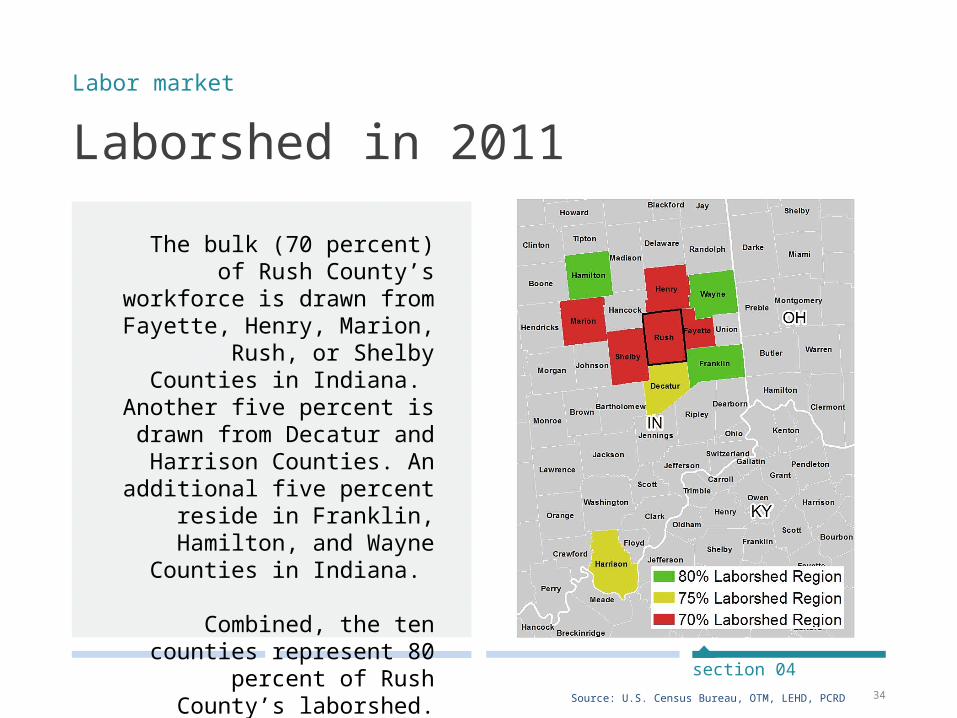
Laborshed in 2011Labor market
section 04
Source: U.S. Census Bureau, OTM, LEHD, PCRD
The bulk (70 percent) of Rush County’s workforce is drawn from Fayette, Henry,
Marion, Rush, or Shelby Counties in Indiana.
Another five percent is drawn from Decatur and
Harrison Counties. An additional five percent
reside in Franklin, Hamilton, and Wayne Counties in
Indiana.
Combined, the ten counties represent 80 percent of
Rush County’s laborshed.
35
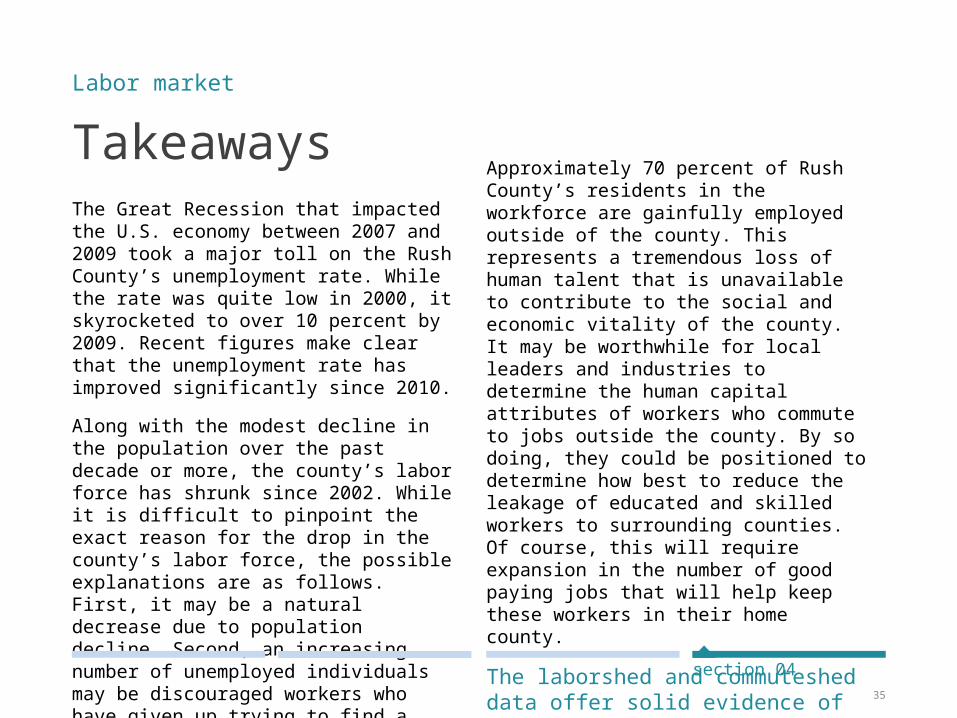
Takeaways The Great Recession that impacted the U.S. economy between 2007 and 2009 took a major toll on the Rush County’s unemployment rate. While the rate was quite low in 2000, it skyrocketed to over 10 percent by 2009. Recent figures make clear that the unemployment rate has improved significantly since 2010.
Along with the modest decline in the population over the past decade or more, the county’s labor force has shrunk since 2002. While it is difficult to pinpoint the exact reason for the drop in the county’s labor force, the possible explanations are as follows. First, it may be a natural decrease due to population decline. Second, an increasing number of unemployed individuals may be discouraged workers who have given up trying to find a job. Or third, more people in the workforce have opted to retire and their positions have been eliminated or left unfilled.
Approximately 70 percent of Rush County’s residents in the workforce are gainfully employed outside of the county. This represents a tremendous loss of human talent that is unavailable to contribute to the social and economic vitality of the county. It may be worthwhile for local leaders and industries to determine the human capital attributes of workers who commute to jobs outside the county. By so doing, they could be positioned to determine how best to reduce the leakage of educated and skilled workers to surrounding counties. Of course, this will require expansion in the number of good paying jobs that will help keep these workers in their home county.
The laborshed and commuteshed data offer solid evidence of the value of pursuing economic and workforce development on a regional (multi-county) basis.
Labor market
section 04
36
Report ContributorsThis report was prepared by the Purdue Center for Regional Development in partnership with Purdue University Extension.
section 04
Data AnalysisIndraneel Kumar, PhDAyoung Kim
Report AuthorsElizabeth DobisBo Beaulieu, PhD
Report DesignTyler Wright

FOR MORE INFORMATION
Purdue Center for Regional Development (PCRD) . . .seeks to pioneer new ideas and strategies that contribute to regional collaboration, innovation and prosperity.
Purdue Extension Community Development (CD) . . . works to strengthen the capacity of local leaders, residents and organizations to work together to develop and sustain strong, vibrant communities.
Please contact
PCRDMann Hall, Suite 266Purdue University
Top Related