


Languages
Pages
Legal

Rapporttittel /Report title
Draft Final Report – Dagupan
Environmental Monitoring and Modelling of Aquaculture in risk areas of the Philippines (EMMA)
Forfatter(e) / Author(s) Akvaplan-niva rapport nr / report no: Patrick White APN-2415.03 Guttorm N. Christensen Dato / Date: Rune Palerud 00/00/00 Tarzan Legovic Westly Rosario Antall sider / No. of pages Nelson Lopez 46 + 0 Regie Regpala Distribusjon / Distribution Suncana Gecek Jocelyn Hernandez Begrenset/Restricted Oppdragsgiver / Client Oppdragsg. ref. / Client ref. Sammendrag / Summary
Draft final report of work undertaken during the course of the Project Emneord: Key words:
Philippines Aquaculture Environmental survey Training Participatory workshops Prosjektleder / Project manager Kvalitetskontroll / Quality control
Patrick White Anton Giæver
© 2007 Akvaplan-niva The client has permission to copy the complete report, without omissions. It is not allowed to copy, or use in other ways, parts of the report (texts, figures, conclusion, etc.) without written consent from Akvaplan-niva AS
9296 Tromsø, Norway Tel. +47 77 75 03 00 Faks +47 77 75 03 01
BFAR-NIFTDC Bonuan-Binloc Dagupan City, Philippines
Final report – Dagupan: Environmental Monitoring and Modelling of Aguaculture in risk areas of the Philippines (EMMA)
2
Table of contents 1 Introduction.............................................................................................................................3 2 Summary of survey results......................................................................................................4
2.1 Study area .....................................................................................................................4 2.2 Bathymetry ...................................................................................................................6 2.3 Current meters ..............................................................................................................7 2.4 Water quality parameters............................................................................................12
2.4.1 Turbidity sampling (Secchi-depth)...........................................................................12 2.4.2 Water sample analyses .............................................................................................13
2.5 Water column sampling with the CTDO-probe .........................................................16 2.6 Sediment sampling (Benthic stations) ........................................................................18
3 Registration of Fish Farm structures in Dagupan (April 2005) ............................................22 3.1 Fish Cages...................................................................................................................23 3.2 Fish Pens.....................................................................................................................24 3.3 Oysters ........................................................................................................................26 3.4 Fish Traps ...................................................................................................................27 3.5 Modelling carrying capacity.......................................................................................28
4 Possible management measures............................................................................................29 5 Participatory Workshop ........................................................................................................34
5.1 Part I. Implementors and planners Workshop ............................................................34 5.2 Part II. Stakeholders Workshop..................................................................................36 5.3 Part III. Workshop on Mariculture Parks ...................................................................38
Draft Final Report – Dagupan Environmental Monitoring and modelling of aquaculture in risk areas of the Philippines (EMMA)
3
1 Introduction The Dagupan City area consists of the city and two municipalities, Binmaley and Lingayen, situated in the river-delta estuary system of the Agno River at the head of the Lingayen Gulf. The region is an important fish production area for both fisheries and aquaculture. A number of secondary industries have developed including boat and fishing gear manufacturing and fish processing.
The entire economy of the Agno River estuary region is based on fishing and aquaculture. Small trawlers and boats rigged with nets or longlines land their catch in Dagupan City. In recent years the gulf has experienced severe overfishing, leading to diminished catches and fewer large boat landings.
The Dagupan City region is well known for the culture of bangus or milkfish, (Chanos chanos). Milkfish are typically grown in shallow extensive ponds reclaimed from mangrove wetlands. Approximately 8,700 fish ponds of this type cover about 11, 300 hectares (ha). There are typically 4,000 fingerlings per ha and the ponds require minimal supplemental feeding, as ponds are fertilized to promote the growth of lab-lab, a complex of filamentous algae and phytoplankton that serve as food. Fish require a three-month growing period before reaching market size, and two or three crop cycles per nine-month growing season are common.
Starting in the mid 1980’s, a number of progressive pond operators modified their extensive ponds by deepening and aerating them. In these semi-intensive ponds, milkfish are stocked in excess of 25,000 fingerlings per ha, and require supplemental feeding. In 1983 the culture of serranid groupers, known locally as lapu-lapu, was introduced. Small-scale trials demonstrated the commercial viability of grouper culture, leading to increased production. Markets in Hong Kong and Singapore were developed, and by 1993 grouper production in Dagupan City reached about 15,000 kg per year. In 1992, pond production of milkfish was reported to be about 12,000 metric tons in the estuary. Several pond operators have diversified their crops by growing shrimp in monoculture with crop rotation or as a polyculture species with milkfish.
Until the early 1990s, aquaculture production had a high degree of species and technological diversity. Most aquaculture operations were local to the province and, to some extent, these operations were well placed due to community pressure. Initially, multiple uses of the water-ways occurred with minimal conflicts. For example, oysters, milkfish and groupers were often cultured in close proximity to fixed nets placed to capture migrating fish and crustaceans. This polyculture form of aquaculture management optimized output of the estuary. Some fishers profited from polyculture practices; one example is fishers with oyster farming plots that also employed spat collectors that acted as miniature reefs or fish aggregating devices.
Draft Final Report – Dagupan Environmental Monitoring and modelling of aquaculture in risk areas of the Philippines (EMMA)
4
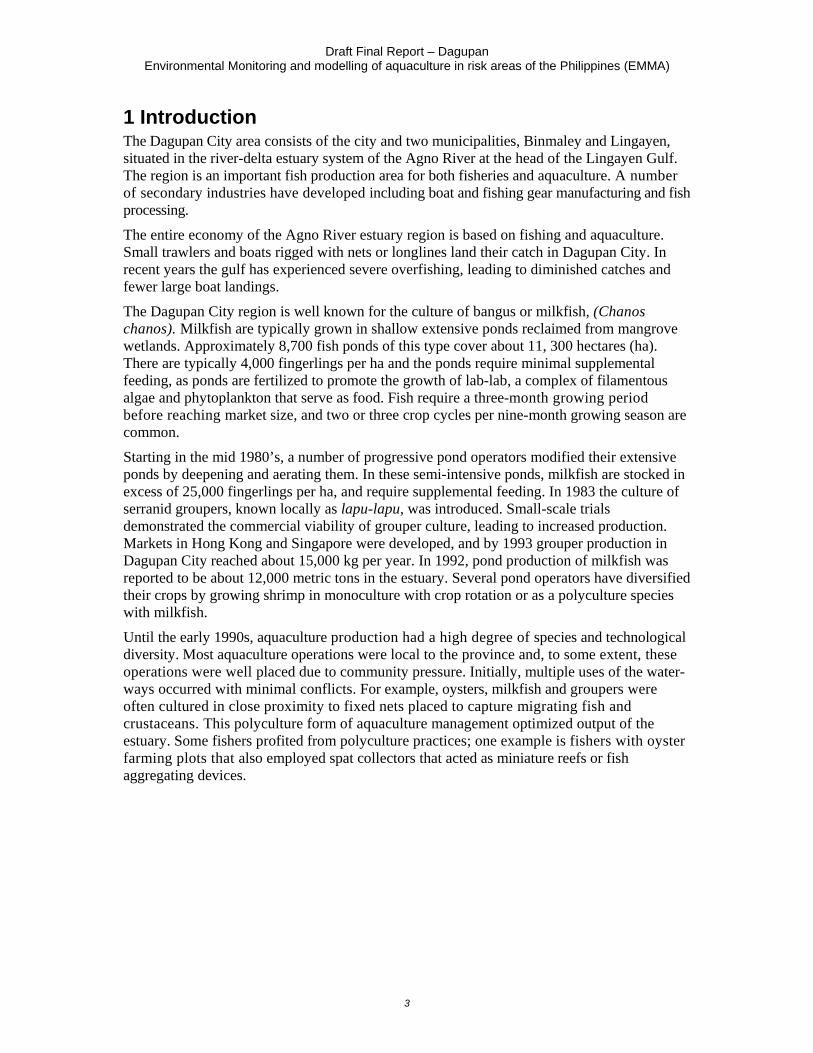
Figure 1. Fish ponds and pens in Dagupan area.
In the early 1990s, two events changed the way fisheries and aquaculture were conducted. First, on July 16, 1990, an earthquake of intensity 7.8 on the Richter Scale struck the region with devastating consequences. The commercial center of the city was heavily damaged and subsided by approximately one meter. Many low-lying fishponds were inundated. Rebuilding of the city, which included its fisheries and aquaculture infrastructure, was very costly.
The second event was the decline in the shrimp production industry due to over-inten-sification, sub-optimum management and disease outbreaks. The shrimp industry had grown rapidly due to innovations in hatchery and feed technologies. The decline resulted in an over-production of aquaculture feed. To maintain their markets, some feed manufacturers developed forms of aquaculture that would decrease their dependence on shrimp feeds. In the Dagupan City region, the type of aquaculture to expand rapidly was the net pen culture of milkfish. The success of milkfish production precipitated a rapid expansion of the industry.
The rapid growth of the industry was not without environmental consequences. The uncontrolled establishment of the milkfish pens led to degraded water quality, resulting in economic losses for operators using the more sound polyculture methods. Eventually, degraded water quality began to affect the milkfish pen operators themselves. By 1996, overnight fish kills occurred regularly in the fish pens in the town of Binmaley.
Ever since the 1986 devolution of power to local government officials, management responsibilities have rested primarily with the local government which are now in the process of developing local ordinances regarding fish cages and pens.
2 Summary of survey results
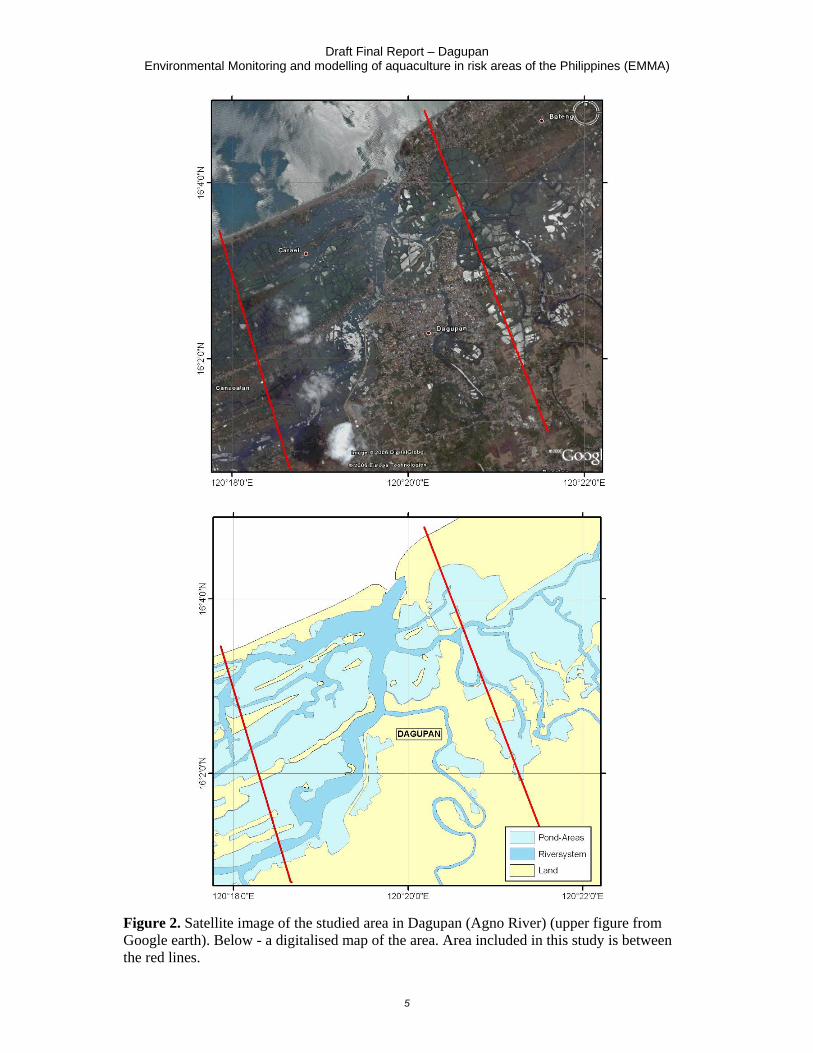
2.1 Study area In this project it was decided two study aquaculture in freshwater, brackish and marine environment. The brackish water study site was located to the river-delta estuary system of the Agno River at the head of the Lingayen Gulf. This is a big brackish river delta estuary with a lot of aquaculture activity. The study area is shown in Figure 2.
Draft Final Report – Dagupan Environmental Monitoring and modelling of aquaculture in risk areas of the Philippines (EMMA)
5
Figure 2. Satellite image of the studied area in Dagupan (Agno River) (upper figure from Google earth). Below - a digitalised map of the area. Area included in this study is between the red lines.

Draft Final Report – Dagupan Environmental Monitoring and modelling of aquaculture in risk areas of the Philippines (EMMA)
6
2.2 Bathymetry Detailed knowledge about the bathymetry in an area is vital information for being able to model the water exchange in an area. There exists little information about the depth in Agno River. Therefore a Garmin echo-sounder which contains a GPS and a chart plotter (GPSmap 178C sounder) was set up on one of the BFAR boats so that we could collect depth readings from the area. This setup measure depth with an echosounder and a GPS store the tracks automatically tagged with the date and time of creation, as well as water temperature and depth. This setup is part of the equipment that is donated to BFAR for use in future projects. All the collected data were used for the modelling. In Figure 3 transects of the new depth recordings are illustrated. The data collected can be put straight into the model or be used for making new bathymetry maps for the area.
Figure 3. Map of Agno River demonstrating the new depth recordings. Dark blue illustrates deep areas while light blue illustrates shallower areas.
Draft Final Report – Dagupan Environmental Monitoring and modelling of aquaculture in risk areas of the Philippines (EMMA)
7
2.3 Current meters Information about the currents (speed, direction, volume) in an area is vital for doing the modelling. This information is used for modelling water exchange which again give information about how often fresh oxygenated water are coming in to an area, how the waste from the aquaculture activity is dispersed, etc.
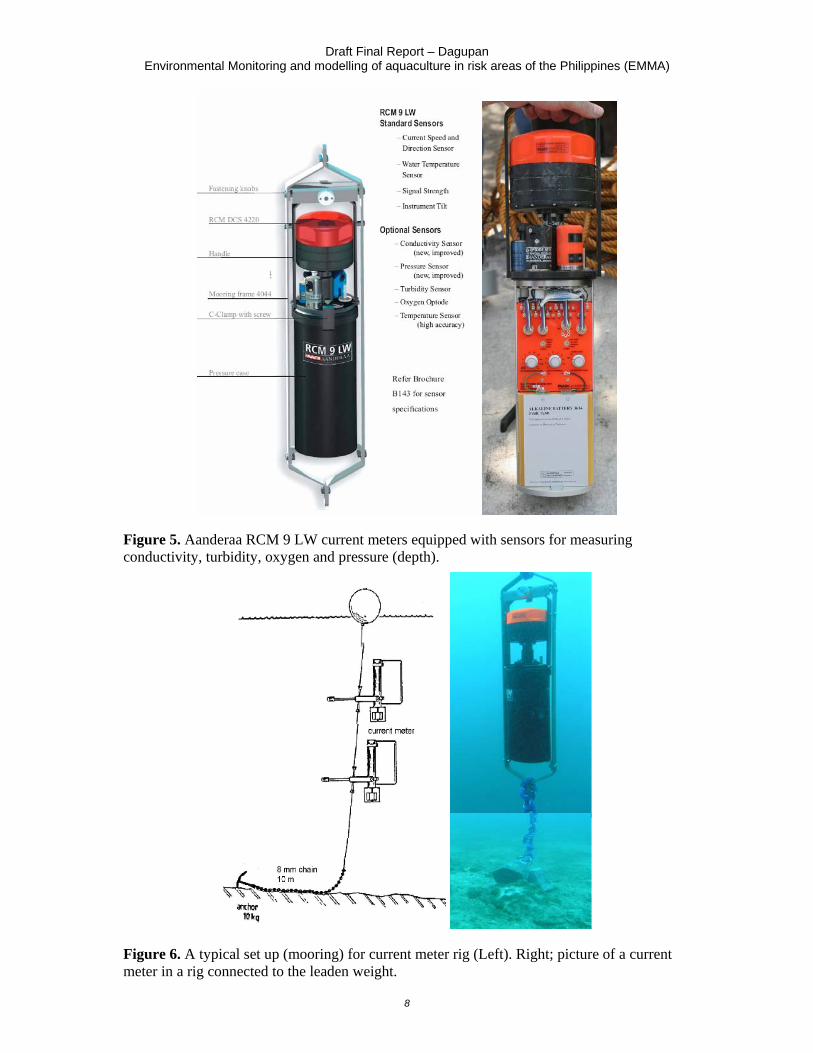
MINI current meter model SD-6000 was used in the first survey. This is a compact vector averaging current meter with memory capacity for up to 6000 combined data sets of current speed, direction and temperature. For the second and third fieldtrip the new current meters, RCM 9 LW from Aanderaa in Norway, was used (Figure 5).
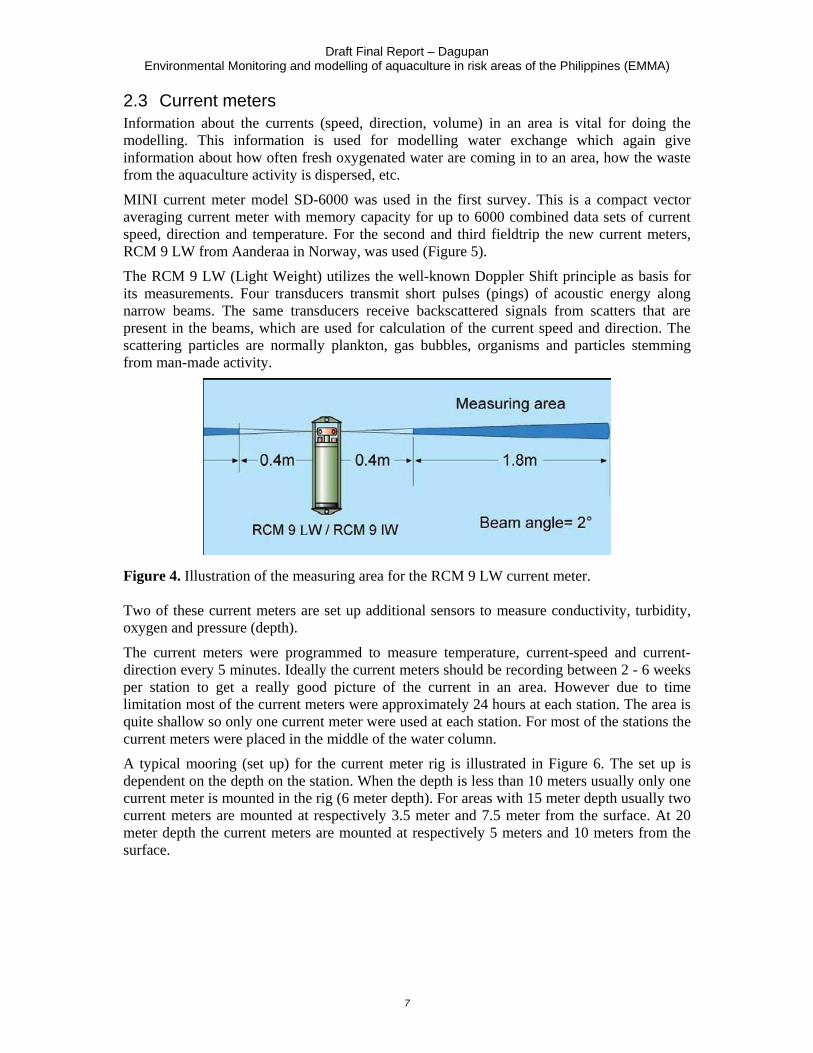
The RCM 9 LW (Light Weight) utilizes the well-known Doppler Shift principle as basis for its measurements. Four transducers transmit short pulses (pings) of acoustic energy along narrow beams. The same transducers receive backscattered signals from scatters that are present in the beams, which are used for calculation of the current speed and direction. The scattering particles are normally plankton, gas bubbles, organisms and particles stemming from man-made activity.
Figure 4. Illustration of the measuring area for the RCM 9 LW current meter. Two of these current meters are set up additional sensors to measure conductivity, turbidity, oxygen and pressure (depth).
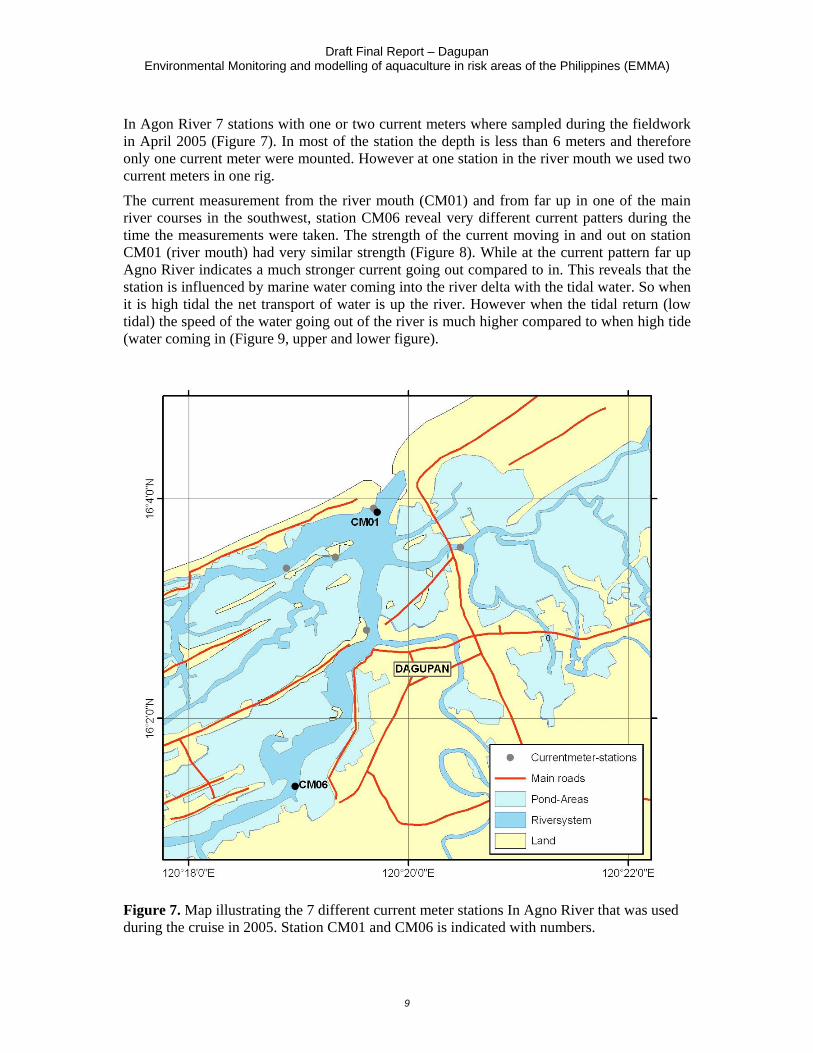
The current meters were programmed to measure temperature, current-speed and current-direction every 5 minutes. Ideally the current meters should be recording between 2 - 6 weeks per station to get a really good picture of the current in an area. However due to time limitation most of the current meters were approximately 24 hours at each station. The area is quite shallow so only one current meter were used at each station. For most of the stations the current meters were placed in the middle of the water column.
A typical mooring (set up) for the current meter rig is illustrated in Figure 6. The set up is dependent on the depth on the station. When the depth is less than 10 meters usually only one current meter is mounted in the rig (6 meter depth). For areas with 15 meter depth usually two current meters are mounted at respectively 3.5 meter and 7.5 meter from the surface. At 20 meter depth the current meters are mounted at respectively 5 meters and 10 meters from the surface.
Draft Final Report – Dagupan Environmental Monitoring and modelling of aquaculture in risk areas of the Philippines (EMMA)
8
Figure 5. Aanderaa RCM 9 LW current meters equipped with sensors for measuring conductivity, turbidity, oxygen and pressure (depth).
Figure 6. A typical set up (mooring) for current meter rig (Left). Right; picture of a current meter in a rig connected to the leaden weight.
Draft Final Report – Dagupan Environmental Monitoring and modelling of aquaculture in risk areas of the Philippines (EMMA)
9
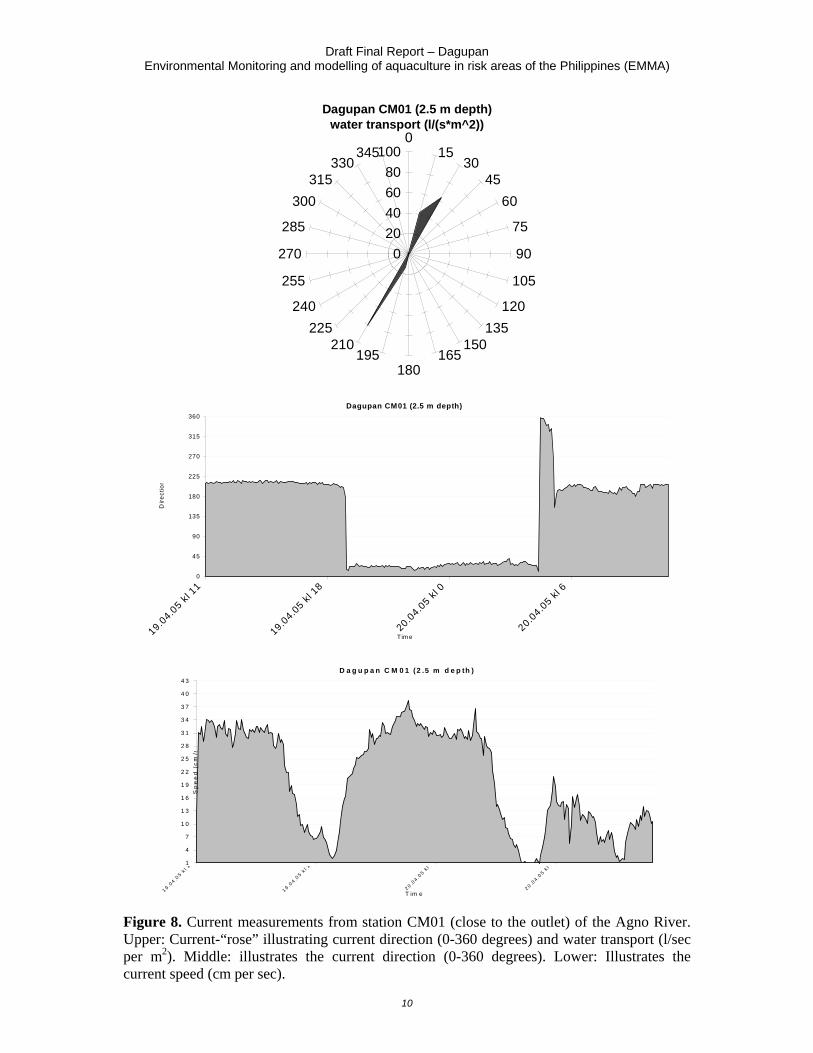
In Agon River 7 stations with one or two current meters where sampled during the fieldwork in April 2005 (Figure 7). In most of the station the depth is less than 6 meters and therefore only one current meter were mounted. However at one station in the river mouth we used two current meters in one rig.
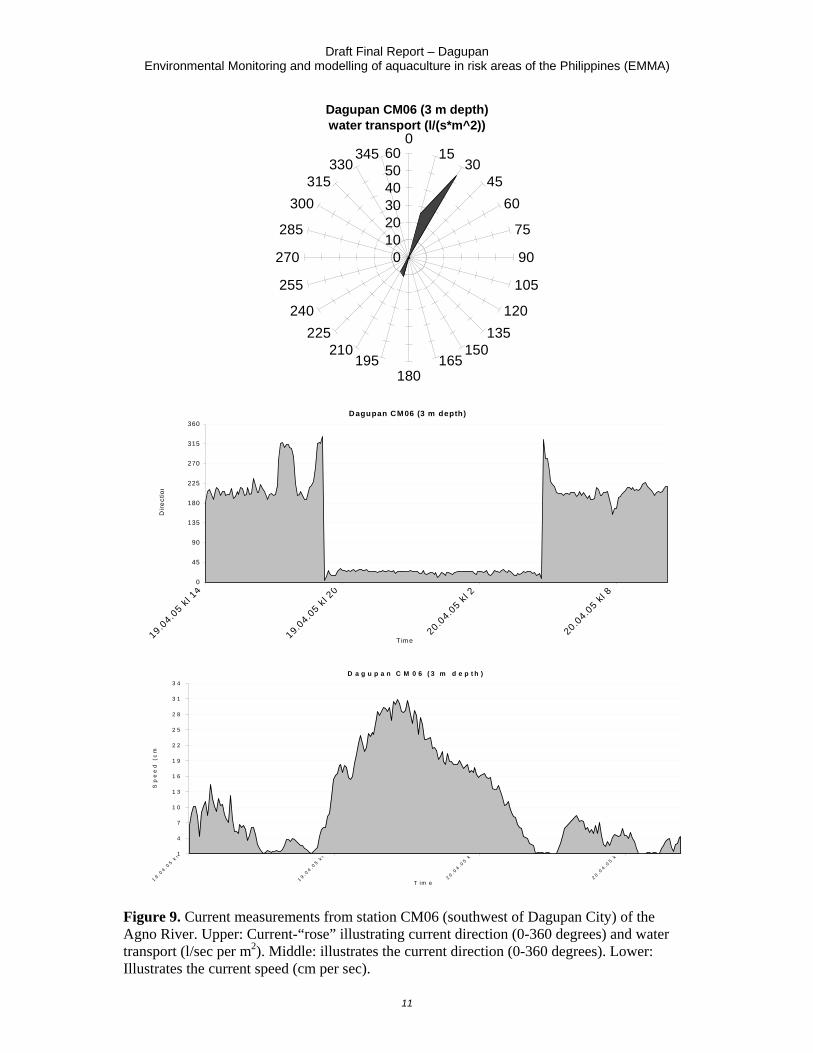
The current measurement from the river mouth (CM01) and from far up in one of the main river courses in the southwest, station CM06 reveal very different current patters during the time the measurements were taken. The strength of the current moving in and out on station CM01 (river mouth) had very similar strength (Figure 8). While at the current pattern far up Agno River indicates a much stronger current going out compared to in. This reveals that the station is influenced by marine water coming into the river delta with the tidal water. So when it is high tidal the net transport of water is up the river. However when the tidal return (low tidal) the speed of the water going out of the river is much higher compared to when high tide (water coming in (Figure 9, upper and lower figure).
Figure 7. Map illustrating the 7 different current meter stations In Agno River that was used during the cruise in 2005. Station CM01 and CM06 is indicated with numbers.
Draft Final Report – Dagupan Environmental Monitoring and modelling of aquaculture in risk areas of the Philippines (EMMA)
10
Dagupan CM01 (2.5 m depth)water transport (l/(s*m^2))
020406080
1000
1530
4560
75
90
105
120135
150165
180195
210225
240
255
270
285
300315
330345
Dagupan CM01 (2.5 m depth)
0
45
90
135
180
225
270
315
360
19.04.0
5 kl 11
19.04.0
5 kl 18
20.04.05 kl 0
20.04.05 kl 6
Tim e
Dire
ctio
n
D a g u p a n C M 0 1 (2 .5 m d e p th )
1
4
7
1 0
1 3
1 6
1 9
2 2
2 5
2 8
3 1
3 4
3 7
4 0
4 3
1 9 .04 .0
5 kl 1
1 9 .04 .0
5 kl 1
2 0 .04 .0
5 kl 0
2 0 .04 .0
5 kl 6
T im e
Sp
ee
d (
cm
/s
Figure 8. Current measurements from station CM01 (close to the outlet) of the Agno River. Upper: Current-“rose” illustrating current direction (0-360 degrees) and water transport (l/sec per m2). Middle: illustrates the current direction (0-360 degrees). Lower: Illustrates the current speed (cm per sec).
Draft Final Report – Dagupan Environmental Monitoring and modelling of aquaculture in risk areas of the Philippines (EMMA)
11
Dagupan CM06 (3 m depth)water transport (l/(s*m^2))
0102030405060
015
3045
60
75
90
105
120135
150165
180195
210225
240
255
270
285
300315
330345
Dagupan CM 06 (3 m depth)
0
45
90
135
180
225
270
315
360
19.04.0
5 kl 1
4
19.04.0
5 kl 2
0
20.04.0
5 kl 2
20.04.0
5 kl 8
T im e
Dire
ctio
n
D a g u p a n C M 0 6 ( 3 m d e p t h )
1
4
7
1 0
1 3
1 6
1 9
2 2
2 5
2 8
3 1
3 4
1 9 .04 .0
5 kl
1 9 . 04 . 0
5 kl
2 0 . 04 . 0
5 k
2 0 .04 . 0
5 k
T im e
Sp
ee
d (
cm
Figure 9. Current measurements from station CM06 (southwest of Dagupan City) of the Agno River. Upper: Current-“rose” illustrating current direction (0-360 degrees) and water transport (l/sec per m2). Middle: illustrates the current direction (0-360 degrees). Lower: Illustrates the current speed (cm per sec).
Draft Final Report – Dagupan Environmental Monitoring and modelling of aquaculture in risk areas of the Philippines (EMMA)
12
2.4 Water quality parameters The Secchi-depth was measured with a standard Secchi-disk (diameter 25 cm). Water samples were taken with a Niskin water sampler at 2 meters depth. The sampling stations are the same stations that BFAR are using for their monitoring. The samples were analysed at the BFAR for the following parameters NH4, NO2, NO3, PO4 and Chlorophyll-a.
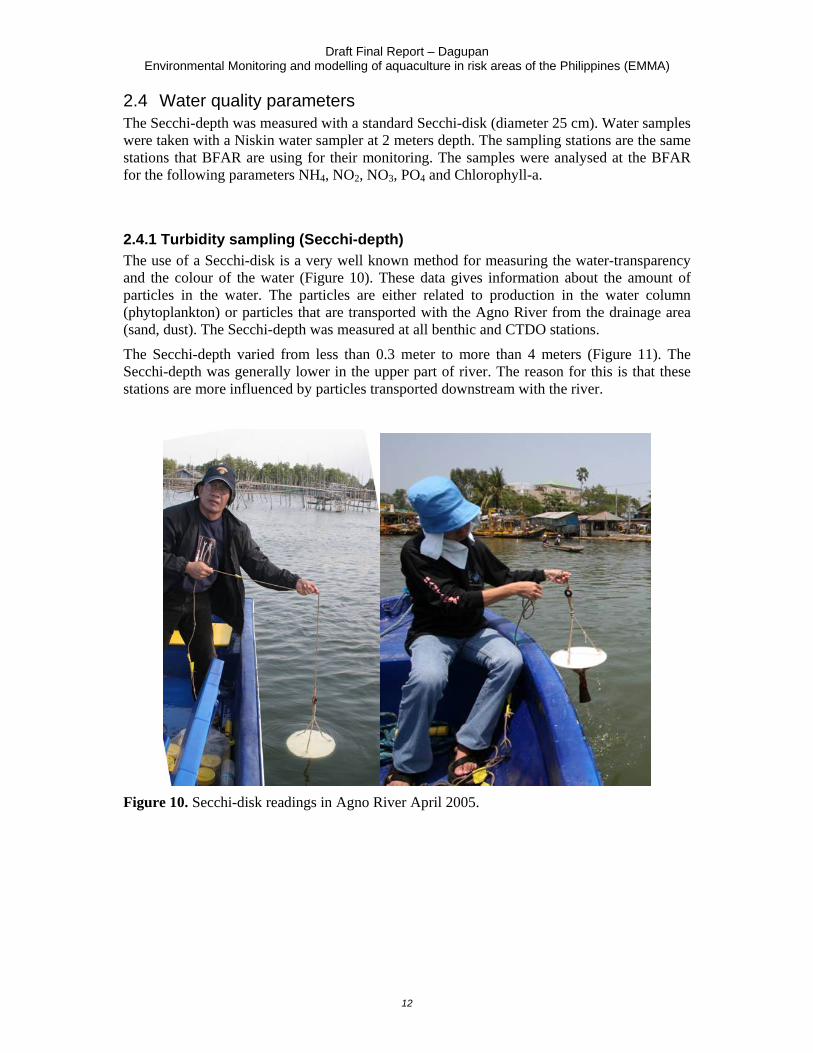
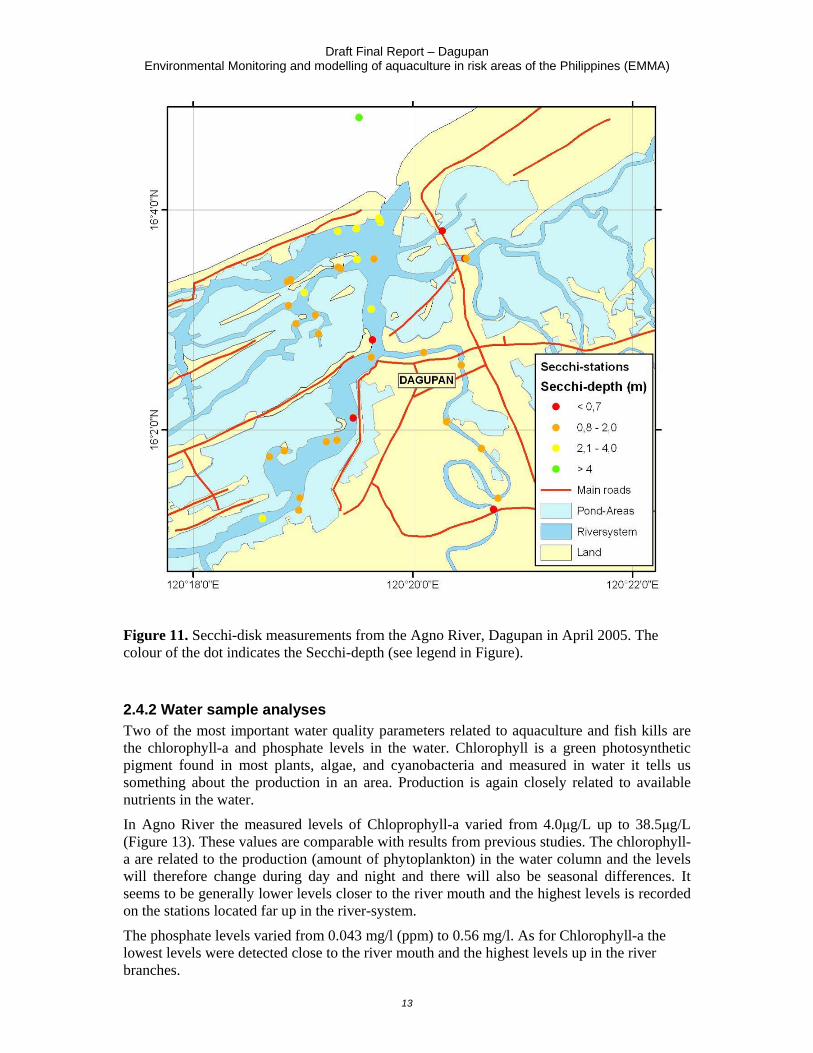
2.4.1 Turbidity sampling (Secchi-depth) The use of a Secchi-disk is a very well known method for measuring the water-transparency and the colour of the water (Figure 10). These data gives information about the amount of particles in the water. The particles are either related to production in the water column (phytoplankton) or particles that are transported with the Agno River from the drainage area (sand, dust). The Secchi-depth was measured at all benthic and CTDO stations.
The Secchi-depth varied from less than 0.3 meter to more than 4 meters (Figure 11). The Secchi-depth was generally lower in the upper part of river. The reason for this is that these stations are more influenced by particles transported downstream with the river.
Figure 10. Secchi-disk readings in Agno River April 2005.
Draft Final Report – Dagupan Environmental Monitoring and modelling of aquaculture in risk areas of the Philippines (EMMA)
13
Figure 11. Secchi-disk measurements from the Agno River, Dagupan in April 2005. The colour of the dot indicates the Secchi-depth (see legend in Figure).
2.4.2 Water sample analyses Two of the most important water quality parameters related to aquaculture and fish kills are the chlorophyll-a and phosphate levels in the water. Chlorophyll is a green photosynthetic pigment found in most plants, algae, and cyanobacteria and measured in water it tells us something about the production in an area. Production is again closely related to available nutrients in the water.
In Agno River the measured levels of Chloprophyll-a varied from 4.0μg/L up to 38.5μg/L (Figure 13). These values are comparable with results from previous studies. The chlorophyll-a are related to the production (amount of phytoplankton) in the water column and the levels will therefore change during day and night and there will also be seasonal differences. It seems to be generally lower levels closer to the river mouth and the highest levels is recorded on the stations located far up in the river-system.
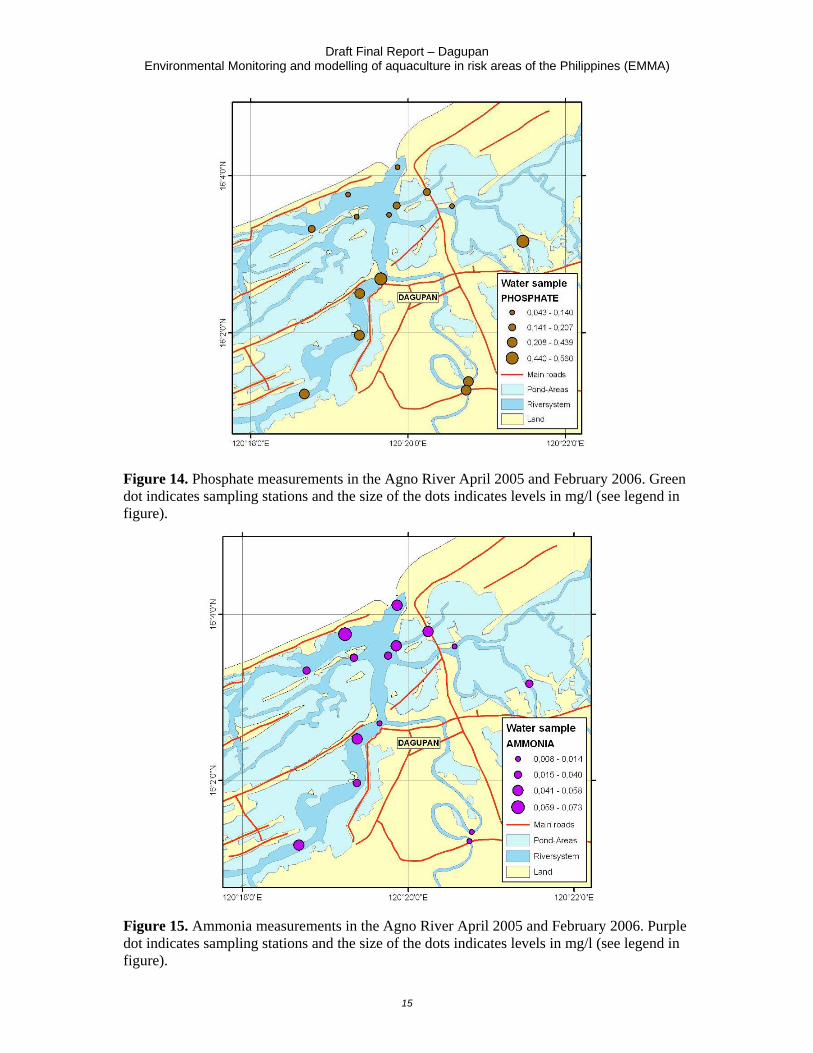
The phosphate levels varied from 0.043 mg/l (ppm) to 0.56 mg/l. As for Chlorophyll-a the lowest levels were detected close to the river mouth and the highest levels up in the river branches.
Draft Final Report – Dagupan Environmental Monitoring and modelling of aquaculture in risk areas of the Philippines (EMMA)
14
The Ammonia levels had a different distribution pattern and the highest levels were found in areas with the most intensive fish farming (>40 ug/l) activities while the levels further up the river system was generally lower Figure 15. The reason for the high levels in areas with high fish farming activity is related to the release of ammonia from the fish.
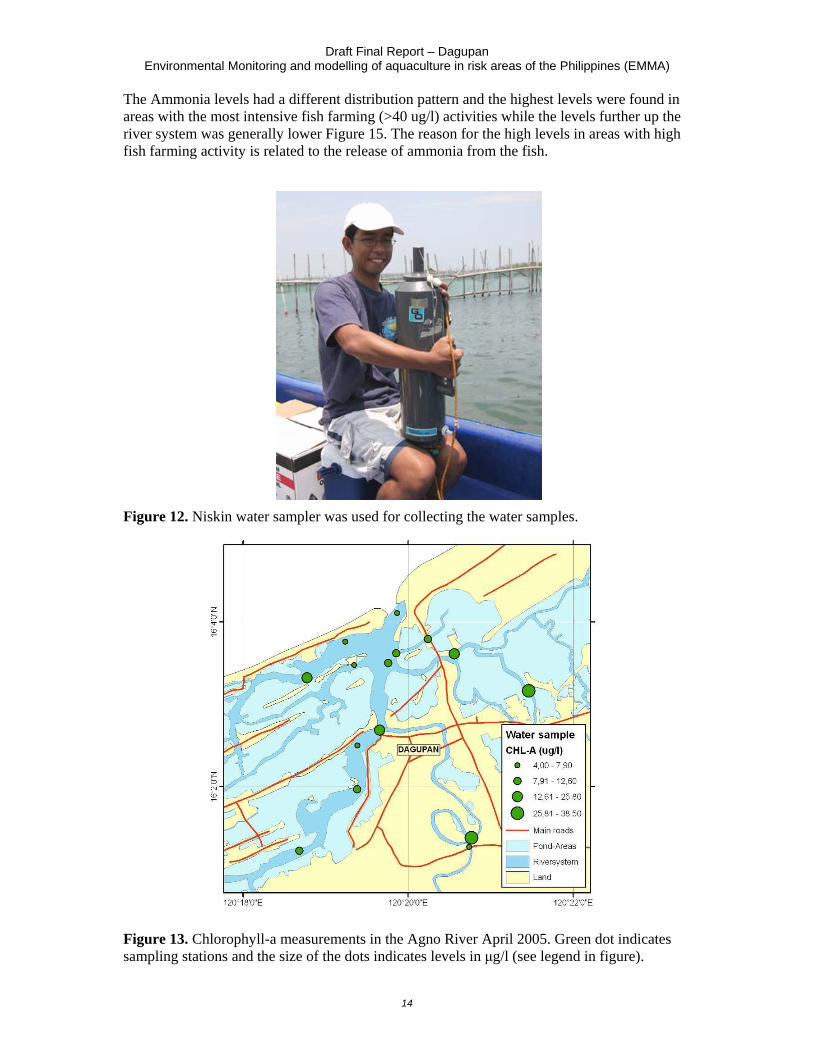
Figure 12. Niskin water sampler was used for collecting the water samples.
Figure 13. Chlorophyll-a measurements in the Agno River April 2005. Green dot indicates sampling stations and the size of the dots indicates levels in μg/l (see legend in figure).
Draft Final Report – Dagupan Environmental Monitoring and modelling of aquaculture in risk areas of the Philippines (EMMA)
15
Figure 14. Phosphate measurements in the Agno River April 2005 and February 2006. Green dot indicates sampling stations and the size of the dots indicates levels in mg/l (see legend in figure).
Figure 15. Ammonia measurements in the Agno River April 2005 and February 2006. Purple dot indicates sampling stations and the size of the dots indicates levels in mg/l (see legend in figure).
Draft Final Report – Dagupan Environmental Monitoring and modelling of aquaculture in risk areas of the Philippines (EMMA)
16
2.5 Water column sampling with the CTDO-probe Information about conductivity, temperature, salinity and oxygen in the water column is important parameters for understanding the condition and the dynamic of an area. In addition these parameters are sensual for the modelling work. These hydrographic data was measured with an electronic CTDO-probe (Sensordata). The probe that was donated to BFAR has sensor for measuring conductivity (salinity), temperature, depth, chlorophyll, turbidity and oxygen. These are all important parameters for evaluating the conditions of the water column.
During sampling the probe was lowered slowly to the bottom and slowly pulled back to the surface. The probe was programmed to take measurements every 5 seconds. The measured parameters will have seasonal and day – night changes. All the CTDO readings (>35) are plotted in Figure 17.
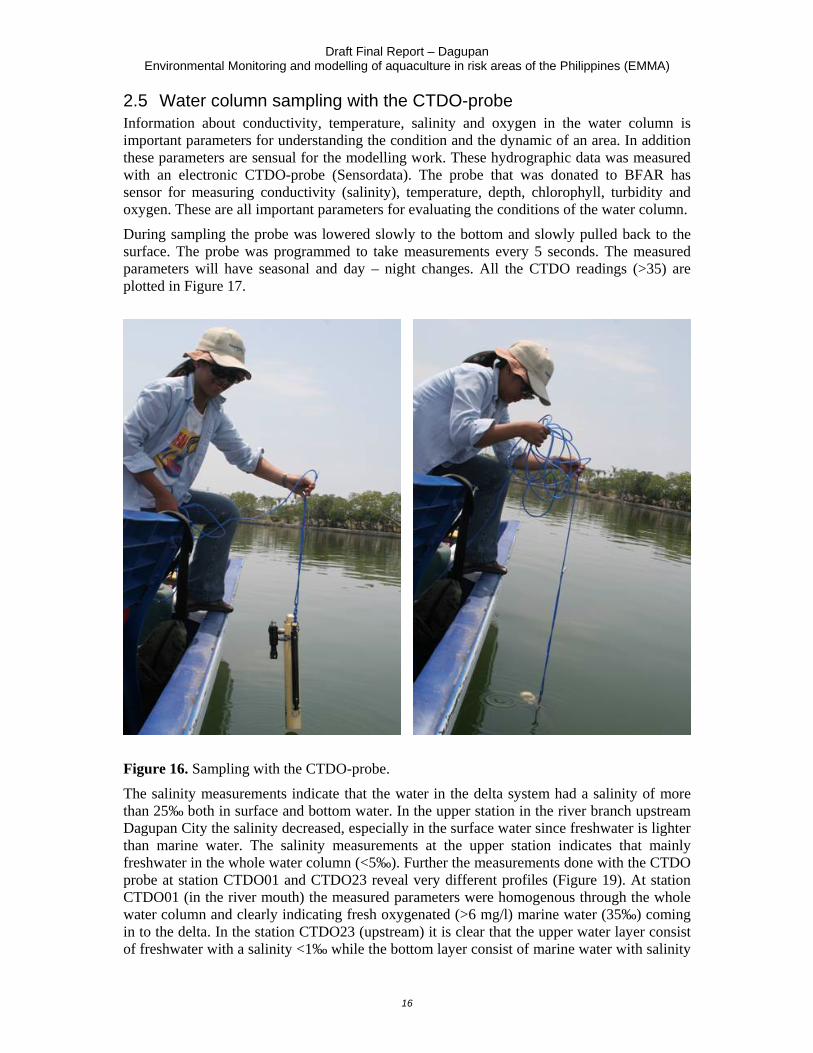
Figure 16. Sampling with the CTDO-probe.
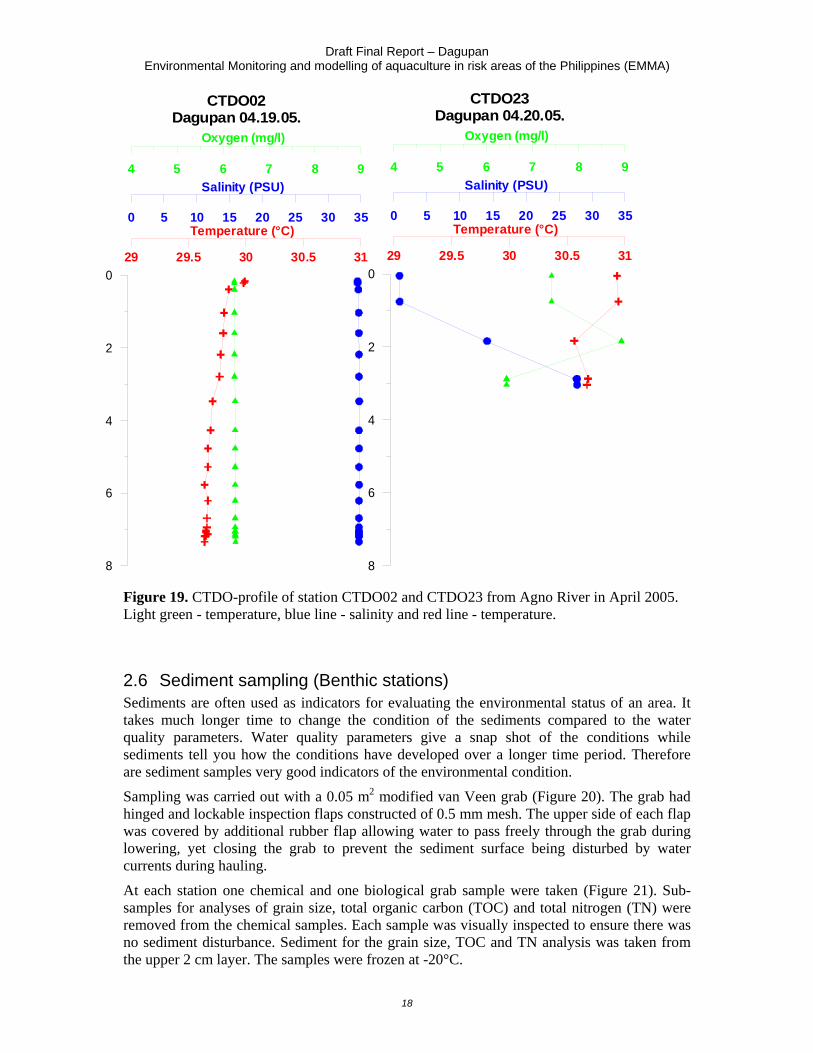
The salinity measurements indicate that the water in the delta system had a salinity of more than 25‰ both in surface and bottom water. In the upper station in the river branch upstream Dagupan City the salinity decreased, especially in the surface water since freshwater is lighter than marine water. The salinity measurements at the upper station indicates that mainly freshwater in the whole water column (<5‰). Further the measurements done with the CTDO probe at station CTDO01 and CTDO23 reveal very different profiles (Figure 19). At station CTDO01 (in the river mouth) the measured parameters were homogenous through the whole water column and clearly indicating fresh oxygenated (>6 mg/l) marine water (35‰) coming in to the delta. In the station CTDO23 (upstream) it is clear that the upper water layer consist of freshwater with a salinity <1‰ while the bottom layer consist of marine water with salinity
Draft Final Report – Dagupan Environmental Monitoring and modelling of aquaculture in risk areas of the Philippines (EMMA)
17
close to 30‰. There are also slightly differences in temperature between the upper and bottom layer.
Figure 17. CTDO readings in Agno River carried out in April 2005.
Figure 18. Salinity levels in surface and bottom water of the Agno River, Dagupan measured with the CTDO in April 2005.
Draft Final Report – Dagupan Environmental Monitoring and modelling of aquaculture in risk areas of the Philippines (EMMA)
18
29 29.5 30 30.5 31
Temperature (°C)
8
6
4
2
0
0 5 10 15 20 25 30 35
Salinity (PSU)4 5 6 7 8 9
Oxygen (mg/l)
CTDO02Dagupan 04.19.05.
29 29.5 30 30.5 31
Temperature (°C)
8
6
4
2
0
0 5 10 15 20 25 30 35
Salinity (PSU)4 5 6 7 8 9
Oxygen (mg/l)
CTDO23Dagupan 04.20.05.
Figure 19. CTDO-profile of station CTDO02 and CTDO23 from Agno River in April 2005. Light green - temperature, blue line - salinity and red line - temperature.
2.6 Sediment sampling (Benthic stations) Sediments are often used as indicators for evaluating the environmental status of an area. It takes much longer time to change the condition of the sediments compared to the water quality parameters. Water quality parameters give a snap shot of the conditions while sediments tell you how the conditions have developed over a longer time period. Therefore are sediment samples very good indicators of the environmental condition.
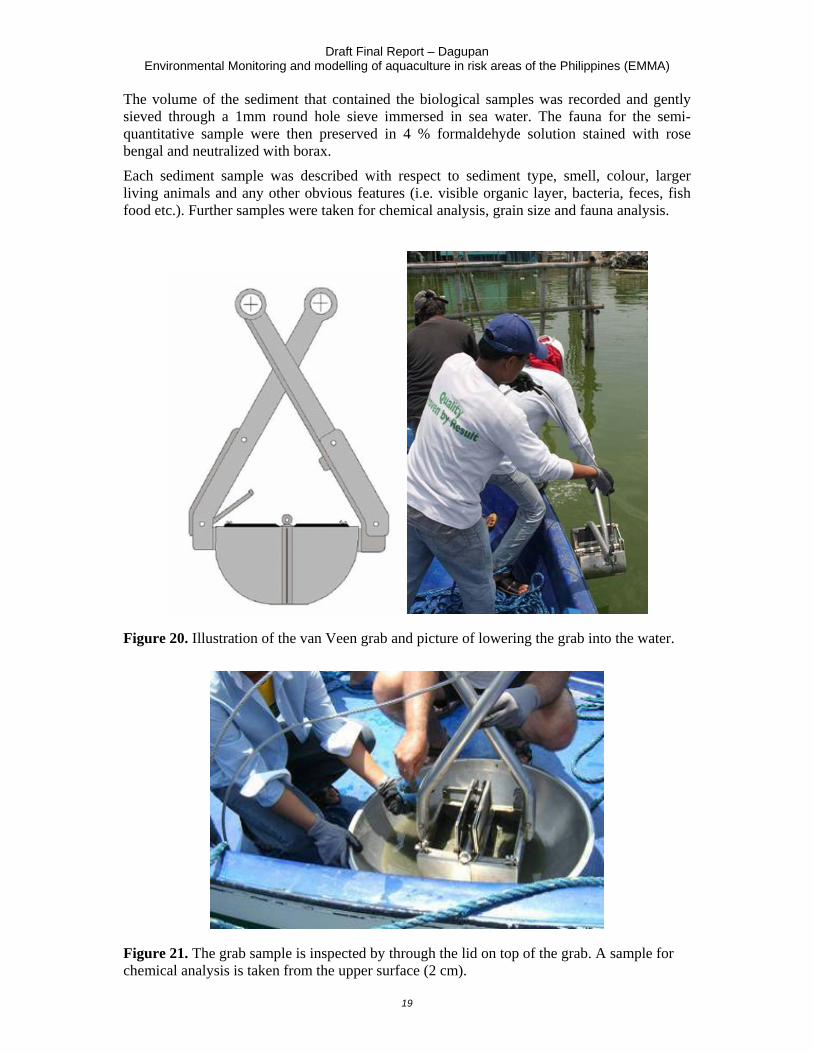
Sampling was carried out with a 0.05 m2 modified van Veen grab (Figure 20). The grab had hinged and lockable inspection flaps constructed of 0.5 mm mesh. The upper side of each flap was covered by additional rubber flap allowing water to pass freely through the grab during lowering, yet closing the grab to prevent the sediment surface being disturbed by water currents during hauling.
At each station one chemical and one biological grab sample were taken (Figure 21). Sub-samples for analyses of grain size, total organic carbon (TOC) and total nitrogen (TN) were removed from the chemical samples. Each sample was visually inspected to ensure there was no sediment disturbance. Sediment for the grain size, TOC and TN analysis was taken from the upper 2 cm layer. The samples were frozen at -20°C.
Draft Final Report – Dagupan Environmental Monitoring and modelling of aquaculture in risk areas of the Philippines (EMMA)
19
The volume of the sediment that contained the biological samples was recorded and gently sieved through a 1mm round hole sieve immersed in sea water. The fauna for the semi-quantitative sample were then preserved in 4 % formaldehyde solution stained with rose bengal and neutralized with borax.
Each sediment sample was described with respect to sediment type, smell, colour, larger living animals and any other obvious features (i.e. visible organic layer, bacteria, feces, fish food etc.). Further samples were taken for chemical analysis, grain size and fauna analysis.
Figure 20. Illustration of the van Veen grab and picture of lowering the grab into the water.
Figure 21. The grab sample is inspected by through the lid on top of the grab. A sample for chemical analysis is taken from the upper surface (2 cm).
Draft Final Report – Dagupan Environmental Monitoring and modelling of aquaculture in risk areas of the Philippines (EMMA)
20
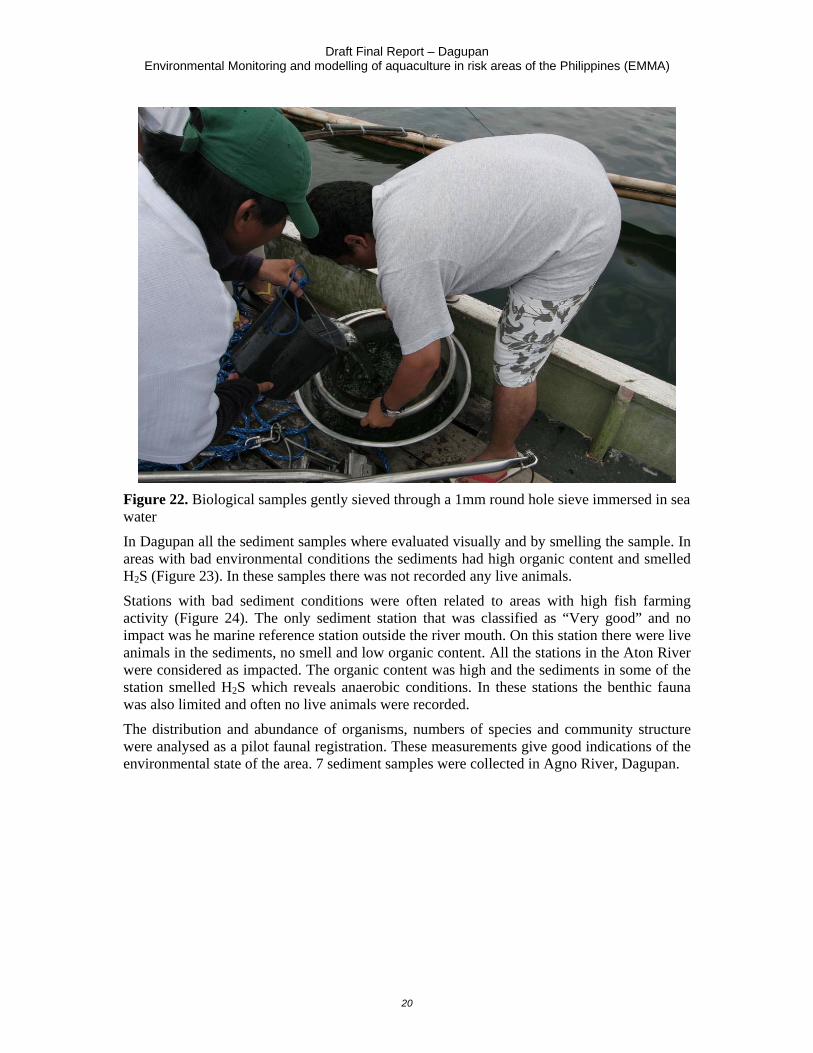
Figure 22. Biological samples gently sieved through a 1mm round hole sieve immersed in sea water
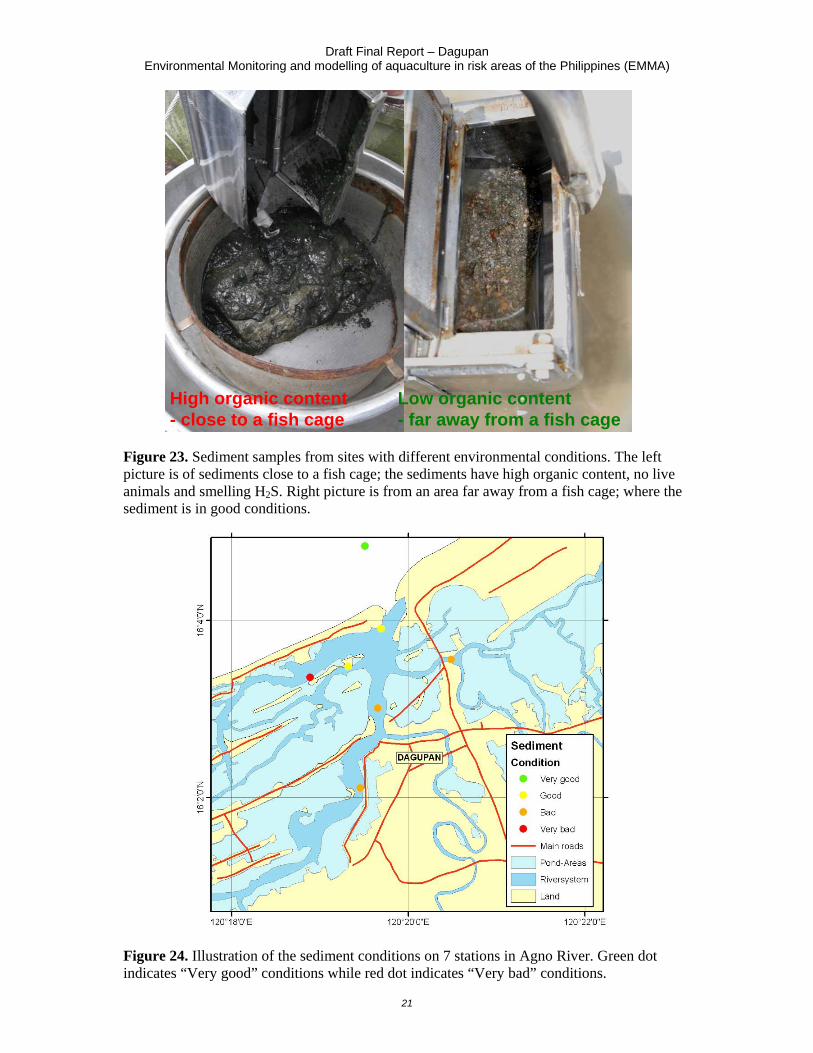
In Dagupan all the sediment samples where evaluated visually and by smelling the sample. In areas with bad environmental conditions the sediments had high organic content and smelled H2S (Figure 23). In these samples there was not recorded any live animals.
Stations with bad sediment conditions were often related to areas with high fish farming activity (Figure 24). The only sediment station that was classified as “Very good” and no impact was he marine reference station outside the river mouth. On this station there were live animals in the sediments, no smell and low organic content. All the stations in the Aton River were considered as impacted. The organic content was high and the sediments in some of the station smelled H2S which reveals anaerobic conditions. In these stations the benthic fauna was also limited and often no live animals were recorded.
The distribution and abundance of organisms, numbers of species and community structure were analysed as a pilot faunal registration. These measurements give good indications of the environmental state of the area. 7 sediment samples were collected in Agno River, Dagupan.
Draft Final Report – Dagupan Environmental Monitoring and modelling of aquaculture in risk areas of the Philippines (EMMA)
21
High organic content- close to a fish cage
Low organic content- far away from a fish cage
Figure 23. Sediment samples from sites with different environmental conditions. The left picture is of sediments close to a fish cage; the sediments have high organic content, no live animals and smelling H2S. Right picture is from an area far away from a fish cage; where the sediment is in good conditions.
Figure 24. Illustration of the sediment conditions on 7 stations in Agno River. Green dot indicates “Very good” conditions while red dot indicates “Very bad” conditions.
Draft Final Report – Dagupan Environmental Monitoring and modelling of aquaculture in risk areas of the Philippines (EMMA)
22
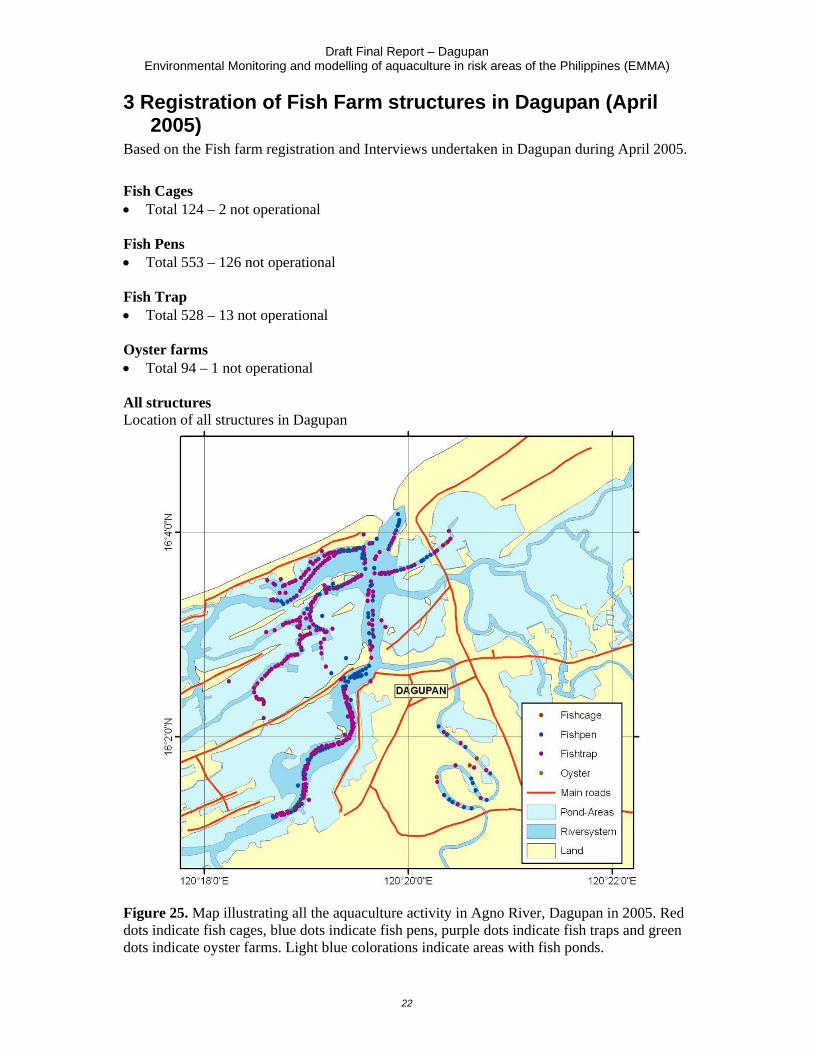
3 Registration of Fish Farm structures in Dagupan (April 2005)
Based on the Fish farm registration and Interviews undertaken in Dagupan during April 2005.
Fish Cages • Total 124 – 2 not operational Fish Pens • Total 553 – 126 not operational Fish Trap • Total 528 – 13 not operational Oyster farms • Total 94 – 1 not operational All structures Location of all structures in Dagupan
Figure 25. Map illustrating all the aquaculture activity in Agno River, Dagupan in 2005. Red dots indicate fish cages, blue dots indicate fish pens, purple dots indicate fish traps and green dots indicate oyster farms. Light blue colorations indicate areas with fish ponds.
Draft Final Report – Dagupan Environmental Monitoring and modelling of aquaculture in risk areas of the Philippines (EMMA)
23
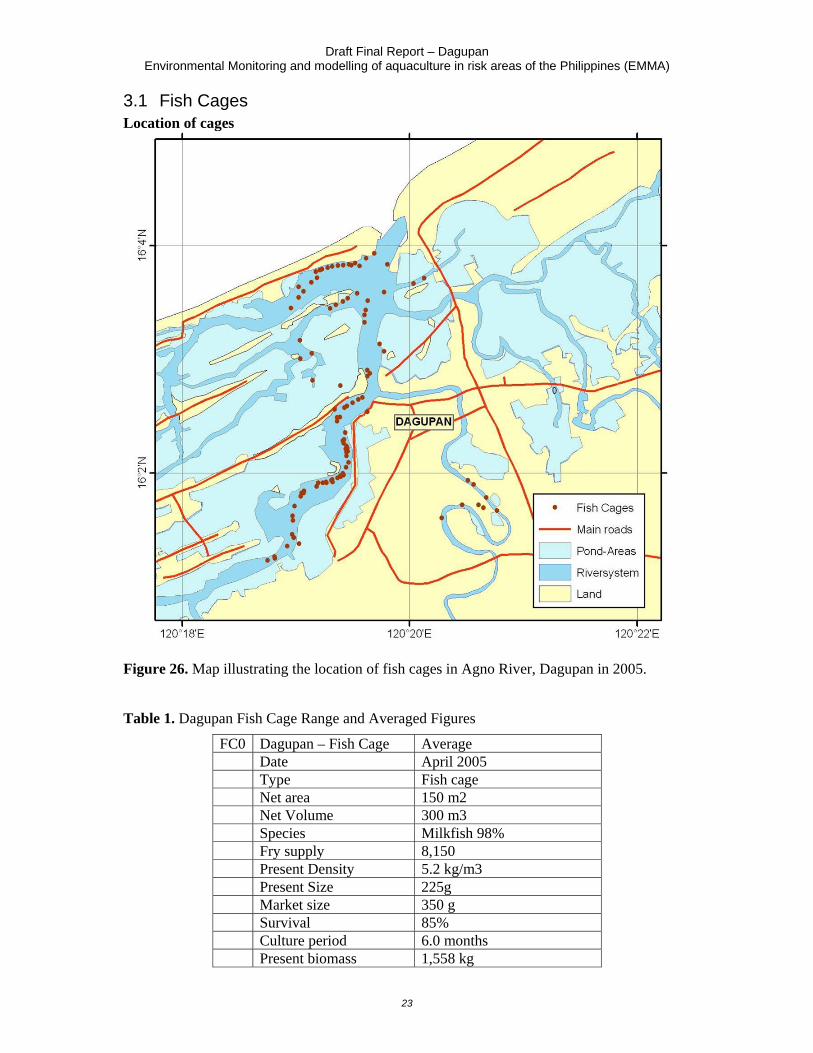
3.1 Fish Cages Location of cages
Figure 26. Map illustrating the location of fish cages in Agno River, Dagupan in 2005.
Table 1. Dagupan Fish Cage Range and Averaged Figures
FC0 Dagupan – Fish Cage Average Date April 2005 Type Fish cage Net area 150 m2 Net Volume 300 m3 Species Milkfish 98% Fry supply 8,150 Present Density 5.2 kg/m3 Present Size 225g Market size 350 g Survival 85% Culture period 6.0 months Present biomass 1,558 kg
Draft Final Report – Dagupan Environmental Monitoring and modelling of aquaculture in risk areas of the Philippines (EMMA)
24
Fish Cages There are 124 cages, 122 operational and 2 not operational. Average The average fish cage has a volume of 300 m3 and stocked with milkfish (98%). Each cage is stocked with 8,150 fry at 2g size and is grown to a market size of 350 grams in 6 months. The cages are presently stocked with 6,928 fish with an average size of 225 grams and have a stocking density of 5.2 kg/m3.
Total The total operational fish cages have a volume of 36,600 m3 and are stocked with milkfish (98%). There are 994,300 fry stocked at 2g size and are grown to a market size of 350 grams in 6 months.
The pens are presently stocked with 845,155 fish with an average size of 225 grams and have a stocking density of 5.2 kg/m3. The standing stock is 190 tonnes.
A production cycle from stocking fry to harvest size is 6 months giving 2.0 crops per year per pen. The average market size is 350 grams. The total production per cycle is 295.8 tonnes and the total production per year from pen culture is 591.6 tonnes.
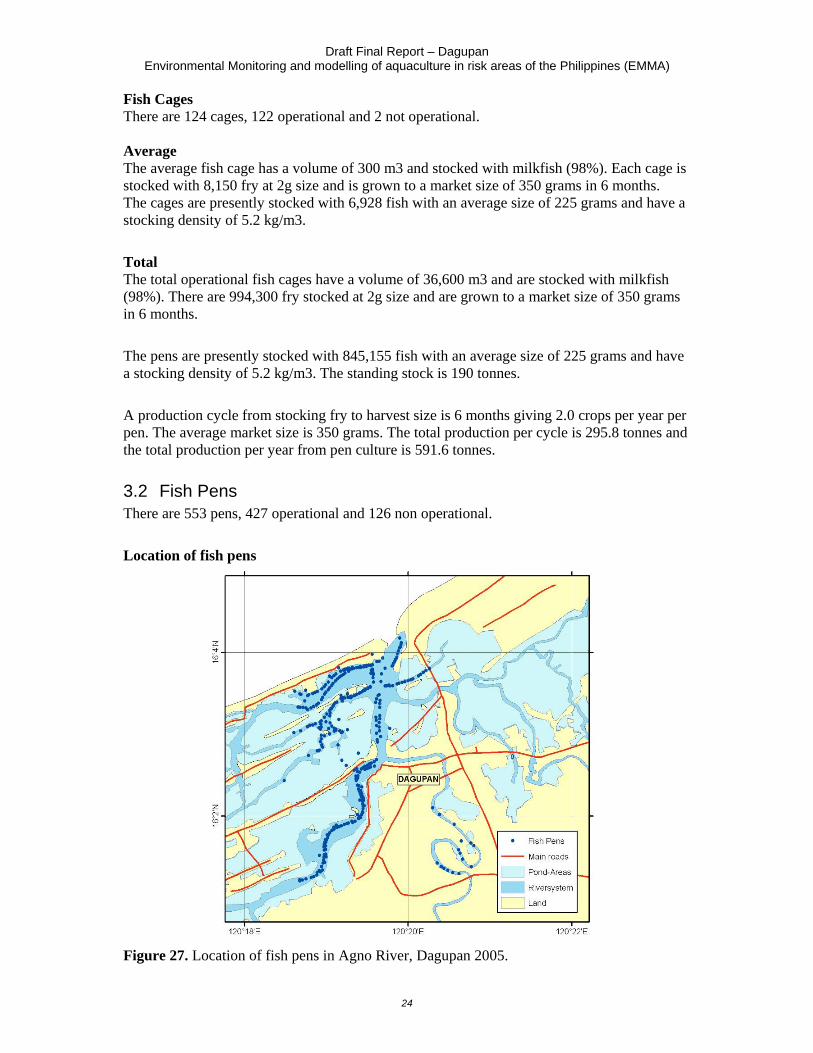
3.2 Fish Pens There are 553 pens, 427 operational and 126 non operational.
Location of fish pens
Figure 27. Location of fish pens in Agno River, Dagupan 2005.
Draft Final Report – Dagupan Environmental Monitoring and modelling of aquaculture in risk areas of the Philippines (EMMA)
25
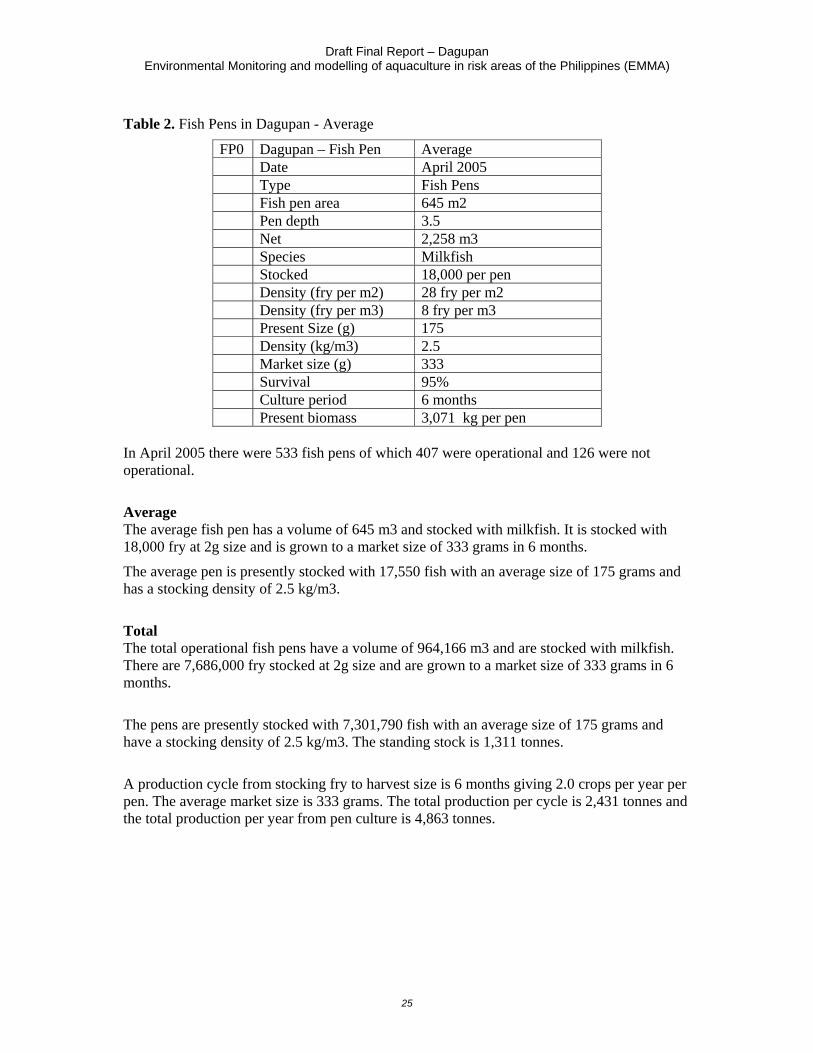
Table 2. Fish Pens in Dagupan - Average
FP0 Dagupan – Fish Pen Average Date April 2005 Type Fish Pens Fish pen area 645 m2 Pen depth 3.5 Net 2,258 m3 Species Milkfish Stocked 18,000 per pen Density (fry per m2) 28 fry per m2 Density (fry per m3) 8 fry per m3 Present Size (g) 175 Density (kg/m3) 2.5 Market size (g) 333 Survival 95% Culture period 6 months Present biomass 3,071 kg per pen
In April 2005 there were 533 fish pens of which 407 were operational and 126 were not operational.
Average The average fish pen has a volume of 645 m3 and stocked with milkfish. It is stocked with 18,000 fry at 2g size and is grown to a market size of 333 grams in 6 months.
The average pen is presently stocked with 17,550 fish with an average size of 175 grams and has a stocking density of 2.5 kg/m3.
Total The total operational fish pens have a volume of 964,166 m3 and are stocked with milkfish. There are 7,686,000 fry stocked at 2g size and are grown to a market size of 333 grams in 6 months.
The pens are presently stocked with 7,301,790 fish with an average size of 175 grams and have a stocking density of 2.5 kg/m3. The standing stock is 1,311 tonnes.
A production cycle from stocking fry to harvest size is 6 months giving 2.0 crops per year per pen. The average market size is 333 grams. The total production per cycle is 2,431 tonnes and the total production per year from pen culture is 4,863 tonnes.
Draft Final Report – Dagupan Environmental Monitoring and modelling of aquaculture in risk areas of the Philippines (EMMA)
26
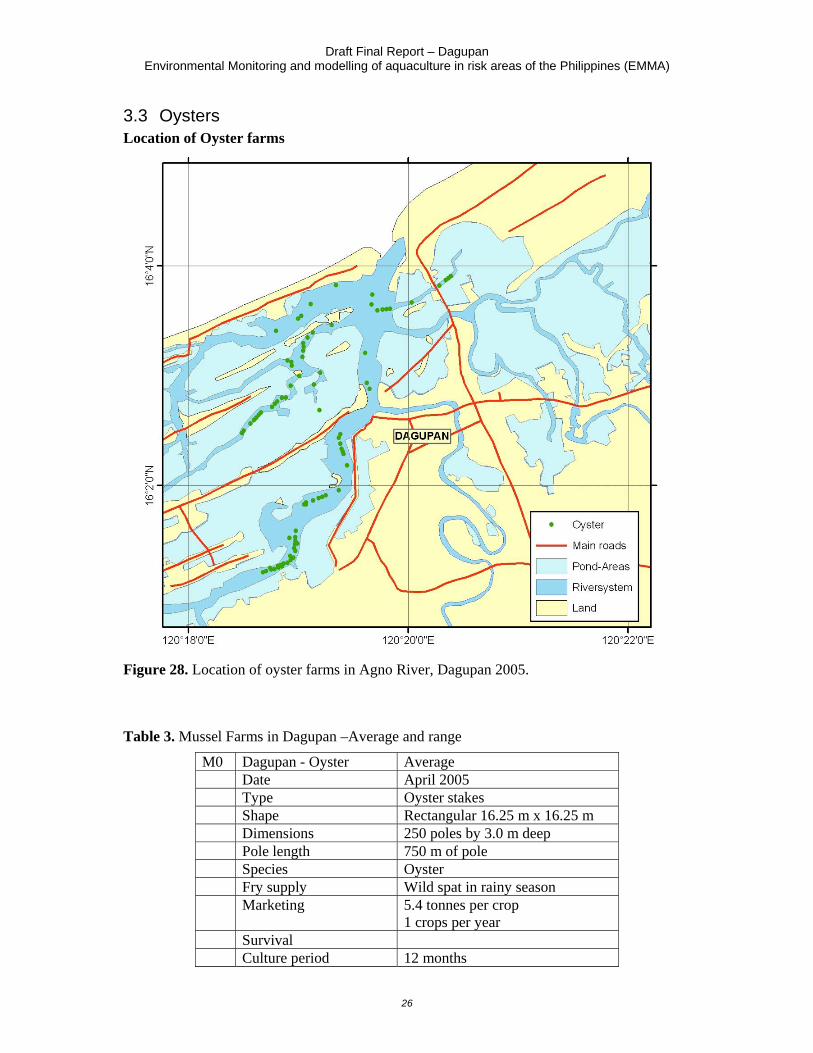
3.3 Oysters Location of Oyster farms
Figure 28. Location of oyster farms in Agno River, Dagupan 2005.
Table 3. Mussel Farms in Dagupan –Average and range
M0 Dagupan - Oyster Average Date April 2005 Type Oyster stakes Shape Rectangular 16.25 m x 16.25 m Dimensions 250 poles by 3.0 m deep Pole length 750 m of pole Species Oyster Fry supply Wild spat in rainy season Marketing 5.4 tonnes per crop
1 crops per year Survival Culture period 12 months
Draft Final Report – Dagupan Environmental Monitoring and modelling of aquaculture in risk areas of the Philippines (EMMA)
27
Oyster Farms There are 94 oyster farms of which 93 are operational and 1 is not operational. The total operational oyster farms have 23,250 poles with a total length of 69,750 meters of pole. The production per cycle from all the oyster farms is 502 tonnes from 1 cycle per year.
Total Production from Dagupan In total in April 2005 there was a standing stock of 1,451.3 tonnes of fish and an annual production of 4,739.6 tonnes of fish. During April an estimated average of 26 tonnes of fish feed was fed per day.
There was an annual production of 502 tonnes of oysters (extractive species).
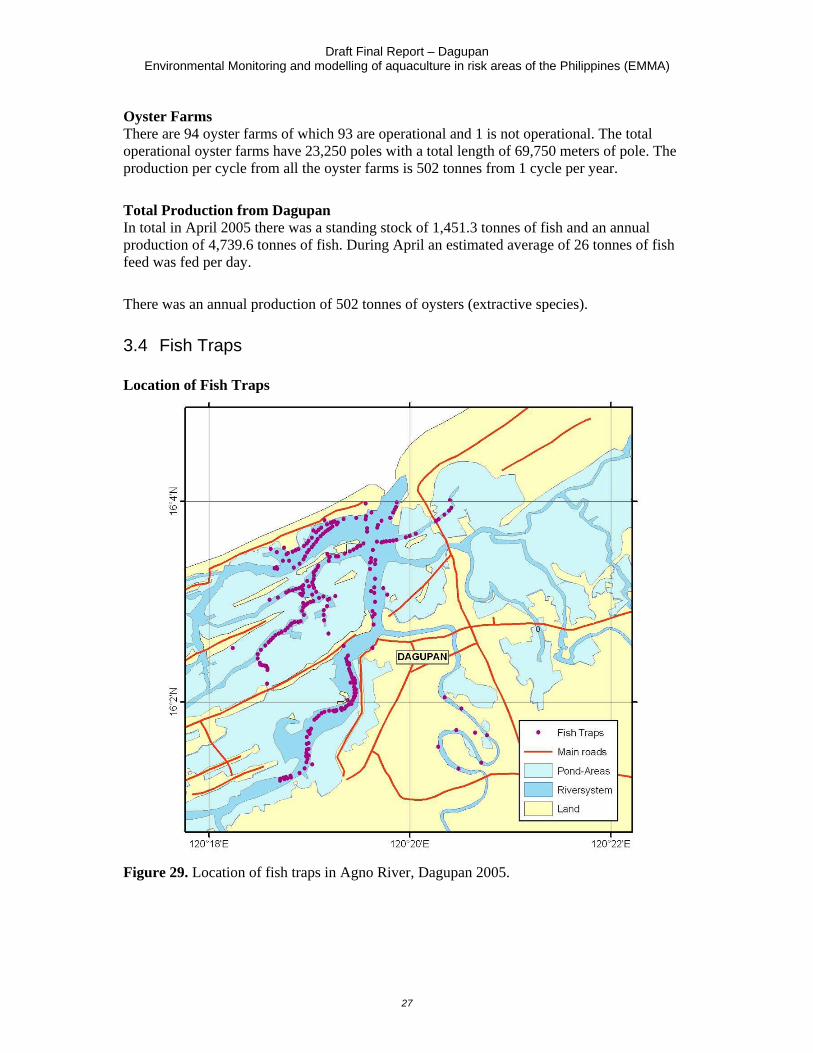
3.4 Fish Traps Location of Fish Traps
Figure 29. Location of fish traps in Agno River, Dagupan 2005.
Draft Final Report – Dagupan Environmental Monitoring and modelling of aquaculture in risk areas of the Philippines (EMMA)
28
Total Production from Dagupan In total in April 2005 there was a standing stock of 1,501 tonnes of fish and an annual production of 5,454 tonnes of fish. During April an estimated average of 39 tonnes of fish feed was fed per day.
There was an annual production of 502 tonnes of oysters (extractive species).
The sea surface area in Dagupan is 67,835,357 m2 or 6,783.5 ha (The extent of the fish ponds is 3,368,667.061 m2 or 336 ha) so productivity was 804 kg of fish per ha and 74 kg per ha of extractive species.
3.5 Modelling carrying capacity The volume of the receiving body of water is V = 0.3 109 m3. The volume is derived from the surface area of the estuary, which is 68 106 m2 and the depth of 4.4 m. The depth is obtained from detailed bathymetric measurements within the project.
Average inflow of the river feeding the estuary during the most critical period (end of the dry season) is 38.4 m3/s = 3.3 106 m3/day. This is based on the current measurements within the project. The average current at the centre of the measurement station is 10.5 cm/s with a current distribution factor of 0.5, river width of 140 m, the depth of 8.7 m and a cross-sectional shape factor of 0.6.
The flushing rate is: D = (inflow=outflow)/V = 0.011 (1/day). The estuary needs 91 days to renew one volume of water. Net inflow of aquacultures including resuspension is: Fn = 146 kg (phosphorus)/day (White, 2006 b) Hence, the contribution of fish cultures to the nutrient concentration in phytoplankton is: Ia = 146 (kg_P/day) / (0.011 (1/day) * 0.3 109 (m3) ) = 44.2 (mg_P/ m3 = μg_P/l) According to the Florida Lakewatch relationship: Log10 (μg Chl-a/l) = – 0.369 + 1.053 Log10 (μg TP/l) The value of total phosphorus translates to 23.1 μg Chl-a/l. Discussion From the above calculation it would appear that the carrying capacity of the Dagupan estuary has not been overcome. However, the above contribution to Chl-a value has been derived only from limiting nutrient inflow from fish cultures.
Two other nutrient inflows have not been considered:
Draft Final Report – Dagupan Environmental Monitoring and modelling of aquaculture in risk areas of the Philippines (EMMA)
29
a) from people, their agriculture and animal farming activities. This input is very important and it probably contributes as much as the existing fish cultures.
b) nutrient concentration in the river water feeding the estuary. Depending on the activities upstream the estuary, this input could contribute one quarter to one half of fish cultures.
If a) and b) were also taken into account, it would still turn out that the natural carrying capacity of the Dagupan estuary under consideration has not yet been reached.
The above calculation is based on the river inflow of 38 m3/s. We know that the river inflow feeding the estuary is not constant but varies greatly. During the dry season, the river inflow may be smaller. When the river inflow is half the one that has been measured, the contribution of fish cultures together with other existing inflows, overcome the natural carrying capacity. During this time of the year, fish kills would be imminent.
According to the existing information, this has already happened at the end of the dry season, which is characterized by the lowest river inflow.
4 Possible management measures The assumption here is that fish kills occur due to lack of oxygen consumed by high concentration of phytoplankton during several consecutive overcast days.
1. Construction of retention basins above the estuary. Carrying capacity depends on the exchange of water. The inflow of water, and hence the exchange, is the smallest during the end of the dry season ehrn probability of fish kills is the highest. Significant increase of water inflow during the most critical period could be achieved by constructing retention basins upstream the estuary. Retention basins could be used for production of electricity and hence their beneficial effect of increasing the inflow of water during the most critical period would come free to the fish culture industry.
2. Fish feeding practices need to change It has been shown within the project that fish caretakers are overfeeding the fish.
Less feeding and different feeding practice will enable production which is safer, costs less and benefits more both people and the environment. This measure could be implemented by organizing training workshops for all fish caretakers and owners.
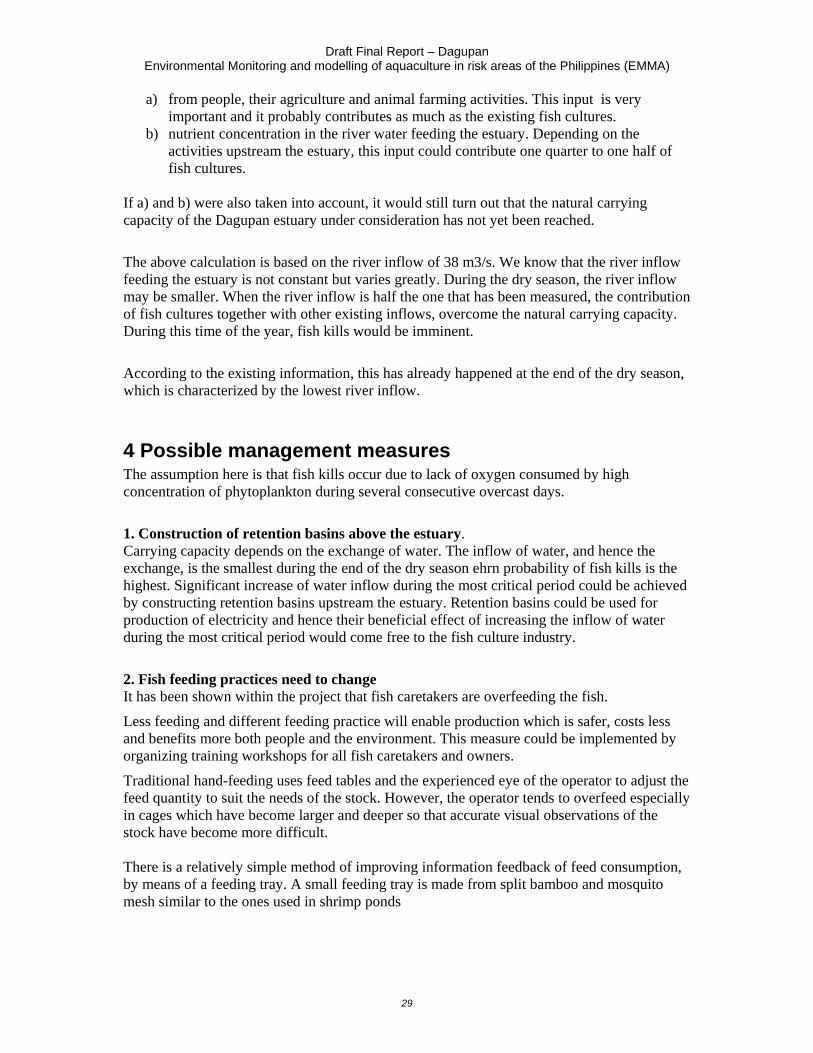
Traditional hand-feeding uses feed tables and the experienced eye of the operator to adjust the feed quantity to suit the needs of the stock. However, the operator tends to overfeed especially in cages which have become larger and deeper so that accurate visual observations of the stock have become more difficult. There is a relatively simple method of improving information feedback of feed consumption, by means of a feeding tray. A small feeding tray is made from split bamboo and mosquito mesh similar to the ones used in shrimp ponds
Draft Final Report – Dagupan Environmental Monitoring and modelling of aquaculture in risk areas of the Philippines (EMMA)
30
.
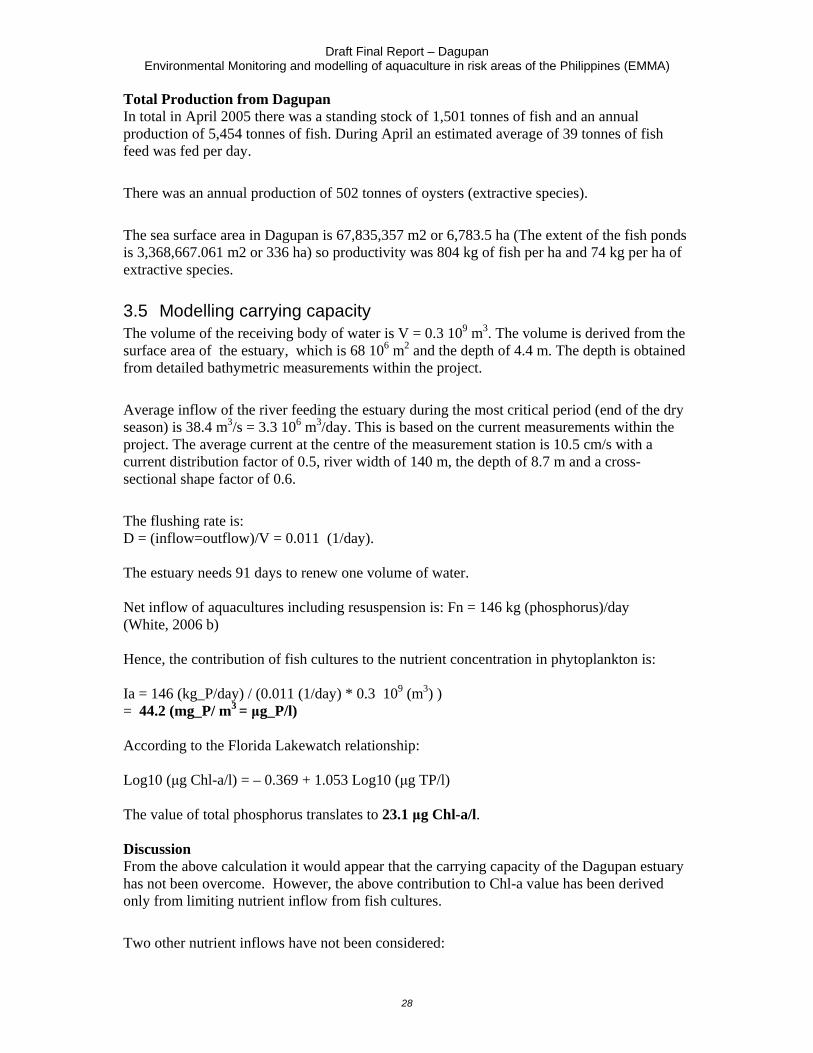
Figure 30. feed monitoring tray.
This has a sting long enough to reach from the bottom of the cage to the surface. The tray is lowered to the bottom of the cage before feeding and then the operator stats to feed. After some time of feeding the tray is lifted out of the water to see if there are any pellets caught on the mesh. If there are pellets then freed would have been escaping from the bottom of the net with being eaten. If there are no pellets, then the tray is lowered again and feeding recommenced. This action is repeated until pellets are found on the tray at which time feeding is stopped for at least one hour. The tray could be fitted with a long bamboo to make the lifting easier.
Figure 31. Feeding tray with pole.
A more sophisticated method is to use airlift pumps. Feed may is given until a significant number of pellets are observed being drawn up through the airlift pump by the operators. Feeding is then stopped. Reducing feed input Another strategy to reduce feeding is to reduce the amount fed either by reducing daily ration or by not feeding on certain days.
Draft Final Report – Dagupan Environmental Monitoring and modelling of aquaculture in risk areas of the Philippines (EMMA)
31
3. Polyculture of fish and shellfish Since the phytoplankton is going to consume oxygen when oxygen content is critical, it would be advantageous to combine fish with shellfish aquaculture. This measure is identical to the measure no. 4. for the Taal Lake.
4. Periodic (seasonal) growth of fish At the time when the water inflow is at its minimum, the carrying capacity is at the minimum too, hence it would be the best that the number of fish in aquacultures at this time is at the minimum. This is a temporary measure until the measure no. 1 takes effect.
5. Limiting land based nutrient sources Land based nutrient sources contribute significantly to the nutrient input into the estuary. Decreasing these sources will increase carrying capacity for fish farms. Sewage from the city and communities should be treated and channelled to the sea. This project will be an expensive one and will take long time to complete, but any improvement in this direction would be beneficial to fish culture activities.
Any garbage and waste generated in the area of the estuary should be regularly collected, adequately disposed and treated. This would require improvement in the garbage collection and disposal system. Very important complement to the above activity is the education of young people by adding lectures in schools and organizing periodic garbage collection activities from the most sensitive places.
6. Disposal of dead fish During site visit we have seen dead fish in water inside or near fish farms. It should be forbidden to leave any dead fish in water. Dead fish are decomposed in water. decomposition process consumes oxygen and releases nutrients into the water column. Both processes decrease carrying capacity for fish farms.
7. Cleaning of fish nets Due to fouling of fish nets, it is essential to periodically clean the nets. However, nets must not be treated with antifouling paints.
8. Using wind power to oxygenate water When oxygen drops to 2 mg/l oxygenation of water must start. Electric generators are most reliable, since they pump on demand. But, being on the border between the sea and land mass in the background, means that due to differential heating, there exists a difference in atmospheric pressure over the land and the sea.
This generates daily wind that may be used for oxygenating water within fish farms.
A simple wind driven pumps could be installed on aquacultures. Prior to that a diploma work to a student should be given to investigate feasibility of this measure.
In case this is feasible, both fish farmers and local industry would profit.
Draft Final Report – Dagupan Environmental Monitoring and modelling of aquaculture in risk areas of the Philippines (EMMA)
32
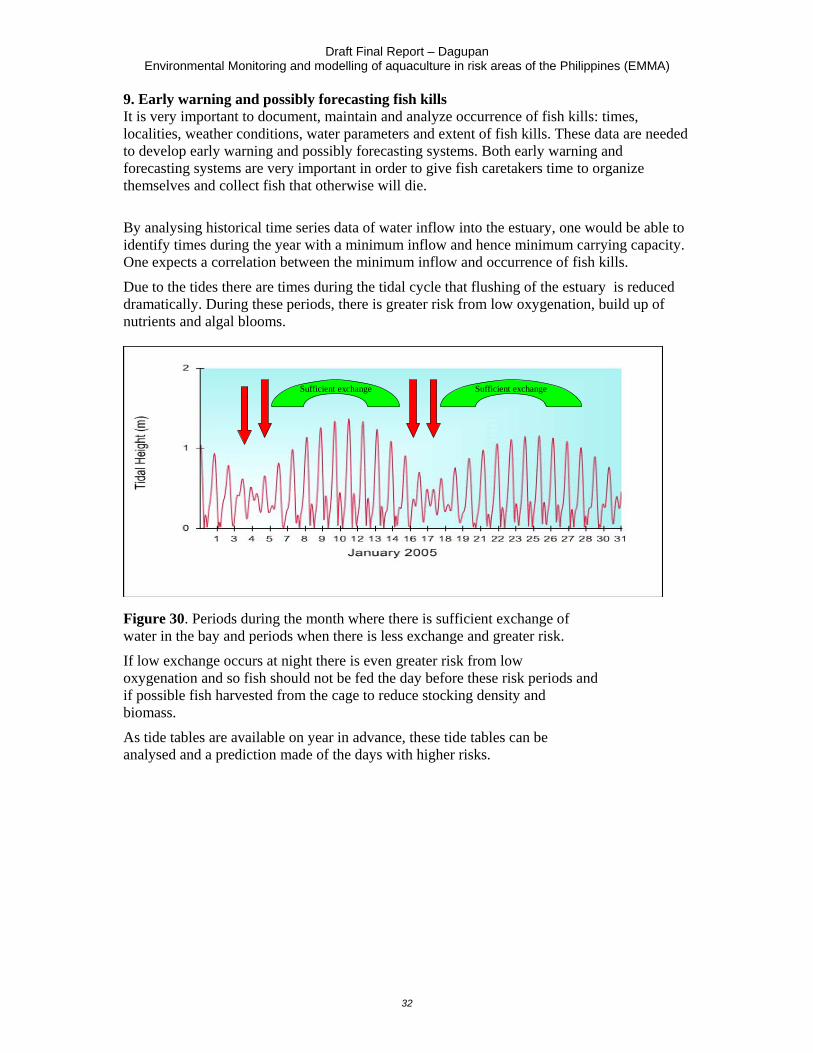
9. Early warning and possibly forecasting fish kills It is very important to document, maintain and analyze occurrence of fish kills: times, localities, weather conditions, water parameters and extent of fish kills. These data are needed to develop early warning and possibly forecasting systems. Both early warning and forecasting systems are very important in order to give fish caretakers time to organize themselves and collect fish that otherwise will die.
By analysing historical time series data of water inflow into the estuary, one would be able to identify times during the year with a minimum inflow and hence minimum carrying capacity. One expects a correlation between the minimum inflow and occurrence of fish kills.
Due to the tides there are times during the tidal cycle that flushing of the estuary is reduced dramatically. During these periods, there is greater risk from low oxygenation, build up of nutrients and algal blooms.
Figure 30. Periods during the month where there is sufficient exchange of water in the bay and periods when there is less exchange and greater risk.
If low exchange occurs at night there is even greater risk from low oxygenation and so fish should not be fed the day before these risk periods and if possible fish harvested from the cage to reduce stocking density and biomass.
As tide tables are available on year in advance, these tide tables can be analysed and a prediction made of the days with higher risks.
Sufficient exchange Sufficient exchange
Draft Final Report – Dagupan Environmental Monitoring and modelling of aquaculture in risk areas of the Philippines (EMMA)
33
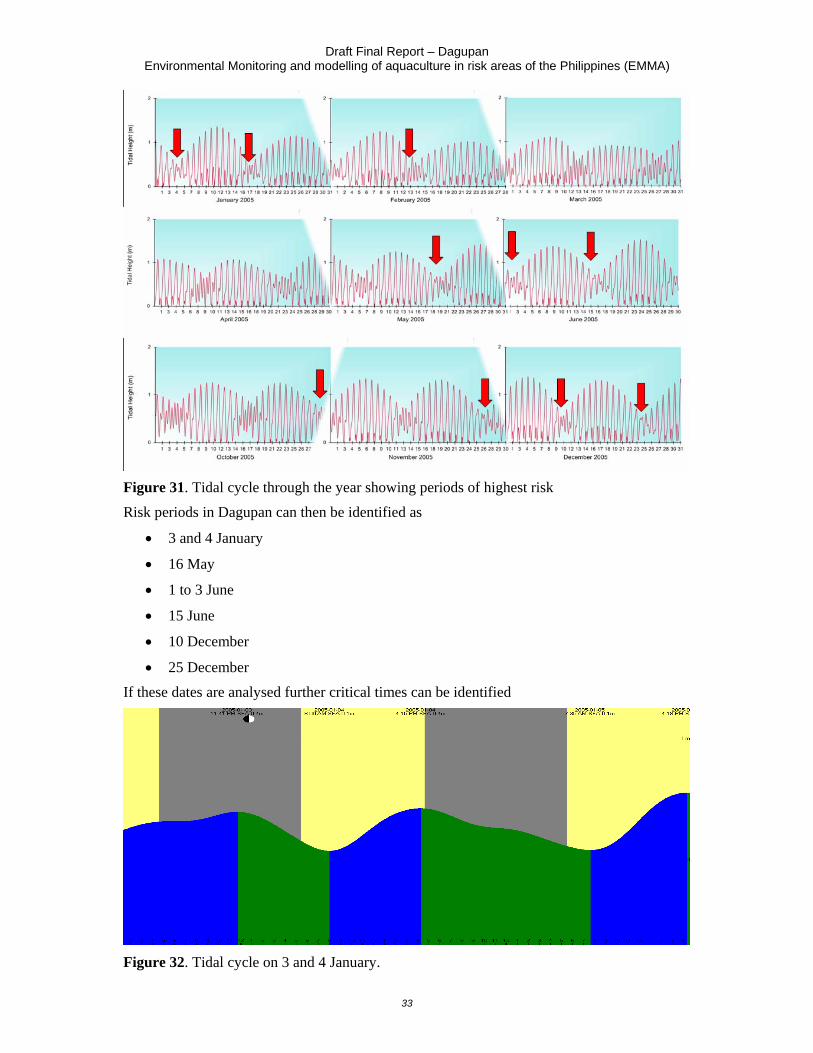
Figure 31. Tidal cycle through the year showing periods of highest risk
Risk periods in Dagupan can then be identified as
• 3 and 4 January
• 16 May
• 1 to 3 June
• 15 June
• 10 December
• 25 December
If these dates are analysed further critical times can be identified
Figure 32. Tidal cycle on 3 and 4 January.
Draft Final Report – Dagupan Environmental Monitoring and modelling of aquaculture in risk areas of the Philippines (EMMA)
34
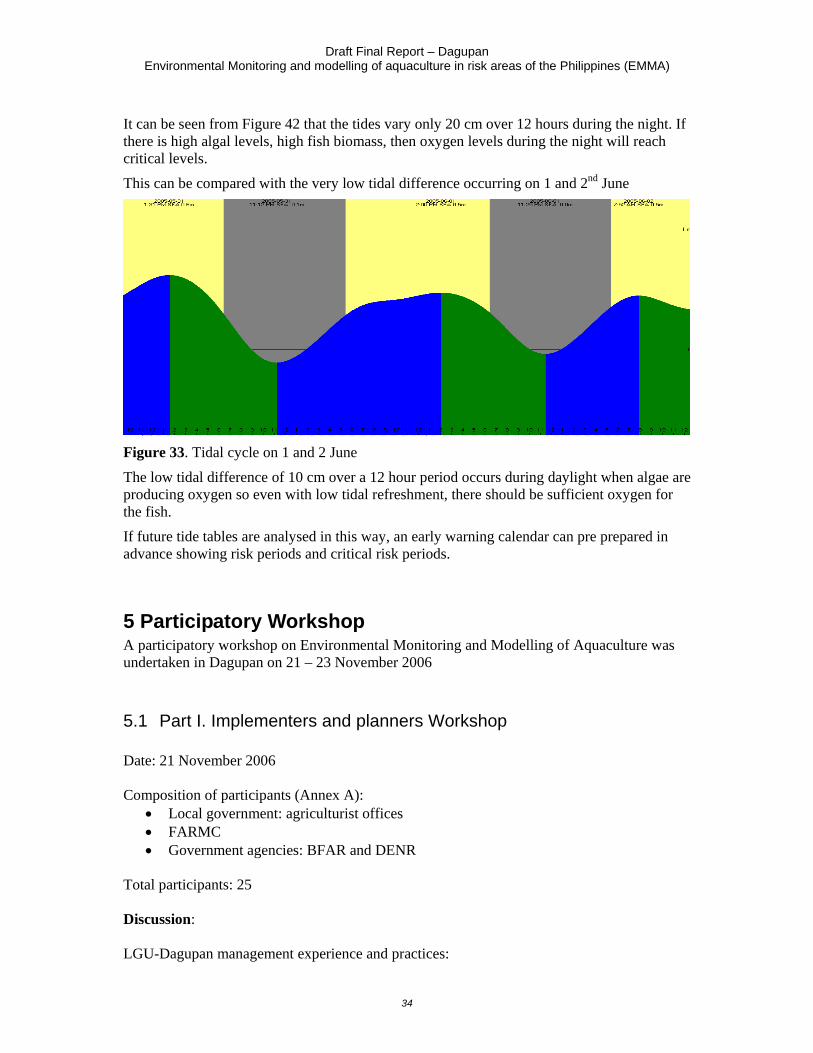
It can be seen from Figure 42 that the tides vary only 20 cm over 12 hours during the night. If there is high algal levels, high fish biomass, then oxygen levels during the night will reach critical levels.
This can be compared with the very low tidal difference occurring on 1 and 2nd June
Figure 33. Tidal cycle on 1 and 2 June
The low tidal difference of 10 cm over a 12 hour period occurs during daylight when algae are producing oxygen so even with low tidal refreshment, there should be sufficient oxygen for the fish.
If future tide tables are analysed in this way, an early warning calendar can pre prepared in advance showing risk periods and critical risk periods.
5 Participatory Workshop A participatory workshop on Environmental Monitoring and Modelling of Aquaculture was undertaken in Dagupan on 21 – 23 November 2006
5.1 Part I. Implementers and planners Workshop Date: 21 November 2006 Composition of participants (Annex A):
• Local government: agriculturist offices • FARMC • Government agencies: BFAR and DENR
Total participants: 25 Discussion: LGU-Dagupan management experience and practices:
Draft Final Report – Dagupan Environmental Monitoring and modelling of aquaculture in risk areas of the Philippines (EMMA)
35
• Annual renewal of permit. The license costs P9,200 (annually) + P2,500 (RDU, one-time payment). The Resource Use Deposit (RUD) is used to pay violations, but is refundable if no violations were committed. Total number of licenses issued: 1,000
• Stocking density: 10,000 pcs per cage (maximum)
• Zoning:
- 300 m2 (minimum area/operator) - 900 m2 (maximum area/operator) - 10 m space in between cages/pens - 50 m space in between rows of cages/pens - the buffer zones, i.e. 10 m and 50 m buffers are also being used by small fishermen for hook and line fishing - 60 m allotted for navigation routes - if river has < 10 m (width), no structures are allowed to be established - rivers were classified into aquaculture zone (7), non-fishing zone (2) and fishpond area (1) - total area: 649 ha
• 5 feeds company accredited • Monitoring is being conducted by LGU and FARMC
• At present, higher number of cages but smaller in size, in contrast with the past
practice of having less no. of cages but composed of bigger sizes. The aim of this practice is to increase the number of stakeholders
• Existing oyster cultures, mussels and panes (not so much)
Some recommendations that came up during the discussion: 1. Putting up of shellfish farms between cages to reduce nutrient loading 2. Identify areas which is high in chlorophyll-a and these areas can be designated as
shellfish farm zone 3. Conduct 2 surveys to determine seasonal changes. The data will be used to determine the
carrying capacity of the area 4. LGU is interested in determining the relationship between salinity and success in
aquaculture production 5. Database establishment (historical and present data) 6. Involvement of other municipalities in the management 7. Possibility of having an ecosystem-based management of farms. This means encouraging
the participation of other municipalities. 8. Availability of information on tidal patterns 9. Feeding strategies. Training of farmers in terms of optimized and correct way of feeding 10. Use of modelling in calculating production, one-year ahead. 11. Use of aerial photography (for yearly comparison) Conclusion (priorities):
1. Determine optimal feeding practice/strategy
Draft Final Report – Dagupan Environmental Monitoring and modelling of aquaculture in risk areas of the Philippines (EMMA)
36
2. Use of extractive species, e.g. pearl oyster. Give incentives to oyster farm operators, e.g. cheaper annual fee to encourage the practice
3. Improvement of the data to model carrying capacity of the area 4. Establishing an early warning system 5. * Ecosystem-based management 6. Establishment of city database system (historical data, EMMA data, *water quality
data, aerial photography) * Needs funding
5.2 Part II. Stakeholders Workshop Date: 22 November 2006 Composition of participants Annex C):
• Local government: agriculturist offices • FARMC • Government agencies: BFAR, DSWD DENR • Academe: Pangasinan State University • Fishpond operators
Total no: 36 Discussion: 1. Suggestion on non-yearly fee for farms located in unproductive areas. 2. Problems on low supply of fry (due to high mortality in fish ponds) during rainy season where stocking is favourable was discussed. Some suggestions include higher production to be done by BFAR and provision of subsidies by the city government to be taken from the licensing fees. 3. Non-feasibility of oyster farms. Based from the fishers´experience, oysters die when there is high fish density stocking. It was suggested that an area should be identified solely for the purpose of oyster farm. 4. One of the fish operators, Atty. Navarro volunteered to use his farm as one of the demonstration sites for experimental purposes. BFAR will be in-charged on this one. 5. Non-feasibility of oyster farms and shrimp culture at Bayawas river. One has suggested to reduce the number of fish pens so the nutrient loading will decrease, and this in turn will also benefit the fish pond operators. 6. There was a speculation that the presence of La Tondena and Coca cola companies has caused the disappearance of shrimps in the area. Suggestions to address this issue were feed minimization and co-management strategies/practices. Recommendations:
Draft Final Report – Dagupan Environmental Monitoring and modelling of aquaculture in risk areas of the Philippines (EMMA)
37
1. Feeding strategies and practices Dissemination of feeding practices and strategies to the fish pond operators will be initiated by the City Agricultural Offices. LGU-Dagupan has informed the group that before they issue the license, the operators/owners are required to attend their Aquaculture Livelihood Training. Moreover, Caretakers’ training and feedback mechanism needs to be established as well. Training materials will be provided for the caretakers, owners and financiers. Funding for this training will be sought after. 2. Shellfish and Fish farms Chl-a data from 10 stations (CY 2000-2005) will be inputted at the EMMA database system and demonstration farms at Atty. Navarro´s fish farm will also be put up. Zoning of the area as fishing and shellfish farms was also considered. 3. Early warning system by using tidal cycle will be established. 4. Co-management strategy to manage the common resource involving BFAR-IFAD (speaker), BFAR 1 (provincial level) and IFARMC (Integrated Fisheries and Aquatic Resource Management Committee). Schedule of activities:
Activity
Date
1. Training on feeding practices and preferred management (3-6 months period) 2. Farming extractive species e.g. oysters, pearl oysters, mussels. Phytoplankton historical data (5 years) will be used in identifying optimum locations in setting up of demo farms 3. Identification of carrying capacity (distributed) within critical areas 4. Setting up of early warning system, data will be sourced out from PAGASA (3 months period) 5. Ecosystem management (IFARMC and BFAR 1). Ecosystem-based management for aquaculture conference. Invitation of governors, IFARMC and Cluster 4 (The information from 4 and 5 will be used in forecasting the carrying capacity of the area a year ahead) 6. Data collection on river flow (c/o UPMSI-MERF for the calibration curve) and water level (c/o LGU)
29-30 Nov. 2006 31 Dec. 2006

Draft Final Report – Dagupan Environmental Monitoring and modelling of aquaculture in risk areas of the Philippines (EMMA)
38
7. EMMA GIS historical data (water chemistry, precipitation, temp. of air and water, c/o BFAR) and autodesk map (c/o LGU) 8. Aerial photography. All neighbouring municipalities will take part.
5.3 Part III. Workshop on Mariculture Parks
Workshop on Environmental Monitoring and Modelling of Aquaculture in Mariculture Parks
Date: 23 November 2006 Composition of participants:
• Local government • Government agencies: DENR, BFAR • Academe: DMMMSU
Total no. of participants: 23 Discussion:
1. Baseline study: - to asses the environment before setting up of aquaculture - to aid in identification of suitable aquaculture zone
2. Carrying capacity modeling:
To compute the carrying capacity of the area, some data are needed: current speed and direction, tidal data, bathymetry, O2 level, salinity, chlorophyll-a, wave height, wind data, fetch, and historical data
3. Sediment sampling as an indicator of flushing rate, since grain size is related to water
current *Participants had requested for a template (list of indicators) as a basis in establishing a mariculture park. 4. Zoning and development of regulations based on environmental criteria Farm design and lay-outing
Draft Final Report – Dagupan Environmental Monitoring and modelling of aquaculture in risk areas of the Philippines (EMMA)
39
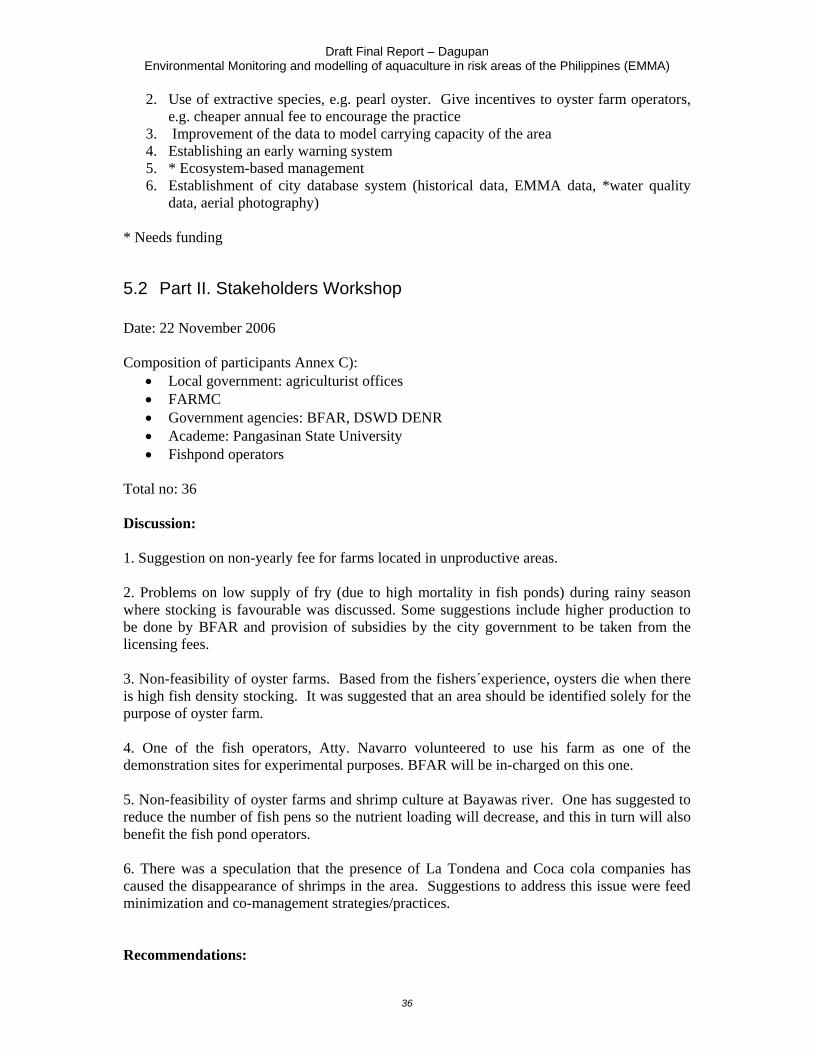
Stocking density of 1,000 fry per cage. The lay-out of the aquaculture zone (blue border) confines the impact of aquaculture within this border. 5. Mariculture park / lay-out Establishment of demo hatchery for groupers, “pampano”, sea bass, snapper and abalone (“one stop shop”). A 5-page paper proposal with costings will be prepared.
- hatchery - packing/processing
- I ?
Development of market for the products 6. Regular environmental survey
7. Monitoring of compliance
30 m buffer
50 m buffer
1 m buffer
wave
Fish farm

Draft Final Report – Dagupan Environmental Monitoring and modelling of aquaculture in risk areas of the Philippines (EMMA)
40
Sediment sampling: parameters include TOC (total organic carbon), turbidity, color, smell, and presence of living organisms.
Current direction
X X X X XFish farm
Draft Final Report – Dagupan Environmental Monitoring and modelling of aquaculture in risk areas of the Philippines (EMMA)
41
ANNEX A. Part I: DIRECTORY OF PARTICIPANTS COMPANY/AGENCY NAME ADDRESS CONTACT
NO. EMAIL
LGU
Office of Provincial Agriculturist
Raymund Cacayurin Binmaley, Pangasinan (75) 542-2115
City Agriculturist Carloyd M. Faustino Dagupan City (75) 513-4924 City Agriculture Office Emma J. Molina City Hall Complex, Dagupan
City (75) 523-4829 [email protected]
City Planning Dept. Office
Angelina C. Bonifacio Dagupan City (75) 542-4018
City Agriculturist Office Felita C. Ugaban Dagupan City (75) 523-4829 FARMC (?)
Alfredo T. Caguioa Tapuac, Dagupan City 920 905 0313 BFAR
BFAR-NIFTDC Jocelyn V. Jovellanos Dagupan City (75) 523-5412 [email protected] BFAR-NIFTDC Pedro A. de Vera Dagupan City (75) 523-5412 BFAR-NIFTDC Romeo R. Visperas BFAR-NIFTDC (75) 523-5412 BFAR-NIFTDC Regino R. Regpala BFAR-NIFTDC (918) 645-0534 [email protected] BFAR-NIFTDC Jade Aquino Lingayen, Pangasinan (75) 523-0385 BFAR-NIFTDC Evelyn Dangla Dagupan City (75) 523-5412 [email protected] BFAR-NIFTDC Nerafe C. Muyalde Calasiao, Pangasinan [email protected] BFAR-RFO I-Lucap Logen F. Enriquez BFAR-RFO I (072) 242-1559 [email protected] BFAR Central Office Luzviminda R. dela Cruz PCA Complex, Elliptical Rd.
Diliman, QC (2) 929-3439 [email protected]
Draft Final Report – Dagupan Environmental Monitoring and modelling of aquaculture in risk areas of the Philippines (EMMA)
42
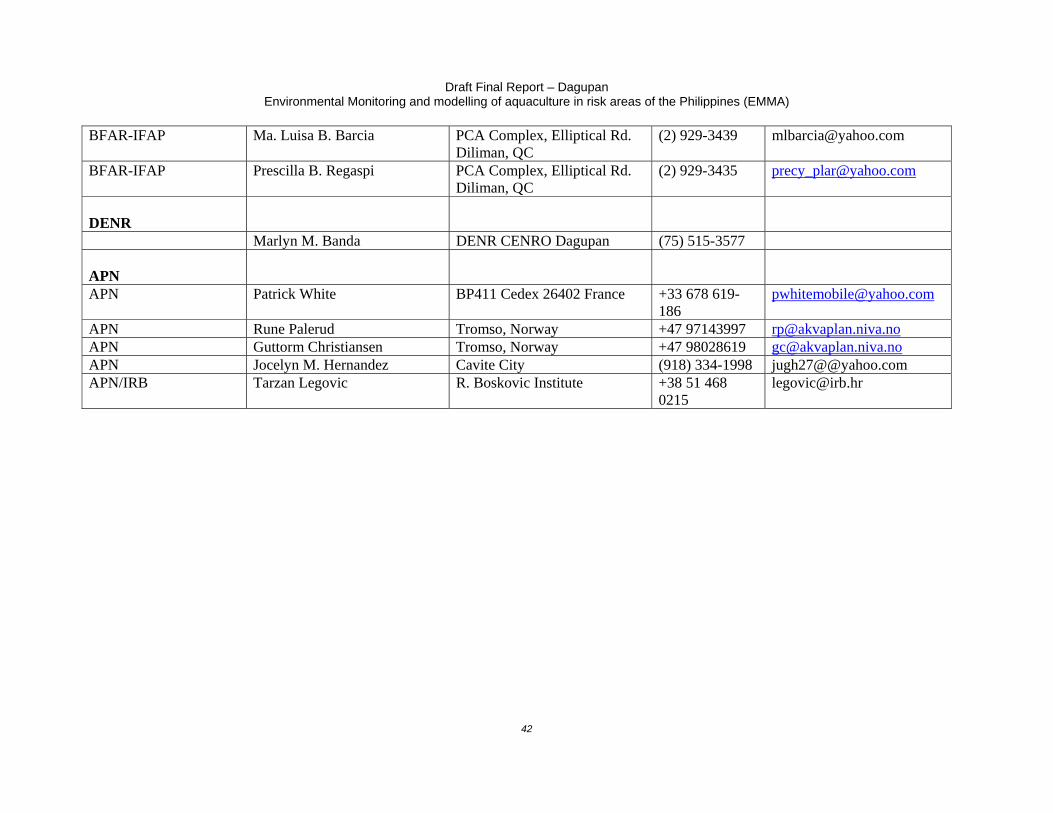
BFAR-IFAP Ma. Luisa B. Barcia PCA Complex, Elliptical Rd. Diliman, QC
(2) 929-3439 [email protected]
BFAR-IFAP Prescilla B. Regaspi PCA Complex, Elliptical Rd. Diliman, QC
(2) 929-3435 [email protected]
DENR
Marlyn M. Banda DENR CENRO Dagupan (75) 515-3577 APN
APN Patrick White BP411 Cedex 26402 France +33 678 619-186
APN Rune Palerud Tromso, Norway +47 97143997 [email protected] APN Guttorm Christiansen Tromso, Norway +47 98028619 [email protected] APN Jocelyn M. Hernandez Cavite City (918) 334-1998 jugh27@@yahoo.com APN/IRB Tarzan Legovic R. Boskovic Institute +38 51 468
0215 [email protected]
Draft Final Report – Dagupan Environmental Monitoring and modelling of aquaculture in risk areas of the Philippines (EMMA)
43
Part II: DIRECTORY OF PARTICIPANTS
COMPANY/AGENCY
NAME
ADDRESS
CONTACT NO.
LGU
City Agriculturist Carloyd M. Faustino Dagupan City (75) 513-4924 City Agriculture Office Emma J. Molina City Hall Complex, Dagupan City (75) 523-4829 [email protected] City Planning Dept. Office
Angelina C. Bonifacio Dagupan City (75) 542-4018
City Planning Dept. Office
Antonio U. Maningding Dagupan City (75) 542-4018
City Agriculturist Office Felita C. Ugaban Dagupan City (75) 523-4829 City Agriculturist Office Alberto Bautista LGU-Binmaley Lina S. Bravo Binmaley LGU-Binmaley Elsa Rosario Binmaley LGU-Binmaley Genine C. Gabrillo Binmaley LGU-Binmaley Virginia Vesperas Binmaley FARMC
PFARMC * Antonio S. de Vera 29 Mabini St. Binmaley (918) 556-9140 IBFARMC Chairman * Oscar C. Benitez Pugaro Suit, Dagupan City BFARMC Chairman * Fernando S. Escario Pugaro Suit, Dagupan City BFARMC * Fidel G. Serrano Bonuan, Boquig (75) 523-6363 CFARMC * Bienvenido Callasit Bacayao Norte CFARMC * Jesus Peria Dagupan (916) 745-4377 BFAR
BFAR-NIFTDC Jocelyn V. Jovellanos Dagupan City (75) 523-5412 [email protected] BFAR-NIFTDC Pedro A. de Vera Dagupan City (75) 523-5412 BFAR-NIFTDC Romeo R. Visperas BFAR-NIFTDC (75) 523-5412
Draft Final Report – Dagupan Environmental Monitoring and modelling of aquaculture in risk areas of the Philippines (EMMA)
44
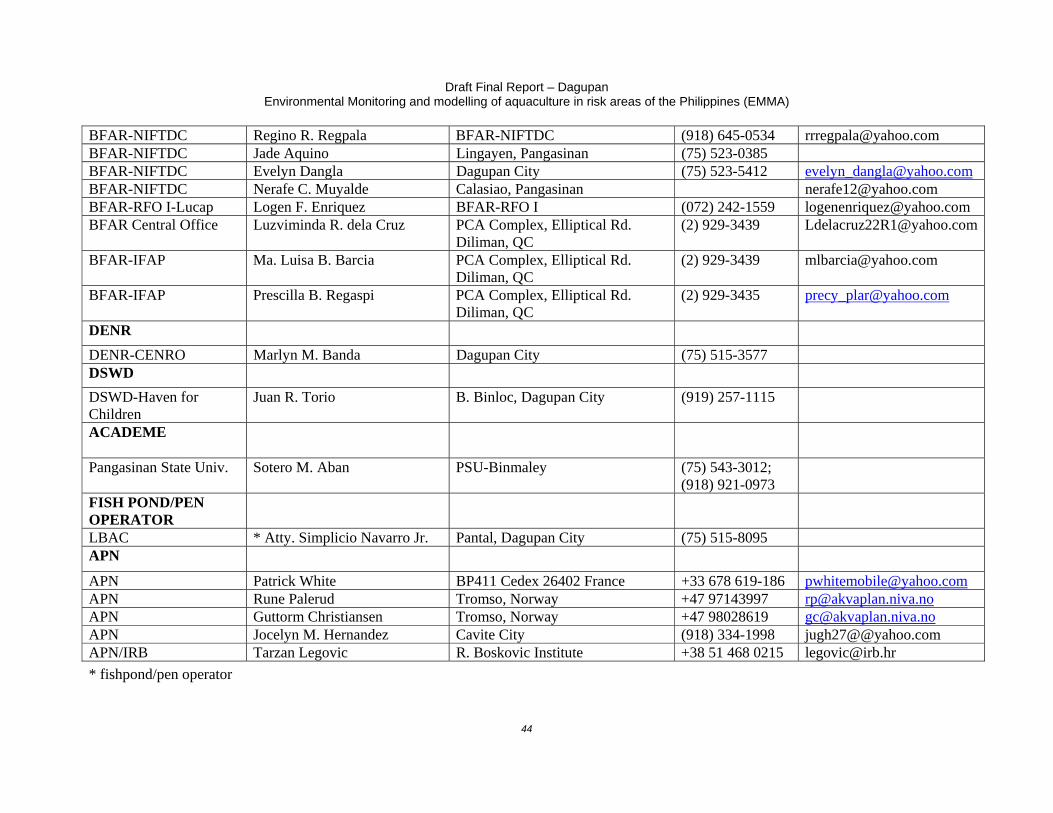
BFAR-NIFTDC Regino R. Regpala BFAR-NIFTDC (918) 645-0534 [email protected] BFAR-NIFTDC Jade Aquino Lingayen, Pangasinan (75) 523-0385 BFAR-NIFTDC Evelyn Dangla Dagupan City (75) 523-5412 [email protected] BFAR-NIFTDC Nerafe C. Muyalde Calasiao, Pangasinan [email protected] BFAR-RFO I-Lucap Logen F. Enriquez BFAR-RFO I (072) 242-1559 [email protected] BFAR Central Office Luzviminda R. dela Cruz PCA Complex, Elliptical Rd.
Diliman, QC (2) 929-3439 [email protected]
BFAR-IFAP Ma. Luisa B. Barcia PCA Complex, Elliptical Rd. Diliman, QC
(2) 929-3439 [email protected]
BFAR-IFAP Prescilla B. Regaspi PCA Complex, Elliptical Rd. Diliman, QC
(2) 929-3435 [email protected]
DENR DENR-CENRO Marlyn M. Banda Dagupan City (75) 515-3577 DSWD DSWD-Haven for Children
Juan R. Torio B. Binloc, Dagupan City (919) 257-1115
ACADEME
Pangasinan State Univ. Sotero M. Aban PSU-Binmaley (75) 543-3012; (918) 921-0973
FISH POND/PEN OPERATOR
LBAC * Atty. Simplicio Navarro Jr. Pantal, Dagupan City (75) 515-8095 APN
APN Patrick White BP411 Cedex 26402 France +33 678 619-186 [email protected] APN Rune Palerud Tromso, Norway +47 97143997 [email protected] APN Guttorm Christiansen Tromso, Norway +47 98028619 [email protected] APN Jocelyn M. Hernandez Cavite City (918) 334-1998 jugh27@@yahoo.com APN/IRB Tarzan Legovic R. Boskovic Institute +38 51 468 0215 [email protected] * fishpond/pen operator
Draft Final Report – Dagupan Environmental Monitoring and modelling of aquaculture in risk areas of the Philippines (EMMA)
45
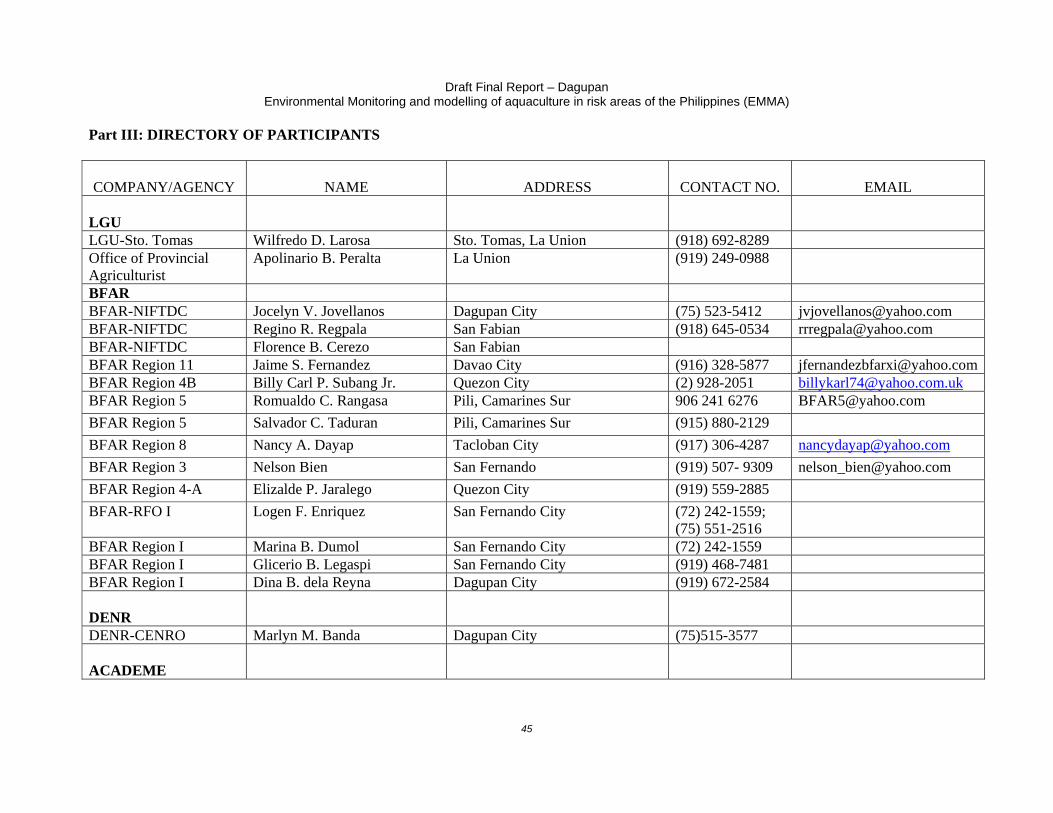
Part III: DIRECTORY OF PARTICIPANTS
COMPANY/AGENCY
NAME
ADDRESS
CONTACT NO.
LGU
LGU-Sto. Tomas Wilfredo D. Larosa Sto. Tomas, La Union (918) 692-8289 Office of Provincial Agriculturist
Apolinario B. Peralta La Union (919) 249-0988
BFAR BFAR-NIFTDC Jocelyn V. Jovellanos Dagupan City (75) 523-5412 [email protected] BFAR-NIFTDC Regino R. Regpala San Fabian (918) 645-0534 [email protected] BFAR-NIFTDC Florence B. Cerezo San Fabian BFAR Region 11 Jaime S. Fernandez Davao City (916) 328-5877 [email protected] Region 4B Billy Carl P. Subang Jr. Quezon City (2) 928-2051 [email protected] BFAR Region 5 Romualdo C. Rangasa Pili, Camarines Sur 906 241 6276 [email protected] BFAR Region 5 Salvador C. Taduran Pili, Camarines Sur (915) 880-2129 BFAR Region 8 Nancy A. Dayap Tacloban City (917) 306-4287 [email protected] BFAR Region 3 Nelson Bien San Fernando (919) 507- 9309 [email protected] BFAR Region 4-A Elizalde P. Jaralego Quezon City (919) 559-2885 BFAR-RFO I Logen F. Enriquez San Fernando City (72) 242-1559;
(75) 551-2516
BFAR Region I Marina B. Dumol San Fernando City (72) 242-1559 BFAR Region I Glicerio B. Legaspi San Fernando City (919) 468-7481 BFAR Region I Dina B. dela Reyna Dagupan City (919) 672-2584 DENR
DENR-CENRO Marlyn M. Banda Dagupan City (75)515-3577 ACADEME
Draft Final Report – Dagupan Environmental Monitoring and modelling of aquaculture in risk areas of the Philippines (EMMA)
46
DMMMSU-Institute of Fisheries, Sto. Tomas
Juanito B. Rualo DMMMSU Compound, Sto. Tomas
(918) 228-9584
APN
APN Patrick White BP411 Cedex 26402 France +33 678 619-186 [email protected] APN Rune Palerud Tromso, Norway +47 97143997 [email protected] APN Guttorm Christiansen Tromso, Norway +47 98028619 [email protected] APN Jocelyn M. Hernandez Cavite City (918) 334-1998 jugh27@@yahoo.com APN/IRB Tarzan Legovic R. Boskovic Institute +38 51 468 0215 [email protected]
Top Related