

![O2 Czech Republic · O2 Czech Republic Group structure 4 Slovakia TV Family Other [1] [1] O2 CR branch in Slovakia,Tesco Mobile CR, Internethome, O2 IT Services, ICA Group ... “Breaking](https://static.fdocuments.net/doc/165x107/5f4e4a1ecad616584844602e/o2-czech-republic-o2-czech-republic-group-structure-4-slovakia-tv-family-other-1.jpg)


Languages
Pages
Legal

2

1

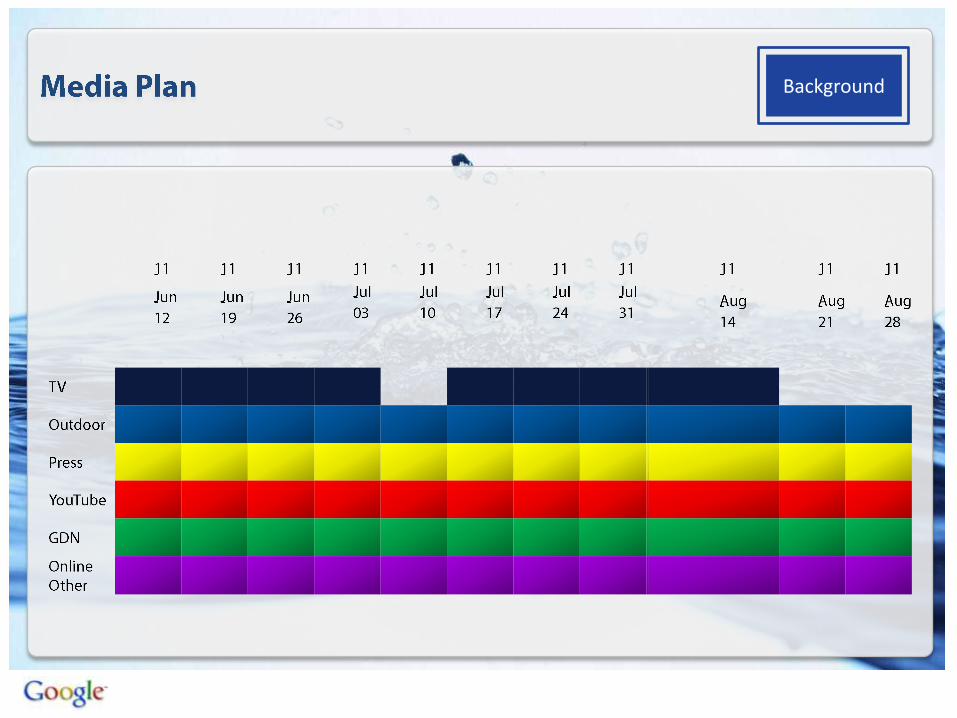
OutdoorPrint
YouTube/TV
Outdoor
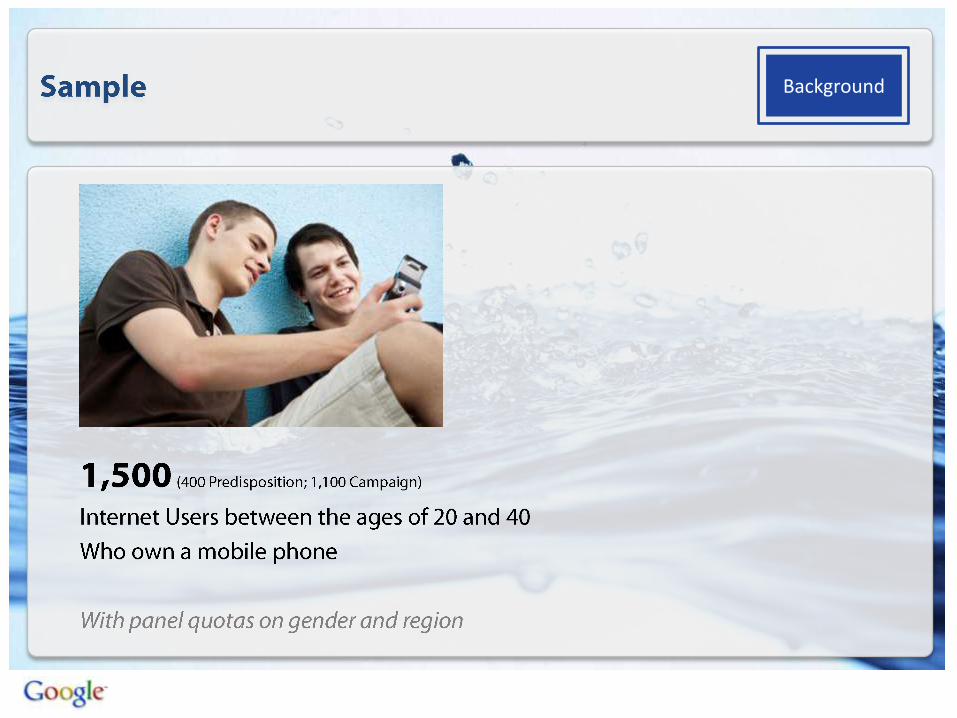
Background

51%
12%
4%
3%
12%
Background

Background
•
•
•

2
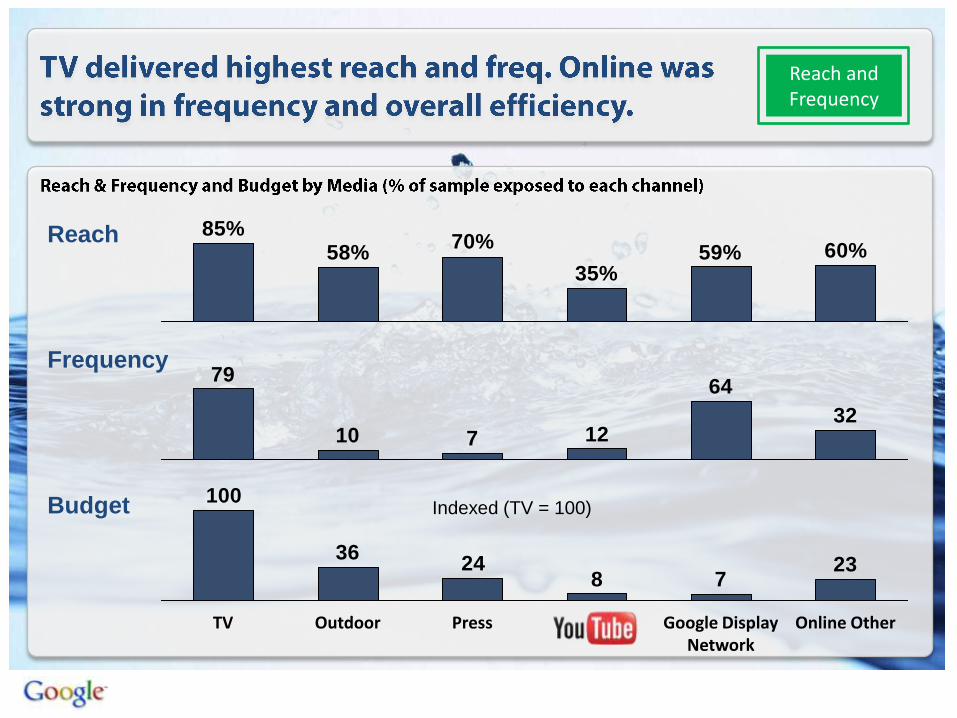
Reach and Frequency
60%59%35%
70%58%
85%
2378
2436
100
TV Online OtherGoogle Display Network
PressOutdoor
64
12710
79
32
Reach
Frequency
Budget Indexed (TV = 100)

0%
10%
20%
30%
40%
50%
60%
70%
80%
90%
100%
TV Display Network YouTube Online Other
Reach and Frequency

TV YouTube
Reach and Frequency
8
100
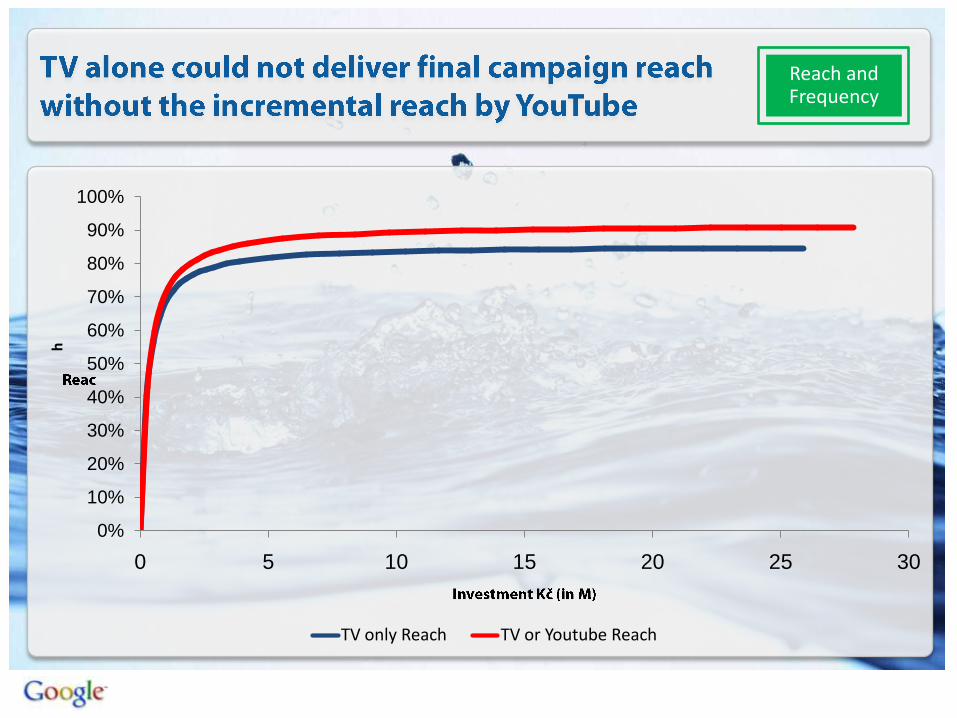
0%
10%
20%
30%
40%
50%
60%
70%
80%
90%
100%
0 5 10 15 20 25 30
h
TV only Reach TV or Youtube Reach
Reach and Frequency
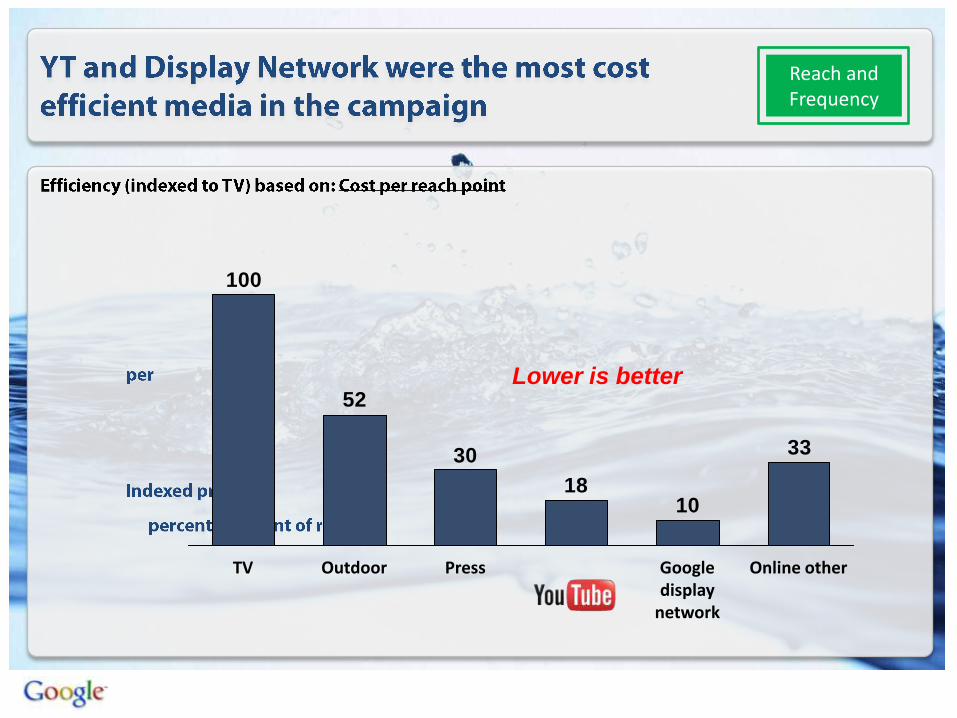
Lower is better
33
1018
30
52
100
Outdoor Press Online otherGoogle display
network
TV
Reach and Frequency

3

Base Campaign Contribution
*’Google Product’ Includes : Google Maps, Navigation, Search, Voice
Search, Gmail, YouTube and Translate
Impact
Prompted awareness
Comms Awareness
95,00%
1,60%
85,00%
KPI Average
5,80%
30,00%
0,80%
Google Product
Awareness
Conside-ration
Recomm-endation
Image Average
6,50%
66,00%4,00%
24,00%
3,60%
19,00%
4,10%
29,00%
3,75%
50,00%
Spontaneous awareness
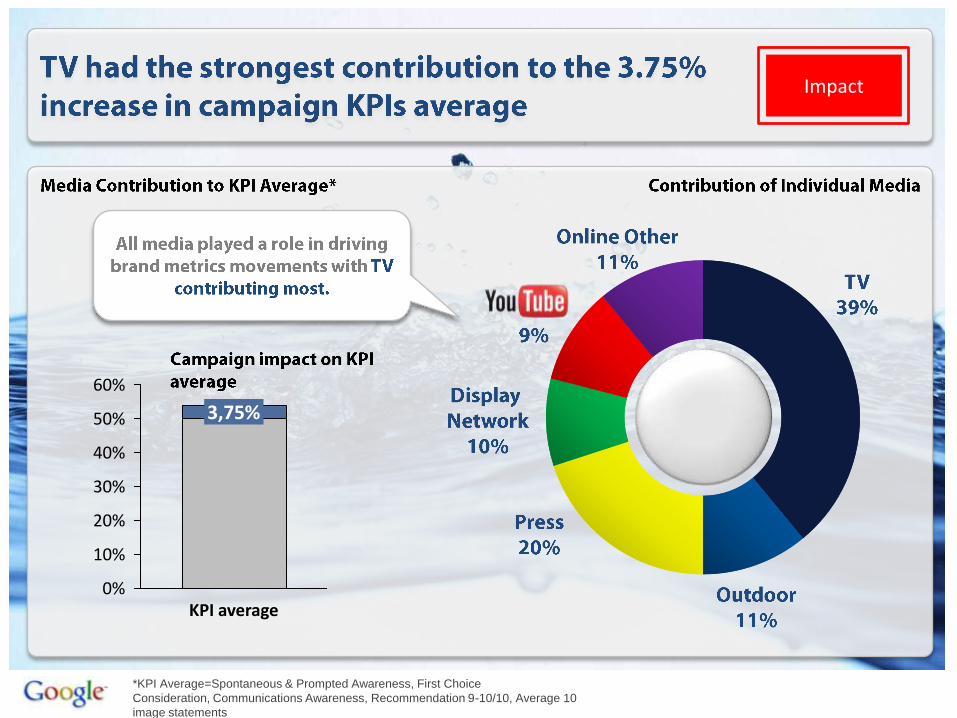
*KPI Average=Spontaneous & Prompted Awareness, First Choice
Consideration, Communications Awareness, Recommendation 9-10/10, Average 10
image statements
Impact
10%
0%
3,75%
30%
40%
50%
60%
KPI average
20%

Lower is better81
2833
47
124
100
Online otherGoogle display
network
PressOutdoorTV
Ind
ex
ed
pri
ce
pe
r %
of
imp
act
on
KP
Is
Impact

4
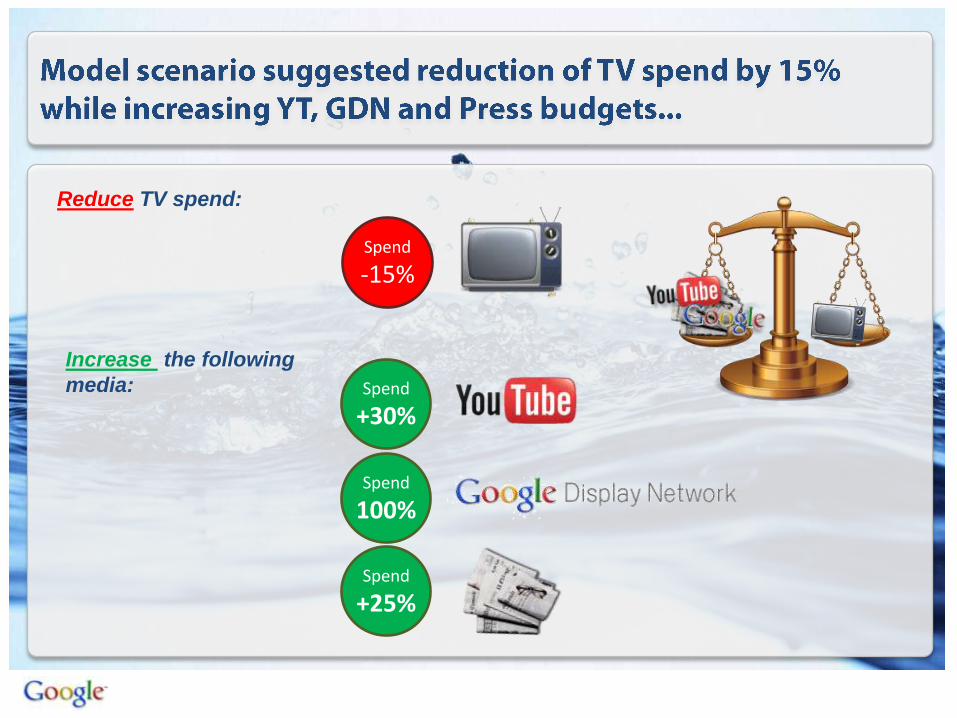
Increase the following
media: Spend
+30%
Spend
100%
Spend
+25%
Reduce TV spend:
Spend
-15%

*KPI Average=Spontaneous & Prompted Awareness, First Choice Consideration, Communications Awareness, Recommendation
9-10/10, Average 10 image statements
3.75%actual campaign
contribution to KPI
Average*
3.92%scenario campaign
contribution to KPI
Average
105%index increase

1 YT delivered 1/3 of TV reach with 1/10 of investment
& 6% of incremental reach over TV.
2 Each percentage point of KPI average increase
was by 67% cheaper on YT than on TV.
3 15% budget shift from TV to YT, GDN and Print,
would have brought 5% increase in KPI average.

Google Confidential and Proprietary
Q&A
Thank you!
21
Background
Background
Top Related