


Languages
Pages
Legal


CROP-HAIL INSURANCE RATEMAKING
Gary R. Josephson Ada Klein
Therese M. Storrl Thomns Zacharias
1.55


CROP-HAIL INSURANCE RATEMAKING
By: Gary Josephson Anita Klein Therese Stom Thomas Zacharias
ABSTRACT
Monetary loss as a result of hail damage to crops is a major hazard facing farmers in many areas of the United States. Crop-hail insurance provides a means for the farmer to protect his income from the consequences of this hazard.
The authors presume that knowledge of crop-hail ratemaking procedures is not widespread among casualty actuaries. This paper will attempt to introduce the reader to the basics of crop-hail insurance and some of the ratemaking procedures currently used in the industry. The paper begins with a brief background on the crop-hail industry, the standard crop-hail policy, claims adjustment, and data collection. The central focus of the paper is upon crop-hail pure premium estimation, the development of final rates, and an analysis of the pure premium estimation procedure.

BACKGROUND
Crop Hail Starisrical Profile
The United States crop-hail insurance industry provided over $9 billion of protection
in 1991 for a total premium of about $350 million. Insurance was written on about
200 crops with over 95 percent of the liability on five crop groups-corn and maize,
soybeans, cotton, and tobacco (in order of magnitude). Over one third of the total
coverage was on corn. The insurance in force is heavily affected by crop acreage and
commodity prices.
Hail insurance was written in 41 states in 1991 with a heavy concentration in the
Midwest. About half of the coverage was provided in five states--Illinois, Iowa,
North Dakota, Minnesota, and Nebraska. The top 17 states accounted for over 90
percent of the insurance.
Premium rates charged vary by crop, location and type of policy. For the states with
most of the liability, average rates per $100 of coverage range from $9.16 (Colorado)
to $1.05 (Illinois). Much of the liability is in states with an average rate of less than
$2.00 (Illinois, Indiana. Wisconsin, Michigan, Ohio, and Oregon).
The average policy premium was $1,056; ranging from a high of $4,503 in Arizona
to a low of $420 in Tennessee. The premium per policy in the Midwestern States
averaged about $550 for Illinois and Indiana, $850 for Iowa, $1,340 for Minnesota,
and $1,900 for North Dakota.
Narional Crop Insurance Services
For most states and crops, crop-hail rates are developed by National Crop Insurance
Services (“NCIS”). NCIS’ objectives are:
l Research
l Compilation of Statistics
l Ratemaking and Rate Filing
l Loss Adjustment Support
l Education
NCIS is the successor to two formerly separate organizations, National Crop Insurance
Association (“NCIA”), and Crop-Hail Insurance Actuarial Association (“CHIAA”).
NCIA formerly addressed the research, education and loss adjustment expense support
needs of the crop-hail insurance industry. CHIAA served as the statistical, ratemaking
and rate service organization for the industry.
NCIS develops rates (or loss costs) in 34 states. The frequency of rate filings in a
given state is generally determined by the magnitude of the crop, and by state

insurance department requirements. For large premium volume states, rates are
updated every three years. Smaller volume states receive revisions less frequently.
Crop-Hail insurance statistics are gathered from the application and, in the event of
a loss, from the proof of loss form. The information collected from these forms is
prescribed in the Statistical Plan. This plan is designed to collect enough information
to provide actuarially sound rates and to complete informative statistical reports.
Descriptions of the important data records are included as Exhibit 1. Detail premium
and loss data in this format is collected from member and subscriber companies.
Summary data is collected from Alternate Statistical Reporter (ASR) companies. All
reports and data files discussed in this paper refer to data submitted by these
companies.
Currently, about 85 percent of all U.S. crop-hail statistics are reported to NCIS in
detail or summary form.

THE CROP-HAIL POLICY
Policy Form and Coverages
Appendix A contains a sample crop-hail policy.
The basic policy form is a percentage of damage contract. An insured farmer will
purchase insurance for a stated amount per acre. The amount will reflect both the
expected yield of the crop as well as the anticipated price at harvest. For example, if
Expected crop yield = 100 bushels / acre
Expected price = $2.50 per bushel
the anticipated value of the crop is $250 per acre.
Under the standard policy form, indemnification for hail damage to crops will be
based on the estimated percentage reduction in yield potential as a result of the
damage. For example, if the adjuster determines that yield is reduced by 25%, the
indemnification will be 25% of the amount insured. In the example above, if the full
value of the crop ($250) is insured, the indemnification will be $62.50 per acre.
The policy is a coinsurance contract. If the farmer chooses to insure for less than the
full value of the crop, the indemnification is reduced proportionately. In the above

example, if the crop is insured for $125 per acre, a 25% yield reduction would result
in indemnification of $31.25 per acre, or half of the estimated loss.
Other policy forms exist. Exhibit 2 identifies several of the most common, and shows
how they apply.
Claim Adjustment
Because of the diversity of agriculture in the United States, crop-hail claims
adjustment is a fairly involved process. Monetary losses sustained from hail damage
are a function of several variables: the type of crop; the stage of crop growth; and
hail intensity, both size and force of the hail. Wind damage accompanied with a
hailstorm will also be an important factor.
Three principal categories of plant damage are analyzed in the claims adjustment
process. These are: (I) reduction in stand or total destruction of the crop; (2)
mutilation which impairs plant function; and (3) direct damage to the fruit or product
of the crop.
The task of the crop-hail claims adjuster is to sufficiently sample the acreage insured
to determine the overall damage to the crop. In order to establish the extent of
damage to plants, the adjuster utilizes charts that translate the indicated damage to the
loss in yield. All field sampling involves one or more of the above-mentioned
162

categories, depending upon the stage of growth at the time of the storm. For most
full season crops the adjustment is a prediction of future yield, in terms of percent of
yield had there been no damage. For some crop areas the time of the hail season
(majority of damaging storms) coincides with the maturity stage of growth ( the single
most vulnerable stage of growth).
An example of the Loss Instructions for corn is provided in Appendix B.
RATEMAKING METHODOLOGY
General Infomarion
Crop-hail rates are derived using a pure premium approach. Pure premiums are
called loss costs, and are calculated as the ratio of losses to exposure (insured values).
Loss costs are typically expressed per $100 of exposure.
NCIS develops rates (or loss costs, in states which do not allow development of full
rates) for each crop that has at least 25% of the statewide total liability. For most
states, this results in two or sometimes three “base” crops.
Exhibit 3 is a summary of the crops for which separate analyses are performed in each
of NCIS’ 34 states.

Basic Rating Unit
The crop hail rating process is faced with a dilemma. Two fundamental concepts
come into conflict in determining the appropriate rating base. On the one hand,
because of meteorological influences on the hail hazard, which can vary significantly
within relatively small areas, small rating areas are necessary.
On the other hand, because of the infrequency of hail losses in any specific location,
larger volumes of data are needed to produce meaningful conclusions from the
statistical data.
NCIS has addressed this dilemma by using the township as the basic rating unit in
most states. This size unit is small enough (6 miles x 6 miles) that the rate can reflect
unique meteorological influences.
The requirement for larger volumes of data is met by:
- Utilizing crop hail loss costs from 1948, and
- Incorporating broader geographic areas in the determination of the township
rate. (This will be discussed in greater detail in the discussion of
credibility.)

Data Conversion
As discussed above, crop hail insurance can be written on a number of policy forms.
In order to increase the volume of the data used in deriving the rates, losses sustained
under policy forms other than the base policy form are converted to the base policy
form.
Exhibit 4 illustrates the derivation of the policy form conversion factor. Losses
incurred under the basic form (Column 3) are recalculated to reflect the losses which
would have been incurred under the alternative policy form (Column 4). The ratio
of these two values is used to determine the conversion factor.
As Exhibit 4 illustrates, the ratio varies with the underlying rate. Presumably, this
is a reflection of the fact that the low rate areas experience less severity of hail losses.
Consequently the impact of a deductible in the low rate areas is greater than in the
higher rated, higher severity areas.
Because of this relationship, a least squares line is fit to the actual ratios, producing
the “Trend” values in Column 6.
Converted losses are then calculated as:
Losses under alternative wlicv form Policy Form Conversion Factor

In addition to conversion of losses to allow experience from different policy forms to
be included in the rate analysis, data from crops other than the base crop are also
included. Crops with similar susceptibility to hail, and consequently similar loss
costs, are grouped together. In most instances, data for similar crops are combined
without adjustment. For a few crops, data is converted to the level of the base crop.
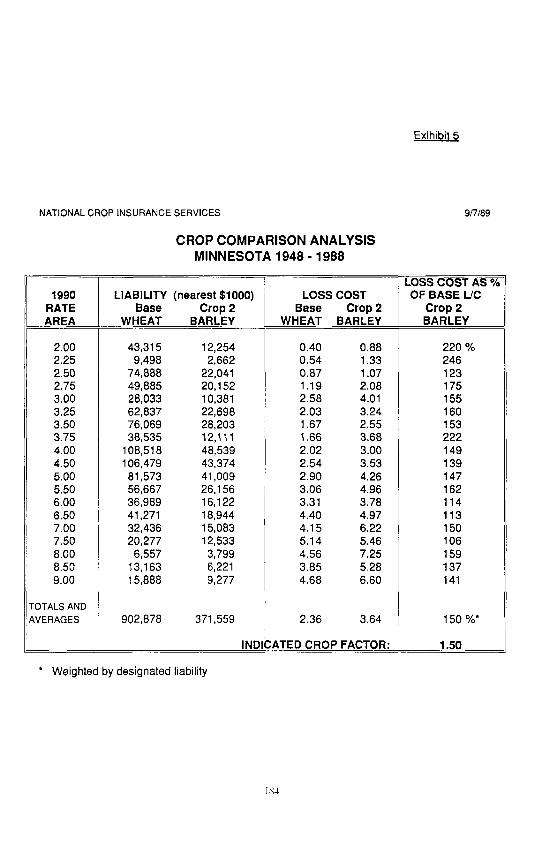
Exhibit 5 shows the calculation of a crop conversion factor. In this illustration, wheat
is the base crop, and barley is the converted crop. From the data on Exhibit 5, barley
losses would be divided by 1.50 to convert to the loss cost level of the base crop
(wheat). Unlike the policy form conversions there is no need to vary the factor by
rate.
Catastrophe Adjustment
Despite the lengthy experience period underlying the derivation of the township loss
costs (over forty years), the impact of one severe loss year can have a marked impact
on a township’s historical loss cost. Exhibit 6 illustrates this. The exhibit displays
the loss cost history for a large township. The exhibit shows that, even after twenty
years of accumulated history, changes of more than 10% in the cumulative loss cost
ratio from one year to the next are not uncommon. (This is an atypical township in
that losses have occurred in the majority of years. For many townships, the majority
of years have no losses. For a typical township the impact of a single year on the
accumulated loss costs would be more pronounced.)

In order to add stability to the township loss costs, NCIS employs a capping
procedure, which is called a catastrophe adjustment. In the procedure, losses in
excess of a specified catastrophe threshold are removed from the township history,
and built back over a broader base. (The build back will be discussed in a later
section).
The catastrophe threshold is a multiple of each township’s median non-zero loss cost.
The multiple which is used for a particular crop and state is determined from the
ratio:
Townshiu Variance Eliminated bv caooing Township Losses Eliminated by capping
(Township variance refers to the variance of annual loss costs within a township. This
is averaged over all townships, before and after capping, to derive the numerator of
the ratio. As noted above, the losses in excess of the threshold are removed from the
township Ioss cost and built back over a broader base.)
The value (multiple of the median) which produces the greatest value of this ratio
(which is called the test statistic), is used as the catastrophe threshold. In essence, the
maximum test statistic reflects the most efficient threshold, that is, the greatest
variance reduction per dollar of loss eliminated. In the event that the test statistic is
167

not maximized at levels of loss reduction greater than I %, the multiple which
produces a 1% reduction in losses is used as the default threshold.
The calculation of the test-statistic is shown on Exhibit 7. Exhibit 7a illustrates the
calculation for the township data which was presented on Exhibit 6. This is for
illustration only. The catastrophe procedure does not require calculation of the test
statistic for individual townships.
Exhibit 7b shows the values of the test statistic as calculated on a statewide basis. The
test statistic is greatest, in this instance, at a catastrophe threshold of 18.1 times the
median (non-zero) loss cost. Each township’s losses are thus capped at this level,
with losses in excess of this threshold spread back using the distribution procedure
discussed in a later section.
Credibility
Studies performed by CHIAA and NCIS have suggested that an individual township’s
data has little credibility. Roth’s paper (see bibliography) provided the remarkable
statistic that, for the largest townships in Kansas, approximately 1250 years of data
would be required to achieve 95% confidence that a township’s historical loss cost
was within $0.50 of the true mean.
Nevertheless, as discussed earlier, meteorological differences can affect the hail
hazard over relatively small areas. Consequently, NCIS has adopted a “surrounding
township” approach for determining the township loss cost. Each township is

aggregated with the adjacent eight townships (defined as nine-township), as well as
the “next adjacent” sixteen townships (defined as twenty-five township). This can be
visualized as follows:
25T 25T 25T 25T 25T
25T 9T 9T 9T 25T
NCIS has examined formulae in which credibility varies with the total exposure
(insured crop values) underlying each geographic entity’s loss cost. The results did
not produce any clear relationships between exposure and credibility. This can be
explained, in part, by the fact that exposure is defined as insured crop value which is
the product of the following components:
Acres insured
Yield per acre
Price per unit of production
Percentage of yield insured
The effect of the latter three components may have masked any true relationship
between exposure and credibility.

As a result, credibility is generally assigned on the basis of geographic size. For most
townships, “Final Average Loss Cost (TALC)” is derived as a weighted average of:
Township limited loss cost (10% weight);
Surrounding nine-township limited loss cost (15% weight);
Surrounding hventy-five township limited loss cost (75% weight).
Exceptions apply if the total exposure for any of the three geographical units falls
below specified thresholds.
Exhibit 8 shows the calculation of the FALC for a number of townships.
As a final note, rates are made by township primarily in the larger volume states. In
lower volume states, rates are made by county, Crop Reporting District (“CRD”) or
State. In the county states, the FALC is 100% of the county loss cost if the exposure
(cumulative liability) is $1,250,00 or greater. For low liability counties, the CRD
loss cost is used. For CRD and state rates, 100% weight is given to the geographical
exposure unit.
Catastrophe Redistribution
In a previous section, we described the process used to identify catastrophe losses,
which are removed from the township loss cost prior to calculation of the FALC. The
catastrophe redistribution is a two level process.
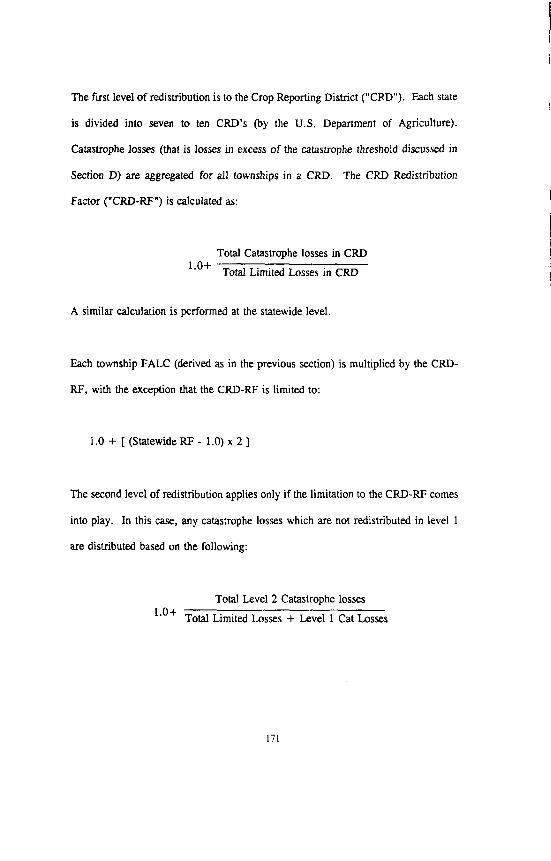
The fust level of redistribution is to the Crop Reporting District (“CRD”). Each state
is divided into seven to ten CRD’s (by the U.S. Department of Agriculture).
Catastrophe losses (that is losses in excess of the catastrophe threshold discussed in
Section D) are aggregated for all townships in a CRD. The CRD Redistribution
Factor (“CRD-RF”) is calculated as:
Total Catastrophe losses in CRD 1.0+ Total Limited Losses in CRD
A similar calculation is performed at the statewide level.
Each township FALC (derived as in the previous section) is multiplied by the CRD-
RF, with the exception that the CRD-RF is limited to:
1 .O + [ (Statewide RF - 1 .O) x 2 ]
The second level of redistribution applies only if the limitation to the CRD-RF comes
into play. In this case, any catastrophe losses which are not redistributed in level 1
are distributed based on the following:
1.0+ Total Level 2 Catastrophe losses
Total Limited Losses + Level 1 Cat Losses
171

This redistribution is illustrated on Exhibit 9. In this example, the statewide level 1
redistribution factor is 1.0986. Thus, each Crop Reporting District’s level 1
redistribution factor is limited to 1.197 (1+2x(.0986)). As the exhibit illustrates, the
level I factor for CRD 80 exceeds 1.197, and therefore this limitation applies. Level
2 losses reflect CRD 80 catastrophe losses which exceed the limit. The level 2 losses
(1,746,671) represent 1.4% of the sum of the limited losses and level 1 catastrophe
losses (%125,127,861). Thus, the level 2 redistribution factor is 1.014.
Each township’s FALC is then multiplied by:
Level I Factor x 1.014
Erpense Load
For those states for which NCIS publishes rates, the next step is the conversion of loss
costs to rates. This is accomplished by dividing the catastrophe adjusted FALC by
an Anticipated Loss Ratio (ALR).
The ALR varies by state, including provisions for loss adjustment, general,
commissions and profit. ALR’s ranging from 60% to 65% are common to most NCIS
states.
172

The ALR further varies with the magnitude of the rate, with higher rated townships
requiring a lower expense ratio than lower rated townships. Exhibit IO is an example
of a schedule of ALR’s by rate class.
Limitcuions on Rate Changes
Once the r;ltes (or loss costs) have been calculated, the final step is to limit the
amount of the change from present rates. In general, three constraints are imposed
on the final rate:
- Rate cannot increase or decrease by more than a fixed dollar amount;
- Rate cannot increase or decrease by more than a specified percentage;
- Rate cannot exceed a specified maximum for the state, or be less than a
specified minimum.
The specific values of these constraints may vary by state and crop.
Test for BL4S in FALC
Several of the major elements of the ratemaking formula were newly implemented in
1990. In order to determine whether the changes may have introduced biases in the
determination of the FALC, NCIS performed tests of the resulting loss costs, both
17.3

before and after the catastrophe redistribution. A description, of the tests is presented
in Appendix C, along with a summary of the results.
CONCLUSION
The process which has been described above has been generalized in a number of
UCaS. Some of the more common variations have been described. Other less
common departures from the standard approach exist for specific crops or unique
situations.
Like other Property-Casualty coverages, the crop-hail ratemaking methodology has
evolved over time. The methodology is monitored by NCIS, and by the crop-hail
industry through company participation in National and Local Committees and
industry groups.
174

BIBLIOGRAPHY
Brown, Philip S., “Crop-Hail Insurance”, Society of Chartered Property and Casualty Underwriters (1967 publication)
Roth, Richard J., “The Rating of Crop-Hail Insurance”, Proceedings of the Casualty Actuarial Society, Volume XLVII (1960), pages 108-146.
National Crop Insurance Services, “Crop-Hail Insurance Statistics and Rating Methods”, 1989 Edition.
175

Exhibit 1 Page 11
Data Elements
A list of detail data elements collected by NCIS follows. It includes all fields currently collected, and some fields which were used in the past, but are no longer obtained. See Exhibits 1 and 2 for computer record descriptions.
Acres: Acres of crop grown and insured for a loss record.
Amount of Loss: Total dollar loss for this crop.
Card: Card number. ‘1’ used for premium record. ‘2’ or ‘4’ used to indicate loss record. A ‘2’ loss record is used for percentage losses (loss is indicated as a percent of total) and a ‘4’ is used for tonnage losses (loss is indicated in number of tons lost).
Cause of Loss: A code (peril code) used to indicate the cause of loss. The most common codes follow. These are not all peril codes, and the codes can vary by state for the lesser used peril codes.
1 - Hail 6 - Transit 7 - Fire 8 - Windshatter without hail
NCIS CPU: Year, month and day this record was received by NCIS. No statistical value.
Company: A numeric code assigned to a company per year. Will always be unique for any year/company. Usually will be unique across companies.
County: Numeric county cde.
Crop: Numeric crop code. For example,
I - Wheat 2 - Barley 3 - Rye 4 - Oats 5 - Flax 6 - Corn
For a complete list of crop codes, write NCIS.
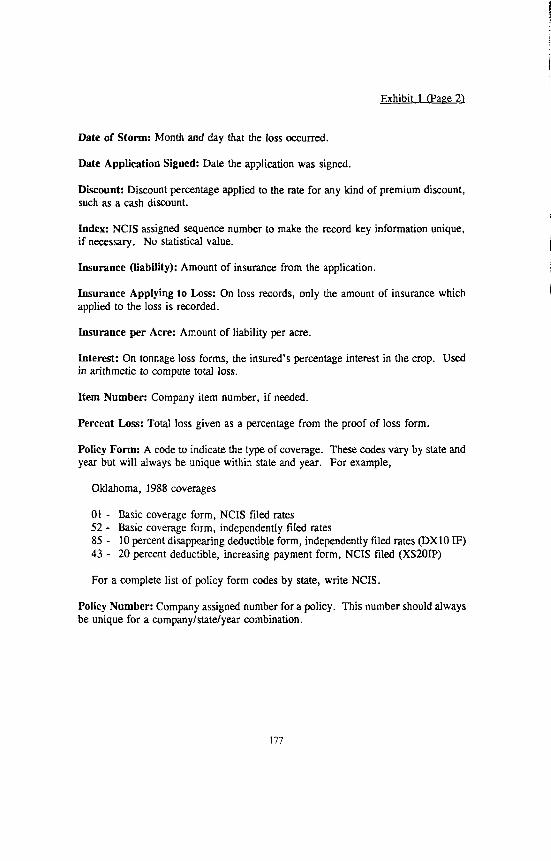
Exhibit 1 lPaae 2)
Date of Storm: Month and day that the loss occurred.
Date Application Signed: Date the application was signed,
Discount: Discount percentage applied to the rate for any kind of premium discount, such as a cash discount.
Index: NCIS assigned sequence number to make the record key information unique, if necessary. No statistical value.
Insurance (liability): Amount of insurance from the application.
Insurance Applying to Loss: On loss records, only the amount of insurance which applied to the loss is recorded.
Iusurance per Acre: Amount of liability per acre.
Interest: On tonnage loss forms, the insured’s percentage interest in the crop. Used in arithmetic to compute total loss.
Item Number: Company item number, if needed.
Percent Loss: Total loss given as a percentage from the proof of loss form.
Policy Form: A code to indicate the type of coverage. These codes vary by state and year but will always be unique within state and year. For example,
Oklahoma, 1988 coverages
01 - Basic coverage form, NCIS tiled rates 52 - Basic coverage form, independently tiled rates 85 - 10 percent disappearing deductible form, independently filed rates @Xl0 IF) 43 - 20 percent deductible, increasing payment form, NCIS tiled (XSZOIP)
For a complete list of policy form codes by state, write NCIS.
Policy Number: Company assigned number for a policy. This number should always be unique for a company/state/year combination.
177

Exhibit 1 (Pace 3)
Premium Discount: Code used to indicate percentage discount when computing premium. For example,
O- No discount
Gross premium reported (premium dollars do not reflect the discount)
5- 4% discount 6- 20% discount 7- 25% discount
Net premium repoti
I- 4% discount D - 20% discount C - 25% discount
Premium: Premium dollars from the application.
Price per Ton: Used on tonnage loss records to compute total loss.
Range: Numeric code for the range portion of the location of the crop being covered by this policy.
Rate: Percentage rate used to compute premium, obtained from the application.
Social Security Number: Insured’s social security number.
State: Two character state code. For example,
01 - Alabama 02 - Arizona
Status: System status when record received. No statistical value.
Township: township code of the location of the crop being covered.
Type: Indicates type of record received. Same usage as CARD.
17x

2 Exhibit
CROP-HAIL INSURANCE
ILLUSTRATION OF ALTERNATIVE POLICY FORMS
Define: R = Yield Reduction (percent) P = Amount payable
XSlO - EXCESS OVER 10% LOSS
P = (R - 10%)
DXlO -- 10% DISAPPEARING DEDUCTIBLE
R < 10% P = 0% 10% < R < 50% P = 1.25 X (R - 10%)
R >50% P=R
XSlOlP -- EXCESS OVER 10% LOSS - INCREASING PAYMENT
R C 10% 10% < R < 70%
R >70%
P = 0% P = (R - 10%) P = (R - 10%) + (R - 70%) P <I= 100%
(in this form, when yield reduction exceeds 70%. an additional 1% is paid for each percent of yield reduction in excess of 70%)
DXSS - EXCESS OVER 5% DISAPPEARlNG AT 25%
R <5% P = 0% 10% < R < 25% P = (R - 5%) x 1.25
R >25% P=R

Exhibit 3 lPaee 1)
State
Alabama
Arizona
Arkansas
Colorado
Florida
Georgia
Idaho
Illinois
Indiana
Iowa
Kansas
Kentucky
Louisiana
Seoaratelv Rated Croos
Cotton
Cotton
Cotton wheat Soybeans Rice
wheat Corn Potatoes
Tobacco
Tobacco Cotton
wheat Barley Potatoes Peas Tree Fruit
Corn Soybeans
Tobacco Corn Soybeans
Corn Soybeans
wheat Corn
Tobacco
Cotton
IS0

Exhibit 3 Page 21
State
Michigan
Minnesota
Mississippi
Missouri
Montana
Nebraska
New Mexico
North Carolina
North Dakota
Ohio
Oklahoma
Oregon
South Carolina
Seoaratelv Rated Croos
Com,Wbeat Tree Fruit
Com,Wheat Soybeans
Cotton
Cotton wheat Soybeans Corn Tobacco
wheat Barley
Com,Wheat
Cotton wheat
Tobacco Cotton Tree Fruit
wheat
Com,Wheat Soybeans Tobacco
Tobacco cotton Tree Fruit

State South Dakota
Tennessee
Texas
Utah
Virginia
Washington
Wisconsin
Wyoming
Exhibit 3 (Pace 31
Seuaratelv Rated Crops Corn wheat
Burley Tobacco Dark Tobacco
Cotton w-heat Mai2.e
wheat
Tobacco
wheat Tree Fruit
Corn Potatoes Tobacco
wheat
182

NATIONAL CROP INSURANCE SERVICES
Exhibit 4
1 l/7/91
(1) 1991 Rate Area
6.00 6.50 7.00 7.50 8.00 8.50 9.00 9.50
10.00 10.50 11.00 11.50 12.00 12.50 13.00 13.50 14.00 14.50 15.00 15.50 16.00 17.00 18.00 19.00
STATE
POLICY FORM COMPARISON ANALYSIS MINNESOTA SOY BEANS 1957-l 990
3ase form: BASIC Analyzed form: XSlOIP (2) (3) (4) (3 (6)
Llablllty* Actual Losses Computed Losses Policy Form Factor: [nearest $lOOOl (nearest $1000) (nearest $1000) Actual Trend
5,404 1,145 727 0.63 0.58 1,920 405 253 0.62 0.59 6,982 1,530 985 0.64 0.59 5,365 812 428 0.53 0.60
10,755 2,031 1,218 0.60 0.60 6,756 1,240 727 0.59 0.61
30,558 5,436 3,143 0.58 0.62 5,120 1,002 611 0.61 0.62
17,972 3,720 2,384 0.64 0.63 7,828 1,758 1,146 0.65 0.63
28,615 6,168 3,939 0.64 0.64 14,530 2,884 1,701 0.59 0.64 21,919 4,959 3,220 0.65 0.65 23,708 5,170 3,297 0.64 0.66 46,325 11,527 7,841 0.68 0.66 31,155 7,444 4,912 0.66 0.67 36,065 8,285 5,454 0.66 0.67 26,197 6,208 4,183 0.67 0.68 42,731 10,827 7,449 0.69 0.68 24,797 6,695 4,729 0.71 0.69 47,698 12,383 8,595 0.69 0.7c 40,135 10,632 7,445 0.70 0.71 23,177 7,401 5,662 0.76 0.72 27,733 8,052 5,875 0.73 0.73
533,444 127,713 85,922 0.67
l Liability with loss
183
NATIONAL CROP INSURANCE SERVICES 9/7/89
Exihibit 3
1990 RATE AREA
2.00 2.25 2.50 2.75 3.00 3.25 3.50 3.75 4.00 4.50 5.00 5.50 6.00 6.50 7.00 7.50 8.00 8.50 9.00
‘OTALS AND iVERAGES
--
CROP COMPARISON ANALYSIS MINNESOTA 1948 - 1988
LIABILITY (nearest $1000) Base Crop 2
WHEAT BARLEY __--
43,315 12,254 9,498 2,662
74,888 22,041 49,885 20,152 28,033 10,381 62,837 22,698 76,069 28,203 38,535 12,111
108,518 48,539 106,479 43,374
81,573 41,009 56,667 26,156 36,989 16,122 41,271 18,944 32,436 15,083 20,277 12,533
6,557 3,799 13,163 6,221 15,888 9,277
902,878 371,559 2.36 3.64 150 %'
LOSS COST Base Crop 2
WHEAT BARLEY
T LOSS COST AS % OF BASE UC
Crop 2 BARLEY
0.40 0.88 220% 0.54 1.33 246 0.87 1.07 123 1.19 2.08 175 2.58 4.01 155 2.03 3.24 160 1.67 2.55 153 1.66 3.68 222 2.02 3.00 149 2.54 3.53 139 2.90 4.26 147 3.06 4.96 162 3.31 3.78 114 4.40 4.97 113 4.15 6.22 150 5.14 5.46 106 4.56 7.25 159 3.85 5.28 137 4.68 6.60 141
ATED CROP FACTOR: ____~ 1.50 i
l Weighted by designated liability
IS-l

Exhibit 6
HISTORICAL TOWNSHIP LOSS COSTS 102N 28W. FARIBAULT COUNTY, MINNESOTA
Liability Loss cost Percent11 Year (000) - Year Cumulative
48 11 5.99 5.99 CharMe/
49 10 3.14 -91% 50 14 1.88 -67% 51 21 8.23 4.26 56% /I 52 20 7.40 5.09 16% 53 33 3.55 -43%
54 42 2.56 -39% 55 30 11.77 4.09 37% 56 14 7.42 4.33 6% II 57 55 18.18 7.37 41% 58 105 22.82 11.94 38% 59 74 0.08 9.90 60 72 0.14 8.49 61 49 18.48 9.38 62 56 1.43 8.65 63 73 25.99 10.51 64 133 0.15 8.82 65 122 2.46 7.99 66 156 0.06 6.85
-19% -10% -17%
67 186 35.82 11.07 38% 68 224 0.70 9.52 -16% 69 273 0.79 8.18 -16% 70 196 0.77 7.44 -10% 71 231 8.07 7.51 1% 72 370 73 456 74 497 75 456 76 645 77 787 78 1338 79 345 80 574 81 1041
62.74
0.98
3.38 0.19
41.31 4.59
19.41 21.82
15.46 51% 13.13 -18% 11.42 10.11
9.17 7.86
14.49 14.01 14.42 15.30
1026 1.61 13.86 -10% 873 46.22 16.52 16%

YEAR 49 50
E 73 75 66
2 64 77 90 68 70 69 74 62 84 82
ii: 87 76
MEDIAN ii 48 52 56 71 51 89 55 85 57 61 80 81 58 63 67 78 83 72
LIABILITY w)
10 I4 33 42
456 456 156
74 72
133 787 167 224 196 273 497
56 1132 1026
122 164 170 645 345 558
II 20 14
231 21
121 30
335 55 49
574 1041
105 73
186 1338
873 370
Variance of non-zero loss costs 213.45 86.86 147.55 166.82
Limited Losses 1,868,357 1,334,169 1,695,240 1,828,989
Variance Reduction 0.593 0.309 0.125 Loss Reduction 0.286 0.093 0.021 Test Statistic 2.074 3.332 5.920
LOST COST
0.06 0.08 0.14 0.15 0.19 0.35 0.70 0.77 0.79 0.98 1.43 1.44 I.61 2.46 3.31 3.34 3.38 4.59 5.21 5.99 7.40 7.42 8.07 8.23
10.81 Il.77 13.41 18.18 18.48 19.41 21.82 22.82 25.99 35.82 41.31 46.22 62.74
Exhibit 7A
Loss Cost Limited to 5 X Median
0.06 0.08 0.14 0.15 0.19 0.35 0.70 0.77 0.79 0.98 1.43 I.44 1.61 2.46 3.31 3.34 3.38 4.59 5.21 5.99 7.40 7.42 8.07 8.23
10.81 II.77 13.41 18.18 18.48 19.41 21.82 22.82 25.99 26.05 26.05 26.05 26.05
7.5 X Median 10 X Median
0.06 0.08 0.14 0.15 0.19 0.35 0.70 0.77 0.79 0.98 1.43 I.44 1.61 2.46 3.31 3.34 3.38 4.59 5.21 5.99 7.40 7.42 8.07 8.23
10.81 11.77 13.41 18.18 18.48 19.41 21.82 22.82 25.99 35.82 39.34 39.34 39.34
0.06 0.08 0.14 0.15 0.19 0.35 0.70 0.77 0.79 0.98 1.43 1.44 I.61 2.46 3.31 3.34 3.38 4.59 5.21 5.99 7.40 7.42 8.07 8.23
10.81 11.77 13.41 18.18 18.48 19.41 21.82 22.82 25.99 35.82 41.31 46.22 52.10

Exhibit 76
TEST STATISTICS FOR ALL MULTIPLES 1993 MINNESOTA SOYBEANS
AULTIPLE
19.3 19.2
ACTUAL NORMAL k VAR. ACTUAL NORMAL % LOSS TEST VARIANCE VARIANCE REDUCED LOSSES LOSSES REDUCED STATISTIC
211.8149 191.1365 6.7625 238,353,170 229,712,094 3.6253 2.6929 211.8149 190.8559 9.8950 236.353.170 229.601.030 3.6719 2.6946
19.1 211.6149 190.5664 10.0316 238,353,170 229&2;038 3.7218 19.0 211.8149 190.2737 10.1698 238.353.170 229,359.865 3.7731 18.9 211.8149 189.9761 10.3103 238,35X170 229,235,171 3.8254 2.6952 18.8 211.8149 189.6724 IO.4537 238,353,170 229.108,493 3.6786 2.6952 18.7 211.8149 189.3655 IO.5986 238,353,170 228,981,300 3.9319 2.6955 18.6 211.8149 169.0529 10.7462 238.353.170 228.852.542 3.9859 2.696l-l 18.5 211.8149 188.7373 IO.8951 238a53.170 22817223103 4.0407 18.4 211.8149 166.4185 11.0457 238,353.170 228.590.962 4.0957 18.3 18.2
;:. 18.1 ̂ :
18.0 17.9 17.8 17.7 17.6 17.5 17.4 17.3 17.2 17.1 17.0 16.9
211.8149 .211.8149 .2l1.w49,:
211.8149 211.8149 211.8149 211.8149 211.8149 211.8149 211.8149 211.8149 211.0149 211.0149 211.8149 211.8149
..:.: .:
188.0900 187.7765
..I8734541 187.1305 186.8047 186.4760 186.1439 185.8095 185.4755 185.1408 184.8025 184.4610 184.1146 183.7609 183.3974
11.1966 238.353.170 11.3488 11.5010 I I .6537 11.8076 11.9627 12.1195 12.2774 12.4351 12.5931 12.7528 12.9141 13.0776 13.2446 13.4162
238;353;170 :238,353,170 1.. "- 238.353.170 238;353;170 236.353.170 238,353,170 238.353,170 238.353.170 238,353,170 238.353,170 238,353,170 238,353,170 238,353,170 238.353.170
228.456.406 228,325,X57 228,191.033 228.054.764 227,915,943 227.776.199 227;636;303
22617751187
227,496,211 227.355,897
226,624,657
227,212,IOI 227,068,061 226.923044
228.469.458 4.9858
4.1513 4.2071
4.8575
4.2635 4.3207
4.9208
4.3769 4.4375 4.4962 4.5550 4.6139 4.6742 4.7346 4.7955
2.6971 2.6975
: .. 2.6976 2.6972 2.6965 2.6958 2.6955 2.6954 2.6952 2.6942 2.6935 2.6930 2.6923 2.6916 2.6909
16.8 211.8149 183.0246 13.5922 238:353;170 226~311~561 5.0520 16.7 211.8149 182.6457 13.7711 238,353.170 226.153.136 5.1185
18.6 211.8149 182.2842 13.9512 238,353,170 225.992397 5.1857 16.5 21 I .8149 181.8774 14.1338 238,353,170 225.827,806 5.2550 2.6896 16.4 211.6149 16mO 14.3224 236353.170 [email protected] 5.3265 2.8903 1 2.6689

Exhibit8
NATIONALCFIOPINSURANCESERVICES CHSlOF MINNESOTASOYBEANS
1A-E 'EAR GROUP
1993 011
1993 011
1993 011
1993 011
1993 011
I..(LOCI\TIOH 1043FARlBAULT
lOlN024W 60
60
60
60
60
60
60
60
60
60
60
60
60
60
60
60
lOlN025W
lOlN026W
lOlN027W
lOlN026W
102N024W
102N025W
102N026W
102N027W
102N026W
103N024W
103N025W
103N026W
103NO27W
103N026W
104N024W
9.563.497
16.561.342
12.986.662
9.019.172
12.740.136
9.932.217
15.067.464
14,796.310
10,561.707
13.992.899
11.63-3.624
14,200.617
15.771.457
6,240,148
9.342.276
14,202,0X1
1993 FALC ANALYSlS BASEDONPERlOD1946-1991
NORMAL NORMAL LOSS COSTS (CATASTROPI LOSSES LOC 9lwP 25TwP CTV
1,111.590 11.62 11.06 9.65 9.66 7.70 10.21 10.93
1,300.599 7.65 10.49 9.64 9.66 7.70 9.59 10.27
1,101.977 6.48 9.66 9.94 9.66 7.70 9.75 10.44
677,991 9.73 9.69 10.16 9.66 7.70 10.05 10.76
1.146.023 9.00 10.26 9.65 9.66 7.70 9.63 10.53
1,203.OlO 12.11 10.04 9.96 9.66 7.70 10.19 10.91
2,214.799 14.66 9.94 9.66 9.66 7.70 10.20 10.92
1,351.013 9.13 9.50 9.66 9.66 7.70 9.56 10.26
764,427 7.43 9.63 9.63 9.66 7.70 9.44 10.11
1.921.161 13.73 10.34 9.44 9.66 7.70 10.00 10.71
763,674 6.62 10.46 10.29 9.66 7.70 9.95 10.66
1.174.070 6.27 10.13 9.69 9.66 7.70 9.76 10.45
1.754.943 11.13 9.01 9.75 9.66 7.70 9.76 10.47
576,737 7.02 9.30 9.20 9.66 7.70 9.00 9.64
1.043.508 11.17 9.90 6.69 9.66 7.70 9.12 9.77
2.077.966 14.63 10.95 9.74 9.66 7.70 10.41 11.15
i
REMOVED)
T!y-.Yr / FALC
(WITH CATASTROPHE)

Exhibit 9
1993 MINNESOTA GRAINS
(1)
CRD
10
20
30
40 5
50
60
70
80
90
STATE 126,874,532 1!5,483,816 11,390,716 1.099 1,746,671
(2)
TOTAL LOSSES
35,201,057
435,734
0
21,035,626
13,09o,cr93
957,318
13,917,098
30.42 1,459
11,816,147
REDISTRIBUTION FACTORS
(3) (4) (5) LIMITED CATASTROPHE UNLIMITED LOSSES LOSSES FACTOR
33,488,591 1,712,466 1.051
430,702 5,032 1.012
0 0 1.000
20,196,211 839,415 1.042
12,449,736 640,357 1.051
892,114 65,204 1.073
12,944,887 972,211 1.075
23,950,154 6,471,305 1.270
11,131,421 684,726 1.062
a)Column (5) limited to a maximum of 1.197
b)Column (3) x [Column (5) - Column (6)]
(6) LEVEL 1
FACTORa)
1.051
1.012
1.000
1.042
1.051
1.073
1.075
1.197
1.061
(7) LEVEL 2 LOSSESb)
0
0
0
0
0
0
0
1,746.671
0

Exhibit 10
ANTICIPATED LOSS RATIO SCHEDULE
RATE Under $0.99 1.00 - 1.99 2.00 - 2.99 3.00 - 3.99 4.00 - 4.99 5.00 - 5.99 6.00 - 6.99 7.00 - 7.99 6.00 - 8.99 9.00 - 9.99
10.00 - 10.99 11.00 - 11.99 12.00 - 12.99 13.00 - 13.99 14.00 - 14.99 15.00 - 15.99 16.00 - 16.99 17.00 - 17.99 18.00 - 18.99 19.00 andOver
- I
-
ALR: % FALC
50 % 52 53 54 55 56 57 58 59 60 61 62 63 64 65 66 67 68 69 70
% EXPENSES AND PROFIT
50 % 40 47 46 45 44 43 42 41 40 39 38 37 36 35 34 33 32 31 30
I Yf)

Appendix A
CHIAA CROP-HAIL POLICY
The Name of Company
This poky IS signed by the President and Secretary of the companv. One of our authorized representatwes must also countersign the policy before it IS valid.
(Signature)
Secretary
(Slgnaturel
Ptesldent
I Y I

YOUR CROP-HAIL INSURANCE POLICY
Quick Reference
Your Crop-Hail policy is composed of four parts:
11 Part I -Consists of your APPLICATION OR OECLARATION PAGE for this insurance which contatns the schedule of insurance, description and location of crops insured. and binder prowsions.
2) Part II -The SPECIAL PROVISIONS aqd ENDORSEMENTS. if any. tailor the coverage to meet the needs of the crops grown within Your state and to conform to the laws and regulations of the state.
31 Part III -The following GENERAL PROVISIONS are the same for all policws written in the United States.
Agreement to Insure
Coverage ProvisIon No. 1
Insurance Period. ProvIsion No. 2
Duties After Loss. Provision No. 3
Loss Payment. Provision No. 4
Reduction of Insurance. Provision No. 5
Appraisal Provision No. 6
Liberalization Provision No. 7
Variation in Acreage in Case of Loss. Provision No. 8
Waiver or Change of Policy Provisions, Provision No. 9
Assignment of Interest, Provision No. 10
Assignment of Indemnity. Provision No. 11
Concealment or Fraud. Provision No. 12
Cancellation of Policy. Provision No. 13
Exclusions. Provision No. 14
Abandonment of Crop. Provision No. 15
Suit Against Us. Provision No. 16
Conformity to Statutes. Provision No. 17
Subrogation (Recovery of Loss From a Third Partyt. Provision No. 18
4) Part IV -EXPLANATION OF POLICY TERMS.
IMPORTANT: This Quick Reference is not pan of the Crop-Hail Policy and does not provide coverage Refer to the CropHarl Policy itself for the actual contractual provisIons.
PLEASE READ THE CROP.HAIL POLICY CAREFULLY
I ‘)_1

EXPLANATION OF POLICY TERMS
Throughour this policy “you” and “your” refer to the “named Insured” shown in the ADPllCal10n or Declarations. and “we”. “us” and “our” refer to the Company prowdmg thts msurance In addltlon. certain words and phrases are defined as follows.
1. “Insured” means you
2. “Schedule of Insurance” is the lisl of crops, locanons, and amounts of insurance for which you have made application.
3. “Harvest”: the act or process of gathering m a crop.
4. “Replant”: to reseed or transplant due to the condition of the original crop.
5. “Feasible to Replant” means that the remaining growing season 1s consldered sulflclenr for a crop to reach maturity.
6. “Insured Crop” means a crop described in the Schedule of Insurance for which a specific amount of insurance and premium charge has been indicated.
7. “CHIAA”: Crop-Hail Insurance Actuarial Association.
6. “Unit of Insurance”: Throughout this policy the acre is the unit of msurance. This means that the limit of insurance applying to loss on any acre may not exceed the limit per acre in the Schedule of Insurance.
This also means to the extent a crop is insured for less than its value you are self insured. As an example of how this works, assume a crop is worth 9 100 per acre and you insured It for only $50 per acre; assume also that there has been a yield reduction of 40% due to hall. If there 1s no Excess Over Loss or Deductible applying, the amount payable is 40% of S 50 per acre (or $20.00 per acre), whereas the actual amount of the loss is 40% of $100 (or $40.00 per acre). and you are thus self insured for rhe difference of $20.00 per acre.
9. “Crop Yield” means the production per acre that the insured crop would reasonably be expected to produce at harvest. The production per acre is usually expressed in terms of bushels, pounds, tonnage, etc.

OPTIONAL COMPANY INFORMATION

GENERAL PROVISIONS 1987.CHIAA 3
AGREEMENT TO INSURE: We will provide the insurance described in thrs polrcy in return for the Premium and compliance wrth all applicable provisions.
1. COVERAGE. b. Our Durres Are. We cover the crops specrfied at the locations described in the schedule of insurance. ( 1) Adjust all losses.
We do not cover crops that have been damaged by hail pnor to signing the application.
2. INSURANCE PERIOD.
I21 Pay the loss wrthin 30 days after we reach agree- ment with you. entry of a fmal judgment, or the frlrng of any appraisal award with us.
The insurance is in effect from the time the crop is clearly c. Adjustment Procedures. visible above the ground until the crop is harvested, except We recognize and apply the Loss Adjustment as follows: Procedures used by the Crop Insurance Industry.
a. No coverage is in effect until 12:Ol a.m. following the d. Deferred Adjustmenl. date you signed the appkcation. At trmes it may be necessary for us to defer the
adjustment of a covered loss until the actual loss can b. For some crops there is an additional waiting period if be determined. We will not pay for reduction of yield
shown in the Special Provisions or in a special crop resulting from your failure to care for the crop during endorsment. the deferral period.
c. Coverage expires on the dates shown in the Special Prowsions or special crop endorsement.
d. increase of Existing Insurance Insurance added to this policy becomes effective at 12:Ol a.m. following the date of the revised Schedule of Insurance or as otherwise provided in the Special Provisions or special crop endorsement.
e. Oecrease of Exishg lnsursnce Reduction or cancellation of insurance will be effective at 12:Ol a.m. of the date requested.
3. DUTIES AFTER LOSS. a. Your Duties Are:
In case of a probable loss to crops insured under this policy you must:
i 1 I Give written notice to us within 10 days after the occurrence.
(21 Preserve in each damaged field of insured crop samples of the remaining damaged crop for our examination.
(31 Allow us to examine the damaged crop as often as we reasonably require.
14) Upon our request provide a complete harvesting and marketing record of each insured crop.
(5) Upon our request submit to examination under oath.
(61 Sign a Withdrawal of Claim when our inspection of the crop determines there is no payable loss under the terms of this policy.
(71 Within 60 days after your loss. unless we extend such time in writing. submit to us a signed state- ment in proof of loss declaring your loss and interest in the crop.
I
4. LOSS PAYMENT. a. The amount payable per acre win be the limit Of
insurance applying on the date of the loss multiplied by the percentage the crop yield is reduced because of the loss. However, the amount payable may not exceed the actual cash value of the portion of the crop destroyed by perils insured against.
b. If a crop loss is also covered by other insurance, we will pay only the proportion of the loss that our limit of insurance bears to the total amount of insurance, except that no Federal Crop Insurance policy or Multiple Peril Crop Insurance policy will be prorated with this policy.
5. REDUCTION OF INSURANCE. The limit of insurance applying to each acre of insured crop will be reduced:
a. By the gross percentage of loss determined for each loss.
b. By the same percentage as each acre of crop IS harvested.
6. APPRAISAL. If you and we fail to agree on the percentage the yield is reduced because of the loss, the following procedure will be used:
a. One of us will demand in writing that the percentage of yield reduction be set by appraisal.
b. Each of us will select a competent appraiser and notify the other of the appraiser’s Identity within 10 days after receipt of the wntten demand.
c. The two appraisers will then select a competenr. Impartial umpire. If the two appraisers are unable to agree upon an umpire within 10 days, you or we can ask a judge of a court of record m the state rn whrch
95 the insured crop IS grown to select an umpire.

d. The appraisers w!ll then set the percentage of yleld reduction. If the appraisers submit a wrItten report of an agreement to us, the amount agreed upon will be the percentage of yield reduction.
e. If the appracsers fad to agree wIthIn a reasonable time. they will submit their dlfference to the umpire. Wrltten agreement signed by any two of these three wll set the percentage of yield reduction.
Each appraiser will be paid by the party selectmg that appraiser. Other expenses of the appraisal and compensa- t~on of the umpire will be pald equally by you and us.
We will not be held to have waived any of our rights by any act relatmg to appraisal.
7. LIBERALIZATION. If we adopt any revision which would broaden the coverage under this policy without additional premium, the broadened coverage will apply.
8. VARIATION IN ACREAGE IN CASE OF LOSS. When the actual acreage of a crop differs from the number of acres stated by item in the Schedule of Insurance:
a. A revised Schedule of Insurance per acre will be ob- tained by dividing the limit of insurance by the actual acreage at the locatlon for such Item.
b. The total insurance per acre on your insured interest will not exceed the value of the crop at the time of loss.
9. WAIVER OR CHANGE OF POLICY PROVISIONS. A waiver or change of any provision must be in writing and approved by us. Our request for an appraisal or examina- tion will not waive any of our rights.
10. ASSIGNMENT OF INTEREST. You may not assign your interest I” this policy without our written consent.
11. ASSIGNMENT OF INDEMNITY. You may assign to another party your right to an mdemni- ty for the crop year only on our form and with our approval. The assignee will have the right to submit the loss notIces and forms required by the policy.
12. CONCEALMENT OR FRAUD. We do not provide coverage for any insured who has intentionally concealed or mwepresented any material fact or circumstance relating to this insurance, either before or after a loss.
13. CANCELLATION OF POLICY. [Except as provided in Special Provisions)
a. By YOU: If you cancel or reduce coverage prior to Inception of the insurance period we WIII refund your paid premium for the amount of wurance cancelled. If you cancel or reduce coverage during the insurance period we WIII not refund any premium
I Oh
b. By Us We may cancel all or any part of the !nsurance provided by us at any twne by notifymg you at least 10 days before the date and hour cancellation takes effect. NotIces of cancellation may be delivered or mailed to you at your mall- ing address shown m the declarat8ons. Proof of mallmg WIII be sufficient proof of notIce.
II we cancel all or any part of this policy. we WIII return the premium pald for the amount of msurance per acre on the portion cancelled. (State law exceptions to the 10 days notice of cancelIa. non, if any. are contained in the Special Provisions.1
14. EXCLUSIONS. We do not cover:
a. Loss from any’ per11 not insured against, even though the loss may have occurred in conjunction with a per11 insured agamst.
b. Loss of any portion of a crop recoverable by harvesting equipment.
c. Loss due to your neglect or failure to harvest mature crops.
d. Injury or damage to the vegetative or flowering portlon of any plant, tree or shrub, except to the extent that the mjury results in a reduction of yield of that crop.
e. Any loss that has been contnbured to by nuclear reac- tion, radiation, or radroactwecontaminatlon, all whether controlled or uncontrolled or however caused, or any consequence of any of these.
15. ABANDONMENT OF CROP. We will not accept abandonment to us of any interest I” any crop.
16. SUIT AGAINST US. You cannot bring suit or action against us unless you have complied with all of the policy provisions.
If you do enter suit against us you must do so within 12 months of the occurrence causing loss or damage. IState law exceptions to the 12 months limitation, if any, are contained in the Special Provisions.1
17. CONFORMITY TO STATUTES. If any terms of this policy are in conflict with statutes of the state in which this policy is Issued the policy will con- form to such statutes.
1 B.SUBROGATION {Recovery of loss from a third party.) Because you may be able to recover all or a part of your loss from someone other than us. you rn”st do all you can to preserve any such rights. If we pay you for your loss then your right of recovery will belong to us. If we recover more than we pald you plus our expenses, the excess will be pald to you.

CROP-HAIL POLICY-BASIC FORM
SPECIAL PROVISIONS
1987 -CHIAA 635
1. PERILS INSURED AGAINST. 4. CANNING BEANS AND CANNING PEAS. We insure for direct loss to crops described in the Schedule Insurance on canning beans and cannmg peas WIII expire of Insurance caused by: 60 days after the crop is clearly wsible above the ground
a. Hail
b. Fire and Lightning We cover loss by fire and lightning before harvest and while crop is still in the harvester.
c. Transir Coverage (Excepr Cortonl While the harvested crop is being transported to the first place of storage not to exceed 50 miles. this policy is extended to cover loss caused by:
5. CORN AND SORGHUM. On corn grown for seed purposes, and on popcorn or sweet corn, the amount of any loss vwll be determined m rhe same manner as for ordinary field corn. On sorghum crops grown for seed purposes, the amount of any loss wll be determined in the same manner as for ordinary field sorghum.
6. COTTON. We do not cover cotton bolls fmmature ar the nme of a killing frost or freeze.
(1 I Fire and Lightning 12) Windstorm (31 Collision (41 overturn 151 Collapse of bridges, docks and culverts
However, Transit Coverage is excess over any other valid and collectible insurance.
FIRST PLACE OF STORAGE means any drying apparatus, drying bins or storage facility of any kind.
7. HAY, FORAGE AND GRASS CROPS. a. For hay, forage or other crops harvested more than
once each growing season. the limit of Insurance per acre provided for each cutting or’ harvest WIII be determined by diwding the total msurance per acre bv the number of cuttings or harvests.
b. If your schedule of insurance specifies a limit of insurance per acre for each cutting or harvest, Sectton (al will not apply.
c. When hay and grass crops grown for seed are Insured:
d. Fire Dep8rfm8nt Service Charge We will pay up to $250 for your obligation assumed by contract or agreement for lire depanment charges incurred when the fire department is called to save or protect the unharvested crop.
(1 J The insurance will apply only to the currlng to be harvested for seed.
(2) Until the seed is set. a maximum of 25% of rhe insurance per acre stared in the Schedule of Insurance will apply.
No Excess Over Loss or Deductible will apply to Fire, Lightning and Transit Coverage or Fire Department Service Charge.
2. MINIMUM LOSS. We will not cover any loss until the percentage of Yield reduction per acre equals 5% or more of the crop, nor any loss in addition to a paid loss until such addItIonal reduction an yield equals 5% or more of the original crop.
8. REPLANTING DESTROYED CROPS. When any acre of crop has been damaged by hall TO the extent that replanting is necessary. and replanting ro rile same or a substitute crop is feasible under the gro,.viny conditions where such crop is grown, we will reimburse LUU for Your actual expense of replanting not to exceed :he following percentage of the limit of insurance applying to each acre of the insured crop, whether the crop is replar.;+l: or not.
3. CATASTROPHE LOSS AWARD. When a loss exceeds 70% on any acre of the insured crop an additional amount of one-half of the percent of loss that is in excess of 70% will be paid. However:
Cotton: Basic Form. DXSlO Form : : : :
1 o< 5 ?.c
XS2OlP form. Other crops, at/ forms.
:‘- LC:
a. the total amount payable per acre will not exceed the amount of insurance applying at the time of loss;
b. this award will not be paid if the loss IS subject to any Excess Over Loss or Deductible provision which does not disappear at or less than 70% loss.
The limit of insurance will be reduced by lhe arnounl jlf ,’ .? replanting award. The insurance will conrmue or’ ‘7.7 replanted cropif of like kind; If not ol llke kind. the ~rs~,‘c~~ ? will transfer to the substitute crop at the ap~roi~ 3.1 premium upon approval by us.

9. EXPIRATION OF INSURANCE. Ot3IS Coverage ceases at 12:Ol a.m. on the followmg dates of Cimarron. Texas, and
the cur&t year:
1 B~%on, Texas, and Beaver Counries. All other counties.
Corn. , Cotton
Combine maize Mile maize.
Hail coverage:
Beaver Counties All other counties.
Fire, Lightning me
and Transit Cimarron, Texas, and coverage: Beaver Counties.
A// other counties.
July 25..... July 25 Sorghum crops. July 15..... July 15 Soybeans
October 15. December 15 Wheat Oecembet 15. December 15 Cimatron, Texas and November 15.. December 15 Beaver Counries. November 15. December 15 All other counties.
All crops not specified
July 25 July 15.
July 25. July 25 July 15. July 15
November 15. November 15.
December 15 November 15
July 25. July 15.
October 15.
July 25 Julv 15
July 25 July 15
October 15
OPTIONAL PROVISIONS
Your application and tate of premium determine whether your coverage will be amended by one of the following optional provisions.
EXCESS OVER 10% LOSS-DISAPPEARING AT 50%-PROVISION-(SYMBOL: DXSlO)
We will not covet any loss until the percentage of yield reduction pet acre exceeds 10%. The percentage pet acte then payable will be the percent in excess of lo%, multiplied by 1.25. Once the percent of yield reduction equals ot exceeds 50% this provision will no longer apply. The payable percentage may not exceed 100%.
When the percentage of yield teducrlon once exceeds 10%. theteafret the “Minimum Loss” provision will apply to any subsequent losslesl.
EXCESS OVER 20% LOSS-INCREASING PAYMENT PROVISION (SYMBOL: XS2OlP)
I .We do not covet any loss until the reduction in yield pet acre exceeds 20%; the percentage pet acre then payable wtll be the percent in exce.ss of 20%. multiplied by 1.25. The payable percentage may not exceed 100%.
When the percentage of yield reduction once exceeds 20%. thereafter the “Minimum Loss” provision will apply to any subsequent loss(es).

8 ppendix c
REPORT ON BIAS IN FALC DETERMLNATION
Since the new crop hail rating method was implemented in 1990, there have been questions about how well this system works. One area of concern is whether there is any bias introduced by the Final Average Loss Cost (FALC) mix and the Catastrophe procedure.
In the new Catastrophe procedure, losses in excess of a specified amount are removed from local experience and gathered into State and Crop Reporting District loss pools. The remaining losses are called “normal” losses. The initial estimate of the FALC for each location is based on a weighted average of location normal loss costs and normal loss costs from surrounding areas. It should not consistently over- or under- estimate local normal loss costs. Normal “implied” losses are detined for each location as
NORMAL IMPLIED LOSS = FALC (w/o catastrophe) x LIABILITY.
If there is no consistent bias in the FALC calculation, then the total implied losses for the state should not deviate significantly from statewide normal losses.
After the initial FALC estimates are computed, the catastrophic losses are redistributed by means of factors applied to the FALC. The FALC with catastrophe should not consistently over- or under-estimate local loss costs. Total implied losses are calculated as
TOTAL IMPLIED LOSS = FALC (w/catastrophe) x LIABILITY,
Total implied losses for the state should not deviate significantly from statewide total losses.
Table I lists several of the township rated states for which a rate analysis or FALC analysis has been done using the new rating methods. Also listed is the amount by which total implied losses deviated from total losses and the percent by which implied losses deviated from normal and total losses.
Deviations from normal losses are quite small in each case. It is clear that the FALC mix does not consistently inflate or deflate losses. That the deviations from total losses don’t differ much from the deviations from normal losses would indicate that the catastrophe loading procedure does not create any bias.
Areas with low liability have a different FALC mix than do areas with adequate liability. To examine the effects of the change in FALC mix, townships were separated by amount of liability. Tables 2 and 3 are examples of the results from this analysis. The amount of deviation from actual losses in the low liability areas varied considerably by crop and state. In some cases, implied losses in low liability areas differed quite a bit from actual losses. However, because the losses in these areas are so small, they have little impact overall.
IYY

DEVIATIONS OF IMPLIED LOSSES FROM ACTUAL LOSSES
RATE ANALYSIS
YEAR STATE ------mm --_--
1990 IDAHO 1990 IDAHO 1990 IDAHO 1990 IDAHO 1991 ILLINOIS 1991 ILLINOIS 1990 IOWA 1990 IOWA 1990 KANSAS 1990 KANSAS 1990 MINNESOTA 1990 MINNESOTA 1991 MONTANA 19 9 1 MONTANA 1990 NEBRASKA 1990 N. DAKOTA 1990 OKLAHOMA 1991 OREGON 1990 5. DAKOTA 1990 S. DAKOTA 1991 WASHINGTON
DEV. FROM CROP TOTAL LOSSES -m-m -------_____ BARLEY ($248,865) PEAS ($178,230) POTATOES (948.036)
SOYBEANS $859,841 CORN $637,725 SOYBEANS $2,432,748 CORN $46,746 WHEAT $590,628 GiLWINS 551.511 SOYBEANS $2,691;539 BARLEY ($132,994) WHEAT ($139,851) GRAINS WHEAT WHEAT $324;816 GRAINS $17,994 CORN $308,176 WHEAT ($369,777) TREE FRUIT .$21,032
1991 WASHINGTON WHEAT (5459,228)
% DEV. FROM TOTAL LOSSES ----_-------
-1.0% -2.0% -0.4% -2.5%
0.7% 0.6% 0.3% 0.5% 0.1% 0.3% 0.0% 1.3%
-0.4% -0.1% -0.1%
0.3% 0.5% 0.2% 0.7%
-0.4% 0.1%
-3.4%
% DEV. FROM NORMAL LOSSES -----------__
-1.0% -2.1% -0.4% -2.5%
0.7% 0.5% 0.3% 0.5% 0.1% 0.3% 0.1% 1.3%
-0.3% -0.1% -0.1%
0.3% 0.5% 0.2% 0.7%
-0.4% 0.2%
-3.3%
TABLE 1.
200

TABLE 2. 1990 IDAHO BARLEY
LIABILITY
LOW
NORMAL
TOTALS
LIABILITY
LOW
NORMAL
TOTALS
LIABILITY NORMAL LOSSES
LOW 119,084
NORMAL 8,074,&7
TOTALS 8,193,731
LIABILITY
LOW
NORMAL
TOTALS
TOTAL LOSSES
119,084
8,654,480
8,773,5&i
IMPLIED % DEVIATION NORMAL LOSSI$ NORMAL LOSSES FROM NORMAL
163,047 245,595 0.3
24,744,793 24,415,535 -1.3
24,907,840 24,661,130 -1.0
TOTAL LOSSES
163,047
25,594,542
25,757,589
IMPLIED % DEVIATION TOTAL LOSSES FROM TOTAL
251,392 0.3
25,257,332 -1.3
25,508.724 -1.0
TABLE 3. 1990 IDAHO PEAS
IMPLIED NORMAL LOSSES
149,211
7,875,OOl
8,024,212
IMPLlED TOTAL LOSSES
155,991
8,439,343
8,595,334
% DEVIATION FROM NORMAL
0.4
-2.4
-2.1
% DEVIATION FROM TOTAL
0.4
-2.5
-2.0

Top Related