


Languages
Pages
Legal


Center for Medicare & Medicaid Innovation U.S. Department of Health & Human Services
CPC+ PAYMENT METHODOLOGIES: BENEFICIARY ATTRIBUTION, CARE MANAGEMENT FEE, PERFORMANCE-BASED INCENTIVE PAYMENT, AND PAYMENT UNDER THE MEDICARE PHYSICIAN FEE SCHEDULE FOR PROGRAM YEAR 2018
Version 1 December 1, 2017
Comprehensive Primary Care Plus Center for Medicare & Medicaid Innovation
Table of Contents Acronyms ................................................................................................................................... viExecutive Summary ................................................................................................................... 1Chapter 1: Introduction ..............................................................................................................13
1.1 CPC+ Payment Design Overview ...............................................................................131.2 CPC+ Payment Elements ...........................................................................................13
Chapter 2: Beneficiary Attribution ..............................................................................................172.1 Attribution ...................................................................................................................172.2 Eligible Beneficiaries ..................................................................................................182.3 Eligible Visits ..............................................................................................................192.4 Attribution Methodology ..............................................................................................21
2.4.1 Attribution Based on CCM-Related Billings .....................................................222.4.2 Attribution Based on Annual Wellness Visits or Welcome to Medicare Visits ..222.4.3 Attribution Based on Plurality ..........................................................................22
Chapter 3: Care Management Fee ............................................................................................253.1 Risk Scores and Risk Tiers .........................................................................................25
3.1.1 CMS-HCC Risk Scores ...................................................................................263.1.2 Setting the Risk Tier Thresholds .....................................................................26
3.2 Assigning Risk Tiers ...................................................................................................273.2.1 Assigning Risk Tiers 1–5 Based on Risk Score ...............................................273.2.2 Assigning Risk Tier 5 Based on Dementia Diagnosis (Track 2 Only) ...............28
3.3 Retrospective Debits ..................................................................................................293.3.1 Debits for Beneficiary Ineligibility .....................................................................293.3.2 Debits for Duplication of Services....................................................................30
3.4 Risk Score Growth and CMF Cap ...............................................................................30Chapter 4: Performance-Based Incentive Payment ...................................................................33
4.1 Design Principles and General Features.....................................................................334.1.1 Principles of Design ........................................................................................334.1.2 Prospective Payment ......................................................................................344.1.3 Transparency of Performance Goals ...............................................................354.1.4 Incentive Structure ..........................................................................................354.1.5 Incentive Payment Components......................................................................364.1.6 Incentive Payment Amounts ............................................................................37
4.2 Quality Component .....................................................................................................38

Comprehensive Primary Care Plus Center for Medicare & Medicaid Innovation
4.2.1 CAHPS Measurement .....................................................................................384.2.2 eCQM Measurement .......................................................................................39
4.3 Utilization Component.................................................................................................394.4 Calculation of Performance Scores.............................................................................40
4.4.1 Calculation of Quality Performance Score .......................................................424.4.2 Calculation of Utilization Performance Score ..................................................45
4.5 Benchmarking Overview .............................................................................................464.5.1 Data Source for Benchmarking .......................................................................474.5.2 Benchmarking Methods ..................................................................................494.5.3 Benchmark Results .........................................................................................52
4.6 Illustrative Example of Performance Incentive Retained .............................................534.6.1 Calculation of Performance Incentive Retained for Quality Component...........534.6.2 Calculation of Performance Incentive Retained for Utilization Component ......544.6.3 Calculation of Performance Incentive Retained ...............................................55
Chapter 5: Payment under the Medicare Physician Fee Schedule ............................................585.1 Purpose and Intent .....................................................................................................58
5.1.1 Purpose and Aims ...........................................................................................585.1.2 Payment Choices by Year ...............................................................................595.1.3 Implications of CPCP for Practices and Beneficiaries ......................................60
5.2 Historical PBPM ..........................................................................................................605.2.1 Historical Population and Eligibility ..................................................................615.2.2 Historical Payments ........................................................................................615.2.3 Example Practice Illustration—Main Street CPC .............................................62
5.3 CPCP Program Year Calculation ................................................................................625.3.1 Comprehensiveness Supplement ....................................................................625.3.2 Physician Fee Schedule (PFS) Updates and Revaluation Changes ................625.3.3 Adjusted Historical PBPM ...............................................................................635.3.4 Calculation for Main Street CPC......................................................................635.3.5 Frequency of CPCP Calculation and Payment ................................................635.3.6 Debits for Beneficiary Ineligibility .....................................................................66
5.4 FFS Reduction............................................................................................................675.4.1 FFS Calculation for Main Street CPC ..............................................................67
5.5 Partial Reconciliation ..................................................................................................67Chapter 6: Conclusions .............................................................................................................73References ...............................................................................................................................75
Comprehensive Primary Care Plus Center for Medicare & Medicaid Innovation
Appendices Appendix A: Glossary of Terms ................................................................................................. 77Appendix B: Primary Care Specialty Codes .............................................................................. 85Appendix C: Description of CMS-HCC Risk Adjustment Model ................................................. 87Appendix D: Risk Tier Thresholds for First and Second Quarters in 2018 ................................. 89Appendix E: CAHPS Measure Survey Questions ...................................................................... 91Appendix F: CPC+ eCQM Set—Program Year 2018 ................................................................ 93Appendix G: Utilization Measure Technical Specifications ........................................................ 95Appendix H: eCQM Tracking Worksheet ................................................................................. 109Appendix I: Evaluation and Management (E&M) Claims in Hybrid Payment ........................... 111
Comprehensive Primary Care Plus Center for Medicare & Medicaid Innovation
List of Figures Figure 2-1 What Is a Look Back Period? ................................................................................... 18Figure 2-2 Which Beneficiaries Are Attributed to My Practice? .................................................. 23Figure 3-1 Beneficiary Risk Tiers .............................................................................................. 29Figure 4-1 Components of the PBIP .......................................................................................... 37Figure 4-2 Overview of Practice Eligibility to Retain Quality and Utilization Components
of the PBIP .............................................................................................................. 42Figure 5-1 How does the Comprehensive Primary Care Payment (CPCP) in Track 2 Get
Calculated?.............................................................................................................. 65Figure 5-2 Comprehensive Primary Care Payment (CPCP)—Main Street CPC Example ......... 66Figure 5-3 Payment Reconciliation............................................................................................ 71
List of Tables Table 1-1 CPC+ Payment Summary ......................................................................................... 15Table 2-1 Look Back Periods for Quarterly Beneficiary Attribution ............................................ 19Table 2-2 Primary Care Services Eligible for Attribution ............................................................ 20Table 3-1 Risk Tier Criteria and CMF Payments (per Beneficiary per Month) ........................... 25Table 3-2 Risk Score Data Used to Determine CMF Payments, by Quarter .............................. 26Table 3-3 CCM-Related Services Duplicative of CPC+ CMF .................................................... 30Table 4-1 PBIP PBPM by Component for CPC+ Track 1 and Track 2 Practices ....................... 37Table 4-2 Practice Performance and Percentage of PBIP for Patient Experience of Care ......... 44Table 4-3 Practice Performance and Percentage of Quality Component of the PBIP
Retained for Individual eCQMs ................................................................................ 44Table 4-4 Practice Performance and Percentage of PBIP for Utilization.................................... 46Table 4-5 CPC+ Quality and Utilization Measures for Benchmarking ........................................ 47Table 4-6 Hypothetical Examples of Scoring Transformations for CAHPS Measures ................ 50Table 4-7 Benchmark Results for the Quality and Utilization Measures in CPC+ ...................... 52Table 4-8 Percent Payment Retained by Measure—Illustrative Example for Main Street
CPC ......................................................................................................................... 53Table 5-1a Track 2 Payment Choices 2017 Starters: Track 2 Payment Choices by Year .......... 59Table 5-1b Track 2 Payment Choices 2018 Starters: Track 2 Payment Choices by Year .......... 60
Comprehensive Primary Care Plus Center for Medicare & Medicaid Innovation
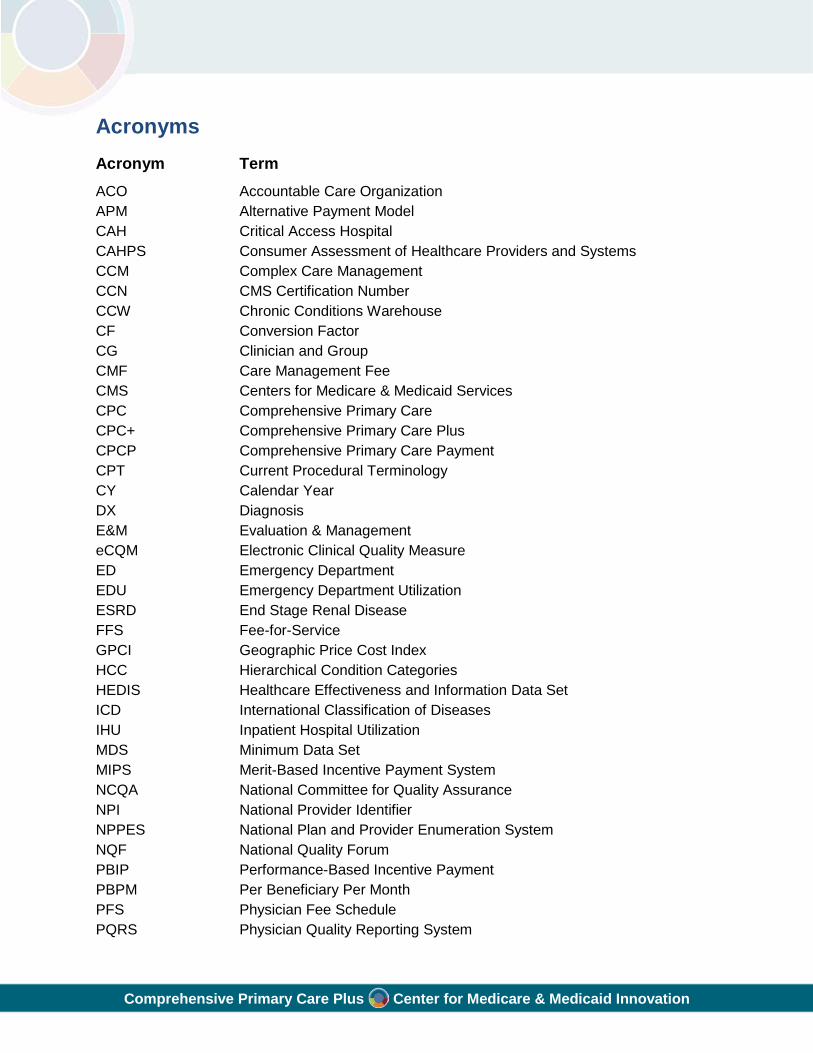
Acronyms Acronym Term ACO Accountable Care Organization APM Alternative Payment Model CAH Critical Access Hospital CAHPS Consumer Assessment of Healthcare Providers and Systems CCM Complex Care Management CCN CMS Certification Number CCW Chronic Conditions Warehouse CF Conversion Factor CG Clinician and Group CMF Care Management Fee CMS Centers for Medicare & Medicaid Services CPC Comprehensive Primary Care CPC+ Comprehensive Primary Care Plus CPCP Comprehensive Primary Care Payment CPT Current Procedural Terminology CY Calendar Year DX Diagnosis E&M Evaluation & Management eCQM Electronic Clinical Quality Measure ED Emergency Department EDU Emergency Department Utilization ESRD End Stage Renal Disease FFS Fee-for-Service GPCI Geographic Price Cost Index HCC Hierarchical Condition Categories HEDIS Healthcare Effectiveness and Information Data Set ICD International Classification of Diseases IHU Inpatient Hospital Utilization MDS Minimum Data Set MIPS Merit-Based Incentive Payment System NCQA National Committee for Quality Assurance NPI National Provider Identifier NPPES National Plan and Provider Enumeration System NQF National Quality Forum PBIP Performance-Based Incentive Payment PBPM Per Beneficiary Per Month PFS Physician Fee Schedule PQRS Physician Quality Reporting System
Comprehensive Primary Care Plus Center for Medicare & Medicaid Innovation
Acronym Term Q1 Quarter 1 Q2 Quarter 2 Q3 Quarter 3 Q4 Quarter 4 QRDA Quality Reporting Document Architecture RVU Relative Value Unit TIN Tax Identification Number VBPM Value Based Payment Modifier

Comprehensive Primary Care Plus Center for Medicare & Medicaid Innovation
[This page was intentionally left blank.]
Page 1 of 114
Executive Summary This Executive Summary provides an overview of the methodologies that the Centers for Medicare & Medicaid Services (CMS) will use for the Comprehensive Primary Care Plus (CPC+) payment model being tested in Medicare fee-for-service (FFS) in Program Year 2018. The Executive Summary and the detailed technical specifications for each of the methodologies are organized as follows:
• Chapter 1 introduces the CPC+ attribution and payment elements; • Chapter 2 describes the beneficiary attribution; • Chapter 3 describes the Care Management Fee; • Chapter 4 describes the Performance-Based Incentive Payment; • Chapter 5 describes the Payment under the Medicare Physician Fee Schedule (PFS);
and • Chapter 6 provides conclusions.
CPC+ payer partners will offer their own aligned arrangements to CPC+ practices.
ES.1 Introduction
CPC+ is a national advanced primary care medical home model, tested under the authority of the Center for Medicare & Medicaid Innovation (Innovation Center), that aims to strengthen primary care through multipayer payment reform and care delivery transformation. CPC+ is a five-year model that includes two primary care practice tracks with incrementally advanced care delivery requirements and payment options to meet the diverse needs of primary care practices in the United States. CPC+ aims to improve patients’ health and quality of care and decrease total cost of care. To this end, CPC+ offers three payment elements to support and incentivize practices to better manage patients’ health and to provide higher quality of care. The payment designs vary slightly for Track 1 and Track 2 CPC+ practices. The three payment elements are the same for 2017 starters and 2018 starters.
In addition to the attribution methodology, which describes the technical specifications used to identify the Medicare FFS beneficiaries for whom participating primary care practices are responsible, this methodology paper will provide detailed specifications for the following three elements of CPC+ payments:
1. Care management fee (CMF): CMF is a non-visit-based fee that will be paid to both Track 1 and Track 2 practices quarterly. The amount of CMF is determined by (1) the number of beneficiaries attributed to a given practice per month, (2) the case mix of the attributed beneficiary population, and (3) the CPC+ track to which the practice belongs. Practices serving a greater number of high-risk beneficiaries are expected to provide more intensive care management and practice support. Thus, the CMF amount is risk-adjusted to reflect the attributed population’s risk level. Track 2 practices will receive a higher CMF for patients with complex needs.
Page 2 of 112
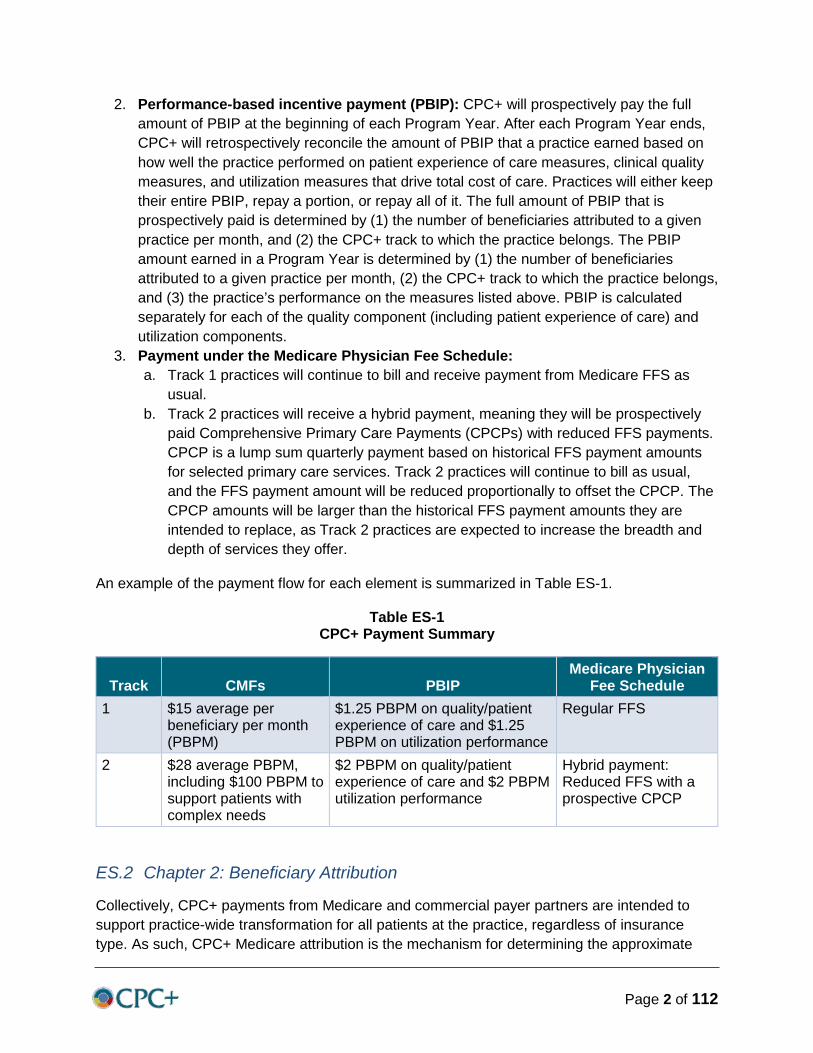
2. Performance-based incentive payment (PBIP): CPC+ will prospectively pay the full amount of PBIP at the beginning of each Program Year. After each Program Year ends, CPC+ will retrospectively reconcile the amount of PBIP that a practice earned based on how well the practice performed on patient experience of care measures, clinical quality measures, and utilization measures that drive total cost of care. Practices will either keep their entire PBIP, repay a portion, or repay all of it. The full amount of PBIP that is prospectively paid is determined by (1) the number of beneficiaries attributed to a given practice per month, and (2) the CPC+ track to which the practice belongs. The PBIP amount earned in a Program Year is determined by (1) the number of beneficiaries attributed to a given practice per month, (2) the CPC+ track to which the practice belongs, and (3) the practice’s performance on the measures listed above. PBIP is calculated separately for each of the quality component (including patient experience of care) and utilization components.
3. Payment under the Medicare Physician Fee Schedule: a. Track 1 practices will continue to bill and receive payment from Medicare FFS as
usual. b. Track 2 practices will receive a hybrid payment, meaning they will be prospectively
paid Comprehensive Primary Care Payments (CPCPs) with reduced FFS payments. CPCP is a lump sum quarterly payment based on historical FFS payment amounts for selected primary care services. Track 2 practices will continue to bill as usual, and the FFS payment amount will be reduced proportionally to offset the CPCP. The CPCP amounts will be larger than the historical FFS payment amounts they are intended to replace, as Track 2 practices are expected to increase the breadth and depth of services they offer.
An example of the payment flow for each element is summarized in Table ES-1.
Table ES-1 CPC+ Payment Summary
Track CMFs PBIP Medicare Physician
Fee Schedule 1 $15 average per
beneficiary per month (PBPM)
$1.25 PBPM on quality/patient experience of care and $1.25 PBPM on utilization performance
Regular FFS
2 $28 average PBPM, including $100 PBPM to support patients with complex needs
$2 PBPM on quality/patient experience of care and $2 PBPM utilization performance
Hybrid payment: Reduced FFS with a prospective CPCP
ES.2 Chapter 2: Beneficiary Attribution
Collectively, CPC+ payments from Medicare and commercial payer partners are intended to support practice-wide transformation for all patients at the practice, regardless of insurance type. As such, CPC+ Medicare attribution is the mechanism for determining the approximate

Page 3 of 112
size and acuity of the Medicare FFS population receiving regular continuous care within the CPC+ practice. This chapter describes the methodology for attributing Medicare beneficiaries to CPC+ practices. CPC+ uses a prospective attribution methodology to identify the Medicare FFS beneficiaries in CPC+ practices. Beneficiary attribution is conducted on a quarterly basis and used to determine payment amounts for CMF, PBIP, and CPCP with FFS reduction (i.e., hybrid payment). CMS will provide each practice with a list of prospectively attributed patients within the first month of the payment quarter. Though Medicare beneficiaries will be attributed to a practice, beneficiaries remain free to select the practitioners and services of their choice and continue to be responsible for all applicable beneficiary cost-sharing.
The attribution process uses multiple steps to assign beneficiaries to practices.1 Using Medicare administrative data, we first identify CMS beneficiaries eligible for attribution to CPC+ practices. We then examine the most recent 24-month historical (or “look back”) period in Medicare claims data to determine which practice to attribute eligible beneficiaries to. Beneficiary attribution to a practice is generally determined first by Chronic Care Management (CCM)-related services, then by Annual Wellness Visits and Welcome to Medicare Visits, and last by the plurality of eligible primary care visits within the 24-month look back period.
1. Eligible Beneficiaries—To be eligible for attribution to a CPC+ practice in a given quarter, beneficiaries must meet several criteria before the start of the quarter.
These criteria include (1) enrolled in Medicare Parts A and B; (2) Medicare as primary payer; (3) not have end stage renal disease (ESRD) and not enrolled in hospice2; (4) not covered under a Medicare Advantage or other Medicare health plan; (5) not long-term institutionalized; (6) not incarcerated; and (7) not enrolled in any other program or model that includes a Medicare FFS shared savings opportunity, except for the Medicare Shared Savings Program.
2. Eligible Visits—Once CMS has identified all beneficiaries eligible for attribution in a given quarter, a pool of Medicare claims during a 24-month “look back” period are used to identify eligible primary care visits to use for attribution.
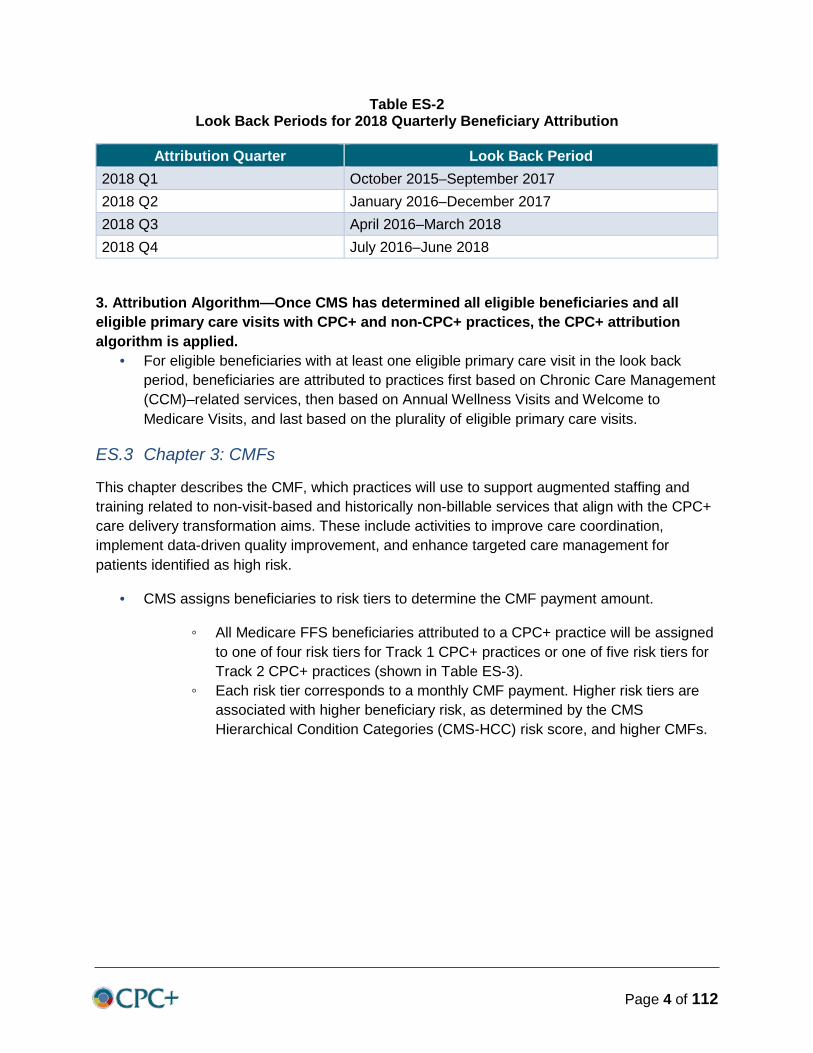
The attribution look back period is the 24-month period ending three months prior to the start of the quarter. For example, CMS will use claims from October 2015 through September 2017 to attribute beneficiaries to CPC+ practices for the first quarter of 2018. The look back periods that will be used for the 2018 quarterly CPC+ attributions are listed in Table ES-2.
1 In the future CMS plans to incorporate voluntary alignment into the CPC+ attribution methodology. See
Chapter 2 for details. 2 Note that this criterion only applies to beneficiaries that have not been attributed to a CPC+ practice
previously—if the beneficiary has been attributed to a CPC+ practice previously, then developing ESRD or enrolling in hospice does not disqualify a beneficiary from being attributed to that CPC+ practice.
Page 4 of 112
Table ES-2 Look Back Periods for 2018 Quarterly Beneficiary Attribution
Attribution Quarter Look Back Period 2018 Q1 October 2015–September 2017 2018 Q2 January 2016–December 2017 2018 Q3 April 2016–March 2018 2018 Q4 July 2016–June 2018
3. Attribution Algorithm—Once CMS has determined all eligible beneficiaries and all eligible primary care visits with CPC+ and non-CPC+ practices, the CPC+ attribution algorithm is applied.
• For eligible beneficiaries with at least one eligible primary care visit in the look back period, beneficiaries are attributed to practices first based on Chronic Care Management (CCM)–related services, then based on Annual Wellness Visits and Welcome to Medicare Visits, and last based on the plurality of eligible primary care visits.
ES.3 Chapter 3: CMFs
This chapter describes the CMF, which practices will use to support augmented staffing and training related to non-visit-based and historically non-billable services that align with the CPC+ care delivery transformation aims. These include activities to improve care coordination, implement data-driven quality improvement, and enhance targeted care management for patients identified as high risk.
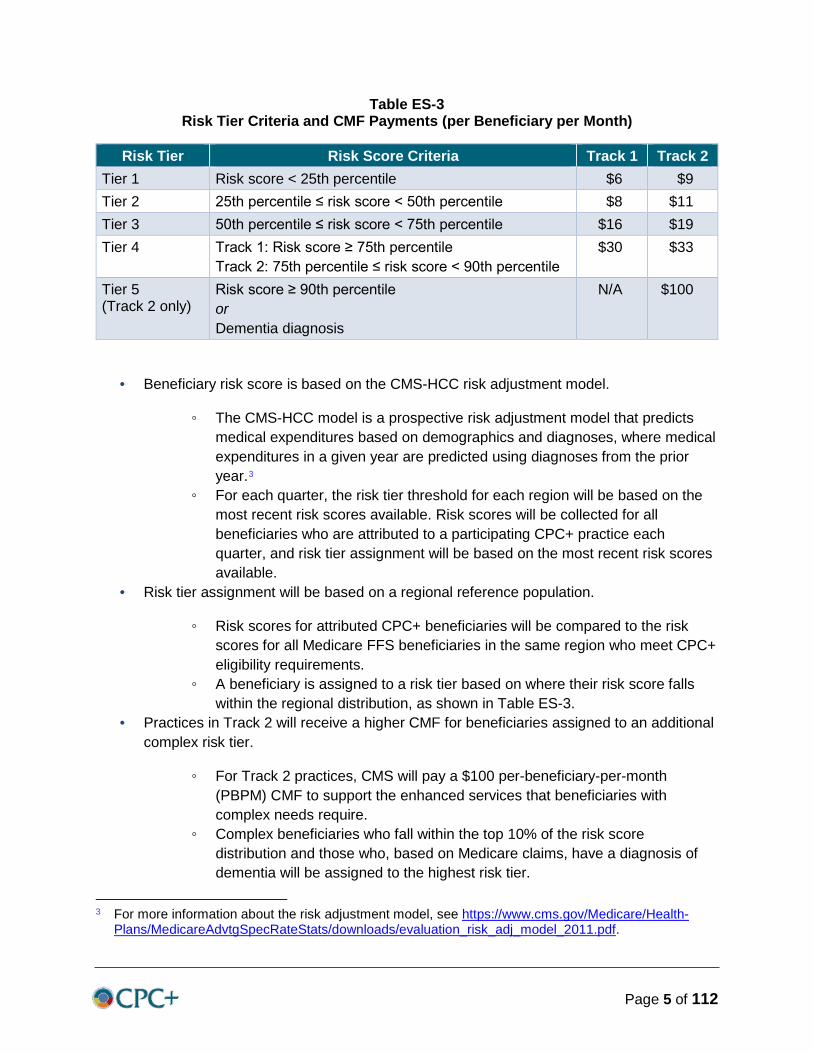
• CMS assigns beneficiaries to risk tiers to determine the CMF payment amount.
◦ All Medicare FFS beneficiaries attributed to a CPC+ practice will be assigned to one of four risk tiers for Track 1 CPC+ practices or one of five risk tiers for Track 2 CPC+ practices (shown in Table ES-3).
◦ Each risk tier corresponds to a monthly CMF payment. Higher risk tiers are associated with higher beneficiary risk, as determined by the CMS Hierarchical Condition Categories (CMS-HCC) risk score, and higher CMFs.
Page 5 of 112
Table ES-3 Risk Tier Criteria and CMF Payments (per Beneficiary per Month)
Risk Tier Risk Score Criteria Track 1 Track 2 Tier 1 Risk score < 25th percentile $6 $9 Tier 2 25th percentile ≤ risk score < 50th percentile $8 $11 Tier 3 50th percentile ≤ risk score < 75th percentile $16 $19 Tier 4 Track 1: Risk score ≥ 75th percentile
Track 2: 75th percentile ≤ risk score < 90th percentile $30 $33
Tier 5 (Track 2 only)
Risk score ≥ 90th percentile or Dementia diagnosis
N/A $100
• Beneficiary risk score is based on the CMS-HCC risk adjustment model.
◦ The CMS-HCC model is a prospective risk adjustment model that predicts medical expenditures based on demographics and diagnoses, where medical expenditures in a given year are predicted using diagnoses from the prior year.3
◦ For each quarter, the risk tier threshold for each region will be based on the most recent risk scores available. Risk scores will be collected for all beneficiaries who are attributed to a participating CPC+ practice each quarter, and risk tier assignment will be based on the most recent risk scores available.
• Risk tier assignment will be based on a regional reference population.
◦ Risk scores for attributed CPC+ beneficiaries will be compared to the risk scores for all Medicare FFS beneficiaries in the same region who meet CPC+ eligibility requirements.
◦ A beneficiary is assigned to a risk tier based on where their risk score falls within the regional distribution, as shown in Table ES-3.
• Practices in Track 2 will receive a higher CMF for beneficiaries assigned to an additional complex risk tier.
◦ For Track 2 practices, CMS will pay a $100 per-beneficiary-per-month (PBPM) CMF to support the enhanced services that beneficiaries with complex needs require.
◦ Complex beneficiaries who fall within the top 10% of the risk score distribution and those who, based on Medicare claims, have a diagnosis of dementia will be assigned to the highest risk tier.
3 For more information about the risk adjustment model, see https://www.cms.gov/Medicare/Health-
Plans/MedicareAdvtgSpecRateStats/downloads/evaluation_risk_adj_model_2011.pdf.
Page 6 of 112
◦ We include beneficiaries with dementia to account for the omission of dementia diagnoses in the CMS-HCC algorithm and to account for the higher level of care coordination these patients require.
• Quarterly, CMS will need to debit the CMF paid to correct for overpayments or duplicate payments.
◦ The first type of retrospective debit is to account for prior CMF overpayments. In each quarterly payment cycle (beginning with the second quarter of the model),
CMS will determine whether a beneficiary lost eligibility during any prior quarters, and will compute a deduction from the upcoming quarter’s payment to reflect previous overpayments. ◦ The second type of debit is due to duplication of services covered by CPC+
CMFs and the Medicare Chronic Care Management (CCM)-related services.4
Per the CPC+ Participation Agreement, for attributed beneficiaries for a given quarter, CPC+ practices may not bill for Chronic Care Management (CCM)-related services furnished in that quarter to any attributed CPC+ beneficiary.
If a CPC+ practitioner bills a CCM-related service for a beneficiary attributed to his or her CPC+ practice in the same month, CMS will recoup the Medicare payment for the CCM-related service.
If a practitioner not at the beneficiary’s attributed CPC+ practice bills a CCM-related service for a beneficiary attributed to a CPC+ practice in the same month, CMS will debit the CMF paid for that month from the CPC+ practice’s future CMF payment.
ES.4 Chapter 4: PBIP
This chapter describes the CMS approach and technical methodology for the PBIP in CPC+ for Program Year 2018. To encourage and reward accountability for clinical quality, patient experience of care, and utilization measures that impact total cost of care, practices will receive a prospective incentive payment annually and will be allowed to keep all or a portion of these funds if they meet annual performance targets. Practices will thus be “at risk” for the amounts prepaid, and CMS will recoup unearned payments. Practices participating in both CPC+ and in a Medicare Shared Savings Program Accountable Care Organization (ACO) will not receive a PBIP. Instead, they will be eligible to earn shared savings under the ACO’s arrangement with the Shared Savings Program.
The PBIP has four key principles:
• CMS prospectively pays practices incentives for quality and utilization.
◦ There are two components of performance: quality (including patient experience of care) and utilization.
4 During any given quarter of a program year, CPC+ practices may not bill the following CCM-related
services for their attributed beneficiaries during that quarter: CPT codes 99358, 99484, 99487, 99490, G0506, and G0507. CPC+ practices may bill these services for beneficiaries not attributed to them.
Page 7 of 112
◦ Both components are fully paid at the beginning of the Program Year and reconciled retrospectively, based on practice performance, the following year when Program Year performance results become available.
• CMS measures quality via patient experience of care surveys and Electronic Clinical Quality Measures (eCQMs).
◦ CMS will use the Consumer Assessment of Healthcare Providers and Systems (CAHPS) Clinician and Group Patient-Centered Medical Home Survey to measure patient experience of care. CMS will survey a representative population of each practice’s patients, including non-Medicare FFS patients. CPC+ practices are required to provide an all patient roster, regardless of insurance type, to CMS when requested. CPC+ practices that fail to provide a patient roster will not receive a CAHPS score and will not qualify to retain the Quality Component or the Utilization Component of the PBIP. Additional actions up to and including withholding CPC+ payments and/or termination of the CPC+ practice’s Participation Agreement may also be considered as a consequence of failing to submit a patient roster.
◦ eCQMs are assessed in accordance with measure specifications, and include non-Medicare FFS patients at the practice.
◦ In 2018, all practices (including those in a Shared Savings Program ACO) must successfully report nine of the 19 CPC+ eCQMs consistent with CPC+ reporting requirements. Practices must report both eCQM outcome measures and at least seven of the remaining 17 eCQM measures.
◦ In future years of CPC+, CMS may add a patient-reported outcome measure for practices participating in Track 2 only and will communicate this addition prior to the beginning of the applicable program year.
• CMS measures utilization via inpatient admissions and emergency department visits.
◦ Inpatient admissions and emergency department visits are significant drivers of total cost of care. Therefore, CMS will measure risk-adjusted inpatient admissions and emergency department visits for attributed Medicare FFS beneficiaries in the CPC+ practice.
◦ Practices are not responsible for calculating or reporting these measures. CMS will use claims to calculate these measures at the CPC+ practice level.
◦ Additional utilization measures may be added in later years if they are validated for adoption. Any changes will be communicated prior to the beginning of the applicable Program Year.
• To keep the incentive payments, practices must meet performance thresholds.
◦ Following the Program Year, CMS will assess practices’ performance. Requirements are the same for both Track 1 and Track 2 and for both 2017 starters and 2018 starters.
◦ Quality and utilization will be scored and financially reconciled separately. ◦ Practices will be compared to performance thresholds derived from a
reference population.
Page 8 of 112
◦ In general, the amount of incentive payment a practice keeps will be calculated along a continuous scale with a minimum and a maximum benchmark for each measure. Practices that score below the minimum are ineligible to keep the incentive, and practices that meet or exceed the maximum earn the entire incentive.
◦ The amount of PBIP earned then will be aggregated across each individual measure for which a practice is eligible to keep payment.
ES.5 Chapter 5: Payment under the Medicare Physician Fee Schedule
This chapter describes the upfront CPCPs and corresponding FFS claims reduction, together termed the “hybrid payment,” for practices participating in Track 2 of CPC+ for Program Year 2018. Practices participating in Track 1 will continue to bill and receive payment from Medicare FFS as usual. The hybrid payment has five key principles:
• The hybrid payment is designed to promote flexibility in support of comprehensive care.
◦ The CPCP compensates practitioners for clinical services that have been traditionally billable but offers flexibility for these services to be delivered inside or outside of an office visit. CMS’ goal is to achieve incentive neutrality, making a practice agnostic as to whether they deliver a service in person or via another modality so the care can be delivered according to patient preferences.
◦ The flexibility is intended to allow more time to be devoted to increasing the breadth and depth of services provided at practice sites and for population health improvement.
◦ The CPCP is an upfront payment for a percentage of expected Medicare payments for evaluation and management (E&M) services provided through the Medicare PFS to attributed beneficiaries. E&M visits billed during the program year will be correspondingly decreased. All other services will be paid according to the Medicare PFS and are not included in the CPCP.
• Practices choose their hybrid payment ratio.
◦ Practices will select a hybrid payment option each Program Year. Practices selecting 10% CPCP/90% FFS or 25% CPCP/75% FFS in their Program Year 1 must increase their CPCP ratio in the next year. All 2017 starters must reach 40% CPCP/60% FFS or 65% CPCP/35% FFS by 2019, and 2018 starters must reach one of these goals by 2020, as illustrated in Tables ES-4a and ES-4b.

Page 9 of 112
Table ES-4a Payment Choices for Track 2 Practices
2017 Starters: Track 2 Payment Choices by Year
Payment Ratio 2017 2018 2019 2020 2021 Blank 10%/90% Blank Blank Blank Blank
CPCP%/FFS% 25%/75% 25%/75% Blank Blank Blank options 40%/60% 40%/60% 40%/60% 40%/60% 40%/60% Blank 65%/35% 65%/35% 65%/35% 65%/35% 65%/35%
Table ES-4b Payment Choices for Track 2 Practices
2018 Starters: Track 2 Payment Choices by Year
Payment Ratio 2018 2019 2020 2021 2022 Blank 10%/90% Blank Blank Blank Blank
CPCP%/FFS% 25%/75% 25%/75% Blank Blank Blank options 40%/60% 40%/60% 40%/60% 40%/60% 40%/60% Blank 65%/35% 65%/35% 65%/35% 65%/35% 65%/35%
◦ Practices will select the percentage they wish to receive up front in their CPCPs before the beginning of each Program Year and cannot change their selection midyear.
◦ Practices at the 40% CPCP/60% FFS or 65% CPCP/35% FFS amounts may switch between these options in any year, but once at the 40%/60% ratio, they cannot switch to a lower percentage upfront.
◦ CMS will implement the CPCP and corresponding FFS reductions (described below) simultaneously. Practices will receive their CPCP quarterly.
• CMS uses claims history to determine the expected payment for E&M services. CMS uses claims for two years for beneficiaries attributed to the CPC+ practice to calculate historic PBPM revenue. The two-year historical claims period differs for 2017 and 2018 starters. For 2017 starters, for Program Year 2018, claims from mid-2014 through mid-2016 will be used. For 2018 starters, for Program Year 2018, claims from mid-2015 through mid-2017 will be used. CMS uses claims for E&M office visits for both new and established patients using the following current procedural terminology (CPT) codes (Table ES-5):

Page 10 of 112
Table ES-5 Office Visit E&M CPT Codes and Descriptions
CPT Code Description 99201–99205 Office or other outpatient visit for new patient 99211–99215 Office or other outpatient visit for established patient 99354–99355 Prolonged care for outpatient visit
◦ To account for the increased depth and breadth of primary care required of Track 2 practices, CMS inflates each practice’s historical annual PBPM by 10% before determining the CPCP payment amounts. CMS also adjusts the inflated calculation year PBPM to reflect 2018 Medicare prices.
◦ CMS will pay the CPCP each quarter according to the following calculation: CPCP each quarter = PBPM in 2018 prices * CPCP% Option * Number of Attributed Beneficiaries for the Quarter * 3 months.
• Practices bill office visit E&Ms as normal and are paid at a reduced rate.
◦ Office visit E&Ms require the submission of a claim and beneficiary cost sharing.
◦ When a claim is submitted for an office visit E&M, CMS will pay CPC+ practices at a reduced rate, commensurate with their previously selected upfront CPCP.
◦ For office visit E&Ms, typical cost sharing requirements for beneficiaries will still be in place. The model exempts beneficiaries from being responsible for coinsurance for non-office-visit care funded through the CPCP.
◦ CMS will reduce the claim only when there is an office visit E&M service by a CPC+ practitioner for an attributed beneficiary.
• Quarterly, CMS will debit the CPCP paid to correct for overpayments due to eligibility.
◦ This retrospective debit is to account for prior CPCP overpayments due to a loss of eligibility.
o In each quarterly payment cycle (beginning with the third quarter of the model), CMS will determine whether a beneficiary lost eligibility during any prior quarters, and will compute a deduction from the upcoming quarter’s payment to reflect previous overpayments.
• CMS will conduct an annual outside-of-practice partial reconciliation on the CPCP. The annual reconciliation will begin in 2018 for 2017 starters, and in 2019 for 2018 starters.
◦ Beginning in 2018, CMS will perform an annual outside-of-practice partial reconciliation of the CPCPs disbursed in 2017 for 2017 starters. Thus, partial reconciliation in 2018 will only affect 2017 starters who received a CPCP in 2017. Partial reconciliation in 2019 will affect all practices (both 2017 and 2018 starters) receiving CPCP in 2018. Practices will be credited or debited through subsequent quarterly CPCP payments.

Page 11 of 112
◦ CMS is performing the partial reconciliation to (1) protect CMS against paying more than expected amounts for office visit E&M services for CPC-attributed beneficiaries, (2) protect practices in specifically defined situations from financial risk from the hybrid payment compared with pure FFS, and (3) maintain incentive neutrality for practices. We expect a small minority of CPC+ practices to be subject to partial reconciliation. If more than a small minority require reconciliation, we may adjust this methodology to protect against undue burden on practices.
◦ Outside-of-practice partial reconciliation is to account for the difference between (1) historical year PBPM revenue and (2) Current Program Year PBPM revenue for office visit E&M services for attributed beneficiaries from primary care practitioners delivered outside the CPC+ practice.
ES.6 Conclusions CPC+ payment system redesign aims to ensure that practices have the infrastructure to improve quality, access, and efficiency of primary care. With the combination of CMF, PBIP, and Medicare FFS payment (regular FFS for Track 1 or hybrid payment for Track 2), CMS provides strong financial support to practices to expand the breadth and depth of the services they provide to better meet the needs of their patient population.

Page 12 of 112
[This page was intentionally left blank.]
Page 13 of 114
Chapter 1: Introduction This document describes the Centers for Medicare & Medicaid Services (CMS) approach and technical methodology for payment design in Comprehensive Primary Care Plus (CPC+) Program Year 2018. CPC+ payment design aims to ensure that practices have the infrastructure to deliver better care, smarter spending, and healthier people. This chapter provides an overview for elements of CPC+ payment design. Chapter 2 describes the technical methodology used to determine attribution for Medicare fee-for-service (FFS) beneficiaries at CPC+ practices. Chapter 3 describes the technical methodology on care management fees (CMFs), which supports CPC+ practices to provide “wrap-around” primary care services. Chapter 4 describes the technical methodology of the performance-based incentive payment (PBIP), which rewards CPC+ practices for high quality of care, patient experience of care, and reduction in unnecessary utilization. Chapter 5 describes the technical methodology of hybrid payment, which is offered to Track 2 practices to promote the flexibility in support of comprehensive care. Note that terms are introduced and defined throughout the document; for easy reference, these terms are included in a glossary in Appendix A.
1.1 CPC+ Payment Design Overview
CPC+ is a national advanced primary care medical home model that aims to strengthen primary care through multipayer payment reform and care delivery transformation. CPC+ is a five-year model that will include two primary care practice tracks with incrementally advanced care delivery requirements and payment options to meet the diverse needs of primary care practices in the United States. CPC+ aims to improve patients’ health and quality of care and decrease total cost of care. To this end, CPC+ offers three payment elements to support and incentivize practices to better manage patients’ health and to provide higher quality of care. The three alternative payment elements are available to CPC+ practices in both tracks, but payment designs vary slightly for Track 1 and Track 2 CPC+ practices. The three alternative payment elements are the same for 2017 starters and 2018 starters.
CMS uses Medicare claims to conduct beneficiary attribution and a prospective beneficiary assignment methodology to identify CPC+ practices’ populations of Medicare FFS beneficiaries. The Medicare beneficiary attribution is the basis for the three elements of payment designs. CMS uses attribution to calculate the amount of CMFs, PBIPs, and, for Track 2 practices, the hybrid payment. Detailed specifications for the attribution methodology are in Chapter 2.
1.2 CPC+ Payment Elements
The alternative payment elements CPC+ offers to support and incentivize practices to better manage patients’ health and to provide higher quality of care include the following:
CMF: CMS is providing the CMF to CPC+ practices to support them in the expectation that CPC+ practices provide “wrap-around” primary care services. CMF is a non-visit-based fee that will be paid to practices in both tracks quarterly. The amount of the CMF is determined by (1) the number of beneficiaries attributed to a given practice per month, (2) the case mix of the
Page 14 of 112
attributed beneficiary population, and (3) the CPC+ track to which the practice belongs. Practices who serve more high-risk beneficiaries are expected to provide more intensive care management and practice support; thus, the CMF amount is risk-adjusted to reflect the practice’s attributed beneficiary population case mix. Track 2 practices will receive a higher CMF for patients with complex needs. Detailed specifications for CMF methodology and calculation are in Chapter 3.
PBIP: CMS offers a PBIP to CPC+ practices to encourage and reward accountability for patient experience of care, clinical quality, and utilization measures that drive total cost of care. CMS prospectively pays the full amount of PBIP at the beginning of each Program Year. After each Program Year ends, CMS retrospectively reconciles the amount of PBIP that a practice earned based on how well the practice performed on patient experience of care measures, clinical quality measures, and utilization measures that drive total cost of care. The amount of PBIP earned is determined by (1) the number of beneficiaries attributed to a given practice per month, (2) the CPC+ track the practice belongs to, and (3) the practice’s performance on the measures listed above. PBIP is paid separately for quality and patient experience of care measures and for utilization measures. Detailed specifications for PBIP methodology and calculation are in Chapter 4.
Payment under the Medicare Physician Fee Schedule (PFS): CMS pays Track 1 practices under regular Medicare Physician Fee Schedule, and CMS pays Track 2 practices under hybrid payment to promote flexibility in support of comprehensive care.
• Track 1 practices continue to bill and receive payment from Medicare FFS as usual. • Track 2 practices are prospectively paid Comprehensive Primary Care Payments
(CPCPs) with a reduced FFS payment. CPCP is a lump sum quarterly payment based on historical FFS payment amounts. Track 2 practices continue to bill as usual, but the FFS payment amount is reduced to account for the CPCP. The CPCP amounts are expected to be larger than the historical FFS payment amounts they are intended to replace, as Track 2 practices are expected to increasingly provide services that are not billable to Medicare. Detailed specifications for hybrid payment methodology and calculation are in Chapter 5.
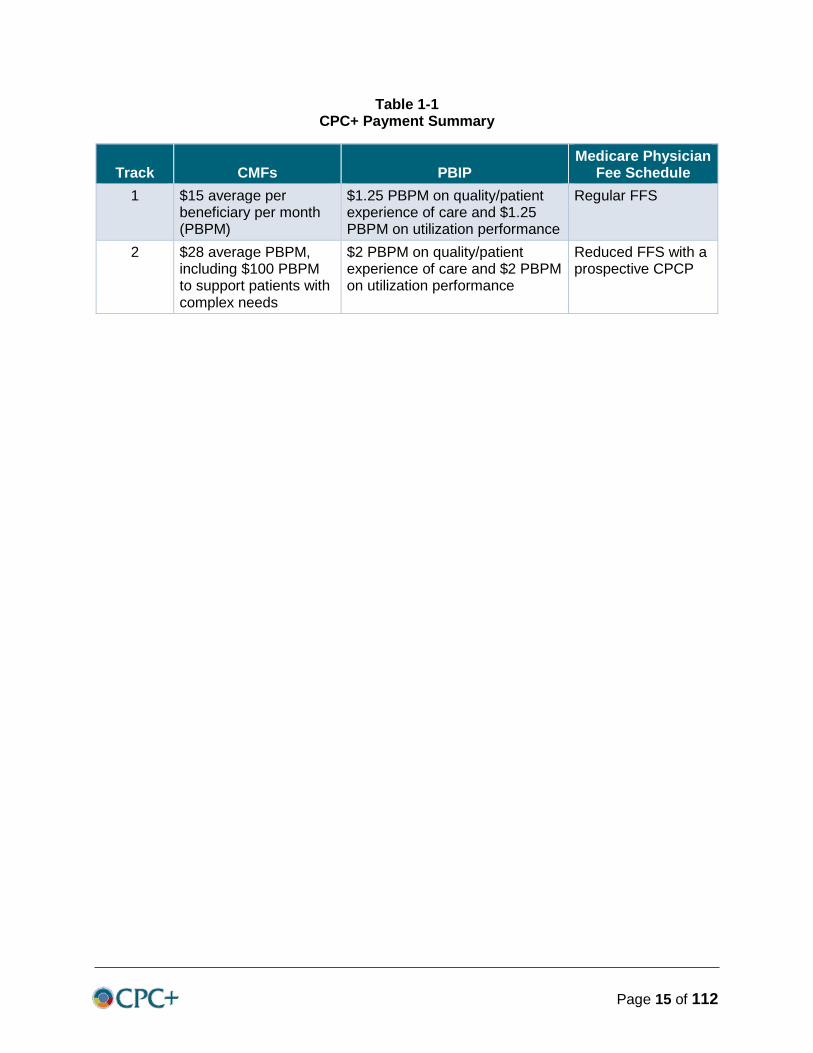
Table 1-1 summarizes the payment design of CPC+ for Track 1 and 2 practices. The payment design is the same for 2017 starters and 2018 starters.
The CPC+ payment system redesign is aimed to ensure practices have the infrastructure to deliver better care, smarter spending, and healthier people. With the combination of CMF, PBIP, and Medicare FFS payment (regular FFS for Track 1 or hybrid payment for Track 2), CMS provides financial support to practices to expand the breadth and depth of the services they provide to better meet the needs of their patient population.
Page 15 of 112
Table 1-1 CPC+ Payment Summary
Track CMFs PBIP Medicare Physician
Fee Schedule 1 $15 average per
beneficiary per month (PBPM)
$1.25 PBPM on quality/patient experience of care and $1.25 PBPM on utilization performance
Regular FFS
2 $28 average PBPM, including $100 PBPM to support patients with complex needs
$2 PBPM on quality/patient experience of care and $2 PBPM on utilization performance
Reduced FFS with a prospective CPCP

Page 16 of 112
[This page was intentionally left blank.]

Page 17 of 112
Chapter 2: Beneficiary Attribution This chapter describes the purpose and methodology for attributing beneficiaries to CPC+ practices. In CPC+, attribution will be used for the following purposes:
• To calculate quarterly CMF payments, • To calculate the annual PBIPs, and • To calculate quarterly CPCPs and perform FFS claims reductions for Track 2 practices.5
After an overview of attribution in Section 2.1, Sections 2.2 and 2.3 define eligible beneficiaries and eligible primary care services for beneficiary attribution. Then Section 2.4 describes the beneficiary attribution algorithm. The methodologies for calculating the quarterly CMF payments, the annual PBIP payments, and (for Track 2 practices) the quarterly CPCPs are located in Chapters 3, 4, and 5, respectively.
2.1 Attribution
Attribution is a tool used to assign beneficiaries to primary care practices. We use attribution to estimate the amount of CMFs, PBIPs, and, for Track 2 practices, the hybrid payment. In Medicare FFS alternative payment models (APMs) such as CPC+ and Accountable Care Organizations (ACOs), CMS uses Medicare claims to conduct beneficiary attribution.
Attribution methodologies commonly consider (1) what unit (e.g., practice, practitioner) a patient is assigned to, (2) how the patient is assigned, (3) the period of the assignment, and (4) how often the assignment is made.
• Unit of assignment: Because CPC+ is a test of practice-level transformation and payment, CMS attributes beneficiaries to the CPC+ Practice Site, rather than individual practitioners. A CPC+ Practice Site is composed of a unique grouping of practitioners and billing numbers (described in more detail below).
• How the beneficiary is assigned: CMS uses Medicare claims to attribute beneficiaries to the practice by recency of Chronic Care Management (CCM) services, recency of Annual Wellness or Welcome to Medicare Visit, or plurality of eligible primary care visits for that beneficiary.
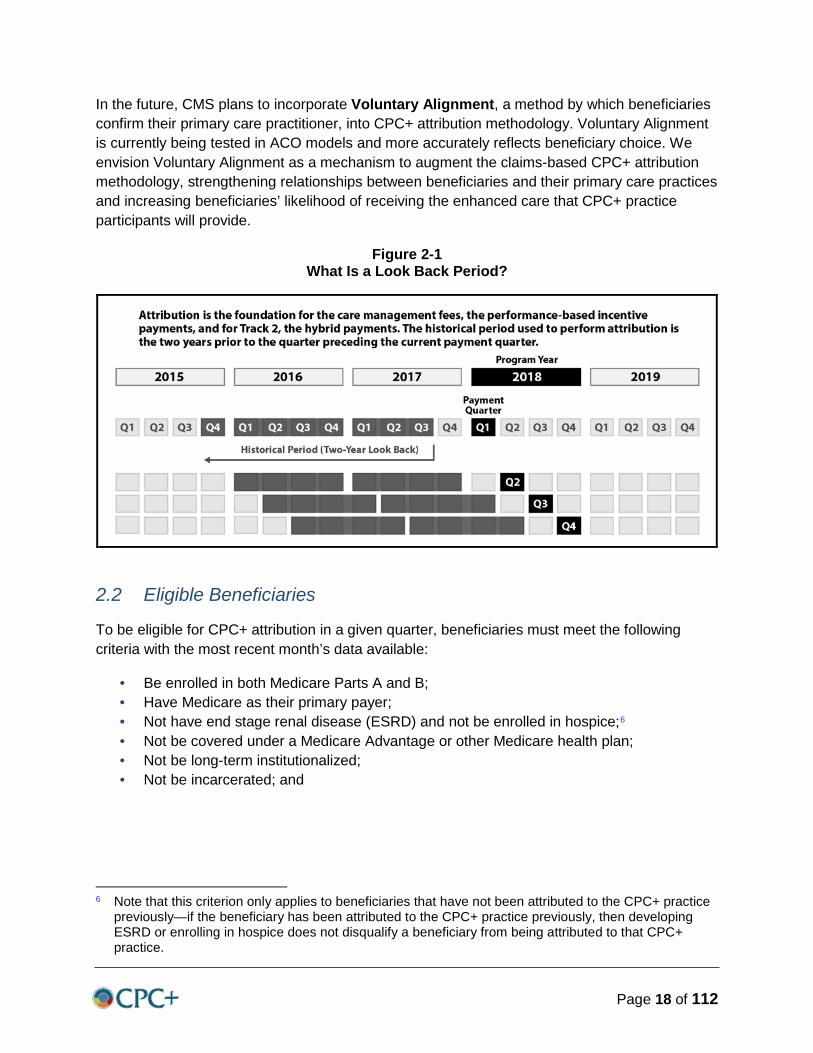
• Period of assignment: Because CMS pays practices to support the CPC+ care delivery model, practices are paid prospectively (i.e., in advance) so that they may make investments consistent with the aims of CPC+. To pay practices prospectively, CMS uses historical data (patient visits to primary care practices obtained through claims during a “look back” time period) to make attributions prior to the start of each payment quarter (Figure 2-1).
• How often the assignment is made: Because the intent is to estimate accurately the number of beneficiaries in a CPC+ practice for purposes of calculating payments, CMS attributes beneficiaries to practices every quarter.
5 Beneficiary attribution is also used to calculate historical evaluation and management (E&M) payments
which the CPCP calculation is based. See Chapter 5 for details.
Page 18 of 112
In the future, CMS plans to incorporate Voluntary Alignment, a method by which beneficiaries confirm their primary care practitioner, into CPC+ attribution methodology. Voluntary Alignment is currently being tested in ACO models and more accurately reflects beneficiary choice. We envision Voluntary Alignment as a mechanism to augment the claims-based CPC+ attribution methodology, strengthening relationships between beneficiaries and their primary care practices and increasing beneficiaries’ likelihood of receiving the enhanced care that CPC+ practice participants will provide.
Figure 2-1 What Is a Look Back Period?
2.2 Eligible Beneficiaries
To be eligible for CPC+ attribution in a given quarter, beneficiaries must meet the following criteria with the most recent month’s data available:
• Be enrolled in both Medicare Parts A and B; • Have Medicare as their primary payer; • Not have end stage renal disease (ESRD) and not be enrolled in hospice;6
• Not be covered under a Medicare Advantage or other Medicare health plan; • Not be long-term institutionalized; • Not be incarcerated; and
6 Note that this criterion only applies to beneficiaries that have not been attributed to the CPC+ practice
previously—if the beneficiary has been attributed to the CPC+ practice previously, then developing ESRD or enrolling in hospice does not disqualify a beneficiary from being attributed to that CPC+ practice.
Page 19 of 112
• Not be enrolled in any other program or model that includes a Medicare FFS shared savings opportunity, except for the Medicare Shared Savings Program.7
Most of these criteria are verified using the Medicare Enrollment Database. Institutional status is verified using Medicare Skilled Nursing Facility Assessment data, known as the Minimum Data Set (MDS). Using the MDS data, CMS identifies a beneficiary as institutionalized if they have ever had a quarterly or annual assessment. Enrollment in other Medicare FFS shared savings models is determined using Medicare’s Master Data Management system.
CMS analyzes eligibility using the most recent month of data available before the beginning of a quarter. Beneficiaries are determined to be eligible as of the first day of that month. For example, beneficiaries must meet all eligibility criteria on December 1, 2017, to be eligible for attribution in the first quarter of 2018 (January 1, 2018–March 30, 2018).
Beneficiaries who lose eligibility before the quarter begins are later accounted for in payment reconciliations for the CMF and CPCP.
2.3 Eligible Visits
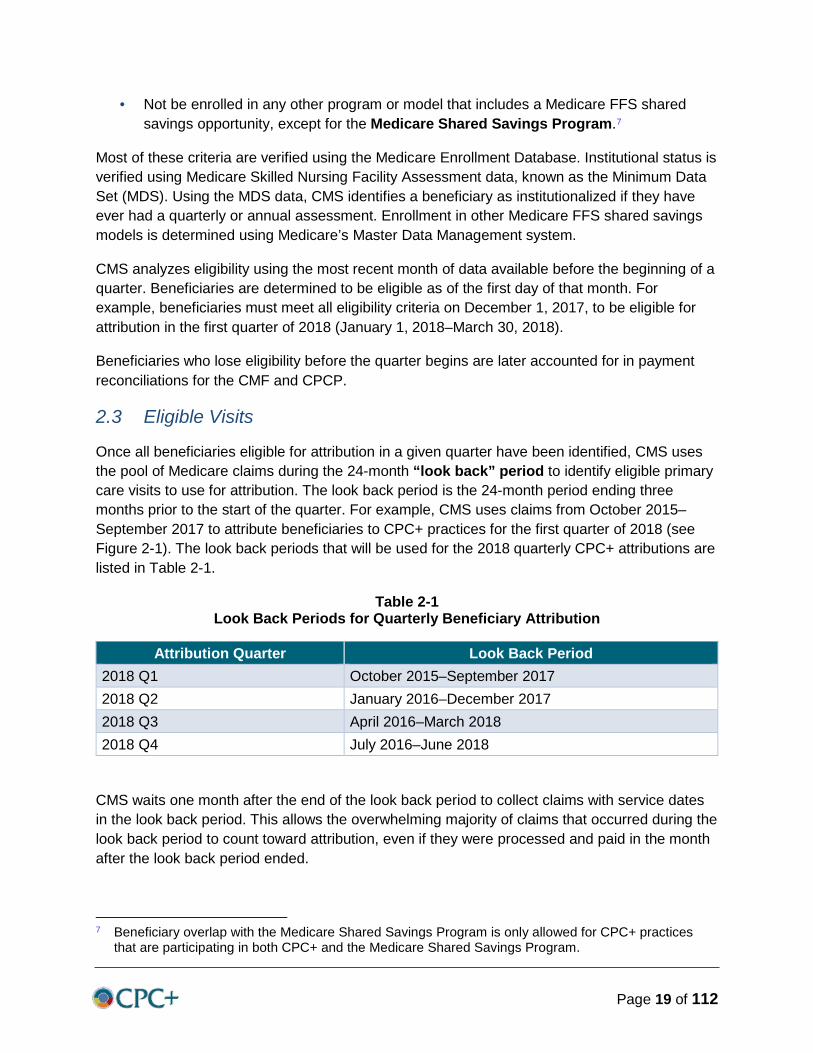
Once all beneficiaries eligible for attribution in a given quarter have been identified, CMS uses the pool of Medicare claims during the 24-month “look back” period to identify eligible primary care visits to use for attribution. The look back period is the 24-month period ending three months prior to the start of the quarter. For example, CMS uses claims from October 2015–September 2017 to attribute beneficiaries to CPC+ practices for the first quarter of 2018 (see Figure 2-1). The look back periods that will be used for the 2018 quarterly CPC+ attributions are listed in Table 2-1.
Table 2-1 Look Back Periods for Quarterly Beneficiary Attribution
Attribution Quarter Look Back Period 2018 Q1 October 2015–September 2017 2018 Q2 January 2016–December 2017 2018 Q3 April 2016–March 2018 2018 Q4 July 2016–June 2018
CMS waits one month after the end of the look back period to collect claims with service dates in the look back period. This allows the overwhelming majority of claims that occurred during the look back period to count toward attribution, even if they were processed and paid in the month after the look back period ended.
7 Beneficiary overlap with the Medicare Shared Savings Program is only allowed for CPC+ practices
that are participating in both CPC+ and the Medicare Shared Savings Program.
Page 20 of 112
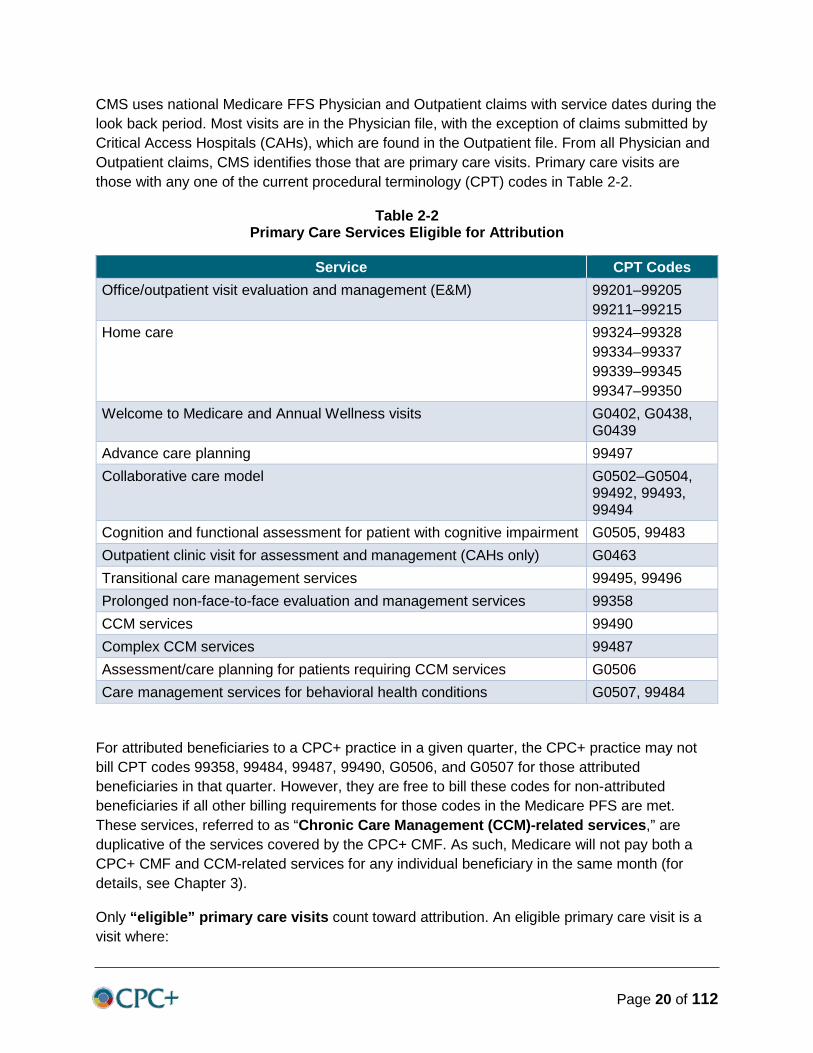
CMS uses national Medicare FFS Physician and Outpatient claims with service dates during the look back period. Most visits are in the Physician file, with the exception of claims submitted by Critical Access Hospitals (CAHs), which are found in the Outpatient file. From all Physician and Outpatient claims, CMS identifies those that are primary care visits. Primary care visits are those with any one of the current procedural terminology (CPT) codes in Table 2-2.
Table 2-2 Primary Care Services Eligible for Attribution
Service CPT Codes Office/outpatient visit evaluation and management (E&M) 99201–99205
99211–99215 Home care 99324–99328
99334–99337 99339–99345 99347–99350
Welcome to Medicare and Annual Wellness visits G0402, G0438, G0439
Advance care planning 99497 Collaborative care model G0502–G0504,
99492, 99493, 99494
Cognition and functional assessment for patient with cognitive impairment G0505, 99483 Outpatient clinic visit for assessment and management (CAHs only) G0463 Transitional care management services 99495, 99496 Prolonged non-face-to-face evaluation and management services 99358 CCM services 99490 Complex CCM services 99487 Assessment/care planning for patients requiring CCM services G0506 Care management services for behavioral health conditions G0507, 99484
For attributed beneficiaries to a CPC+ practice in a given quarter, the CPC+ practice may not bill CPT codes 99358, 99484, 99487, 99490, G0506, and G0507 for those attributed beneficiaries in that quarter. However, they are free to bill these codes for non-attributed beneficiaries if all other billing requirements for those codes in the Medicare PFS are met. These services, referred to as “Chronic Care Management (CCM)-related services,” are duplicative of the services covered by the CPC+ CMF. As such, Medicare will not pay both a CPC+ CMF and CCM-related services for any individual beneficiary in the same month (for details, see Chapter 3).
Only “eligible” primary care visits count toward attribution. An eligible primary care visit is a visit where:
Page 21 of 112
1. The CPT code on the claim is among those listed in Table 2-2, and 2. For non-CCM-related services, the service was provided by a practitioner who meets one
of the following criteria:8
a. The practitioner was participating in a CPC+ practice at the time the visit occurred; or b. The practitioner has one of the primary care specialty codes located in Appendix B.
A CPC+ practice is defined by the combinations of Taxpayer Identification Number (TIN) (or CMS Certification Number (CCN) for CAHs) and National Provider Identifiers (NPIs) identified for each practitioner participating at a CPC+ Practice Site. Each visit in the claims data includes (1) the TIN or CCN and (2) the NPI of the practitioner who rendered the service. To determine whether a practitioner was participating in the CPC+ practice at the time the visit occurred, CMS determines whether the TIN or CCN and the NPI on the claim match a TIN-NPI or CCN-NPI combination in the CPC+ roster that was effective on the claim’s service date. If there is a match, the visit is associated with a CPC+ practice. Otherwise, the visit is associated with a non-CPC+ practice.
Non-CPC+ practices are defined as individual practitioners using single TIN-NPI or CCN-NPI combinations (because of lack of information regarding how they are grouped as actual practices), or practice sites who applied for CPC+ but were not selected for CPC+ (for whom we have information on practitioner groupings). Though each practice may have only one TIN or CCN at a given point in time, CMS maintains historical TINs and CCNs to associate claims with practices in the look back period to make accurate attributions. When CPC+ practitioners leave a practice, their NPIs remain on the CPC+ practitioner roster and are marked with a termination date. In this way, past visits to those practitioners during the look back period continue to be counted toward the practice.
The specialties of participating CPC+ practitioners are verified by CMS and are included in the specialty codes listed in Appendix B. The specialties of new CPC+ practitioners will be verified as they join CPC+ throughout the model. Specialty codes are verified using the practitioners’ NPIs and the primary and secondary taxonomy codes in the most current National Plan and Provider Enumeration System (NPPES) file, which CMS updates monthly.
2.4 Attribution Methodology
Once CMS has determined all eligible beneficiaries and all eligible primary care visits with CPC+ (and, as applicable, non-CPC+) practices, the CPC+ attribution algorithm is then applied. Beginning in 2018 Q1, there will be three major steps in the attribution algorithm:
1. Attribute beneficiaries to practices based on CCM-related billings. 2. Attribute remaining beneficiaries to practices based on Annual Wellness Visits or
Welcome to Medicare Visits. 3. Attribute all remaining beneficiaries to practices on the basis of the plurality of eligible
primary care visits.
8 There is no specialty code restriction on CCM services. Note that only claims with CCM codes on them are
eligible for practitioners who do not have one of the primary care specialties listed in Appendix B.
Page 22 of 112
2.4.1 Attribution Based on CCM-Related Billings
If the most recent eligible primary care visit in the look back period is for CCM-related services (CPT codes 99358, 99484, 99487, 99490, G0506, and G0507), CMS attributes the beneficiary to the CPC+ practice or non-CPC+ practitioner who provided the CCM-related service. If a beneficiary has CCM-related visits to both a CPC+ practice and one or more non-CPC+ practitioners on the most recent visit date, CMS attributes the beneficiary to the CPC+ practice. If there are multiple CPC+ practice ties or multiple non-CPC+ practitioner ties for the most recent CCM-related visits CMS proceeds to Step 2 of the attribution. Because CMS has determined that the CPC+ CMF and the CCM are duplicative services, it is important to note again that for a CPC+ practice’s attributed beneficiaries in a given quarter, CPC+ practices cannot bill for CCM-related services for their CPC+ attributed beneficiaries (again, see Chapter 3 for details). CPC+ practices are free to bill CCM-related services for any non-attributed beneficiary, which may result in future attribution to the CPC+ practice.
If the most recent eligible primary care visit was not for CCM-related services, CMS proceeds to Step 2 of the attribution.
2.4.2 Attribution Based on Annual Wellness Visits or Welcome to Medicare Visits
For remaining beneficiaries that are not attributed on the basis of CCM-related services, if there were Annual Wellness Visits (G0438, G0439) or Welcome to Medicare Visits (G0402) in the look back period, CMS attributes the beneficiary to the CPC+ practice or non-CPC+ practitioner who provided the most recent Annual Wellness or Welcome to Medicare Visit. If a beneficiary has Annual Wellness Visits or Welcome to Medicare Visits to both a CPC+ practice and one or more non-CPC+ practitioners on the most recent visit date, CMS attributes the beneficiary to the CPC+ practice.
If there are multiple CPC+ practice ties or multiple non-CPC+ practitioner ties for the most recent Annual Wellness or Welcome to Medicare Visit, or if there are no eligible Annual Wellness or Welcome to Medicare Visits during the look back period, CMS proceeds to Step 3 of the attribution.
2.4.3 Attribution Based on Plurality
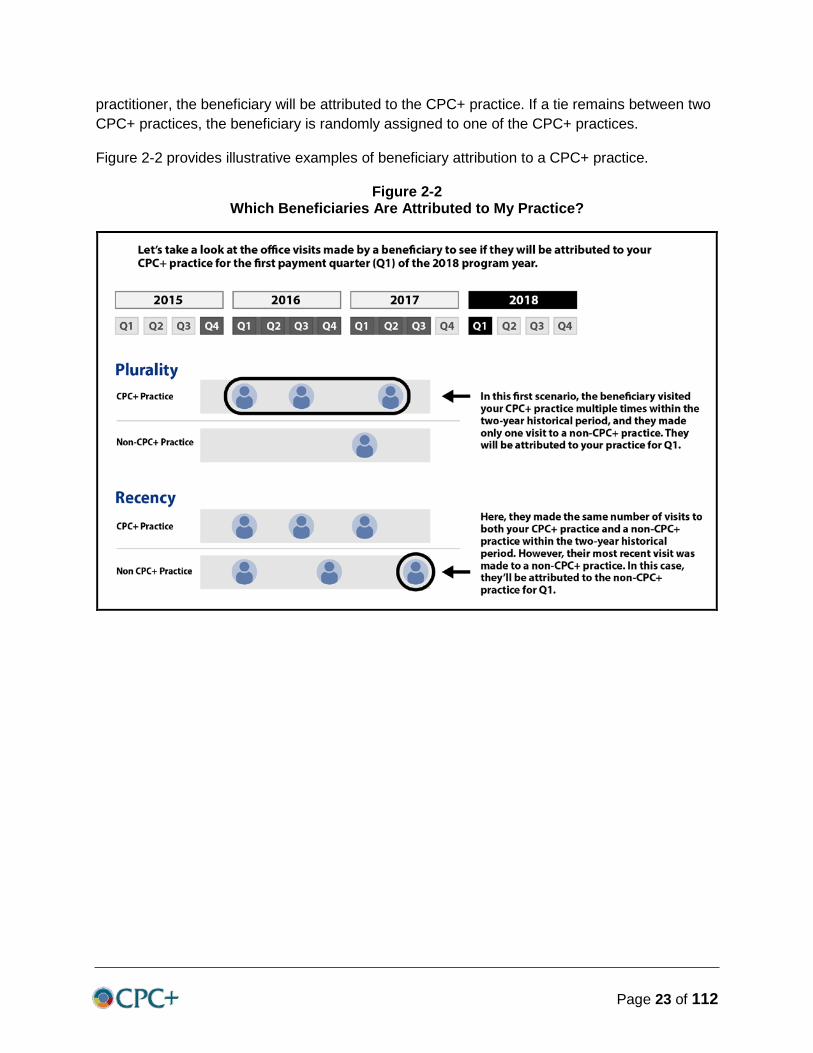
If a beneficiary is not attributed in Step 1 or Step 2, CMS first counts the number of eligible primary care visits the beneficiary had with each individual practitioner. CMS then combines eligible primary care visits to individual practitioners (i.e., TIN/NPI and CCN/NPI combinations) into CPC+ practices by using the most current CPC+ practitioner roster. For example, two practitioners working in a CPC+ practice will have their eligible primary care visits aggregated for the purposes of attribution. Finally, CMS attributes the beneficiary to the CPC+ practice or non-CPC+ practitioner who provided the plurality of eligible primary care visits during the look back period. If a beneficiary has an equal number of eligible primary care visits to more than one CPC+ practice or non-CPC+ practitioner, the beneficiary will be attributed to the practice with the most recent visit. If a tie remains between a CPC+ practice and a non-CPC+
Page 23 of 112
practitioner, the beneficiary will be attributed to the CPC+ practice. If a tie remains between two CPC+ practices, the beneficiary is randomly assigned to one of the CPC+ practices.
Figure 2-2 provides illustrative examples of beneficiary attribution to a CPC+ practice.
Figure 2-2 Which Beneficiaries Are Attributed to My Practice?

Page 24 of 112
[This page was intentionally left blank.]

Page 25 of 112
Chapter 3: Care Management Fee Chapter 3 documents the methodology used to calculate the CMF in CPC+. The CMF is intended to support augmented staffing and training related to non-visit-based and historically non-billable services that align with the CPC+ care delivery transformation aims. These include activities to improve care coordination, implement data-driven quality improvement, and enhance targeted support to patients identified as high risk. Section 3.1 describes risk scores and risk tiers; Section 3.2, details assigning risk score tiers; Section 3.3, explains retrospective debits; and Section 3.4, addresses risk score growth.
3.1 Risk Scores and Risk Tiers
All Medicare FFS beneficiaries attributed to a CPC+ practice will be assigned to one of four risk tiers for Track 1 or one of five risk tiers for Track 2 for that CPC+ practice’s region. Each risk tier corresponds to a specific monthly CMF payment. Higher risk tiers are associated with higher beneficiary risk and higher CMFs. Beneficiary risk will generally be determined by the CMS Hierarchical Condition Categories (HCC) risk adjustment model. For Track 2 beneficiaries, risk tier will also be determined by a diagnosis of dementia, as described in more detail below.
Risk scores for attributed beneficiaries will be compared to the distribution of risk scores for all FFS beneficiaries in the same region who meet CPC+ eligibility requirements and who have had an eligible primary care visit. This group of beneficiaries is called the CMF reference population. Beneficiaries will be assigned to risk tiers on the basis of where their risk score falls within the regional distribution, as shown in Table 3-1.
Table 3-1 Risk Tier Criteria and CMF Payments (per Beneficiary per Month)
Risk Tier Risk Score Criteria Track 1 Track 2 Tier 1 Risk score < 25th percentile $6 $9 Tier 2 25th percentile ≤ risk score < 50th percentile $8 $11 Tier 3 50th percentile ≤ risk score < 75th percentile $16 $19 Tier 4 Track 1: Risk score ≥ 75th percentile
Track 2: 75th percentile ≤ risk score < 90th percentile
$30 $33
Tier 5 (Track 2 only)
Risk score ≥ 90th percentile or Dementia diagnosis
N/A $100
In the sections below, CMS provides detail on the CMS-HCC risk adjustment model, the determination of the region-specific CMF reference population, and the determination of the CMF amounts for each tier within each track. The retrospective reconciliation of the CMFs and the interaction between CMFs and CCM-related billings is also addressed.
Page 26 of 112
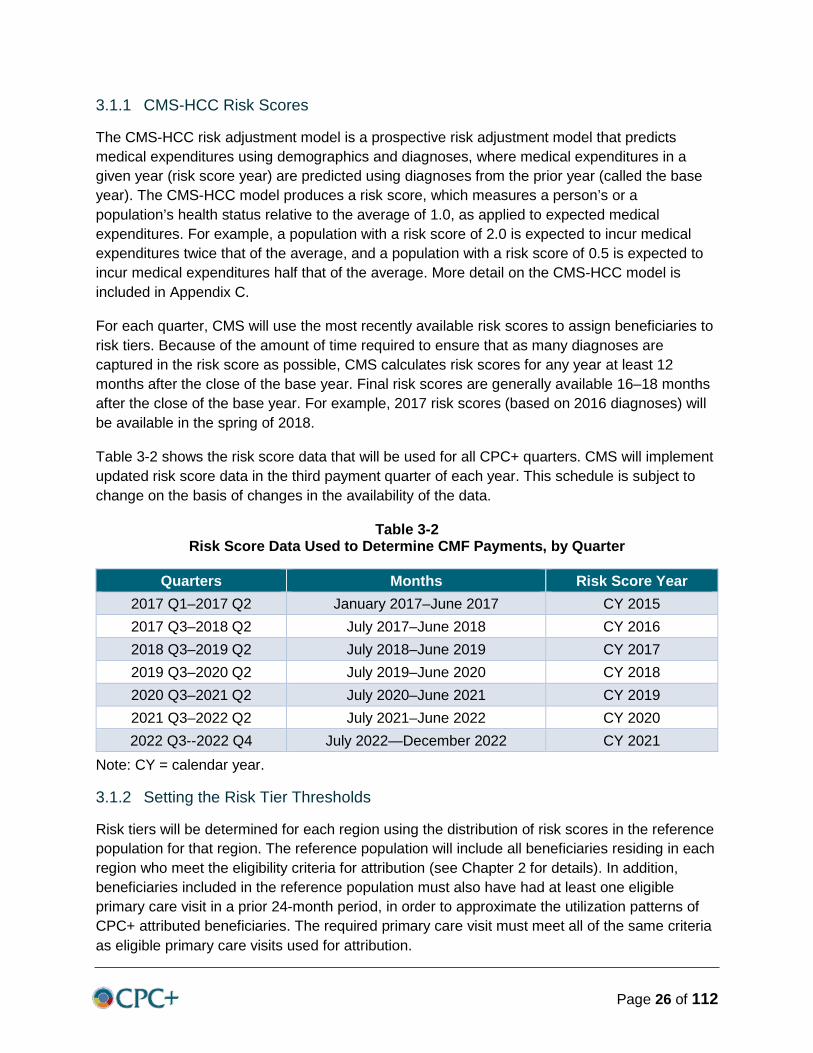
3.1.1 CMS-HCC Risk Scores
The CMS-HCC risk adjustment model is a prospective risk adjustment model that predicts medical expenditures using demographics and diagnoses, where medical expenditures in a given year (risk score year) are predicted using diagnoses from the prior year (called the base year). The CMS-HCC model produces a risk score, which measures a person’s or a population’s health status relative to the average of 1.0, as applied to expected medical expenditures. For example, a population with a risk score of 2.0 is expected to incur medical expenditures twice that of the average, and a population with a risk score of 0.5 is expected to incur medical expenditures half that of the average. More detail on the CMS-HCC model is included in Appendix C.
For each quarter, CMS will use the most recently available risk scores to assign beneficiaries to risk tiers. Because of the amount of time required to ensure that as many diagnoses are captured in the risk score as possible, CMS calculates risk scores for any year at least 12 months after the close of the base year. Final risk scores are generally available 16–18 months after the close of the base year. For example, 2017 risk scores (based on 2016 diagnoses) will be available in the spring of 2018.
Table 3-2 shows the risk score data that will be used for all CPC+ quarters. CMS will implement updated risk score data in the third payment quarter of each year. This schedule is subject to change on the basis of changes in the availability of the data.
Table 3-2 Risk Score Data Used to Determine CMF Payments, by Quarter
Quarters Months Risk Score Year 2017 Q1–2017 Q2 January 2017–June 2017 CY 2015 2017 Q3–2018 Q2 July 2017–June 2018 CY 2016 2018 Q3–2019 Q2 July 2018–June 2019 CY 2017 2019 Q3–2020 Q2 July 2019–June 2020 CY 2018 2020 Q3–2021 Q2 July 2020–June 2021 CY 2019 2021 Q3–2022 Q2 July 2021–June 2022 CY 2020 2022 Q3--2022 Q4 July 2022—December 2022 CY 2021
Note: CY = calendar year.
3.1.2 Setting the Risk Tier Thresholds
Risk tiers will be determined for each region using the distribution of risk scores in the reference population for that region. The reference population will include all beneficiaries residing in each region who meet the eligibility criteria for attribution (see Chapter 2 for details). In addition, beneficiaries included in the reference population must also have had at least one eligible primary care visit in a prior 24-month period, in order to approximate the utilization patterns of CPC+ attributed beneficiaries. The required primary care visit must meet all of the same criteria as eligible primary care visits used for attribution.
Page 27 of 112
The reference population will be defined using parameters for a Q3 (July–September) attribution. For example, beneficiaries included in the reference population used for 2018 Q3 through 2019 Q2 must (1) meet eligibility criteria on June 1, 2018, and (2) must have had an eligible primary care visit in the look back period used for 2018 Q3 attribution, April 2016–March 2018. We use Q3 because it is a mid-year capture of the “average” population, as risk scores tend to decrease over the calendar year, and risk scores are typically released around this time.
Once CMS has determined the reference population for each region, their risk scores will be used to determine the risk tier thresholds. CMS will use risk scores based on the CMS-HCC community risk adjustment model, as opposed to the CMS-HCC long-term institutional model, on the premise that CPC+ eligibility criteria for attribution exclude beneficiaries who are long-term institutionalized (e.g., long-term residing in a nursing home). For community-residing beneficiaries new to Medicare, CMS will use the new enrollee risk adjustment model, which is a demographic-only risk adjustment model. Because beneficiaries new to Medicare during the risk score year will not have had a complete diagnostic profile in the base year, the diagnosis-based CMS-HCC risk adjustment model cannot be used for these beneficiaries.
CMS will sort the risk scores and identify the 25th, 50th, 75th, and 90th percentiles in each region. These values are the thresholds that will be used until the next risk score update, and we will release them to practices annually. The initial risk tier thresholds are listed in Appendix D.
3.2 Assigning Risk Tiers
Most beneficiaries will be assigned to a risk tier on the basis of their risk score. Beneficiaries attributed to practices in Track 2 who are determined to have a diagnosis of dementia will be assigned to Tier 5 regardless of their risk score, as described below.
3.2.1 Assigning Risk Tiers 1–5 Based on Risk Score
Each quarter, CMS will use risk scores for all beneficiaries attributed to a CPC+ practice to assign beneficiaries to risk tiers. Beneficiaries, including those who are eligible for both Medicare and Medicaid (i.e., dual eligible), will be assigned to a risk tier based on the thresholds that apply for that quarter and the criteria shown in Table 3-1. There are two exceptions to this process, as described below.
First, because of the inherent lag in the calculation and availability of risk score data, beneficiaries who have newly joined Medicare after the risk score year will not have a risk score in the most recent risk score file. Such beneficiaries will be placed into Tier 1.
Second, beneficiaries attributed to a Track 1 practice who have developed ESRD since their initial attribution to a CPC+ practice will be placed into Track 1, Tier 4. Beneficiaries attributed to a Track 2 practice who have developed ESRD since their initial attribution to a CPC+ practice will be placed into Track 2, Tier 4, unless their risk score is higher than the Tier 5 lower bound, in which case they will be placed into Track 2, Tier 5. This is to account for the higher level of

Page 28 of 112
support and coordination ESRD patients require. Beneficiaries with an ESRD diagnosis prior to attribution to CPC+ are ineligible for attribution.
3.2.2 Assigning Risk Tier 5 Based on Dementia Diagnosis (Track 2 Only)
The criteria for Risk Tier 5 (Track 2 only) include having a risk score at or above the 90th percentile of risk scores in the CMF reference population or having a diagnosis of dementia or related disorder. Dementia diagnoses will be determined using information from CMS’s Chronic Condition Warehouse (CCW).9
CMS will assign beneficiaries to Tier 5 if the most recent information from the CCW reflects a dementia flag. The CCW updates chronic condition information annually and generates flags representing presence of certain chronic conditions as of December 31 of each year. The CCW uses a three-year historical period to determine the presence of dementia. For example, to determine the 2017 dementia flag, claims during the three-year period (January 2015–December 2017) will be used. The criterion for dementia is the presence of any International Classification of Diseases (ICD)-9 diagnosis code (prior to October 1, 2015) or ICD-10 diagnosis code (on or after October 1, 2015) in the list below on at least one inpatient, skilled nursing facility, outpatient, home health, or carrier claim in the three-year period.
• ICD-9 diagnoses indicating the presence of Alzheimer’s disease and related disorders or senile dementia: 331.0, 331.11, 331.19, 331.2, 331.7, 290.0, 290.10, 290.11, 290.12, 290.13, 290.20, 290.21, 290.3, 290.40, 290.41, 290.42, 290.43, 294.0, 294.10, 294.11, 294.20, 294.21, 294.8, 797
• ICD-10 diagnoses indicating the presence of Alzheimer’s disease and related disorders or senile dementia: DX F01.50, F01.51, F02.80, F02.81, F03.90, F03.91, F04, G13.2, G13.8, F05, F06.1, F06.8, G30.0, G30.1, G30.8, G30.9, G31.1, G31.2, G31.01, G31.09, G91.4, G94, R41.81, R54
CMS will use the most recent CCW information available each quarter to determine whether beneficiaries attributed to a Track 2 practice have a diagnosis of dementia. For 2018 Q1, the most recently available CCW data used to identify diagnosis of dementia is from December 31, 2016. Assignments to Tier 5 on the basis of a dementia diagnosis will be based on claims data from January 2014–December 2016. CMS will update the 2017 CCW data for diagnosis of dementia as soon as they become available.
Track 2 beneficiaries with ESRD who also have a dementia diagnosis will be placed into Tier 5 rather than Tier 4. For beneficiaries who are in Track 2, the dementia diagnosis supersedes the ESRD diagnosis.
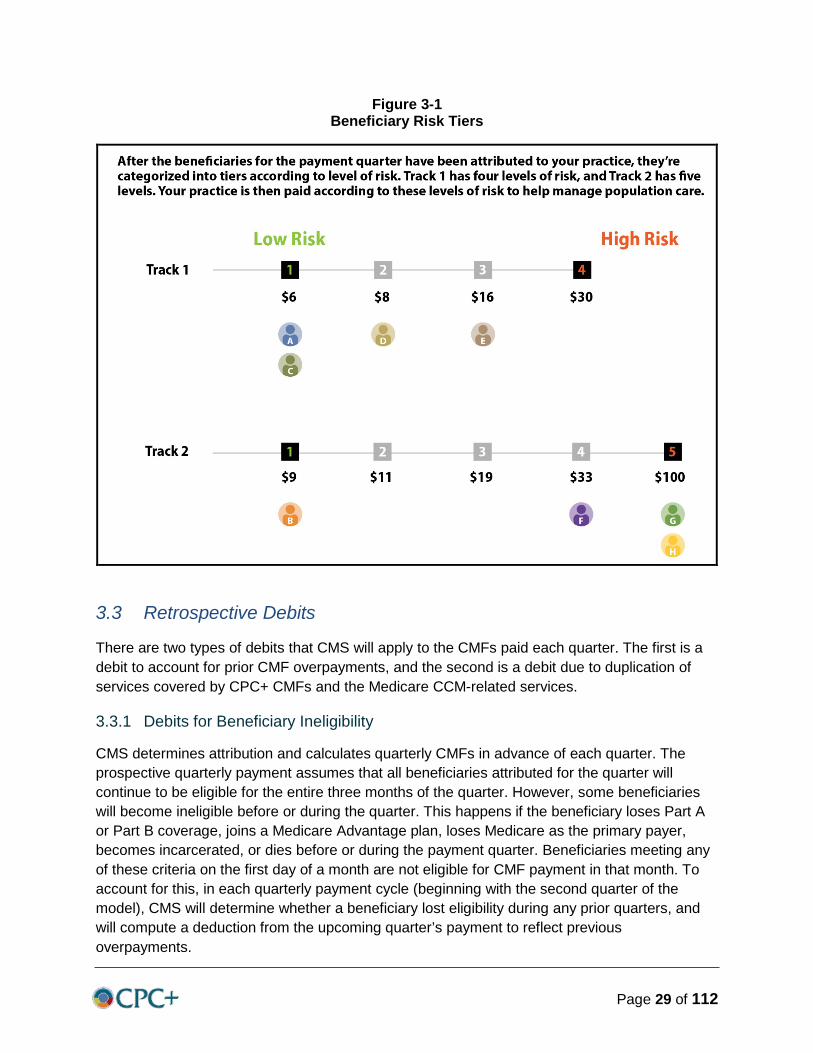
Figure 3-1 provides an illustrative example of beneficiary risk tiers for the CMF.
9 https://www.ccwdata.org/documents/10280/19022436/codebook-mbsf-cc.pdf
Page 29 of 112
Figure 3-1 Beneficiary Risk Tiers
3.3 Retrospective Debits
There are two types of debits that CMS will apply to the CMFs paid each quarter. The first is a debit to account for prior CMF overpayments, and the second is a debit due to duplication of services covered by CPC+ CMFs and the Medicare CCM-related services.
3.3.1 Debits for Beneficiary Ineligibility
CMS determines attribution and calculates quarterly CMFs in advance of each quarter. The prospective quarterly payment assumes that all beneficiaries attributed for the quarter will continue to be eligible for the entire three months of the quarter. However, some beneficiaries will become ineligible before or during the quarter. This happens if the beneficiary loses Part A or Part B coverage, joins a Medicare Advantage plan, loses Medicare as the primary payer, becomes incarcerated, or dies before or during the payment quarter. Beneficiaries meeting any of these criteria on the first day of a month are not eligible for CMF payment in that month. To account for this, in each quarterly payment cycle (beginning with the second quarter of the model), CMS will determine whether a beneficiary lost eligibility during any prior quarters, and will compute a deduction from the upcoming quarter’s payment to reflect previous overpayments.
Page 30 of 112
3.3.2 Debits for Duplication of Services
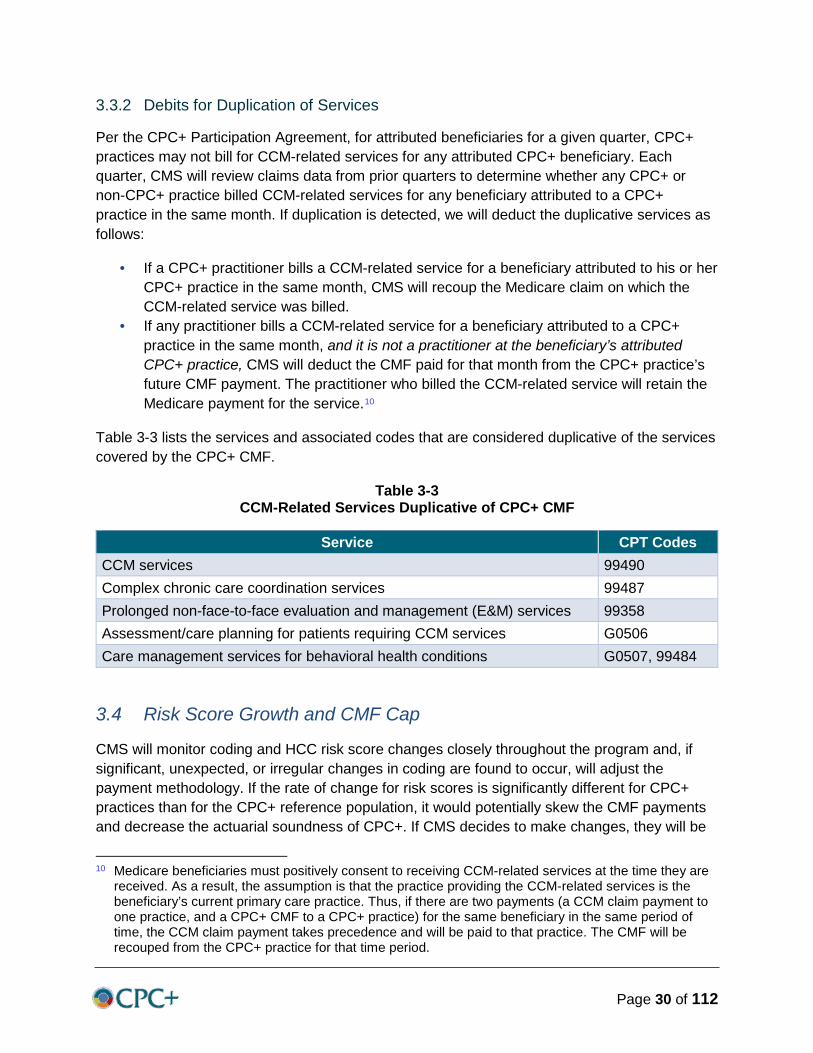
Per the CPC+ Participation Agreement, for attributed beneficiaries for a given quarter, CPC+ practices may not bill for CCM-related services for any attributed CPC+ beneficiary. Each quarter, CMS will review claims data from prior quarters to determine whether any CPC+ or non-CPC+ practice billed CCM-related services for any beneficiary attributed to a CPC+ practice in the same month. If duplication is detected, we will deduct the duplicative services as follows:
• If a CPC+ practitioner bills a CCM-related service for a beneficiary attributed to his or her CPC+ practice in the same month, CMS will recoup the Medicare claim on which the CCM-related service was billed.
• If any practitioner bills a CCM-related service for a beneficiary attributed to a CPC+ practice in the same month, and it is not a practitioner at the beneficiary’s attributed CPC+ practice, CMS will deduct the CMF paid for that month from the CPC+ practice’s future CMF payment. The practitioner who billed the CCM-related service will retain the Medicare payment for the service.10
Table 3-3 lists the services and associated codes that are considered duplicative of the services covered by the CPC+ CMF.
Table 3-3 CCM-Related Services Duplicative of CPC+ CMF
Service CPT Codes CCM services 99490 Complex chronic care coordination services 99487 Prolonged non-face-to-face evaluation and management (E&M) services 99358 Assessment/care planning for patients requiring CCM services G0506 Care management services for behavioral health conditions G0507, 99484
3.4 Risk Score Growth and CMF Cap
CMS will monitor coding and HCC risk score changes closely throughout the program and, if significant, unexpected, or irregular changes in coding are found to occur, will adjust the payment methodology. If the rate of change for risk scores is significantly different for CPC+ practices than for the CPC+ reference population, it would potentially skew the CMF payments and decrease the actuarial soundness of CPC+. If CMS decides to make changes, they will be
10 Medicare beneficiaries must positively consent to receiving CCM-related services at the time they are
received. As a result, the assumption is that the practice providing the CCM-related services is the beneficiary’s current primary care practice. Thus, if there are two payments (a CCM claim payment to one practice, and a CPC+ CMF to a CPC+ practice) for the same beneficiary in the same period of time, the CCM claim payment takes precedence and will be paid to that practice. The CMF will be recouped from the CPC+ practice for that time period.
Page 31 of 112
specified prior to the payment quarter in which they are implemented. Examples of how CMS might address high risk score growth, based on experiences in other Medicare programs, include the following:
• Apply a coding pattern adjustment factor to each beneficiary’s risk score, as in the Medicare Advantage program.
• Cap the risk score growth rate by which each practice’s risk score is allowed to change, as in the Next Generation ACO model.
• Use diagnosis-based risk adjustment for updating newly attributed beneficiaries’ risk scores and demographic-based risk adjustment for updating continuously attributed beneficiaries’ risk scores, as in the Shared Savings Program.

Page 32 of 112
[This page was intentionally left blank.]
Page 33 of 112
Chapter 4: Performance-Based Incentive Payment This section describes the CMS approach and technical methodology for the performance-based incentive payment (PBIP) in CPC+ for Program Year 2018. To encourage and reward accountability for patient experience of care, clinical quality, and utilization measures that drive total cost of care, practices will receive a prospective incentive payment annually, and they will be allowed to retain a portion or all of these funds if they meet annual performance targets. Practices will thus be “at risk” for the amounts prepaid, and CMS will recoup unearned payments. The rest of this chapter provides basic information on the PBIP. Section 4.1 describes the design principles and general features, Section 4.2 describes the Quality Component of the PBIP, Section 4.3 describes the Utilization Component of the PBIP, Section 4.4 describes the performance standards, Section 4.5 describes benchmark thresholds for Program Year 2018, and Section 4.6 provides an illustrative example of PBIP calculation.
4.1 Design Principles and General Features
This section describes the rationale for the PBIP; overarching principles of design; and general criteria for practice performance scoring, which determines the amount of the PBIP that practices are eligible to retain.
4.1.1 Principles of Design
The incentive structure is designed to keep practices motivated and working towards improving quality of care and patient experience of care, and reducing unnecessary beneficiary utilization that drives a higher total cost of care. The design principles underpinning the incentive structure were informed by current behavioral economics theory and existing evidence from PBIP programs (Audit and Zenna, 2015; Khuller et al., 2015). The incentive structure employs the following design principles and general features:
• Timing of incentive payments encourages immediate practice engagement. • Performance goals are transparent and known to practices early in the performance
period. • Practices are rewarded on a continuous scale and for absolute performance
thresholds. • Practices must meet minimum quality thresholds before they are rewarded for reducing
utilization. • Performance goals are closely related to primary care practice and measured at the
practice level.
Provisions for Practices in ACOs and the Quality Payment Program—Primary care practices that are also participating in Shared Savings Program ACOs will not receive the PBIP. Instead, these practices will participate in the ACOs’ shared savings/shared losses arrangement. CPC+ practices that are also in ACOs must report Electronic Clinical Quality Measures (eCQMs) as part of their participation in CPC+. In addition, CPC+ practice patients
Page 34 of 112
will be sampled to fulfill the patient experience of care Consumer Assessment of Healthcare Providers and Systems (CAHPS) survey.11 CPC+ practices are required to provide an all patient roster, regardless of insurance type, to CMS when requested. CPC+ Practices that fail to provide a patient roster will not receive a CAHPS score and will not qualify to retain the Quality Component or the Utilization Component of the PBIP. Additional actions up to and including withholding CPC+ payments and/or termination of the CPC+ practice’s Participation Agreement may also be considered as consequences of failure to submit a patient roster.
Under the Quality Payment Program Final Rule, for a model to be considered an APM, a certain amount of model revenue must be considered “at risk.” The PBIP qualifies CPC+ as an advanced APM. For CPC+ practices also participating in the Shared Savings Program, determinations about the advanced APM incentive will be based on the track of the Shared Savings Program in which they participate.
4.1.2 Prospective Payment
At the beginning of each Program Year, practices will receive the full amount of incentive payment that they are eligible to earn over the Program Year. After the close of each Program Year, the incentive amount earned based on performance will be calculated, and CMS will recoup the unearned portion, if necessary. As a result, practices will know at the beginning of the year the maximum amount they may keep for that Program Year.
CMS is testing whether prospective incentive payment is an effective way to ensure reward timeliness and fully leverage loss aversion in a manner that engages practices immediately in CPC+ objectives (Audit and Zenna, 2015).
CMS expects that prospective payment will support practice planning and budgeting, especially for small practices. Prospective payment has the added advantage of giving practices enough information early in the Program Year to help them create an internal bonus structure for delivering incentives to individual clinicians (Chung et al., 2010). Incentives at the individual clinician level are expected to have a significant impact on practice-level performance (Petersen et al., 2013). Internal bonus structures, if set up early, may increase the chances that individual clinicians will engage in behavior changes quickly and improve practices’ overall performance.
Incentive Payment Use—The PBIP amount is meant to exceed the cost of implementation of the desired behaviors and should be treated as a bonus to the practice. Unlike the CMF, CMS places no restrictions on the use of the PBIP. Practices may decide, for example, to invest a portion of the PBIP in support of CPC+ objectives or to implement an internal bonus structure. It is important to note that the practice is contractually “at risk” for returning up to the full amount, in the event that the practice does not meet the minimum performance goals. In light of the risk they will carry, practices may decide to retain some or all of the PBIP until the payment reconciliation.
11 CMS will work to minimize potential survey burden.
Page 35 of 112
4.1.3 Transparency of Performance Goals
The CPC+ incentive structure and payment are intended to support full transparency of performance goals. The objective is to provide enough information early in the Program Year so that practices understand how their effort will be rewarded and can maximize their chances of retaining the full PBIP.
CMS will publish performance thresholds early in each Program Year. These thresholds will represent the following:
• Minimum thresholds practices must reach to receive any (non-zero) PBIP, and • Maximum thresholds practices must attain to receive 100% of the PBIP.
4.1.4 Incentive Structure
Incentives for practices are designed with three important features. First, all high performers will be rewarded. Practice performance is measured against absolute performance thresholds. The minimum and maximum thresholds are determined from a reference population external to CPC+ participation. In turn, a practice’s own performance relative to these thresholds determines the incentive amount the practice retains. Practices are not scored on a relative-performance basis, and the amount of payment each practice retains is not determined by performance of its peers.
Second, minimum and maximum performance goals are established using absolute thresholds that are the same for all practices. The performance goals are the same for both tracks and for 2017 starters and 2018 starters. In Program Year 2018, the minimum threshold is set to the 30th percentile of performance in the reference population for clinical quality and patient experience of care, and to the 50th percentile of performance in the reference population for utilization. Practices are not eligible to retain any of the PBIP for the relevant measure if their performance score on an individual measure falls below this minimum threshold. This requirement ensures that practices are not rewarded for poor performance and encourages practices to place the highest priority on measures with very low scores to bring them above the minimum threshold.
The maximum threshold is set to the 70th percentile of performance on the measure in the reference population for clinical quality and patient experience of care, and the 80th percentile of performance in the reference population for utilization. Generally, practices will retain the full PBIP for the relevant individual measure if they are eligible for the incentive and attain the maximum threshold. Drawing from simulation analyses using data from Program Year 2016 of CPC Classic suggest that a minimum performance score of 30th–50th percentile and a maximum threshold in the 70th–90th percentile would be both motivational and achievable. The intent of the external benchmarks is to reward practices for reporting challenging measures, even when actual measure performance has opportunity for improvement. Throughout CPC+, CMS will monitor practice performance, and in future Program Years, CMS may raise these thresholds. CMS will communicate any changes to performance thresholds to practices before the relevant Program Year. Practices that perform at high levels will still have an incentive to

Page 36 of 112
improve their scores well above the maximum threshold to better position their practice for the following year’s performance, in the event that the maximum threshold is raised. CMS also recognizes that certain measures may become “topped out.” Therefore, CMS reserves the right to convert to flat percentages on an individual measure (e.g., 50%, 80%) for purposes of measure scoring and PBIP calculations when that measure appears “topped out.”
Third, practices will be rewarded on a continuous scale when scoring between the 30th and 70th percentile thresholds for clinical quality and patient experience of care or between the 50th and 80th percentile thresholds for utilization. In general, practices are eligible to receive a percentage of the PBIP for this range of performance. The amount retained increases as performance approaches the maximum threshold. The methodology to calculate the proportion of PBIP retained for scores between the minimum and maximum threshold is described in more detail in Section 4.4.
4.1.5 Incentive Payment Components
Practices retained the PBIP based on two distinct components of performance: (1) clinical quality and patient experience of care and (2) utilization, as shown in Figure 4-1. These two components contribute equally to the PBIP amount retained. Performance on clinical quality and patient experience of care, however, is prioritized over utilization. Practices that meet performance goals for utilization must meet the minimum thresholds for at least six of the 10 quality measures (i.e., quality measures refer to nine eCQMs that meet the reporting criteria and the one CAHPS Summary Score) to receive any PBIP for the Utilization Component. Practices that reach the maximum performance goals for clinical quality and patient experience of care are eligible for the full Quality Component of the PBIP, equal to one-half of the total PBIP, whether or not they meet performance goals for the Utilization Component.
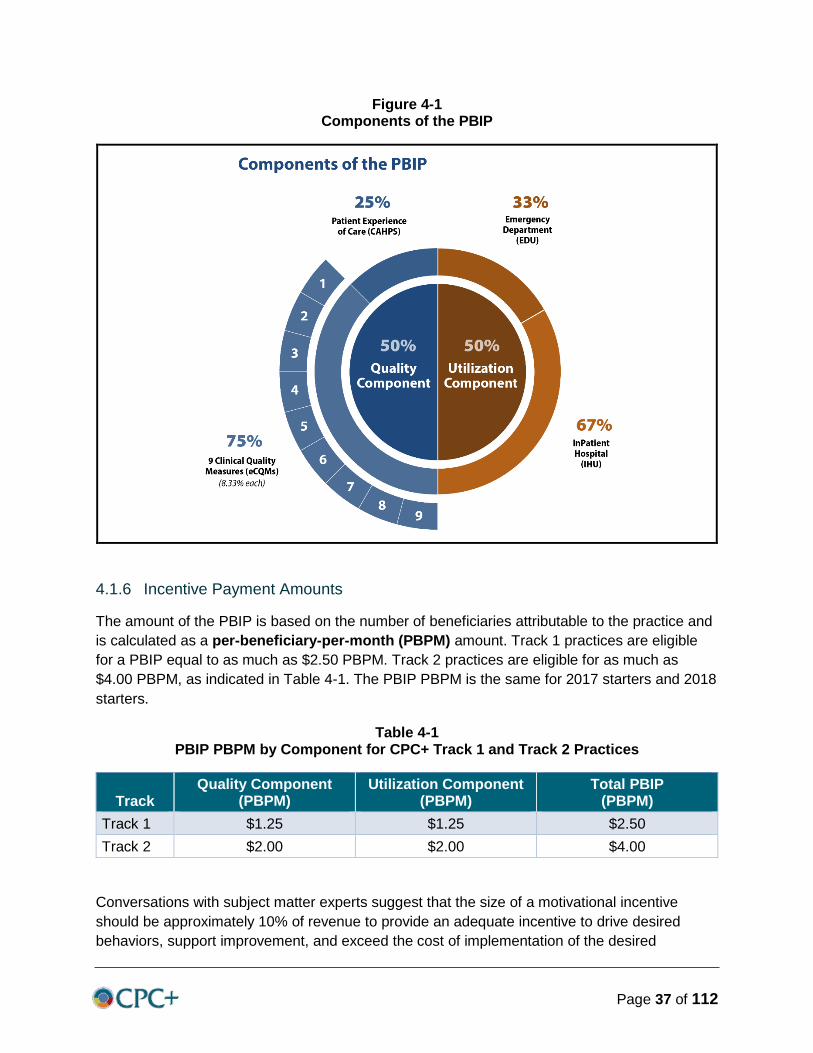
Page 37 of 112
Figure 4-1 Components of the PBIP
4.1.6 Incentive Payment Amounts
The amount of the PBIP is based on the number of beneficiaries attributable to the practice and is calculated as a per-beneficiary-per-month (PBPM) amount. Track 1 practices are eligible for a PBIP equal to as much as $2.50 PBPM. Track 2 practices are eligible for as much as $4.00 PBPM, as indicated in Table 4-1. The PBIP PBPM is the same for 2017 starters and 2018 starters.
Table 4-1 PBIP PBPM by Component for CPC+ Track 1 and Track 2 Practices
Track Quality Component
(PBPM) Utilization Component
(PBPM) Total PBIP
(PBPM) Track 1 $1.25 $1.25 $2.50 Track 2 $2.00 $2.00 $4.00
Conversations with subject matter experts suggest that the size of a motivational incentive should be approximately 10% of revenue to provide an adequate incentive to drive desired behaviors, support improvement, and exceed the cost of implementation of the desired
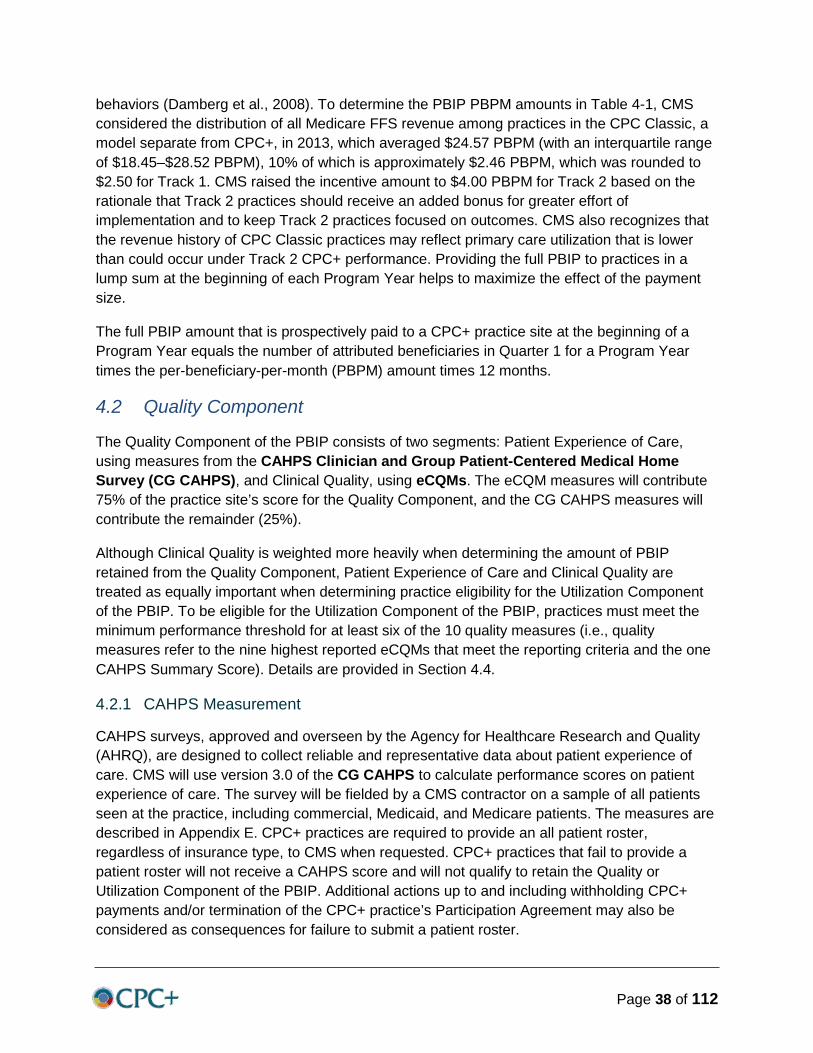
Page 38 of 112
behaviors (Damberg et al., 2008). To determine the PBIP PBPM amounts in Table 4-1, CMS considered the distribution of all Medicare FFS revenue among practices in the CPC Classic, a model separate from CPC+, in 2013, which averaged $24.57 PBPM (with an interquartile range of $18.45–$28.52 PBPM), 10% of which is approximately $2.46 PBPM, which was rounded to $2.50 for Track 1. CMS raised the incentive amount to $4.00 PBPM for Track 2 based on the rationale that Track 2 practices should receive an added bonus for greater effort of implementation and to keep Track 2 practices focused on outcomes. CMS also recognizes that the revenue history of CPC Classic practices may reflect primary care utilization that is lower than could occur under Track 2 CPC+ performance. Providing the full PBIP to practices in a lump sum at the beginning of each Program Year helps to maximize the effect of the payment size.
The full PBIP amount that is prospectively paid to a CPC+ practice site at the beginning of a Program Year equals the number of attributed beneficiaries in Quarter 1 for a Program Year times the per-beneficiary-per-month (PBPM) amount times 12 months.
4.2 Quality Component
The Quality Component of the PBIP consists of two segments: Patient Experience of Care, using measures from the CAHPS Clinician and Group Patient-Centered Medical Home Survey (CG CAHPS), and Clinical Quality, using eCQMs. The eCQM measures will contribute 75% of the practice site’s score for the Quality Component, and the CG CAHPS measures will contribute the remainder (25%).
Although Clinical Quality is weighted more heavily when determining the amount of PBIP retained from the Quality Component, Patient Experience of Care and Clinical Quality are treated as equally important when determining practice eligibility for the Utilization Component of the PBIP. To be eligible for the Utilization Component of the PBIP, practices must meet the minimum performance threshold for at least six of the 10 quality measures (i.e., quality measures refer to the nine highest reported eCQMs that meet the reporting criteria and the one CAHPS Summary Score). Details are provided in Section 4.4.
4.2.1 CAHPS Measurement
CAHPS surveys, approved and overseen by the Agency for Healthcare Research and Quality (AHRQ), are designed to collect reliable and representative data about patient experience of care. CMS will use version 3.0 of the CG CAHPS to calculate performance scores on patient experience of care. The survey will be fielded by a CMS contractor on a sample of all patients seen at the practice, including commercial, Medicaid, and Medicare patients. The measures are described in Appendix E. CPC+ practices are required to provide an all patient roster, regardless of insurance type, to CMS when requested. CPC+ practices that fail to provide a patient roster will not receive a CAHPS score and will not qualify to retain the Quality or Utilization Component of the PBIP. Additional actions up to and including withholding CPC+ payments and/or termination of the CPC+ practice’s Participation Agreement may also be considered as consequences for failure to submit a patient roster.
Page 39 of 112
4.2.2 eCQM Measurement
Achieving high performance in clinical quality is a central objective in CPC+. In Program Year 2018, CPC+ practice sites are required to successfully report a minimum of nine eCQMs from a selection of 19 eCQMs included in the CPC+ measurement set. The nine measures a practice site chooses to submit must align with the reporting criteria set forth in Appendix F. Practice sites must report both eCQM outcome measures and at least seven of the remaining 17 eCQM measures. These reporting criteria were established to provide practice sites a view of performance on an ongoing basis at the point of care. The measures target a primary care patient population and, where feasible, are outcome measures rather than process measures. As described in the eCQM reporting requirements,12 practices are strongly encouraged to report all CPC+ measures in their electronic health record (EHR) even though they are required to report only nine measures. This will allow practices to continue reporting nine required measures in the event that one or more eCQMs are removed from the CPC+ measure list in the future. Practice sites that fail to report at least nine eCQMs that meet reporting criteria will not qualify to retain the Quality Component or the Utilization Component of the PBIP.
For the purposes of determining the amount of PBIP retained for the Quality Component, practices will be eligible for payment on each individual eCQM measure, independent of the others. This approach is intended to reward practices for performance demonstrated in clinical quality for each measure, up to the maximum performance threshold of the 70th percentile. For each measure, the percentage retained is based on the amount that the performance exceeds the minimum threshold. A practice will not keep any amount for a given measure if their score is less than the 30th percentile, and a practice will keep half of the amount for a given measure if their score is equal to the 30th percentile. A practice will keep the full amount for a given measure if their score is greater than or equal to the 70th percentile. If a practice’s score is between the 30th and 70th percentiles, they will keep a percentage of the amount for a given measure; that percentage is calculated by converting the original range of scores to 50%-100%. The nine eCQM measures together represent 75% of the Quality Component or 37.5% of the full PBIP (0.75 x 0.5 = 0.375). Each eCQM is weighted equally so that each eCQM represents 8.33% of the PBIP for Quality (0.75/9 = 0.0833) or 4.167% of the full PBIP (0.375/9 = 0.04167). The amount then will be aggregated across each individual measure for which a practice is eligible to keep payment.
4.3 Utilization Component
The guiding principle for the selection of utilization measures for CPC+ is a parsimonious list of actionable measures that drive total cost of care. CMS also seeks measures that can be measured at the practice level for a Medicare FFS population and are validated for use. Based on the CPC Classic, CMS expects that a typical CPC+ practice will average four clinicians and 700 beneficiaries. Practices are required to have a minimum of 125 attributed Medicare beneficiaries to be eligible for CPC+. CMS is using two measures that meet these criteria: inpatient hospitalization utilization (IHU) per 1,000 attributed beneficiaries and emergency
12 CPC+ eCQM reporting requirements for 2018 Program Year can be found on CPC+ Connect.

Page 40 of 112
department utilization (EDU) per 1,000 attributed beneficiaries. These two measures are available in the National Committee for Quality Assurance (NCQA) Healthcare Effectiveness Data and Information Set (HEDIS). Hospitalizations are the largest driver of total cost of care, are actionable, and can be reliably measured at the practice level; therefore, they are suitable as a performance measure for primary care practice. Inpatient hospital services were identified as a major cost driver under the CPC Classic at more than 35% of total cost of care.13 Emergency department visits are also a larger driver of total cost of care than other outpatient health care utilization.
Utilization measures require no reporting on the part of practices and will be calculated by CMS and its contractor at the end of each Program Year. Inpatient utilization is given twice the weight of EDU in the calculation of the performance score because of the disproportionate cost of inpatient stays relative to emergency department outpatient visits. The EDU is limited to outpatient visits that do not result in hospital admission so that emergency department visits resulting in a hospitalization are not counted in both utilization measures. Utilization for each CPC+ practice will be calculated for Medicare beneficiaries, aged 65 or older, attributed to the practice. NCQA provided specifications to CMS to include risk adjustment for age, gender, and presence of co-morbid conditions. The NCQA Technical Specifications for these measures are reproduced in Appendix G.
Should additional utilization measures become available in future years, CMS reserves the right to add or substitute other measures.14 CMS will notify practices of any changes before the start of a Program Year. At this time, few utilization measures can be measured at the practice site level and are actionable for primary care.
4.4 Calculation of Performance Scores
To support incentive structure transparency, CMS aimed to design a scoring methodology that is uncomplicated and that uses benchmarks known to practices early in the Program Year. CMS sought to balance simplicity with motivating performance and improvement in the reward structure. To the extent feasible, CMS established uniform standards across all measures using a comparable scoring methodology to make performance objectives transparent at the beginning of practice participation. The methodology for calculating practice performance scores and determining PBIP amount retained is detailed as follows.
CMS adopted a modified pay for performance on each individual measure approach to retaining the PBIP. Under the simple pay-per-measure approach, each measure is worth a percentage of
13 For further information, please see the CPC Evaluation Reports at
https://innovation.cms.gov/initiatives/comprehensive-primary-care-initiative/. 14 Potential resources for new measures include measures in development for the Quality Payment
Program, measures of resource use in post-acute settings in development pursuant to the Improving Medicare Post-Acute Care Transformation (IMPACT) Act of 2014, and measures suggested by other entities that are considered to be actionable and primary care–focused. For some examples, see Yu, Mehrotra, and Adams (2013).
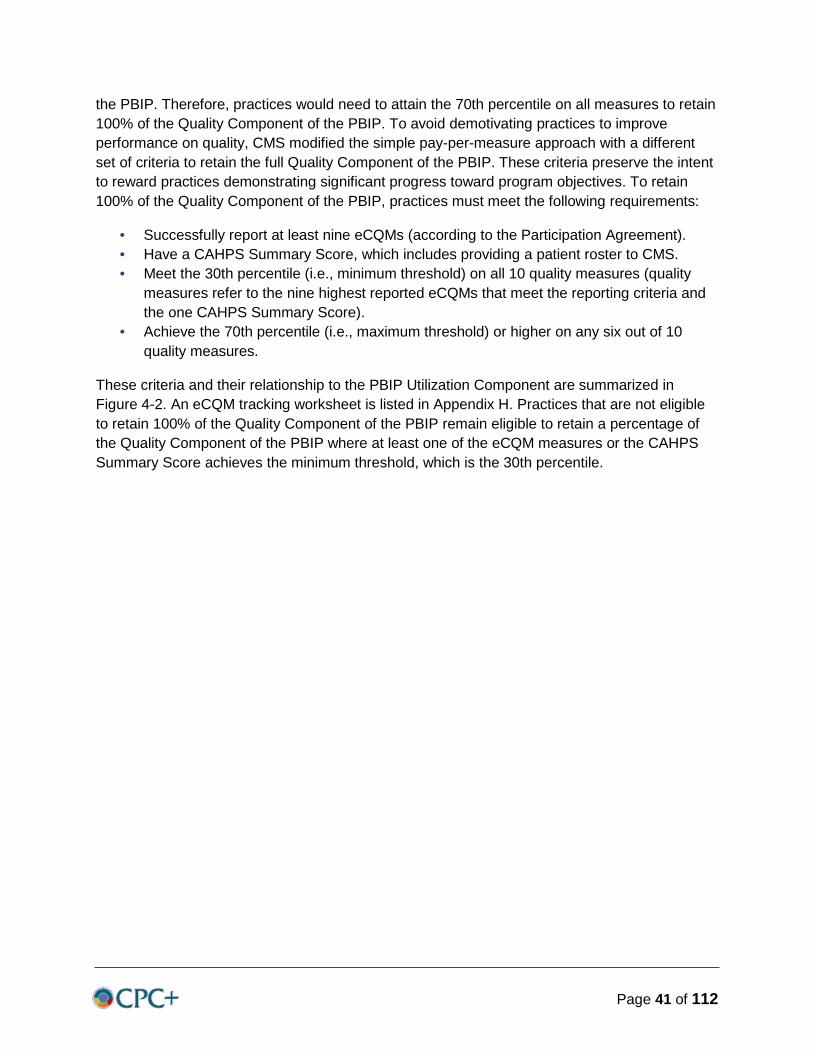
Page 41 of 112
the PBIP. Therefore, practices would need to attain the 70th percentile on all measures to retain 100% of the Quality Component of the PBIP. To avoid demotivating practices to improve performance on quality, CMS modified the simple pay-per-measure approach with a different set of criteria to retain the full Quality Component of the PBIP. These criteria preserve the intent to reward practices demonstrating significant progress toward program objectives. To retain 100% of the Quality Component of the PBIP, practices must meet the following requirements:
• Successfully report at least nine eCQMs (according to the Participation Agreement). • Have a CAHPS Summary Score, which includes providing a patient roster to CMS. • Meet the 30th percentile (i.e., minimum threshold) on all 10 quality measures (quality
measures refer to the nine highest reported eCQMs that meet the reporting criteria and the one CAHPS Summary Score).
• Achieve the 70th percentile (i.e., maximum threshold) or higher on any six out of 10 quality measures.
These criteria and their relationship to the PBIP Utilization Component are summarized in Figure 4-2. An eCQM tracking worksheet is listed in Appendix H. Practices that are not eligible to retain 100% of the Quality Component of the PBIP remain eligible to retain a percentage of the Quality Component of the PBIP where at least one of the eCQM measures or the CAHPS Summary Score achieves the minimum threshold, which is the 30th percentile.
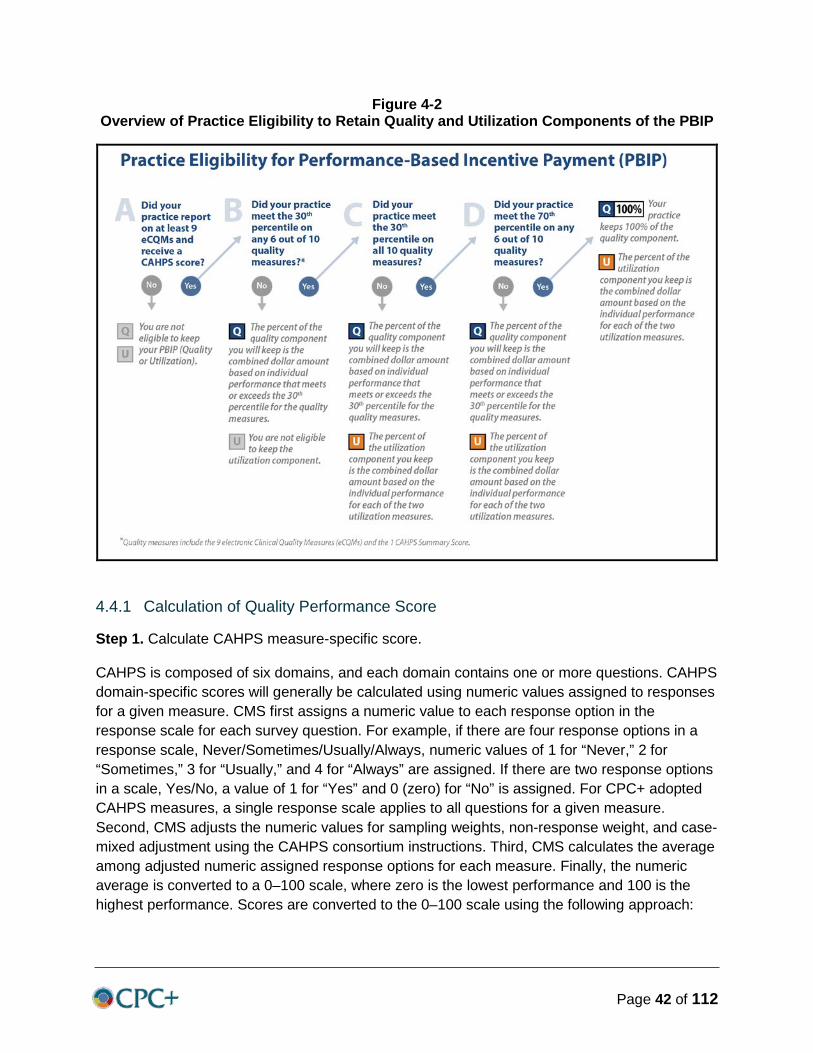
Page 42 of 112
Figure 4-2 Overview of Practice Eligibility to Retain Quality and Utilization Components of the PBIP
4.4.1 Calculation of Quality Performance Score
Step 1. Calculate CAHPS measure-specific score.
CAHPS is composed of six domains, and each domain contains one or more questions. CAHPS domain-specific scores will generally be calculated using numeric values assigned to responses for a given measure. CMS first assigns a numeric value to each response option in the response scale for each survey question. For example, if there are four response options in a response scale, Never/Sometimes/Usually/Always, numeric values of 1 for “Never,” 2 for “Sometimes,” 3 for “Usually,” and 4 for “Always” are assigned. If there are two response options in a scale, Yes/No, a value of 1 for “Yes” and 0 (zero) for “No” is assigned. For CPC+ adopted CAHPS measures, a single response scale applies to all questions for a given measure. Second, CMS adjusts the numeric values for sampling weights, non-response weight, and case-mixed adjustment using the CAHPS consortium instructions. Third, CMS calculates the average among adjusted numeric assigned response options for each measure. Finally, the numeric average is converted to a 0–100 scale, where zero is the lowest performance and 100 is the highest performance. Scores are converted to the 0–100 scale using the following approach:
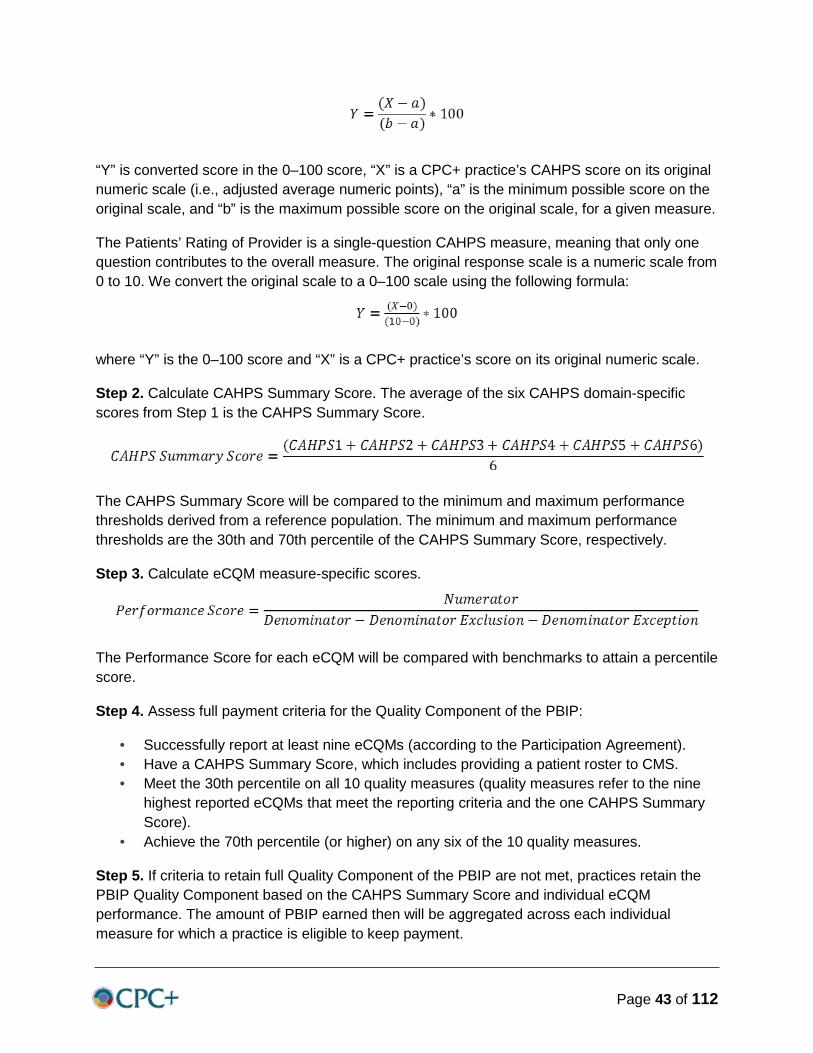
Page 43 of 112
“Y” is converted score in the 0–100 score, “X” is a CPC+ practice’s CAHPS score on its original numeric scale (i.e., adjusted average numeric points), “a” is the minimum possible score on the original scale, and “b” is the maximum possible score on the original scale, for a given measure.
The Patients’ Rating of Provider is a single-question CAHPS measure, meaning that only one question contributes to the overall measure. The original response scale is a numeric scale from 0 to 10. We convert the original scale to a 0–100 scale using the following formula:
where “Y” is the 0–100 score and “X” is a CPC+ practice’s score on its original numeric scale.
Step 2. Calculate CAHPS Summary Score. The average of the six CAHPS domain-specific scores from Step 1 is the CAHPS Summary Score.
The CAHPS Summary Score will be compared to the minimum and maximum performance thresholds derived from a reference population. The minimum and maximum performance thresholds are the 30th and 70th percentile of the CAHPS Summary Score, respectively.
Step 3. Calculate eCQM measure-specific scores.
The Performance Score for each eCQM will be compared with benchmarks to attain a percentile score.
Step 4. Assess full payment criteria for the Quality Component of the PBIP:
• Successfully report at least nine eCQMs (according to the Participation Agreement). • Have a CAHPS Summary Score, which includes providing a patient roster to CMS. • Meet the 30th percentile on all 10 quality measures (quality measures refer to the nine
highest reported eCQMs that meet the reporting criteria and the one CAHPS Summary Score).
• Achieve the 70th percentile (or higher) on any six of the 10 quality measures.
Step 5. If criteria to retain full Quality Component of the PBIP are not met, practices retain the PBIP Quality Component based on the CAHPS Summary Score and individual eCQM performance. The amount of PBIP earned then will be aggregated across each individual measure for which a practice is eligible to keep payment.
Page 44 of 112
Practices can retain up to 25% of the Quality Component of the PBIP on the basis of the percentile threshold attained on the CAHPS summary score, as described in Table 4-2.
Table 4-2 Practice Performance and Percentage of PBIP for Patient Experience of Care
Performance for Patient Experience of Care (CAHPS Summary Score)
Percentage of Quality Component of the PBIP Retained for Patient Experience of
Care < 30th percentile 0%
30th–69th percentile 12.5%–25% 70th percentile and above 25%
Practices performing below the 30th percentile for the CAHPS Summary Score will not retain the portion of the Quality Component of the PBIP for CAHPS. Practices performing between the minimum and maximum performance threshold will receive scores along a continuous distribution normalized to values between 12.5% and 25% using the following formula:
Given that CAHPS Summary Scores usually have a narrow range between deciles, we set the minimum and maximum performance thresholds at 30th and 70th percentile for patient experience of care.
The eCQMs together comprise 75% of the Quality Component of the PBIP. Each of the nine required measures is thus worth 8.33% of the Quality Component of the PBIP. Based on the threshold attained for each eCQM, the practice retains a percentage of the measure’s share of the Quality Component PBIP, as shown in Table 4-3. For each measure that falls below the 30th percentile, the amount retained for that measure is $0.
Table 4-3 Practice Performance and Percentage of Quality Component of the PBIP Retained for
Individual eCQMs
Performance for Clinical Quality Relative to Benchmark
Percentage of Quality Component of the PBIP Retained for Individual eCQM
< 30th percentile 0% 30th–69th percentile 4%–8.33%
70th percentile and above 8.33%
Practices performing below the 30th percentile for an individual eCQM will not retain the portion of the Quality Component of the PBIP for that measure. Practices performing between the 30th
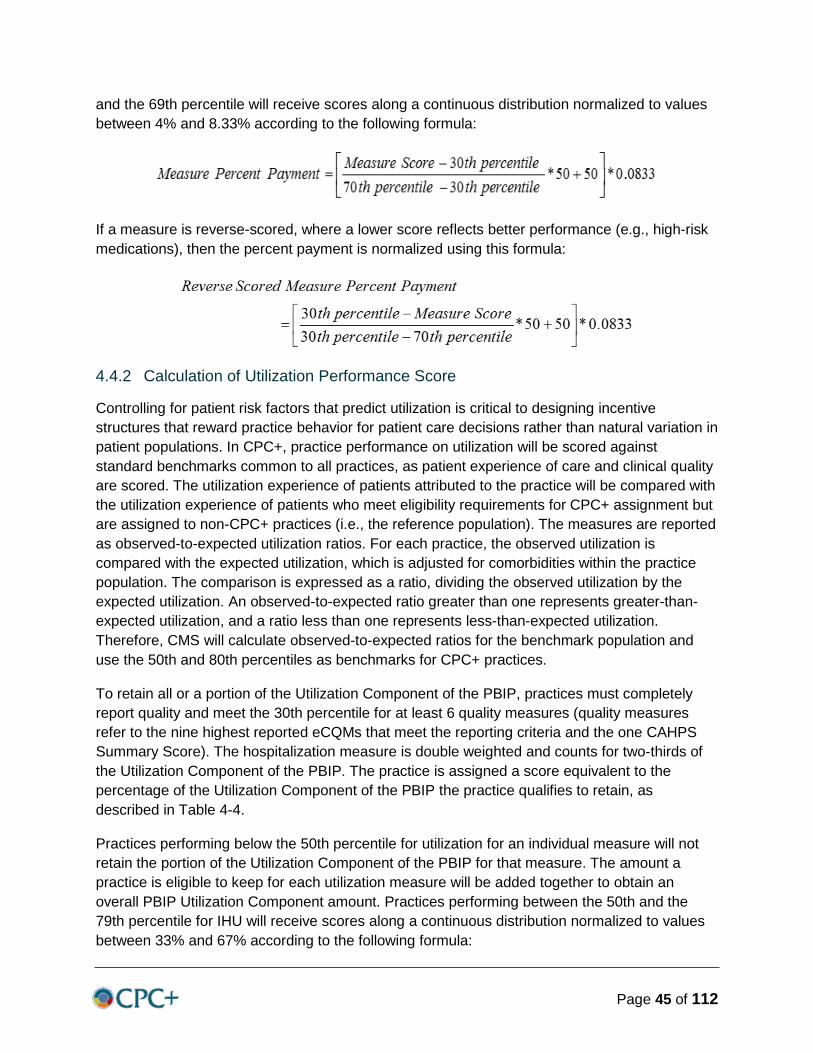
Page 45 of 112
and the 69th percentile will receive scores along a continuous distribution normalized to values between 4% and 8.33% according to the following formula:
If a measure is reverse-scored, where a lower score reflects better performance (e.g., high-risk medications), then the percent payment is normalized using this formula:
4.4.2 Calculation of Utilization Performance Score
Controlling for patient risk factors that predict utilization is critical to designing incentive structures that reward practice behavior for patient care decisions rather than natural variation in patient populations. In CPC+, practice performance on utilization will be scored against standard benchmarks common to all practices, as patient experience of care and clinical quality are scored. The utilization experience of patients attributed to the practice will be compared with the utilization experience of patients who meet eligibility requirements for CPC+ assignment but are assigned to non-CPC+ practices (i.e., the reference population). The measures are reported as observed-to-expected utilization ratios. For each practice, the observed utilization is compared with the expected utilization, which is adjusted for comorbidities within the practice population. The comparison is expressed as a ratio, dividing the observed utilization by the expected utilization. An observed-to-expected ratio greater than one represents greater-than-expected utilization, and a ratio less than one represents less-than-expected utilization. Therefore, CMS will calculate observed-to-expected ratios for the benchmark population and use the 50th and 80th percentiles as benchmarks for CPC+ practices.
To retain all or a portion of the Utilization Component of the PBIP, practices must completely report quality and meet the 30th percentile for at least 6 quality measures (quality measures refer to the nine highest reported eCQMs that meet the reporting criteria and the one CAHPS Summary Score). The hospitalization measure is double weighted and counts for two-thirds of the Utilization Component of the PBIP. The practice is assigned a score equivalent to the percentage of the Utilization Component of the PBIP the practice qualifies to retain, as described in Table 4-4.
Practices performing below the 50th percentile for utilization for an individual measure will not retain the portion of the Utilization Component of the PBIP for that measure. The amount a practice is eligible to keep for each utilization measure will be added together to obtain an overall PBIP Utilization Component amount. Practices performing between the 50th and the 79th percentile for IHU will receive scores along a continuous distribution normalized to values between 33% and 67% according to the following formula:
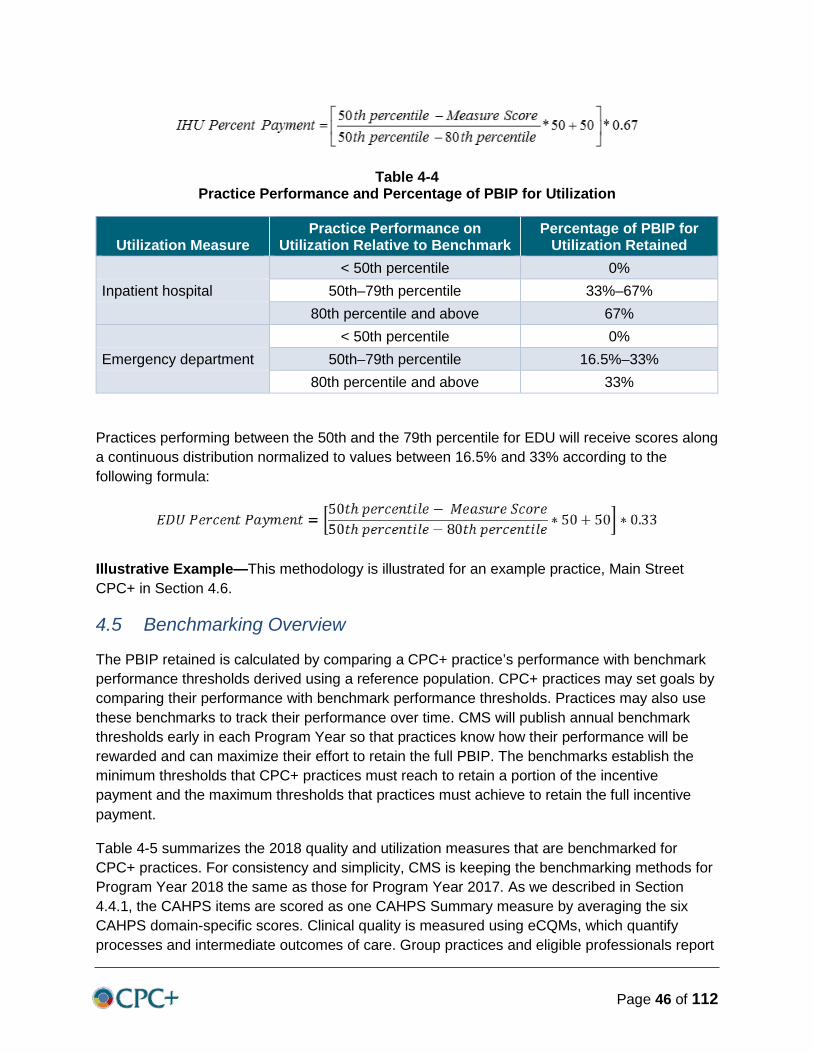
Page 46 of 112
Table 4-4 Practice Performance and Percentage of PBIP for Utilization
Utilization Measure Practice Performance on
Utilization Relative to Benchmark Percentage of PBIP for
Utilization Retained Blank < 50th percentile 0% Inpatient hospital 50th–79th percentile 33%–67% Blank 80th percentile and above 67% Blank < 50th percentile 0% Emergency department 50th–79th percentile 16.5%–33% Blank 80th percentile and above 33%
Practices performing between the 50th and the 79th percentile for EDU will receive scores along a continuous distribution normalized to values between 16.5% and 33% according to the following formula:
Illustrative Example—This methodology is illustrated for an example practice, Main Street CPC+ in Section 4.6.
4.5 Benchmarking Overview
The PBIP retained is calculated by comparing a CPC+ practice’s performance with benchmark performance thresholds derived using a reference population. CPC+ practices may set goals by comparing their performance with benchmark performance thresholds. Practices may also use these benchmarks to track their performance over time. CMS will publish annual benchmark thresholds early in each Program Year so that practices know how their performance will be rewarded and can maximize their effort to retain the full PBIP. The benchmarks establish the minimum thresholds that CPC+ practices must reach to retain a portion of the incentive payment and the maximum thresholds that practices must achieve to retain the full incentive payment.
Table 4-5 summarizes the 2018 quality and utilization measures that are benchmarked for CPC+ practices. For consistency and simplicity, CMS is keeping the benchmarking methods for Program Year 2018 the same as those for Program Year 2017. As we described in Section 4.4.1, the CAHPS items are scored as one CAHPS Summary measure by averaging the six CAHPS domain-specific scores. Clinical quality is measured using eCQMs, which quantify processes and intermediate outcomes of care. Group practices and eligible professionals report

Page 47 of 112
eCQMs electronically through Quality Reporting Document Architecture (QRDA) Category III to the Physician Quality Reporting System (PQRS). The clinical quality measure benchmarks are calculated individually.
As we described in Section 4.3, CMS is using IHU per 1,000 attributed beneficiaries and EDU per 1,000 attributed beneficiaries. Both measures are calculated using Medicare FFS claims data.
Table 4-5 CPC+ Quality and Utilization Measures for Benchmarking
Measure Component Measure Segments
Number of
Measures Data Source for Benchmarking
Year Used to Derive
Benchmark
Quality Patient experience of carea
1 AHRQ CAHPS 2013, 2014, and 2015
Blank Clinical quality 19 PQRS 2015 Utilization Medicare utilization 2 Medicare claims data 2015
a The CAHPS summary measure is the average of the six domain-specific scores.
4.5.1 Data Source for Benchmarking
4.5.1.1 Quality Component
CAHPS. The CAHPS benchmarks for Program Year 2018 remain the same as Program Year 2017 because Program Year 2017 benchmarks were based on data from multiple years. CMS used AHRQ’s 2013, 2014, and 2015 CAHPS database as the data source to create the 2017 patient experience of care benchmark. The CAHPS database was chosen for the following reasons:
• The sampling frame, as in CPC+, includes all patients in the practice. • The survey items included in the CAHPS database are in the same family of surveys as
the patient experience of care survey used in CPC+. • Data are collected from a large, geographically representative sample. • Of the 6,426 potential practices in the 2013, 2014, and 2015 database, 2,455 are either
100% primary care or multispecialty practices that include primary care practitioners. • Variables are included to conduct risk adjustment to account for differences in salient
patient characteristics that could otherwise bias true differences in a practice’s performance.
CMS will use version 3.0 of the CG CAHPS to measure patient experience of care for CPC+ practices. The questions are listed in Appendix E. Because the CG CAHPS version 3.0 was not released until summer 2015, it is likely to have a relatively small number of practices included in AHRQ’s 2015 CAHPS database reported on CG CAHPS version 3.0. Therefore, CMS established this benchmark using data from the CAHPS database from practices that submitted corresponding questions using CG CAHPS version 2.0 in 2013, 2014, and 2015. According to
Page 48 of 112
analyses conducted by the CAHPS Consortium, the measure reliability, measured by internal consistency and site-level reliability, is similar and acceptable for the 3.0 and 2.0 versions of CG CAHPS (AHRQ, 2017).
eCQMs. The eCQMs benchmarking methods for Program Year 2018 remain the same as Program Year 2017 for consistency and simplicity. CPC+ clinical quality measures include patients insured by all payers, including but not limited to Medicare, who have at least one visit to the CPC+ practice during the measurement year and meet the denominator inclusion criteria. In Program Year 2018, CMS reviewed current measures used by other CMS programs for quality reporting, such as Merit-based Incentive Payment Systems (MIPS), and identified 19 eCQM measures designed to indicate quality of care specifically relevant to primary care. Because eCQM measures are reported electronically, they can be an easily accessible tool for practices and practitioners to inform, guide improvement, and support evidence-based decision making. Electronic submission to the PQRS occurs through the data transmission method called QRDA Category III. QRDA Category III reports are aggregated measures for group practice or eligible professionals. CMS has evaluated the PQRS QRDA Category III data and determined that they (1) match CPC+ measure specifications, (2) include beneficiaries from all payers, (3) have a similar reporting period to CPC+, (4) include the aggregated practice level and the eligible professional level in the reports, (5) include primary care specialty, and (6) have acceptable data quality and statistical reliability. MIPS derived clinical quality benchmarks from PQRS 2015 performance files for the EHR reporting option. For these reasons, CMS adopted MIPS EHR reporting option benchmarks for eCQM benchmarks in CPC+.
A summarized process for MIPS EHR reporting option benchmark calculation is described in Section 4.5.2.2.
Utilization Component. CMS used 2015 national Medicare FFS claims data to create the 2017 and 2018 utilization benchmarks. For consistency and simplicity, CMS is keeping the benchmarks for Program Year 2018 the same as those for Program Year 2017 for the two utilization measures. The Utilization Component includes a set of actionable utilization measures that are significant drivers of total cost of care and can be reliably measured at the practice level. CMS uses measure specifications provided by NCQA to calculate practice-level IHU and EDU (measure specifications are available in Appendix G). These measures are calculated using Medicare claims data for Medicare beneficiaries aged 65 years or older and are risk-adjusted for patient demographics and comorbidities within the practice population.
To derive the 2017 utilization measure benchmarks, CMS used a reference population from the universe of Medicare FFS TINs and their attributed Medicare beneficiaries. The universe of TINs is identified as those with a valid TIN and at least one eligible practitioners that had positive charges in 2015. Beneficiaries are attributed to these TINs using a plurality of care attribution algorithm similar to the CPC+ attribution algorithm. CMS used this national reference population because it is comparable to CPC+ attributed beneficiaries and is readily available for the benchmark calculation. CMS also excluded the TINs participating in the CPC+ practices from the reference population to minimize the influence of CPC+ practices on the benchmarks.
Page 49 of 112
4.5.2 Benchmarking Methods
4.5.2.1 Quality Component
CAHPS Measurement. CMS calculated scores for each of the CPC+ CAHPS domain-specific scores for each practice in the 2013, 2014, and 2015 AHRQ CAHPS database using version 4.1 of the CAHPS Analysis Program. The summary scores enable practices to analyze CAHPS survey data to make valid comparisons of performance (AHRQ, 2012). AHRQ developed and tested the CAHPS Analysis Program code to generate practice-level output from CAHPS survey results. The code is easily adjusted, using parameters to generate composite scores from CAHPS survey results.
A national sample of CAHPS survey responses was used to establish the benchmarks. Each survey response was transformed into CAHPS domain-specific scores using numeric values assigned to responses for a given measure following the steps outlined in Section 4.4.1. Table 4-6 presents examples of scoring transformations for CAHPS measures in various response scales.
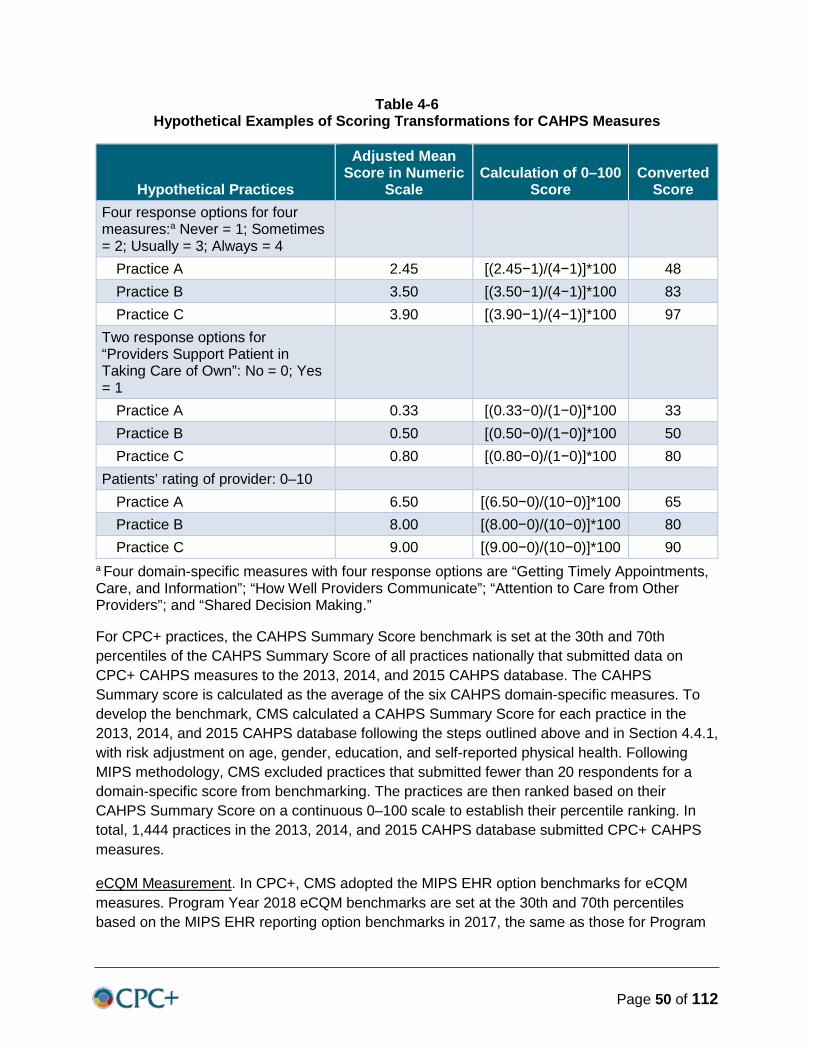
Page 50 of 112
Table 4-6 Hypothetical Examples of Scoring Transformations for CAHPS Measures
Hypothetical Practices
Adjusted Mean Score in Numeric
Scale Calculation of 0–100
Score Converted
Score Four response options for four measures:a Never = 1; Sometimes = 2; Usually = 3; Always = 4
Blank Blank Blank
Practice A 2.45 [(2.45−1)/(4−1)]*100 48 Practice B 3.50 [(3.50−1)/(4−1)]*100 83 Practice C 3.90 [(3.90−1)/(4−1)]*100 97
Two response options for “Providers Support Patient in Taking Care of Own”: No = 0; Yes = 1
Blank Blank Blank
Practice A 0.33 [(0.33−0)/(1−0)]*100 33 Practice B 0.50 [(0.50−0)/(1−0)]*100 50 Practice C 0.80 [(0.80−0)/(1−0)]*100 80
Patients’ rating of provider: 0–10 Blank Blank Blank Practice A 6.50 [(6.50−0)/(10−0)]*100 65 Practice B 8.00 [(8.00−0)/(10−0)]*100 80 Practice C 9.00 [(9.00−0)/(10−0)]*100 90
a Four domain-specific measures with four response options are “Getting Timely Appointments, Care, and Information”; “How Well Providers Communicate”; “Attention to Care from Other Providers”; and “Shared Decision Making.”
For CPC+ practices, the CAHPS Summary Score benchmark is set at the 30th and 70th percentiles of the CAHPS Summary Score of all practices nationally that submitted data on CPC+ CAHPS measures to the 2013, 2014, and 2015 CAHPS database. The CAHPS Summary score is calculated as the average of the six CAHPS domain-specific measures. To develop the benchmark, CMS calculated a CAHPS Summary Score for each practice in the 2013, 2014, and 2015 CAHPS database following the steps outlined above and in Section 4.4.1, with risk adjustment on age, gender, education, and self-reported physical health. Following MIPS methodology, CMS excluded practices that submitted fewer than 20 respondents for a domain-specific score from benchmarking. The practices are then ranked based on their CAHPS Summary Score on a continuous 0–100 scale to establish their percentile ranking. In total, 1,444 practices in the 2013, 2014, and 2015 CAHPS database submitted CPC+ CAHPS measures.
eCQM Measurement. In CPC+, CMS adopted the MIPS EHR option benchmarks for eCQM measures. Program Year 2018 eCQM benchmarks are set at the 30th and 70th percentiles based on the MIPS EHR reporting option benchmarks in 2017, the same as those for Program
Page 51 of 112
Year 2017. Benchmarks for one CPC+ eCQM (MIPS #438) are not available in 2017 MIPS benchmarks, and its benchmarks is set using the 2018 MIPS EHR option benchmarks.
A summary of the MIPS methodology is listed as follows:
• Measure scores are calculated at the practice TIN or aggregated TIN-NPI level using the following formula:
• Measures with invalid or zero performance rates are excluded from MIPS benchmarks calculation. For inverse-scored measures, performance rates of 100 are excluded.
• At least 20 reporting practitioners or groups must meet the MIPS eligible clinician criteria for contributing to MIPS benchmarks for a benchmark to be created. These practitioners or groups must also each have a minimum case size of 20 patients.
• Measures with multiple strata are aligned with MIPS methodology in their reporting. For example, Measure 238, Use of High-Risk Medications in the Elderly, reports Stratum 1 performance; Measure 305, Initiation and Engagement of Alcohol and Other Drug Dependence Treatment, reports average performance rates across two strata; Measure 371, Depression Utilization of the PHQ-9 Tool, reports weighted average performance rates across three strata.
• Details on MIPS eCQM benchmarks calculations can be downloaded from https://qpp.cms.gov/docs/QPP_Quality_Benchmarks_Overview.zip.
4.5.2.2 Utilization Component
Utilization Measurement. Both utilization measures are reported as practice-level observed-to-expected utilization ratios. An observed-to-expected ratio greater than 1.0 represents greater-than-expected utilization, and a ratio less than 1.0 represents less-than-expected utilization. To derive reliable benchmarks, only TINs with at least 125 attributed beneficiaries eligible for the measure denominator are included to calculate the measure’s benchmark. There are 18,578 TINs included for the IHU and the EDU benchmarking.
To obtain practice-level benchmarks for the utilization measures, CMS first calculates the observed and expected number of visits for every beneficiary who is eligible for inclusion in the denominator of the measure. CMS then aggregates to the TIN level for both observed and expected number of visits and calculates the observed-to-expected ratio for each TIN.
The 50th and 80th percentiles of TIN observed-to-expected ratios among the national FFS reference population are the utilization measure benchmarks. Note that performance for both utilization measures is reverse-scored, so lower observed-to-expected ratios represent desirable performance and are denoted as higher percentiles for both measures.

Page 52 of 112
4.5.3 Benchmark Results
Table 4-7 lists the 30th and 70th percentiles of eCQMs and CAHPS measure benchmarks and the 50th and 80th percentiles of utilization measure benchmarks.
Table 4-7 Benchmark Results for the Quality and Utilization Measures in CPC+
CMS ID# MIPS ID # Measure Title Benchmarks Benchmarks CAHPS Blank Blank P30 P70
N/A N/A CAHPS Summary Score 78.77 82.44 eCQMs Blank Blank P30 P70
CMS165v5 236 Controlling High Blood Pressure 55.40% 71.01% CMS122v5 001 Diabetes: Hemoglobin A1c
(HbA1c) Poor Control (> 9%)a 35.90% 9.09%
CMS125v5 112 Breast Cancer Screening 22.22% 55.26% CMS130v5 113 Colorectal Cancer Screening 15.98% 56.20% CMS124v5 309 Cervical Cancer Screening 15.09% 45.00% CMS131v5 117 Diabetes: Eye Exam 80.69% 98.58% CMS134v6 119 Diabetes: Medical Attention for
Nephropathy 72.92% 89.96%
CMS50v5 374 Closing the Referral Loop: Receipt of Specialist Report
6.25% 36.96%
CMS156v5 238 Use of High-Risk Medications in the Elderlya
21.22% 0.90%
CMS2v7 134 Preventive Care and Screening: Screening for Depression and Follow-Up Plan
2.94% 30.30%
CMS160v6 371 Depression Utilization of the PHQ-9 Tool
1.96% 12.24%
CMS149v6
281 Dementia: Cognitive Assessment
17.57% 88.14%
CMS138v6 226 Preventive Care and Screening: Tobacco Use: Screening and Cessation Intervention
81.60% 94.68%
CMS137v5 305 Initiation and Engagement of Alcohol and Other Drug Dependence Treatment
0.95% 5.13%
CMS139v5 318 Falls: Screening for Future Fall Risk
17.93% 81.05%
CMS147v7 110 Preventive Care and Screening: Influenza Immunization
18.58%
47.87%
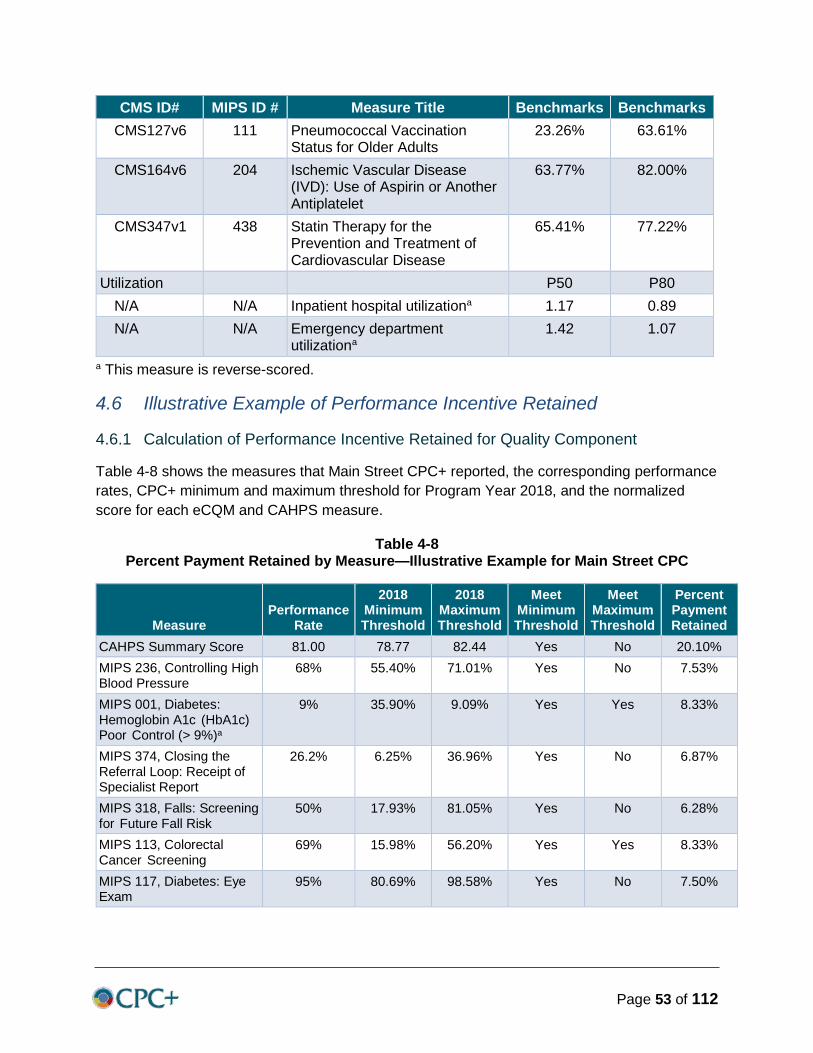
Page 53 of 112
CMS ID# MIPS ID # Measure Title Benchmarks Benchmarks CMS127v6 111 Pneumococcal Vaccination
Status for Older Adults 23.26%
63.61%
CMS164v6 204 Ischemic Vascular Disease (IVD): Use of Aspirin or Another Antiplatelet
63.77%
82.00%
CMS347v1 438 Statin Therapy for the Prevention and Treatment of Cardiovascular Disease
65.41% 77.22%
Utilization Blank Blank P50 P80 N/A N/A Inpatient hospital utilizationa 1.17 0.89 N/A N/A Emergency department
utilizationa 1.42 1.07
a This measure is reverse-scored.
4.6 Illustrative Example of Performance Incentive Retained
4.6.1 Calculation of Performance Incentive Retained for Quality Component
Table 4-8 shows the measures that Main Street CPC+ reported, the corresponding performance rates, CPC+ minimum and maximum threshold for Program Year 2018, and the normalized score for each eCQM and CAHPS measure.
Table 4-8 Percent Payment Retained by Measure—Illustrative Example for Main Street CPC
Measure Performance
Rate
2018 Minimum Threshold
2018 Maximum Threshold
Meet Minimum Threshold
Meet Maximum Threshold
Percent Payment Retained
CAHPS Summary Score 81.00 78.77 82.44 Yes No 20.10% MIPS 236, Controlling High Blood Pressure
68% 55.40% 71.01% Yes No 7.53%
MIPS 001, Diabetes: Hemoglobin A1c (HbA1c) Poor Control (> 9%)a
9% 35.90% 9.09% Yes Yes 8.33%
MIPS 374, Closing the Referral Loop: Receipt of Specialist Report
26.2% 6.25% 36.96% Yes No 6.87%
MIPS 318, Falls: Screening for Future Fall Risk
50% 17.93% 81.05% Yes No 6.28%
MIPS 113, Colorectal Cancer Screening
69% 15.98% 56.20% Yes Yes 8.33%
MIPS 117, Diabetes: Eye Exam
95% 80.69% 98.58% Yes No 7.50%
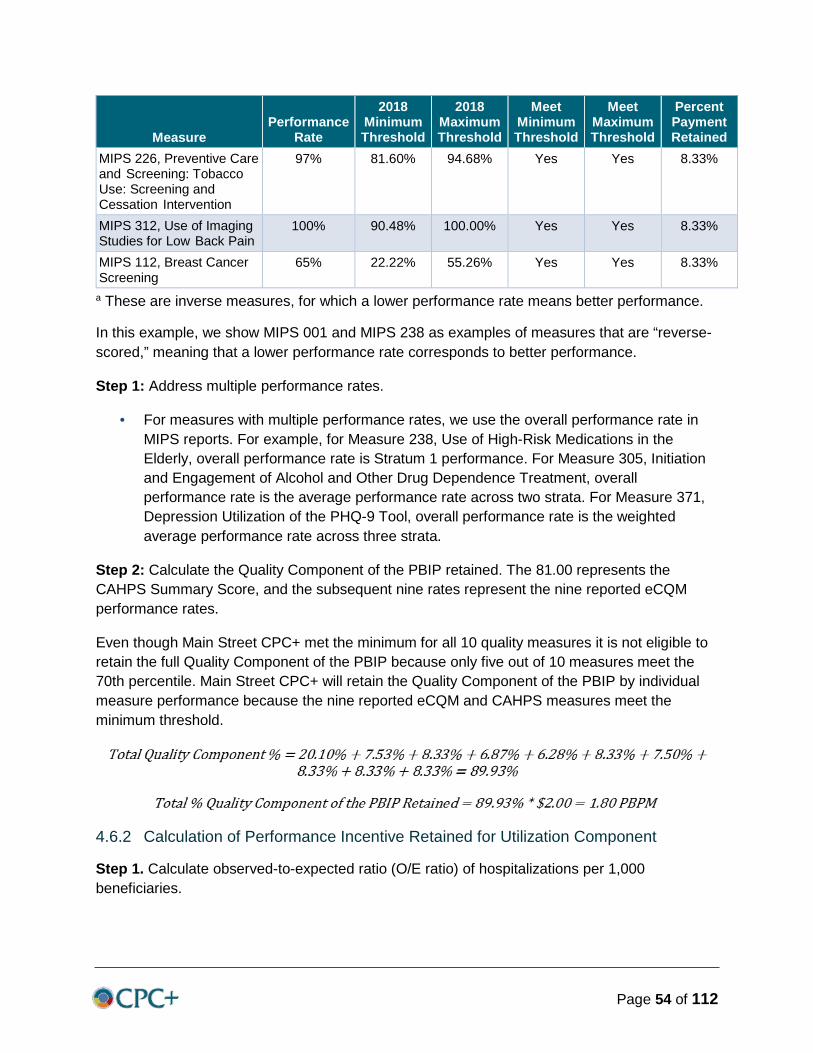
Page 54 of 112
Measure Performance
Rate
2018 Minimum Threshold
2018 Maximum Threshold
Meet Minimum Threshold
Meet Maximum Threshold
Percent Payment Retained
MIPS 226, Preventive Care and Screening: Tobacco Use: Screening and Cessation Intervention
97% 81.60% 94.68% Yes Yes 8.33%
MIPS 312, Use of Imaging Studies for Low Back Pain
100% 90.48% 100.00% Yes Yes 8.33%
MIPS 112, Breast Cancer Screening
65% 22.22% 55.26% Yes Yes 8.33%
a These are inverse measures, for which a lower performance rate means better performance.
In this example, we show MIPS 001 and MIPS 238 as examples of measures that are “reverse-scored,” meaning that a lower performance rate corresponds to better performance.
Step 1: Address multiple performance rates.
• For measures with multiple performance rates, we use the overall performance rate in MIPS reports. For example, for Measure 238, Use of High-Risk Medications in the Elderly, overall performance rate is Stratum 1 performance. For Measure 305, Initiation and Engagement of Alcohol and Other Drug Dependence Treatment, overall performance rate is the average performance rate across two strata. For Measure 371, Depression Utilization of the PHQ-9 Tool, overall performance rate is the weighted average performance rate across three strata.
Step 2: Calculate the Quality Component of the PBIP retained. The 81.00 represents the CAHPS Summary Score, and the subsequent nine rates represent the nine reported eCQM performance rates.
Even though Main Street CPC+ met the minimum for all 10 quality measures it is not eligible to retain the full Quality Component of the PBIP because only five out of 10 measures meet the 70th percentile. Main Street CPC+ will retain the Quality Component of the PBIP by individual measure performance because the nine reported eCQM and CAHPS measures meet the minimum threshold.
4.6.2 Calculation of Performance Incentive Retained for Utilization Component
Step 1. Calculate observed-to-expected ratio (O/E ratio) of hospitalizations per 1,000 beneficiaries.
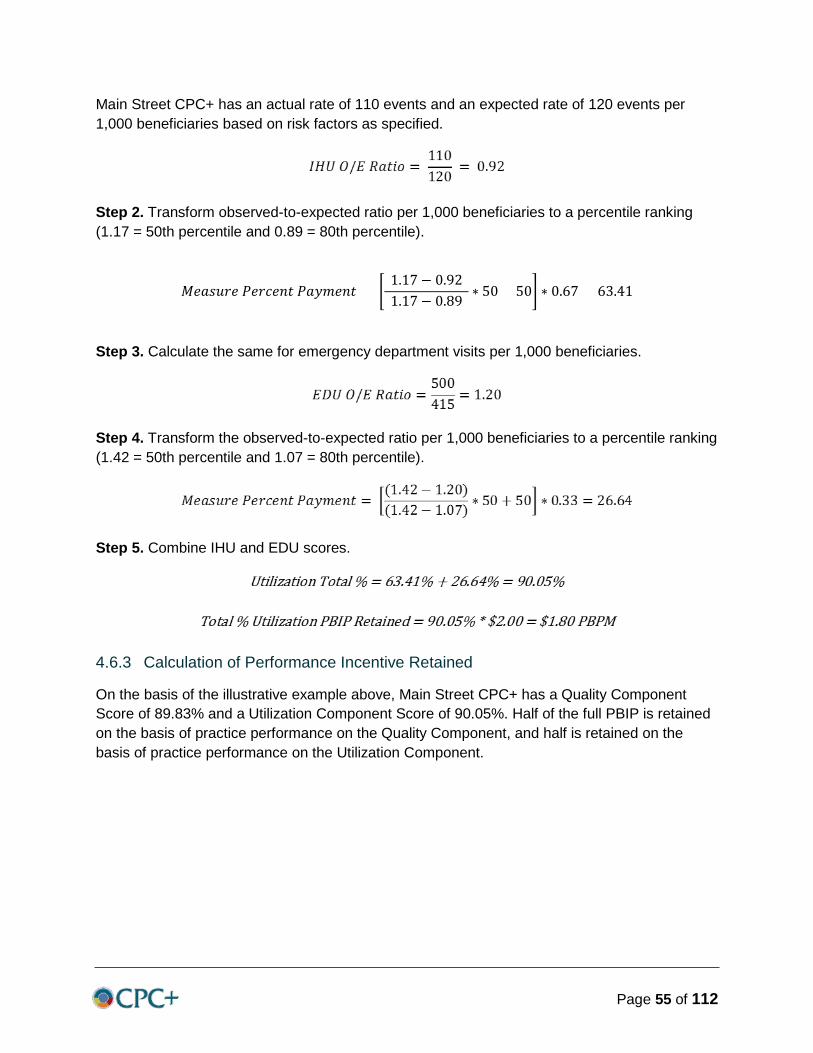
Page 55 of 112
Main Street CPC+ has an actual rate of 110 events and an expected rate of 120 events per 1,000 beneficiaries based on risk factors as specified.
Step 2. Transform observed-to-expected ratio per 1,000 beneficiaries to a percentile ranking (1.17 = 50th percentile and 0.89 = 80th percentile).
𝑀𝑀𝑒𝑒𝑒𝑒𝑒𝑒𝑒𝑒𝑒𝑒𝑒𝑒 𝑃𝑃𝑒𝑒𝑒𝑒𝑃𝑃𝑒𝑒𝑒𝑒𝑒𝑒 𝑃𝑃𝑒𝑒𝑎𝑎𝑎𝑎𝑒𝑒𝑒𝑒𝑒𝑒 = �(1.17− 0.92)(1.17− 0.89) ∗ 50 + 50� ∗ 0.67 = 63.41
Step 3. Calculate the same for emergency department visits per 1,000 beneficiaries.
Step 4. Transform the observed-to-expected ratio per 1,000 beneficiaries to a percentile ranking (1.42 = 50th percentile and 1.07 = 80th percentile).
Step 5. Combine IHU and EDU scores.
4.6.3 Calculation of Performance Incentive Retained
On the basis of the illustrative example above, Main Street CPC+ has a Quality Component Score of 89.83% and a Utilization Component Score of 90.05%. Half of the full PBIP is retained on the basis of practice performance on the Quality Component, and half is retained on the basis of practice performance on the Utilization Component.

Page 56 of 112
The PBPM amount retained by Main Street CPC+ for the Quality Component of the PBIP is equal to
𝑃𝑃𝑃𝑃𝑃𝑃𝑃𝑃 𝑒𝑒𝑒𝑒𝑒𝑒𝑒𝑒𝑒𝑒𝑒𝑒 𝑓𝑓𝑓𝑓𝑒𝑒 𝑄𝑄𝑒𝑒𝑒𝑒𝑄𝑄𝑄𝑄𝑒𝑒𝑎𝑎 = 89.93% ∗ $2.00 = $1.80 𝑃𝑃𝑃𝑃𝑃𝑃𝑀𝑀
The corresponding annual amount retained is equal to
𝑃𝑃𝑃𝑃𝑃𝑃𝑃𝑃 𝑒𝑒𝑒𝑒𝑒𝑒𝑒𝑒𝑒𝑒𝑒𝑒 𝑓𝑓𝑓𝑓𝑒𝑒 𝑄𝑄𝑒𝑒𝑒𝑒𝑄𝑄𝑄𝑄𝑒𝑒𝑎𝑎 = $1.80 ∗ 12 𝑎𝑎𝑓𝑓𝑒𝑒𝑒𝑒ℎ𝑒𝑒 ∗ 500 𝑏𝑏𝑒𝑒𝑒𝑒𝑒𝑒𝑓𝑓𝑄𝑄𝑃𝑃𝑄𝑄𝑒𝑒𝑒𝑒𝑄𝑄𝑒𝑒𝑒𝑒 = $10,800
The PBPM amount retained by Main Street CPC+ for the Utilization Component of the PBIP is equal to
The corresponding annual amount retained is equal to
𝑃𝑃𝑃𝑃𝑃𝑃𝑃𝑃 𝑒𝑒𝑒𝑒𝑒𝑒𝑒𝑒𝑒𝑒𝑒𝑒 𝑓𝑓𝑓𝑓𝑒𝑒 𝑈𝑈𝑒𝑒𝑄𝑄𝑄𝑄𝑄𝑄𝑡𝑡𝑒𝑒𝑒𝑒𝑄𝑄𝑓𝑓𝑒𝑒 = $1.80 ∗ 12 𝑎𝑎𝑓𝑓𝑒𝑒𝑒𝑒ℎ𝑒𝑒 ∗ 500 𝑏𝑏𝑒𝑒𝑒𝑒𝑒𝑒𝑓𝑓𝑄𝑄𝑃𝑃𝑄𝑄𝑒𝑒𝑒𝑒𝑄𝑄𝑒𝑒𝑒𝑒 = $10,800
The total retained by Main Street CPC+ in the Program Year 2018 is equal to
𝑇𝑇𝑂𝑂𝑇𝑇𝑂𝑂𝑂𝑂 𝑃𝑃𝑃𝑃𝑃𝑃𝑃𝑃 𝑒𝑒𝑒𝑒𝑒𝑒𝑒𝑒𝑒𝑒𝑒𝑒 = $10,800 + $10,800 = $21,600
Main Street CPC+ received the full incentive amount for Program Year 2018 at the beginning of the year. As a CPC+ Track 2 participating practice, Main Street CPC+ was prospectively paid a PBIP amount equal to $4.00 PBPM based on having 500 beneficiaries attributed to their practice in Quarter 1 of Program Year 2018:
Because Main Street CPC+ retained $21,600 of the full incentive, CMS will recoup an amount equal to $24,000 − $21,600 = $2,400.
Note: If Main Street CPC+ had not attained a performance score at the 30th percentile or higher on at least six of the 10 quality measures (quality measures refers to the highest nine eCQMs that meet reporting criteria and the one CAHPS Summary Score), it would not have been eligible to retain any of the Utilization Component of the PBIP. Therefore, it would not have been eligible for the PBIP for utilization and would have to pay back to CMS the full amount on the Utilization Component: $12,000.

Page 57 of 112
[This page was intentionally left blank.]
Page 58 of 112
Chapter 5: Payment under the Medicare Physician Fee Schedule Chapter 5 describes and explains the hybrid payment for CPC+ Track 2 practices. Practices participating in Track 1 will continue to bill and receive payment from Medicare FFS as usual. Section 5.1 explains the purpose and intent of the hybrid payment, differences from other CPC+ payments, and implications for Track 2 CPC+ practices. Sections 5.2 and 5.3 describe the parameters of the CPCP—Section 5.2 outlines the approach for determining historical expenditures for the CPCP using a historical calculation year, while Section 5.3 describes the Program Year 2018 CPCP. Sections 5.4 and 5.5 describe the corresponding claims reduction and the partial reconciliation, respectively.
5.1 Purpose and Intent
5.1.1 Purpose and Aims
The goal of the hybrid payment is to support the flexible delivery of comprehensive primary care to promote population health beyond traditional evaluation and management office visits (henceforth, office visit E&Ms). Under current exclusive FFS payment methodologies, there is a strong incentive rewarding face-to-face office visit E&Ms for billable revenue generation, even if virtual encounters (e.g., phone calls, electronic communications) would better meet the patient’s needs or align with patient preferences. Conversely, a fully population-based payment for primary care services without FFS payment for office visit E&Ms may present an undesirable incentive to minimize all office visit E&Ms.
In Track 2 of CPC+, CMS will use a hybrid payment that will allow practices the flexibility to deliver care in the most appropriate mechanism that is also in accordance with patient preferences (Davis, Schoenbaum, and Audet, 2005; Vats, Ash, and Ellis, 2013; Goroll et al., 2007). The hybrid payment will include a prospectively paid PBPM payment (paid quarterly) and a corresponding FFS claims reduction on payments for specific claims submitted during the Program Year. The prospective, upfront payment, or CPCP, is paid based on a practice’s average PBPM E&M payments during the historical calculation period. The historical PBPM is trended (for Medicare FFS price inflation/deflation) to reflect the Program Year.15 FFS payments during the Program Year are reduced proportionately to match a practice’s selected percentage of the historical PBPM payment (i.e., the CPCP). The hybrid payment will be limited to services that are billed using selected office visit E&M codes under the PFS. To protect patient access and incentivize preventive and other services (e.g., influenza vaccination), it is important to retain some full primary care FFS payment.
The hybrid payment changes the payment mechanism, promotes flexibility in how practices deliver care traditionally required to be provided via an office visit E&M, and supports the CPC+ requirement for practices to increase the depth and breadth of primary care they deliver (i.e.,
15 The historical PBPM is also adjusted by the comprehensiveness supplement, which accounts for the
increased depth and breadth of primary care services under Track 2. See Section 5.3.1 for details.
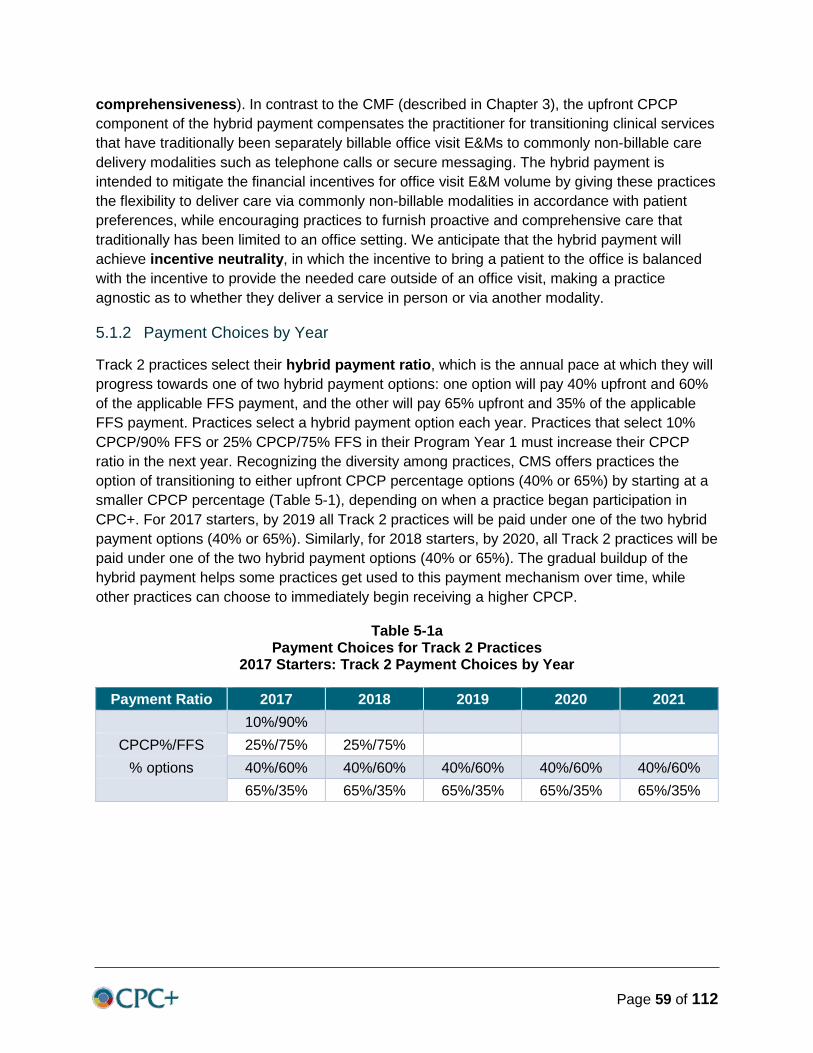
Page 59 of 112
comprehensiveness). In contrast to the CMF (described in Chapter 3), the upfront CPCP component of the hybrid payment compensates the practitioner for transitioning clinical services that have traditionally been separately billable office visit E&Ms to commonly non-billable care delivery modalities such as telephone calls or secure messaging. The hybrid payment is intended to mitigate the financial incentives for office visit E&M volume by giving these practices the flexibility to deliver care via commonly non-billable modalities in accordance with patient preferences, while encouraging practices to furnish proactive and comprehensive care that traditionally has been limited to an office setting. We anticipate that the hybrid payment will achieve incentive neutrality, in which the incentive to bring a patient to the office is balanced with the incentive to provide the needed care outside of an office visit, making a practice agnostic as to whether they deliver a service in person or via another modality.
5.1.2 Payment Choices by Year
Track 2 practices select their hybrid payment ratio, which is the annual pace at which they will progress towards one of two hybrid payment options: one option will pay 40% upfront and 60% of the applicable FFS payment, and the other will pay 65% upfront and 35% of the applicable FFS payment. Practices select a hybrid payment option each year. Practices that select 10% CPCP/90% FFS or 25% CPCP/75% FFS in their Program Year 1 must increase their CPCP ratio in the next year. Recognizing the diversity among practices, CMS offers practices the option of transitioning to either upfront CPCP percentage options (40% or 65%) by starting at a smaller CPCP percentage (Table 5-1), depending on when a practice began participation in CPC+. For 2017 starters, by 2019 all Track 2 practices will be paid under one of the two hybrid payment options (40% or 65%). Similarly, for 2018 starters, by 2020, all Track 2 practices will be paid under one of the two hybrid payment options (40% or 65%). The gradual buildup of the hybrid payment helps some practices get used to this payment mechanism over time, while other practices can choose to immediately begin receiving a higher CPCP.
Table 5-1a Payment Choices for Track 2 Practices
2017 Starters: Track 2 Payment Choices by Year
Payment Ratio 2017 2018 2019 2020 2021 Blank 10%/90% Blank Blank Blank Blank
CPCP%/FFS 25%/75% 25%/75% Blank Blank Blank % options 40%/60% 40%/60% 40%/60% 40%/60% 40%/60%
Blank 65%/35% 65%/35% 65%/35% 65%/35% 65%/35%
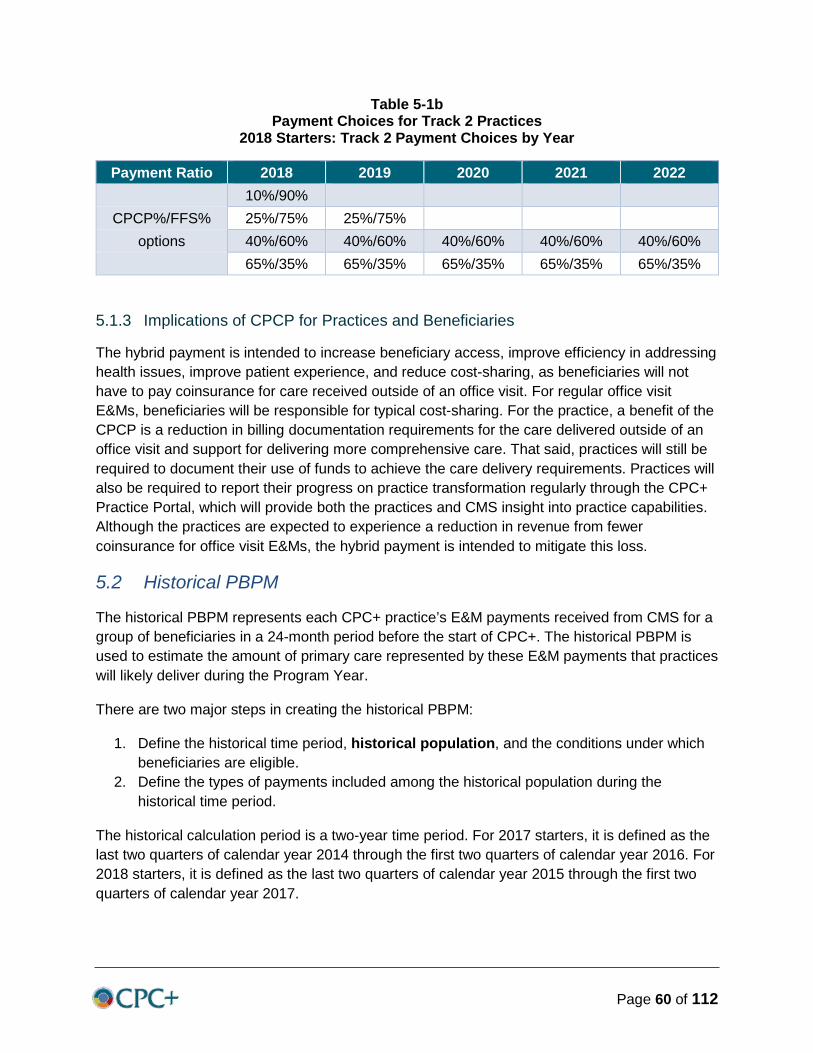
Page 60 of 112
Table 5-1b Payment Choices for Track 2 Practices
2018 Starters: Track 2 Payment Choices by Year
Payment Ratio 2018 2019 2020 2021 2022 Blank 10%/90% Blank Blank Blank Blank
CPCP%/FFS% 25%/75% 25%/75% Blank Blank Blank options 40%/60% 40%/60% 40%/60% 40%/60% 40%/60% Blank 65%/35% 65%/35% 65%/35% 65%/35% 65%/35%
5.1.3 Implications of CPCP for Practices and Beneficiaries
The hybrid payment is intended to increase beneficiary access, improve efficiency in addressing health issues, improve patient experience, and reduce cost-sharing, as beneficiaries will not have to pay coinsurance for care received outside of an office visit. For regular office visit E&Ms, beneficiaries will be responsible for typical cost-sharing. For the practice, a benefit of the CPCP is a reduction in billing documentation requirements for the care delivered outside of an office visit and support for delivering more comprehensive care. That said, practices will still be required to document their use of funds to achieve the care delivery requirements. Practices will also be required to report their progress on practice transformation regularly through the CPC+ Practice Portal, which will provide both the practices and CMS insight into practice capabilities. Although the practices are expected to experience a reduction in revenue from fewer coinsurance for office visit E&Ms, the hybrid payment is intended to mitigate this loss.
5.2 Historical PBPM
The historical PBPM represents each CPC+ practice’s E&M payments received from CMS for a group of beneficiaries in a 24-month period before the start of CPC+. The historical PBPM is used to estimate the amount of primary care represented by these E&M payments that practices will likely deliver during the Program Year.
There are two major steps in creating the historical PBPM:
1. Define the historical time period, historical population, and the conditions under which beneficiaries are eligible.
2. Define the types of payments included among the historical population during the historical time period.
The historical calculation period is a two-year time period. For 2017 starters, it is defined as the last two quarters of calendar year 2014 through the first two quarters of calendar year 2016. For 2018 starters, it is defined as the last two quarters of calendar year 2015 through the first two quarters of calendar year 2017.
Page 61 of 112
5.2.1 Historical Population and Eligibility
The historical population includes all beneficiaries attributed to a selected CPC+ practice during the historical calculation period. To determine the historical population, we use historical claims to attribute beneficiaries to practices quarterly during the historical calculation period. To the extent possible, we require attribution for the historical calculation period population to be the same as attribution for the Program Year population to reduce potential differences between these two groups.
CMS uses the attribution methodology described in Chapter 2, which involves identification of eligible beneficiaries, eligible primary care visits, and then application of the attribution algorithm (see Chapter 2 for details). The Tax Identification Numbers and National Provider Identifiers (TINs/NPIs)16 for each CPC+ practice will be used in the attribution, including the TINs/NPIs that were active during the historical period. Beneficiaries are included in the historical calculation for only the applicable portion of the year for which they were eligible.17
5.2.2 Historical Payments
CMS will calculate historical payments from all applicable Medicare Part B E&M payments made to the CPC+ practice for its historical population during the historical calculation period. Claims are eligible if
1. the service date18 on the claim is during a time period when the beneficiary was eligible, 2. the claim includes an office visit E&M service (Appendix I), and 3. the service is provided by an eligible primary care practitioner (Appendix B).
For each CPC+ practice, CMS sums the Medicare FFS payment amount for eligible office visit E&M claims. The Medicare FFS payment amount is the amount of the claim that was actually paid, reflecting applicable payment adjustments (e.g., adjustments for practitioner type, geography, and performance in quality programs). Because sequestration is included in historical payments, CMS will increase historical payments based on historical sequestration amounts. The CPCP payments will then be subject to any current sequestration.
Most practices have two years of historical data to create PBPM estimates. However, if a practice does not, the most recent year of the historical period will be used. If a practice has fewer than 125 beneficiaries attributed for the entirety of the most recent year of the historical period, then the practice is assigned a historical PBPM equal to the median PBPM among CPC+ practices in their region.
16 CCNs may also apply for CPC+ practices with CAHs. Throughout this chapter, when the term TIN is
used, it can be interpreted to mean TIN or CCN. 17 Details on the eligibility criteria are provided in Chapter 2.
18 The service date for most claims is the date the beneficiary received the service (referred to as the “from date” on the claim).
Page 62 of 112
5.2.3 Example Practice Illustration—Main Street CPC
Throughout this chapter, we will illustrate the hybrid payment calculations using a sample practice, which we call Main Street CPC. Please note that these examples should not be interpreted as representing a “typical practice” or an “average impact.”
Main Street CPC has 3,600 eligible, attributed beneficiary months over the two-year historical calculation period, and a corresponding $65,455 of E&M claim payments for these beneficiary months over the two-year historical calculation period. Thus, the historical PBPM for Main Street CPC is as follows:
5.3 CPCP Program Year Calculation
The 2018 CPCP calculation is constructed by adjusting each practice’s historical payments and expressing them in 2018 dollars, as detailed in this section. The historical payments are adjusted to account for comprehensiveness (increased by 10%) and PFS updates. The CPCP payment will be calculated annually, and will be paid quarterly on the basis of the number of attributed beneficiaries for that quarter. At the end of Section 5.3, we illustrate our calculations with Main Street CPC, which we introduced in Section 5.2.3.
5.3.1 Comprehensiveness Supplement
To account for increased depth and breadth, or comprehensiveness, of primary care expected under Track 2, CMS includes a 10% increase to the historical payment, termed the comprehensiveness supplement. The 10% increase was informed by the Affordable Care Act’s Incentive Payments for Primary Care Services (Polsky et al., 2015).19 Therefore, in the calculation of the CPCP for 2018, CMS will multiply the historical PBPM payments from E&M services by 110%.
5.3.2 Physician Fee Schedule (PFS) Updates and Revaluation Changes
Under the PFS, CMS regularly updates the national conversion factor (CF) to set payment rates. In addition, CMS regularly updates the relative value unit (RVU) for each E&M code and the geographic cost price index (GPCI) for each locality.20 Because the historical calculation period uses 2014/2015/2016 payment rates for 2017 starters and 2015/2016/2017 payment
19 Section 5501(a) of The Affordable Care Act. 20 For details on the Medicare physician payment formula, see http://medpac.gov/docs/default-
source/payment-basics/medpac_payment_basics_16_physician_final.pdf?sfvrsn=0.
Page 63 of 112
rates for 2018 starters, CMS adjusts the CPCP calculation using the finalized 2018 payment parameters (CF, RVU, GPCI)21 to express the adjusted historical PBPM in 2018 dollars.
Finally, CMS occasionally introduces new codes into the PFS that may affect primary care and CPC+. We will assess these codes as they become finalized for their relevance to the CPCP.
5.3.3 Adjusted Historical PBPM
A CPC+ practice’s historical PBPM will be adjusted. Specifically, the adjusted historical PBPM is the historical PBPM adjusted for the comprehensiveness supplement (Section 5.3.1) and PFS changes (Section 5.3.2). In Section 5.2.3, we calculated Main Street CPC’s historical calculation period PBPM as $18.18. For this example, let’s assume a 2% PFS update in CF and no change in prices for RVUs or GPCIs (from historical period to 2018). Then the adjusted historical PBPM is as follows:
The 2018 Adjusted Historical E&M PBPM is $20.40.
5.3.4 Calculation for Main Street CPC
Let us assume Main Street CPC had 300 attributed beneficiaries for Q1 of 2018. Main Street CPC chose to receive 25% upfront as the CPCP for 2018.
Quarterly CPCP = 2018 PBPM * number of attributed beneficiaries * 3 months per beneficiary * upfront CPCP election = $20.40 * 300 * 3 * 25% = $4,590
Therefore, in January 2018, Main Street CPC will receive $4,590 for its upfront Q1 2018 CPCP payment.
5.3.5 Frequency of CPCP Calculation and Payment
CMS will calculate the CPCP as a PBPM and make payments to practices quarterly. CPCP payments will start in January 2018, and practices should expect to receive this payment when they receive their quarterly CMF payments.
Figure 5-1 provides a general graphical illustration of the CPCP calculation and payment for Track 2 CPC+ practices during Program Year 2018, including how the adjusted historical PBPM
21 The finalized Physician Fee Schedule rates for 2017 can be found at
https://www.cms.gov/medicare/medicare-fee-for-service-payment/physicianfeesched/.
Page 64 of 112
is calculated, as well as how the CPCP is calculated. Then Figure 5-2 provides a graphical representation of the CPCP calculation and payment for the Main Street CPC example that has been used throughout this chapter.
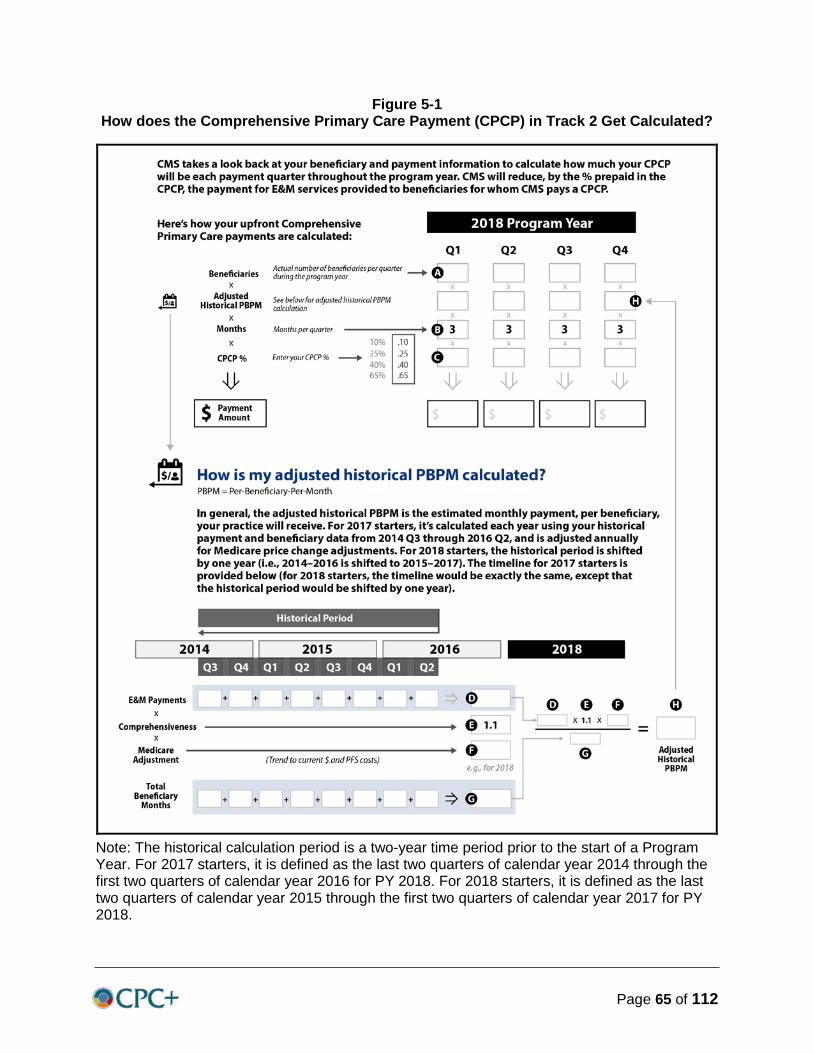
Page 65 of 112
Figure 5-1 How does the Comprehensive Primary Care Payment (CPCP) in Track 2 Get Calculated?
Note: The historical calculation period is a two-year time period prior to the start of a Program Year. For 2017 starters, it is defined as the last two quarters of calendar year 2014 through the first two quarters of calendar year 2016 for PY 2018. For 2018 starters, it is defined as the last two quarters of calendar year 2015 through the first two quarters of calendar year 2017 for PY 2018.
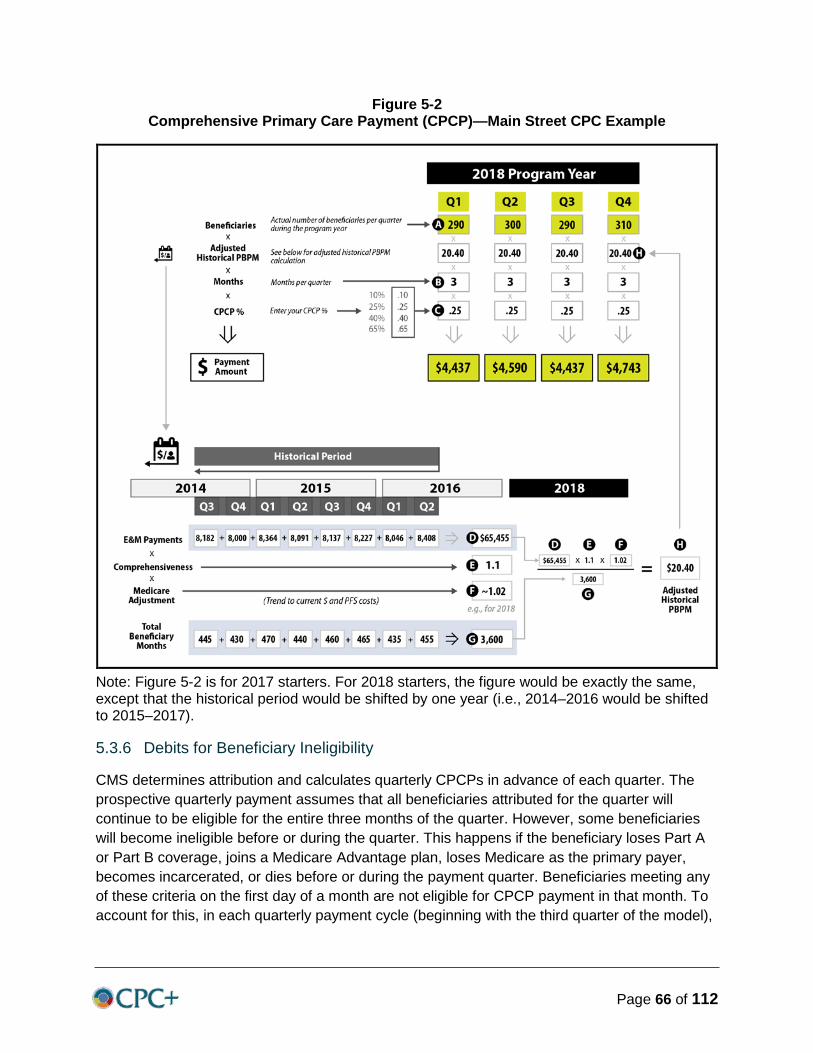
Page 66 of 112
Figure 5-2 Comprehensive Primary Care Payment (CPCP)—Main Street CPC Example
Note: Figure 5-2 is for 2017 starters. For 2018 starters, the figure would be exactly the same, except that the historical period would be shifted by one year (i.e., 2014–2016 would be shifted to 2015–2017).
5.3.6 Debits for Beneficiary Ineligibility
CMS determines attribution and calculates quarterly CPCPs in advance of each quarter. The prospective quarterly payment assumes that all beneficiaries attributed for the quarter will continue to be eligible for the entire three months of the quarter. However, some beneficiaries will become ineligible before or during the quarter. This happens if the beneficiary loses Part A or Part B coverage, joins a Medicare Advantage plan, loses Medicare as the primary payer, becomes incarcerated, or dies before or during the payment quarter. Beneficiaries meeting any of these criteria on the first day of a month are not eligible for CPCP payment in that month. To account for this, in each quarterly payment cycle (beginning with the third quarter of the model),
Page 67 of 112
CMS will determine whether a beneficiary lost eligibility during any prior quarters, and will compute a deduction from the upcoming quarter’s payment to reflect previous overpayments.
5.4 FFS Reduction
For Program Year 2018, there will be a corresponding set of reductions to practice’s FFS payments for the applicable E&M services covered under the CPCP. These reductions are described in this section.
As we described in Section 5.1.2, Track 2 practices will select the annual pace at which they will progress towards one of two hybrid payment options. This selection will occur during the fall preceding the Program Year. Although the CPCP will be paid at the practice level, the corresponding FFS reduction will occur at the practitioner level. CMS claims systems will reduce a Medicare PFS claim billed to Part B only when there is an office visit E&M service by a CPC+ practitioner for an attributed beneficiary during a payment quarter. Otherwise, the claim system will not reduce the claim.
CMS will reduce office visit E&M claims only for attributed beneficiaries with a visit to the primary care practitioners on the CPC+ practitioner roster (i.e., TIN/NPI combinations) as reported to CMS. In the event a CPC+ practitioner bills an office visit E&M for an attributed beneficiary at a non-CPC+ Practice Site with the same TIN as the participating CPC+ practice, the CMS claims systems will apply the CPCP reduction. Finally, the system will not retroactively adjust previously paid claims.
As stated in Section 5.1.3, the CPCP will not affect beneficiary co-insurance for office visits. Additionally, it will not alter Medicare FFS allowed amounts. The claims reduction will follow any other CMS adjustments (e.g., physician value-based payment modifier, Physician Quality Reporting System [PQRS]) and precede sequestration. The paid amount field of the processed claim will indicate to the CPC+ practitioner the post-CPCP reduction amount and final payable amount. Practitioners will continue to receive electronic remittance advice or standard paper remittance.
5.4.1 FFS Calculation for Main Street CPC
Recall that Main Street CPC chose to receive 25% upfront as the CPCP for 2018 with the corresponding 75% in FFS claims. Suppose a CPC+ practitioner at Main Street CPC is normally paid $50 for an office visit E&M provided to an attributed beneficiary. In 2018, the practice will receive $37.50 ($50 * 75% = $37.50) for each office visit E&M claim.
5.5 Partial Reconciliation
We will conduct an annual outside-of-practice partial reconciliation to mitigate risks for both CMS and CPC+ practices that could arise in the absence of reconciliation. Partial reconciliation is meant to accomplish three aims: (1) protect CMS against paying more than expected amounts for office visit E&M services for CPC+ attributed beneficiaries; (2) protect practices in specifically defined situations from financial risk from the hybrid payment compared with pure

Page 68 of 112
FFS; and (3) maintain incentive neutrality for practices, ensuring that they are free to deliver enhanced services but are not incentivized to increase FFS billings to achieve a more favorable financial outcome.
Outside-of-practice partial reconciliation considers the office visit E&Ms that beneficiaries receive from practitioners who are not on the CPC+ Practice Site roster to which the beneficiary is attributed to. It is important for both CMS and CPC+ practices to consider the extent to which an attributed beneficiary’s practice is increasing or decreasing office visit E&M services that are being delivered outside of the CPC+ practice.
CMS presumes that beneficiaries will tend to increase the amount of primary care they seek elsewhere if they are not satisfied with the care they receive from their CPC+ practice. Thus, increases in office visit E&M services delivered by primary care practitioners outside of the CPC+ practice to CPC+ practice attributed beneficiaries would lead to a partial downward adjustment of the CPCP. Conversely, significant decreases in office visit E&M services delivered by primary care practitioners in an office setting outside of the CPC+ practice could also lead to an additional payment to CPC+ practices. For instance, in rare cases, a practice could see substantial decreases in office visit E&M volume if services were being delivered by other practices that previously were delivered by the CPC+ practice. The CPCP should not reward a practice in such a situation. Conversely, in rare cases, a CPC+ practice could see substantial increases in office visit E&M volume by delivering services that previously were delivered by other primary care practices to its attributed beneficiaries. The CPCP should not penalize a practice in such a situation. Thus, the purpose of the outside-of-practice partial reconciliation is to account for difference between (1) adjusted historical PBPM revenue and (2) Program Year PBPM revenue for office visit E&M services for attributed beneficiaries from primary care practitioners delivered outside the CPC+ practice.
There are three major steps to conducting the outside-practice reconciliation:
1. Calculate the office visit E&M PBPM expenditures for attributed beneficiaries delivered outside of the CPC+ practice during the historical calculation period.
2. Calculate the office visit E&M PBPM expenditures for attributed beneficiaries delivered outside of the CPC+ practice during the Program Year.
3. Determine reconciliation amount based on comparison of the PBPM from the historical calculation period and the PBPM from the Program Year (from Steps 1 and 2).22
a. If outside-of-practice PBPM is between $2–7 PBPM larger in 2017 than it was in the calculation period, then CMS will reduce payment to the CPC+ practice down to the $2 PBPM difference.
22 Note that as subsequent program years become more distant from the historical calculation period, it
may become necessary to adjust the historical calculation period for this reconciliation to improve the comparability of the historical calculation period to the program year. Because this reconciliation is calculated independently of the other components of the CPCP calculation, this can be done without changing the historical calculation period used for other aspects of this methodology. CMS will monitor whether it is necessary to adjust the calculation year for calculating outside-of-practice reconciliation and inform practices in advance of any changes. Changes will be made if distortions between the historical calculation period and the program year start to penalize practices.
Page 69 of 112
b. If outside-of-practice PBPM is between $2–7 PBPM smaller in 2017 than it was in the calculation period, then CMS will increase payment to the CPC+ practice up to the $2 PBPM difference.
c. We are capping reconciliation at $7 PBPM, such that the maximum amount to be credited or debited through future CPCPs is $5 PBPM.
d. If the absolute difference is not greater than $2 PBPM, then no reconciliation occurs.
CMS expects a small minority of practices to be subject to this reconciliation. We chose $2 PBPM-$7 PBPM as our reconciliation corridor through an analysis of the data from the CPC Classic. Overall, approximately 75–80% of office visit E&M services from primary care practitioners were delivered within the practice in the CPC Classic. The average was $16–17 PBPM within the CPC practice and $4–5 PBPM outside the CPC practice. Approximately 10% of practices had changes in out-of-practice expenditures greater than $2 per beneficiary per month (in either direction), while less than 3% of practices had changes in out-of-practice expenditures greater than $7 per beneficiary per month (in either direction). We will modify subsequent CPCP payments by any change beyond +/− $2 and lower than +/− $7. For those with changes greater than $7, CMS is capping the reconciliation because such large changes are likely due more to changes in provider billing (e.g., billing under different TINs, only one of which is in the CPC+ practice).
We now proceed in explaining in more detail the three major steps to conducting the outside-practice reconciliation:
Step 1: Calculate the office visit E&M PBPM expenditures for attributed beneficiaries delivered outside of the CPC+ practice during the historical calculation period. CMS calculates total office visit E&M PBPM expenditures from all primary care practitioners not on the CPC+ practitioner roster (including primary care practitioners not participating in CPC+) for beneficiaries attributed to the practice.
When calculating office visit E&M expenditures during the historical calculation period, CMS will consider only beneficiary months of experience for when the beneficiary was eligible and attributed, as we described in Section 5.2. CMS will adjust for PFS updates and revaluation changes from the historical period (from Section 5.3.2). Because we will be comparing historical calculation period expenditures to Program Year expenditures, the historical calculation period expenditures must be expressed in current Program Year dollars. Finally, CMS will not include the Comprehensiveness Supplement because practices outside of CPC+ will not be receiving it.
To illustrate, in the historical calculation period, Main Street CPC has a historical population of 3,600 attributed beneficiary months. The attributed beneficiaries received $21,600 worth of office visit E&M services outside of Main Street CPC for these beneficiary months. The PBPM of office visit E&M services delivered outside of Main Street CPC for attributed beneficiaries in the historical calculation period is $6 PBPM, or $21,600/3,600 beneficiary months.
Step 2: Calculate the office visit E&M PBPM expenditures for attributed beneficiaries delivered outside of the CPC+ practice during the current Program Year.
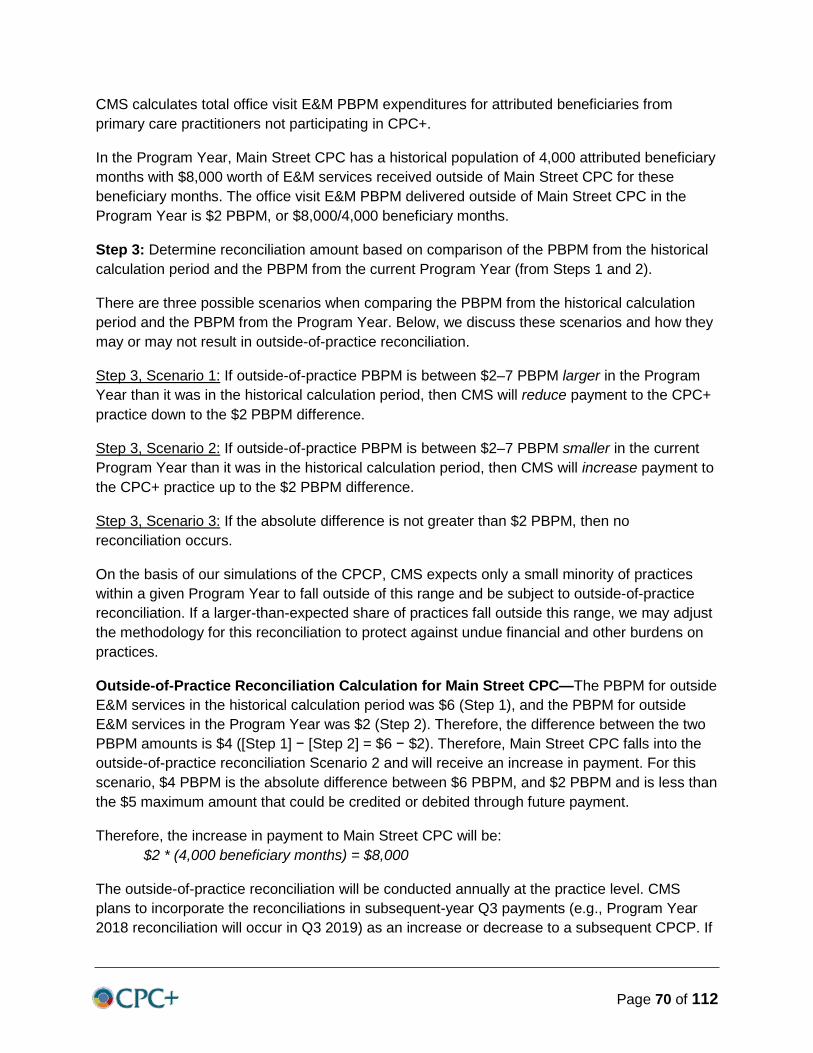
Page 70 of 112
CMS calculates total office visit E&M PBPM expenditures for attributed beneficiaries from primary care practitioners not participating in CPC+.
In the Program Year, Main Street CPC has a historical population of 4,000 attributed beneficiary months with $8,000 worth of E&M services received outside of Main Street CPC for these beneficiary months. The office visit E&M PBPM delivered outside of Main Street CPC in the Program Year is $2 PBPM, or $8,000/4,000 beneficiary months.
Step 3: Determine reconciliation amount based on comparison of the PBPM from the historical calculation period and the PBPM from the current Program Year (from Steps 1 and 2).
There are three possible scenarios when comparing the PBPM from the historical calculation period and the PBPM from the Program Year. Below, we discuss these scenarios and how they may or may not result in outside-of-practice reconciliation.
Step 3, Scenario 1: If outside-of-practice PBPM is between $2–7 PBPM larger in the Program Year than it was in the historical calculation period, then CMS will reduce payment to the CPC+ practice down to the $2 PBPM difference.
Step 3, Scenario 2: If outside-of-practice PBPM is between $2–7 PBPM smaller in the current Program Year than it was in the historical calculation period, then CMS will increase payment to the CPC+ practice up to the $2 PBPM difference.
Step 3, Scenario 3: If the absolute difference is not greater than $2 PBPM, then no reconciliation occurs.
On the basis of our simulations of the CPCP, CMS expects only a small minority of practices within a given Program Year to fall outside of this range and be subject to outside-of-practice reconciliation. If a larger-than-expected share of practices fall outside this range, we may adjust the methodology for this reconciliation to protect against undue financial and other burdens on practices.
Outside-of-Practice Reconciliation Calculation for Main Street CPC—The PBPM for outside E&M services in the historical calculation period was $6 (Step 1), and the PBPM for outside E&M services in the Program Year was $2 (Step 2). Therefore, the difference between the two PBPM amounts is $4 ([Step 1] − [Step 2] = $6 − $2). Therefore, Main Street CPC falls into the outside-of-practice reconciliation Scenario 2 and will receive an increase in payment. For this scenario, $4 PBPM is the absolute difference between $6 PBPM, and $2 PBPM and is less than the $5 maximum amount that could be credited or debited through future payment.
Therefore, the increase in payment to Main Street CPC will be: $2 * (4,000 beneficiary months) = $8,000
The outside-of-practice reconciliation will be conducted annually at the practice level. CMS plans to incorporate the reconciliations in subsequent-year Q3 payments (e.g., Program Year 2018 reconciliation will occur in Q3 2019) as an increase or decrease to a subsequent CPCP. If
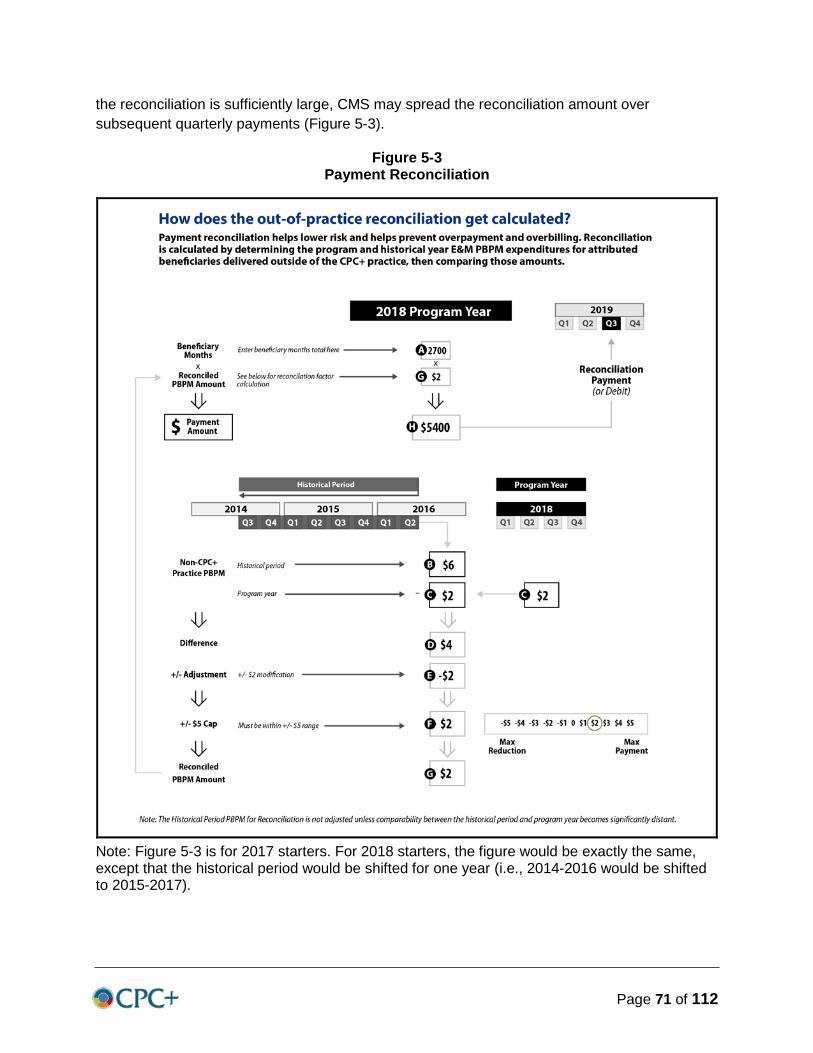
Page 71 of 112
the reconciliation is sufficiently large, CMS may spread the reconciliation amount over subsequent quarterly payments (Figure 5-3).
Figure 5-3 Payment Reconciliation
Note: Figure 5-3 is for 2017 starters. For 2018 starters, the figure would be exactly the same, except that the historical period would be shifted for one year (i.e., 2014-2016 would be shifted to 2015-2017).

Page 72 of 112
[This page was intentionally left blank.]
Page 73 of 112
Chapter 6: Conclusions CPC+ payment system redesign is aimed to ensure practices have the infrastructure to deliver better care, smarter spending, and healthier people. With the combination of the CMF, PBIP, and Medicare FFS payment (regular FFS for Track 1 or hybrid payment for Track 2), CMS provides strong financial support to practices to expand the breadth and depth of the services they provide in order to better meet the need of their patient population.

Page 74 of 112
[This page was intentionally left blank.]

Page 75 of 112
References Adams, J.L., Mehrota, A., McGlynn, E.A.: Estimating Reliability and Misclassification in Physician Profiling. Technical Report. Santa Monica, CA: RAND Corporation; 2010. http://www.rand.org/content/dam/rand/pubs/technical_reports/2010/RAND_TR863.pdf.
Agency for Healthcare Research and Quality (AHRQ): Instructions for Analyzing Data from CAHPS® Surveys: Using the CAHPS Analysis Program Version 4.1. Document No. 2015. https://cahpsdatabase.ahrq.gov/files/CGGuidance/Instructions%20for%20Analyzing%20CAHPS%20Surveys.pdf. Last updated on April 2, 2012.
Agency for Healthcare Research and Quality (AHRQ): Comparability of Results for the 2.0 and 3.0 Versions of the CAHPS Clinician & Group Survey. http://www.ahrq.gov/sites/default/files/wysiwyg/cahps/surveys-guidance/cg/Comparison_of_CG-CAHPS_v3_and_v2.pdf. As obtained on January 13, 2017.
Audet, A-M., and Zenna, M.: How Behavioral Economics Can Advance the Design of Effective Clinician Incentive Programs. Health Affairs Blog, September 2015.
Center for Medicare & Medicaid Innovation, Seamless Care Models Group: Comprehensive Primary Care Plus (CPC+): Request for Applications. Version 3.3. Baltimore, MD. U.S. Department of Health and Human Services, Centers for Medicare & Medicaid Services, Center for Medicare & Medicaid Innovation. Last updated January 6, 2017. Available from https://innovation.cms.gov/files/x/cpcplus-rfa.pdf.
Chernew, M.E., Mechanic, R.E., Landon, B.E., and Safran, D.G.: Private-Payer Innovation in Massachusetts: The ‘Alternative Quality Contract’. Health Affairs 30(1):51–61, 2011.
Chung, S., Palaniappan, L.P., Trujillo, L.M., Rubin, H.R., and Luft, H.S.: Effect of Physician-Specific Pay-for-Performance Incentives in a Large Group Practice. American Journal of Managed Care 16(2):e35–e42, 2010.
Damberg, C.L., Sorbero, M., Mehrotra, A., Teleki, S., Lovejoy, S., and Bradley, L.: An Environmental Scan for Pay for Performance in the Hospital Setting: Final Report. Santa Monica, CA: RAND Health. Prepared for the Assistant Secretary for Planning and Evaluation, U.S. Department of Health and Human Services, 2008.
Davis, K., Schoenbaum, S.C., and Audet, A.M.: A 2020 Vision of Patient-Centered Family Care. Journal of General Internal Medicine 20:953–957, 2005.
Goroll, A.H., Berenson, R.A., Schoenbaum, S.C., and Gardner, L.B.: Fundamental Reform of Payment for Adult Primary Care: Comprehensive Payment for Comprehensive Care. Journal of General Internal Medicine 22:410–415, 2007.
Khuller, D., Chokshi, D.A., Kocher, R., Reddy, A., Basu, K., Conway, P., and Rajkumar, R.: Behavioral Economics and Physician Compensation—Promise and Challenges. New England Journal of Medicine 372:2281–2283, 2015.
Page 76 of 112
Maeng, D.D., Khan, N., Tomcavage, J., Graf, T.R., Davis, D.E., and Steele, G.D.: Reduced Acute Inpatient Care was Largest Savings Component of Geisinger Health System’s Patient-Centered Medical Home. Health Affairs 34(4):636–644, April 2015.
Mehrotra, A., Sorbero, M.E.S., and Damberg, C.L.: Using the Lessons of Behavioral Economics to Design More Effective Pay-for-Performance Programs. American Journal of Managed Care 16(7):497–503, July 2010.
National Committee for Quality Assurance (NCQA): HEDIS and Performance Measurement. http://www.ncqa.org/hedis-quality-measurement/hedis-measures. As obtained on January 3, 2017.
Petersen, L.A., Simpson, K., Pietz, K., Urech, T.H., Hysong, S.J., et al.: Effects of Individual Physician-Level and Practice-Level Financial Incentives on Hypertension Care: A Cluster Randomized Trial. JAMA 310(10):1042–1050, September 11, 2013.
Polsky, D., Richards, M., Basseyn, S., Wissoker, D., Kenney, G.M., Zuckerman, S., and Rhodes, K.V.: Appointment availability after increases in Medicaid payments for primary care. New England Journal of Medicine 372(6):537–545, 2015.
Robinson, J.C.: Theory and practice in the design of physician payment incentives. The Milbank Quarterly 79(2), 2001.
Vats, S., Ash, A.S., and Ellis, R.P.: Bending the Cost Curve? Results from a Comprehensive Primary Care Pilot. Medical Care 51:964–969, 2013.
Yu, H., Mehrotra, A., and Adams, J.: Reliability of Utilization Measures for Primary Care Physician Profiling. Healthcare 1:22–29, 2013.
Page 77 of 112
Appendix A: Glossary of Terms Absolute Performance Thresholds: The minimum and maximum thresholds that practices are measured against for the performance-based incentive payment measures. In Program Year 2018, the minimum threshold is the 30th percentile of performance in the benchmark population for clinical quality and patient experience of care, and the 50th percentile of performance in the benchmark population for utilization; while the maximum threshold is the 70th percentile of performance in the benchmark population for clinical quality and patient experience of care, and the 80th percentile of performance in the benchmark population for utilization. The thresholds are determined by a benchmark population external to Comprehensive Primary Care Plus (CPC+) participation.
Accountable Care Organizations (ACOs): Accountable Care Organizations (ACOs) are groups of doctors, hospitals, and other health care providers, who come together voluntarily to give coordinated high quality care to their Medicare patients. The Centers for Medicare & Medicaid Services (CMS) offers several ACO programs and models: the Medicare Shared Savings Program; ACO Investment Model—a supplementary incentive program for selected participants in the Shared Savings Program; and Next Generation ACO Model—designed for early adopters of coordinated care.
Adjusted Historical Per Beneficiary Per Month (PBPM): The historical PBPM for a CPC+ practice adjusted for both the comprehensiveness supplement and for Medicare Physician Fee Schedule updates between the historical calculation period and the Program Year.
Alternative Payment Models (APMs): Payment approaches, developed in partnership with the clinician community, that provide added incentives to deliver high-quality and cost efficient care. APMs can apply to a specific clinical condition, a care episode, or a population.
Advanced Alternative Payment Model (Advanced APM): An alternative payment model that requires participants to use certified EHR technology, bases payment on quality measures comparable to those in the Merit-Based Incentive Payment System (MIPS), and where participants bear more than nominal financial risk; or an APM Medical Home Model expanded under Innovation Center authority.
Attribution: A tool used to assign beneficiaries to primary care practices. In CPC+, attribution is used to estimate the amount of care management fees, performance-based incentive payments, and, for Track 2 practices, the hybrid payment. CMS uses Medicare claims and eligibility data to conduct beneficiary attribution.
Benchmark Thresholds: A benchmark is sustained superior performance by a medical care clinician, which can be used as a reference to raise the mainstream of care for Medicare beneficiaries. The benchmarks establish the minimum levels that CPC+ practices must reach to retain a portion of the incentive payment and the maximum levels that practices must achieve to retain the full incentive payment.
Page 78 of 112
CAHPS®: Consumer Assessment of Healthcare Providers and Systems (CAHPS®) surveys ask consumers and patients to report on and evaluate their experiences with health care. These surveys cover topics that are important to consumers and focus on aspects of quality that consumers are best qualified to assess, such as the communication skills of providers and ease of access to health care services. The acronym "CAHPS" is a registered trademark of the Agency for Healthcare Research and Quality (AHRQ).
CG CAHPS: The CAHPS Clinician & Group Survey (CG-CAHPS) assesses patients' experiences with health care providers and staff in doctors' offices. Survey results can be used to: Improve care provided by individual providers, sites of care, medical groups, or provider networks; and to equip consumers with information they can use to choose physicians and other health care providers, physician practices, or medical groups.
Care Management Fee (CMF): CMS pays selected primary care practices a care management fee to support enhanced, coordinated services for Medicare beneficiaries. CPC+ practices will receive a risk-adjusted, prospective, monthly care management fee (CMF) for their attributed Medicare fee-for-service patients. Practices will use this enhanced, non-visit-based compensation to augment staffing and training in support of population health management and care coordination.
Chronic Care Management (CCM)–Related Services: (CPT codes 99358, 99484, 99487, 99490, G0506, and G0507) that are duplicative of the services covered by the CPC+ Care Management Fee (CMF). Medicare will not pay both a CPC+ CMF and fees for CCM-related services for any individual beneficiary in the same month.
CMF Reference Population: The region-specific population is used to determine the risk tier thresholds on which the care management fees are based. For a given region, the CMF reference population includes Medicare FFS beneficiaries in that region who meet CPC+ eligibility requirements and who have had an eligible primary care visit.
CMS Certification Number: In order to avoid confusion with the National Provider Identifier, the Medicare/Medicaid Provider Number (also known as the OSCAR Provider Number, Medicare Identification Number or Provider Number) has been renamed the CMS Certification Number (CCN). The CCN continues to serve a critical role in verifying that a clinician has been Medicare certified and for what type of services.
Comprehensiveness: Increased depth and breadth (length and/or intensity) of primary care services furnished by the CPC+ practice.
Comprehensiveness Supplement: Increase of 10% in historical PBPM to account for comprehensiveness.
Comprehensive Primary Care (CPC) Classic: The Comprehensive Primary Care (CPC) Classic was a multipayer initiative designed to strengthen primary care. The CPC Classic ran from October 2012 through December 2016, and was a predecessor to CPC+.
Page 79 of 112
Comprehensive Primary Care Payment (CPCP): The CPCP is an upfront payment to a Track 2 CPC+ practice for a percentage of expected Medicare payments for Evaluation and Management (E&M) services provided through the Physician Fee Schedule (PFS) to aligned beneficiaries. E&M visits billed during the Program Year will be correspondingly decreased. The CPCP compensates clinicians for clinical services that have been traditionally billable but offers flexibility for these services to be delivered inside or outside of an office visit and in accordance with patient preferences. The flexibility is intended to allow more time to be devoted to increasing the breadth and depth of services provided at the practice site and for population health improvement.
Comprehensive Primary Care Plus (CPC+): A national advanced primary care medical home model that aims to strengthen primary care through a regionally-based multipayer payment reform and care delivery transformation. CPC+ will include two primary care practice tracks with incrementally advanced care delivery requirements and payment options to meet the diverse needs of primary care practices in the United States. The care delivery redesign ensures practices in each track have the infrastructure to deliver better care to result in a healthier patient population. The multipayer payment redesign will give practices greater financial resources and flexibility to make appropriate investments to improve the quality and efficiency of care, and reduce unnecessary health care utilization. CPC+ will provide practices with a robust National Learning Network, as well as actionable patient-level cost and utilization data feedback, to guide their decision making. CPC+ is a five-year model that began in January 2017 for 2017 starters and will begin in January 2018 for 2018 starters.
Conversion Factor (CF): In calculating payment rates under the physician fee schedule, each of the three relative value units is adjusted to reflect the price of inputs in the local market where the service is furnished. The fee schedule payment amount is then determined by summing the adjusted weights and multiplying the total by the fee schedule conversion factor (CF).
CPCP: Comprehensive primary care payment (See Comprehensive Primary Care Payment (CPCP) above).
eCQM: Electronic Clinical Quality Measure. (See Electronic Clinical Quality Measure (eCQM) below.)
Electronic Clinical Quality Measure (eCQM): Clinical quality measures that use data from electronic health records (EHR) and/or health information technology systems to measure health care quality. The Centers for Medicare & Medicaid Services (CMS) use eCQMs in a variety of quality reporting and incentive programs.
Eligible Primary Care Visit: A primary care visit that is used in the CPC+ attribution algorithm. Primary care services include evaluation and management services provided in office and other non-inpatient and non–emergency-room settings, as well as initial Medicare visits and annual wellness visits. Specifically, eligible primary care visits include home care; welcome to Medicare and annual wellness visits; advance care planning; collaborative care model; cognition and functional assessment for payment with cognitive impairment; outpatient clinic visit for assessment and management (CAHs only); transitional care management services; chronic
Page 80 of 112
care management services; complex chronic care management services; assessment/care planning for payments with CCM services; and care management services for behavioral health conditions.
Emergency Department Utilization (EDU): The component of the performance-based incentive payment that measures practice performance on emergency department utilization.
Evaluation & Management (E&M) Office Visits: Medicare covered services (office visits) used in the calculation of the CPCP, furnished by a Participating CPC+ Practitioner to a CPC+ Beneficiary and billed under the TIN/NPI (or CCN/NPI) of the CPC+ Practice using one or more of the following Current Procedural Terminology (CPT) codes: 99201, 99202, 99203, 99204, 99205, 99211, 99212, 99213, 99214, 99215, 99354, and 99355.
Fee-For-Service (FFS): A method in which clinicians are paid for each service performed based on a payment fee schedule. Examples of services include tests and office visits.
Fee-For-Service (FFS) Reduction: The percentage by which a Track 2 CPC+ Practice’s payment for Evaluation and Management Services is reduced if such services are furnished by a Participating CPC+ Practitioner to a CPC+ Beneficiary and billed under the TIN/NPI (or CCN/NPI) of the CPC+ Practice for its attributed beneficiaries.
Flat percentages: Absolute percentages values that may be used as the minimum and maximum performance measurement thresholds for the performance-based incentive payment.
Geographic Price Cost Index (GPCI): In calculating payment rates under the physician fee schedule, each of the three relative value units is adjusted to reflect the price of inputs in the local market where the service is furnished. Separate geographic practice cost indexes (GPCIs) are used for this purpose.
Historical PBPM: The historical PBPM represents each CPC+ practice’s E&M payments received from CMS for a similar group of beneficiaries in a 24-month period before the start of CPC+.
Historical Calculation Period: The time period for which historical payments are calculated for a CPC+ practice’s historical population (July 2014 to June 2016 for 2017 starters, and July 2015 to June 2017 for 2018 starters).
Historical Payment: Applicable Medicare Part B E&M payments made to the CPC+ practice for its historical population during the historical calculation period.
Historical Population: The historical population includes all beneficiaries attributed to a selected CPC+ practice during the historical calculation period. To determine the historical population, historical claims are used to attribute beneficiaries to practices quarterly during the historical calculation year.
Page 81 of 112
Hybrid Payment: Together, the Comprehensive Primary Care Payment (CPCP) and the corresponding Fee-For-Service (FFS) Reduction are termed the “hybrid payment,” which is for practices participating in Track 2 of CPC+.
Hybrid Payment Ratio: The annual pace at which a Track 2 CPC+ practice will progress towards one of two hybrid payment options: one option will pay 40% upfront and 60% of the applicable FFS payment, and the other will pay 65% upfront and 35% of the applicable FFS payment.
Incentive Neutrality: The incentive to bring a patient to the office is balanced with the incentive to provide the needed care outside of an office visit, making a practice agnostic as to whether they deliver a service in person or via another modality so the care can be delivered according to patient preferences.
Inpatient Hospital Utilization (IHU): The component of the performance-based incentive payment that measures practice performance on inpatient hospital utilization.
Look Back Period: The attribution look back period is the 24-month period ending three months prior to the start of the quarter. To be attributed to a practice, a patient must have received the plurality of their primary care health services at the practice during this look back period.
Medicare Physician Fee Schedule: Medicare Part B Physician Fee Schedule (PFS), used to pay physicians and other Part B clinicians.
Medicare Shared Savings Program: The Medicare Shared Savings Program (Shared Savings Program) was established by section 3022 of the Affordable Care Act. The Shared Savings Program is a key component of the Medicare delivery system reform initiatives included in the Affordable Care Act and is a new approach to the delivery of health care.
Merit-based Incentive Payment Systems (MIPS): One of two avenues to reward the delivery of high-quality patient care for eligible clinicians or groups under the Physician Fee Schedule (PFS) in the Quality Payment Program Final Rule. MIPS will consolidate components of three existing programs, the Physician Quality Reporting System (PQRS), the Physician Value-based Payment Modifier (VM), and the Medicare Electronic Health Record (EHR) Incentive Program for Eligible Professionals (EPs), and will continue the focus on quality, cost, and use of certified EHR technology (CEHRT) in a cohesive program that avoids redundancies.
National Provider Identifier (NPI): The National Provider Identifier (NPI) is a Health Insurance Portability and Accountability Act (HIPAA) Administrative Simplification Standard. The NPI is a unique identification number for covered health care providers. Covered health care providers and all health plans and health care clearinghouses must use the NPIs in the administrative and financial transactions adopted under HIPAA. The NPI is a 10-position, intelligence-free numeric identifier (10-digit number). This means that the numbers do not carry other information about healthcare clinicians, such as the state in which they live or their medical specialty. The NPI must be used in lieu of legacy provider identifiers in the HIPAA standards transactions.
Page 82 of 112
Partial Reconciliation: CMS will conduct an annual outside-of-practice partial reconciliation of the hybrid payment to mitigate risks for both CMS and CPC+ practices that could arise in the absence of reconciliation. Partial reconciliation is meant to accomplish three aims: (1) protect CMS against paying more than expected amounts for office visit E&M services for CPC+ attributed beneficiaries; (2) protect practices in specifically defined situations from financial risk from the hybrid payment compared with pure FFS; and (3) maintain incentive neutrality for practices, ensuring that they are free to deliver enhanced services but are not incentivized to increase FFS billings to achieve a more favorable financial outcome.
Per Beneficiary Per Month (PBPM): Per Beneficiary Per Month.
Performance Based Incentive Payment (PBIP): An annual prospective performance-based payment made by CMS to the CPC+ Practice for a Program Year that reflects the performance score that CMS expects the CPC+ Practice to achieve during that Program Year based on its performance on quality measures, patient experience of care measures, and utilization measures.
Performance Standards: CMS established and approved objectives that are uniformly established and must be met at a particular level.
Physician Quality Reporting System (PQRS): The Physician Quality Reporting System (PQRS) is a quality reporting program that encourages individual eligible professionals (EPs) and group practices to report information on the quality of care to Medicare. PQRS gives participating EPs and group practices the opportunity to assess the quality of care they provide to their patients, helping to ensure that patients get the right care at the right time.
Program Year: A year in which CMS pays CPCPs, PBIPs, and/or CMFs to eligible practices participating in CPC+.
Quality Component: The component of the performance-based incentive payment that measures practice performance on clinical quality and patient experience of care. Clinical quality will be measured using nine Electronic Clinical Quality Measures (eCQMs) while patient experience will be measured using Consumer Assessment of Healthcare Providers and Systems Clinician and Group Patient-Centered Medical Home Survey (CG CAHPS). The CG CAHPS measures contributes 25% to the practice’s score for the Quality Component, and the eCQM measures contribute 75%.
Quality Payment Program Final Rule: New approach to payment that rewards the delivery of high-quality patient care through two avenues: Advanced Alternative Payment Models (Advanced APMs) and the Merit-based Incentive Payment System (MIPS) for eligible clinicians or groups under the PFS. This final rule with comment period establishes incentives for sufficient participation in certain Alternative Payment Models (APMs) and includes the criteria for use by the Physician-Focused Payment Model Technical Advisory Committee (PTAC) in making comments and recommendations on physician focused payment models (PFPMs).
Page 83 of 112
Quality Reporting Document Architecture Category III (QRDA-III): A QRDA-III report is an aggregate quality report using data collected in patient-level QRDA-I reports. Each QRDA-III report contains calculated summary data for one or more measures for a specified population of patients within a particular health system over a specific period of time. Summary data in the QRDA-III report are defined in the HL7 Health Quality Measures Format (HQMF), which standardizes the representation of a health quality measure as an electronic document.
Relative Value Unit (RVU): Under the physician fee schedule, payment rates are based on relative weights, called relative value units (RVUs), which account for the relative costliness of the inputs used to provide physician services: physician work, practice expenses, and professional liability insurance.
Sequestration: A process of spending reductions to enforce certain budget policy goals. Percentage payment reductions (2%) made under Medicare Part B made to individual payments to clinicians for services (e.g., hospital and physician services) rather than to fee schedule allowable charges; the patient’s cost sharing amount remains unchanged.
Taxpayer Identification Number (TIN): A Taxpayer Identification Number (TIN) is an identification number used by the Internal Revenue Service (IRS) in the administration of tax laws. It is issued either by the Social Security Administration (SSA) or by the IRS.
Track 1: One of two payment options that participating practices may select under CPC+. Track 1 is the choice for practices ready to build the capabilities to deliver comprehensive primary care. Practices that select Track 1 will receive a care management fee (CMF) of $15 per-beneficiary-per-month (PBPM) average across four risk tiers, a $2.50 PBPM performance-based incentive payment (PBIP) based on quality and utilization metrics, and will continue to receive 100% Medicare fee-for-service (FFS) payment for Evaluation and Management (E&M) office visits. (See definition of Track 2 below.)
Track 2: One of two payment options that participating practices may select under CPC+. Track 2 is targeted to practices that have built the capabilities for comprehensive primary care and are poised to increase the comprehensiveness of care and improve care for patients with complex needs. Practices that select Track 2 will receive a CMF of $28 PBPM average across five risk tiers and $100 for the highest-risk tier, and a $4.00 PBPM PBIP based on quality and utilization metrics. In addition, Track 2 practices will receive a hybrid payment that includes a prospective CPCP and a corresponding reduction of their Medicare FFS payment for specific E&M office visits provided to aligned beneficiaries. (See definition of Track 1 above.)
Utilization Component: The component of the performance-based incentive payment that measures practice performance on two measures, inpatient hospital utilization and emergency department utilization. Inpatient utilization is given twice the weight of emergency department utilization. To be eligible for the Utilization Component of the incentive payment, practices must meet the minimum performance required for each segment of the Quality Component.
Value Based Payment Modifier (VBPM): The Value Based Payment Modifier (VBPM) provides for differential payment to a physician or group of physicians under the Medicare

Page 84 of 112
Physician Fee Schedule (PFS) based upon the quality of care furnished compared to the cost of care during a performance period. The VBPM is an adjustment made to Medicare payments for items and services under the Medicare PFS. It is applied at the Taxpayer Identification Number (TIN) level to physicians (and beginning in 2018, to certain non-physician eligible professionals [EPs]billing under the TIN).
Voluntary Alignment: A method by which a Medicare FFS beneficiary confirm their primary care practitioner. It is currently being tested in certain Medicare ACO models.
2017 Starters: Practices that started participating in CPC+ at the beginning of 2017. These practices are located in the 14 CPC+ Round 1 Participating Regions.
2018 Starters: Practices that will start participating in CPC+ at the beginning of 2018. These practices are located in the four CPC+ Round 2 Participating Regions.

Page 85 of 112
Appendix B: Primary Care Specialty Codes Family Medicine—207Q00000X Adult Medicine—207QA0505X Geriatric Medicine—207QG0300X Hospice and Palliative Medicine—207QH0002X
General Practice—208D00000X
Internal Medicine—207R00000X Geriatric Medicine—207RG0300X Hospice and Palliative Medicine—207RH0002X
Clinical Nurse Specialist—364S00000X Acute Care—364SA2100X Adult Health—364SA2200X Chronic Care—364SC2300X Community Health/Public Health—364SC1501X Family Health—364SF0001X Gerontology—364SG0600X Holistic—364SH1100X Women’s Health—364SW0102X
Nurse Practitioner—363L00000X Acute Care—363LA2100X Adult Health—363LA2200X Community Health—363LC1500X Family—363LF0000X Gerontology—363LG0600X Primary Care—363LP2300X Women's Health—363LW0102X
Physician Assistant—363A00000X Medical—363AM0700X

Page 86 of 112
[This page was intentionally left blank.]
Page 87 of 112
Appendix C: Description of CMS-HCC Risk Adjustment Model The Centers for Medicare & Medicaid Services (CMS) uses the CMS Hierarchical Condition Categories (HCC) risk adjustment model to adjust capitation payments made to Medicare Advantage (MA) and Medicare Program of All-Inclusive Care for the Elderly (PACE) plans, with the intention of paying health plans appropriately for their expected relative costs. For example, a health plan enrolling a relatively healthy population receives lower payments than one enrolling a relatively sick population, other things equal. The CMS-HCC model produces a risk score, which measures a person’s or a population’s health status relative to the average, as applied to expected medical expenditures. A population with a risk score of 2.0 is expected to incur medical expenditures twice that of the average, and a population with a risk score of 0.5 is expected to incur medical expenditures half that of the average. It is important to note that the model is accurate at the group level and that actual expenditures for any individual can be higher or lower (sometimes significantly) than those predicted.
The CMS-HCC model is a prospective model using demographic and diagnosis information from a base year to estimate expenditures in the next year. For example, risk scores for 2016 (risk score year) are calculated using diagnosis information from 2015 (the base year). New Medicare enrollees (defined here as beneficiaries with less than 12 months of Medicare enrollment in the base year) receive a risk score from the new enrollee risk adjustment model, which is a demographic-only model. If a beneficiary does not have 12 months of enrollment in the base year, the beneficiary cannot have had a complete diagnosis profile in the base year, and hence the CMS-HCC model cannot be used for the beneficiary. Because of the amount of time required to ensure that as many diagnoses are captured in the risk score development as possible, risk scores for any year are not available until at least twelve months after the close of the base year.
The demographic characteristics used are age, sex, Medicaid status, and originally disabled status. The diagnosis information used is the set of diagnosis codes reported on Medicare claims in the base year. Not all types of Medicare claims are used—only Hospital Inpatient, Hospital Outpatient, Physician, and some non-Physician claims are considered. The source of a particular diagnosis code has no relevance (i.e., diagnoses from an Inpatient hospitalization have equal weight as those from a Physician visit), nor does the frequency with which the diagnosis code has been reported.
The CMS-HCC diagnostic classification system begins by classifying all ICD-9-CM diagnosis codes into Diagnostic Groups, or DXGs. Each ICD-9-CM code maps to exactly one DXG, which represents a well-specified medical condition or set of conditions, such as the DXG for Type II Diabetes with Ketoacidosis or Coma. DXGs are further aggregated into Condition Categories (CCs). CCs describe a broader set of similar diseases. Although they are not as homogeneous as DXGs, diseases within a CC are related clinically and with respect to cost. An example is the CC for Diabetes with Acute Complications, which includes, in addition to the DXG for Type II Diabetes with Ketoacidosis or Coma, the DXGs for Type I Diabetes and Secondary Diabetes (each with ketoacidosis or coma).

Page 88 of 112
Hierarchies are imposed among related Clinical Conditions (CCs) so that a person is coded for only the most severe manifestation among related diseases. After imposing hierarchies, CCs become Hierarchical Condition Categories (HCCs). For example, diabetes diagnosis codes are organized in the Diabetes hierarchy, consisting of three CCs arranged in descending order of clinical severity and cost, from (1) Diabetes with Acute Complications to (2) Diabetes with Chronic Complications to (3) Diabetes without Complication. Thus, a person with diagnosis code of Diabetes with Acute Complications is excluded from being coded with Diabetes with Chronic Complications and is also excluded from being coded with Diabetes without Complication. Similarly, a person with a diagnosis code of Diabetes with Chronic Complications is excluded from being coded with Diabetes without Complication. Although HCCs reflect hierarchies among related disease categories, for unrelated diseases, HCCs accumulate, i.e., the model is “additive.” For example, a female with both Rheumatoid Arthritis and Breast Cancer has (at least) two separate HCCs coded, and her predicted cost will reflect increments for both conditions.
Because a single individual may be coded for no HCCs, one, or more than one HCC, the CMS-HCC model can individually price tens of thousands of distinct clinical profiles. The model’s structure thus provides, and predicts from, a detailed comprehensive clinical profile for each individual.
The CMS-HCC model assigns a numeric factor to each HCC and each age/sex, Medicaid/non-Medicaid, originally disabled/non-originally disabled cell. The values are summed to determine the risk score.
An illustrative hypothetical example follows for a 70-year-old woman with HCCs Metastatic Cancer and Acute Leukemia (HCC 8) and Bone/Joint/Muscle Infections/Necrosis (HCC 39) who is on Medicaid who is not originally disabled:
Risk Factor Factor
Age/Sex 0.346
Medicaid 0.213
HCC 8—Metastatic Cancer and Acute Leukemia 2.425
HCC 39—Bone/Joint/Muscle Infections/Necrosis 0.423
Total CMS-HCC Risk Score 3.407
For more information on the CMS-HCC risk model, see the following web page: https://www.cms.gov/Medicare/Health-Plans/MedicareAdvtgSpecRateStats/Announcements-and-Documents.html
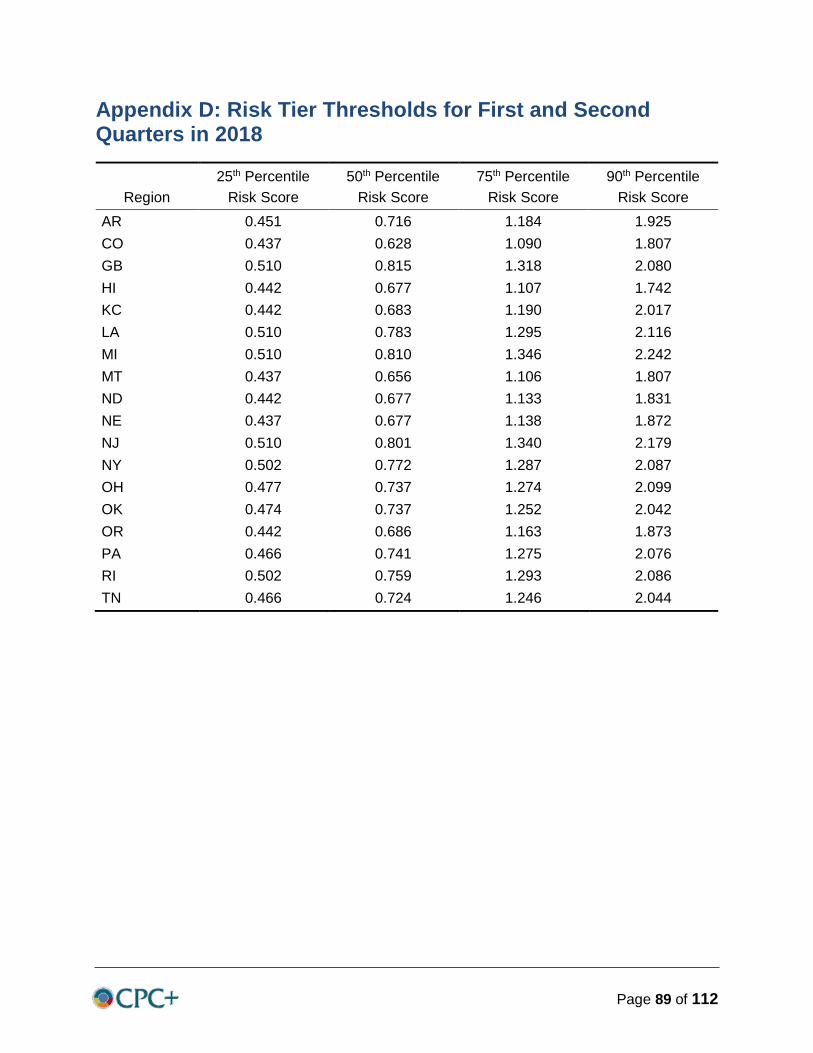
Page 89 of 112
Appendix D: Risk Tier Thresholds for First and Second Quarters in 2018
Region 25th Percentile
Risk Score 50th Percentile
Risk Score 75th Percentile
Risk Score 90th Percentile
Risk Score AR 0.451 0.716 1.184 1.925 CO 0.437 0.628 1.090 1.807 GB 0.510 0.815 1.318 2.080 HI 0.442 0.677 1.107 1.742 KC 0.442 0.683 1.190 2.017 LA 0.510 0.783 1.295 2.116 MI 0.510 0.810 1.346 2.242 MT 0.437 0.656 1.106 1.807 ND 0.442 0.677 1.133 1.831 NE 0.437 0.677 1.138 1.872 NJ 0.510 0.801 1.340 2.179 NY 0.502 0.772 1.287 2.087 OH 0.477 0.737 1.274 2.099 OK 0.474 0.737 1.252 2.042 OR 0.442 0.686 1.163 1.873 PA 0.466 0.741 1.275 2.076 RI 0.502 0.759 1.293 2.086 TN 0.466 0.724 1.246 2.044

Page 90 of 112
[This page was intentionally left blank.]

Page 91 of 112
Appendix E: CAHPS Measure Survey Questions
CPC+ CAHPS Measure Survey Question Getting Timely Appointments, Care, and Information
Q6. Patient always got appointment as soon as needed when contacting provider's office to get an appointment for care needed right away Q8. Patient always got appointment as soon as needed when making an appointment for check-up or routine care Q10. When patient contacted provider's office during regular office hours with a medical question, patient always received an answer that same day
How Well Providers Communicate Q11. Providers always explained things to patient in a way that was easy to understand Q12. Provider always listened carefully to patient Q14. Provider always showed respect for what patient had to say Q15. Provider always spent enough time with patient
Attention to Care from Other Providers
PCMH3. If patient visited a specialist, provider always seemed informed and up-to-date about the care patient received from specialists Q.20. Someone from provider’s office talked with patient about all prescription medications being taken
Shared Decision Making If patient talked about starting or stopping a prescription medicine, provider talked a lot about the reasons patient might want to take the medicine If patient talked about starting or stopping a prescription medicine, provider talked a lot about the reasons patient might not want to take a medicine If patient talked about starting or stopping a prescription medicine, provider asked what patient thought was best
Providers Support Patient in Taking Care of Own Health
PCMH4. Someone in provider's office discussed specific health goals with patient PCMH5. Someone in provider’s office asked whether there were things that made it hard for patient to take care of health
Patient Rating of Provider and Care Q18. Patient rating of provider as best provider possible (0–10, out of a maximum of 10)

Page 92 of 112
Patient Experience Composite Measures and Point Scales
Composite Measure CAHPS Point Scale Getting Timely Appointments, Care, and Information (3 questions) How Well Providers Communicate (4 questions) Attention to Care from Other Providers (2 questions) Shared Decision Making (3 questions)
1–4 Always = 4 Usually = 3 Sometimes = 2 Never = 1
Providers Support Patient in Taking Care of Own Health (2 questions)
0–1 Yes = 1 No = 0
Patient Rating of Provider and Care (1 question) 0–10 (patients answer on a scale of 0–10)
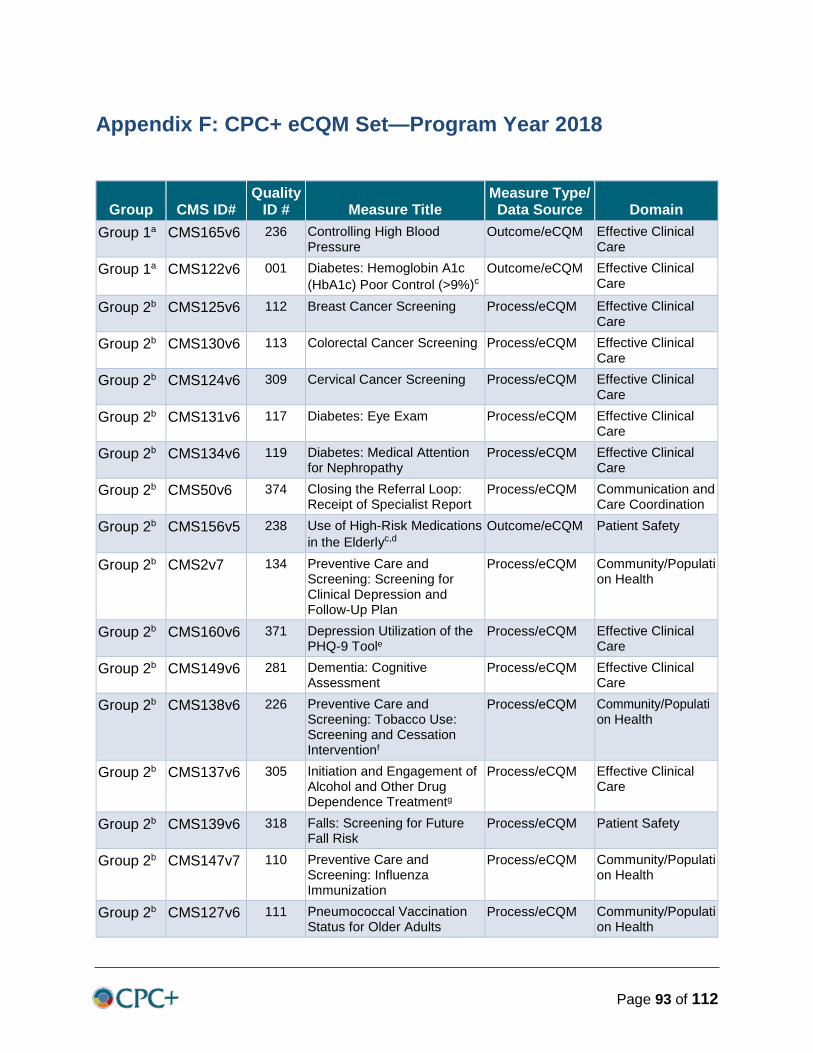
Page 93 of 112
Appendix F: CPC+ eCQM Set—Program Year 2018
Group CMS ID# Quality
ID # Measure Title Measure Type/ Data Source Domain
Group 1a CMS165v6 236 Controlling High Blood Pressure
Outcome/eCQM Effective Clinical Care
Group 1a CMS122v6 001 Diabetes: Hemoglobin A1c (HbA1c) Poor Control (>9%)c
Outcome/eCQM Effective Clinical Care
Group 2b CMS125v6 112 Breast Cancer Screening Process/eCQM Effective Clinical Care
Group 2b CMS130v6 113 Colorectal Cancer Screening Process/eCQM Effective Clinical Care
Group 2b CMS124v6 309 Cervical Cancer Screening Process/eCQM Effective Clinical Care
Group 2b CMS131v6 117 Diabetes: Eye Exam Process/eCQM Effective Clinical Care
Group 2b CMS134v6 119 Diabetes: Medical Attention for Nephropathy
Process/eCQM Effective Clinical Care
Group 2b CMS50v6 374 Closing the Referral Loop: Receipt of Specialist Report
Process/eCQM Communication and Care Coordination
Group 2b CMS156v5 238 Use of High-Risk Medications in the Elderlyc,d
Outcome/eCQM Patient Safety
Group 2b CMS2v7 134 Preventive Care and Screening: Screening for Clinical Depression and Follow-Up Plan
Process/eCQM Community/Population Health
Group 2b CMS160v6 371 Depression Utilization of the PHQ-9 Toole
Process/eCQM Effective Clinical Care
Group 2b CMS149v6 281 Dementia: Cognitive Assessment
Process/eCQM Effective Clinical Care
Group 2b CMS138v6 226 Preventive Care and Screening: Tobacco Use: Screening and Cessation Interventionf
Process/eCQM Community/Population Health
Group 2b CMS137v6 305 Initiation and Engagement of Alcohol and Other Drug Dependence Treatmentg
Process/eCQM Effective Clinical Care
Group 2b CMS139v6 318 Falls: Screening for Future Fall Risk
Process/eCQM Patient Safety
Group 2b CMS147v7 110 Preventive Care and Screening: Influenza Immunization
Process/eCQM Community/Population Health
Group 2b CMS127v6 111 Pneumococcal Vaccination Status for Older Adults
Process/eCQM Community/Population Health
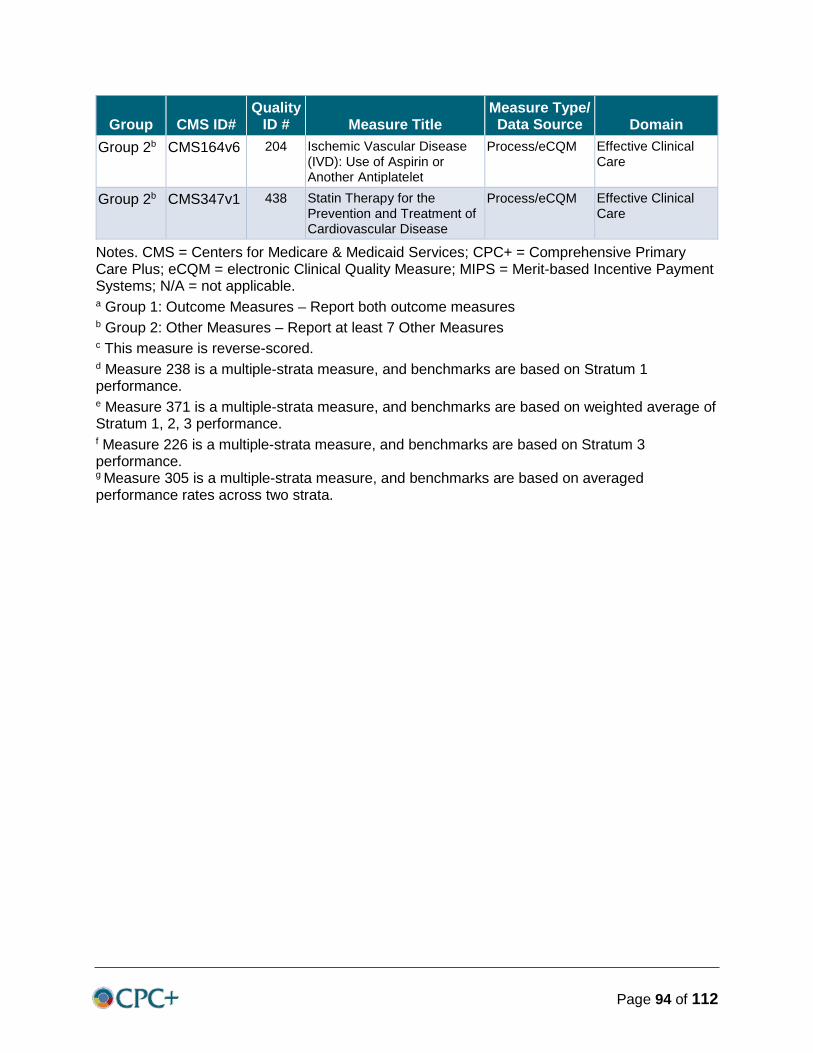
Page 94 of 112
Group CMS ID# Quality
ID # Measure Title Measure Type/ Data Source Domain
Group 2b CMS164v6 204 Ischemic Vascular Disease (IVD): Use of Aspirin or Another Antiplatelet
Process/eCQM Effective Clinical Care
Group 2b CMS347v1 438 Statin Therapy for the Prevention and Treatment of Cardiovascular Disease
Process/eCQM Effective Clinical Care
Notes. CMS = Centers for Medicare & Medicaid Services; CPC+ = Comprehensive Primary Care Plus; eCQM = electronic Clinical Quality Measure; MIPS = Merit-based Incentive Payment Systems; N/A = not applicable. a Group 1: Outcome Measures – Report both outcome measures b Group 2: Other Measures – Report at least 7 Other Measures c This measure is reverse-scored. d Measure 238 is a multiple-strata measure, and benchmarks are based on Stratum 1 performance. e Measure 371 is a multiple-strata measure, and benchmarks are based on weighted average of Stratum 1, 2, 3 performance. f Measure 226 is a multiple-strata measure, and benchmarks are based on Stratum 3 performance. g Measure 305 is a multiple-strata measure, and benchmarks are based on averaged performance rates across two strata.

Page 95 of 112
Appendix G: Utilization Measure Technical Specifications Inpatient Hospital Utilization (IHU)
Summary of Changes to HEDIS 2016 • First-year measure.
Description For members 18 years of age and older, the risk-adjusted ratio of observed to expected acute inpatient discharges during the measurement year reported by Surgery, Medicine, and Total.
Definitions Classification period
The year prior to the measurement year.
PPD Predicted probability of discharge. The predicted probability of a member having any discharge in the measurement year.
PUCD Predicted unconditional count of discharge. The predicted unconditional count of discharges for members during the measurement year.
Eligible Population Product lines Commercial, Medicare (report each product line separately). Ages 18 and older as of December 31 of the measurement year. Continuous enrollment
The measurement year and the year prior to the measurement year.
Allowable gap No more than one gap in enrollment of up to 45 days during each year of continuous enrollment.
Anchor date December 31 of the measurement year. Benefit Medical. Event/diagnosis None.
Calculation of Observed Events For organizations that use Medicare Severity-Diagnosis Related Groups (MS-DRGs):
• Identify all acute inpatient stays with a discharge date during the measurement year for the following categories:
◦ Surgery (Surgery MS-DRG Value Set). ◦ Medicine (Medicine MS-DRG Value Set). ◦ Total Inpatient (the sum of Surgery and Medicine).
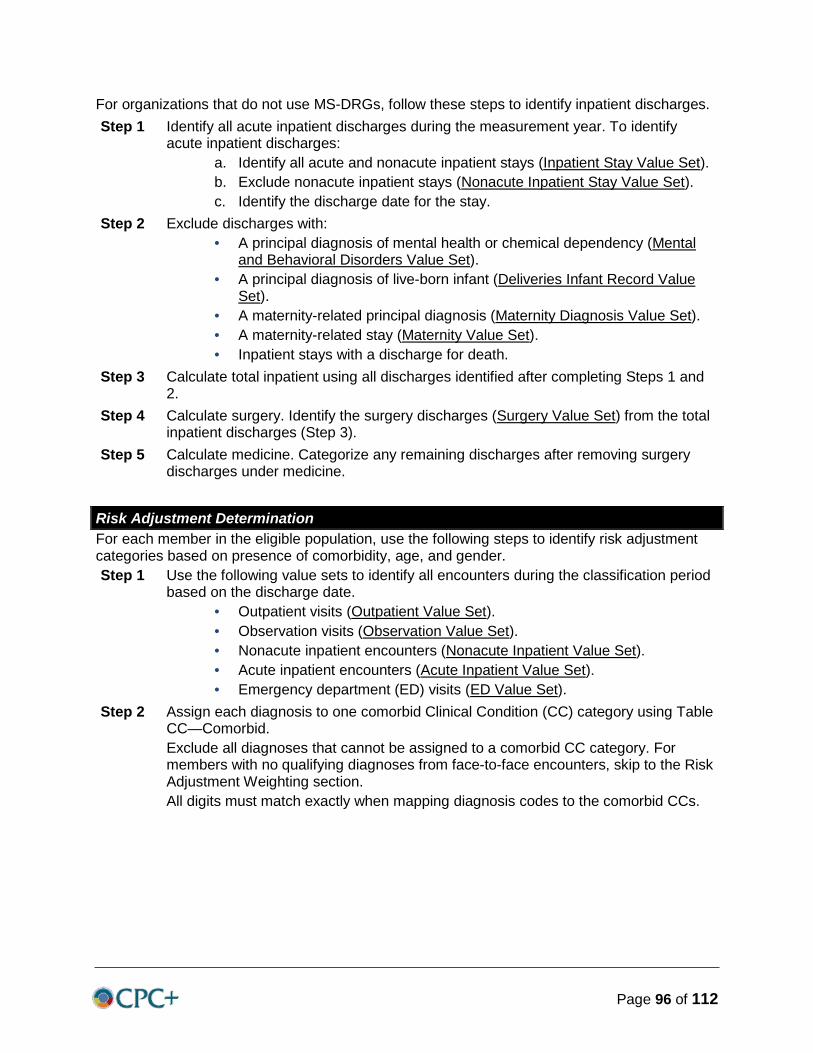
Page 96 of 112
For organizations that do not use MS-DRGs, follow these steps to identify inpatient discharges. Step 1 Identify all acute inpatient discharges during the measurement year. To identify
acute inpatient discharges: a. Identify all acute and nonacute inpatient stays (Inpatient Stay Value Set). b. Exclude nonacute inpatient stays (Nonacute Inpatient Stay Value Set). c. Identify the discharge date for the stay.
Step 2 Exclude discharges with: • A principal diagnosis of mental health or chemical dependency (Mental
and Behavioral Disorders Value Set). • A principal diagnosis of live-born infant (Deliveries Infant Record Value
Set). • A maternity-related principal diagnosis (Maternity Diagnosis Value Set). • A maternity-related stay (Maternity Value Set). • Inpatient stays with a discharge for death.
Step 3 Calculate total inpatient using all discharges identified after completing Steps 1 and 2.
Step 4 Calculate surgery. Identify the surgery discharges (Surgery Value Set) from the total inpatient discharges (Step 3).
Step 5 Calculate medicine. Categorize any remaining discharges after removing surgery discharges under medicine.
Risk Adjustment Determination For each member in the eligible population, use the following steps to identify risk adjustment categories based on presence of comorbidity, age, and gender. Step 1 Use the following value sets to identify all encounters during the classification period
based on the discharge date. • Outpatient visits (Outpatient Value Set). • Observation visits (Observation Value Set). • Nonacute inpatient encounters (Nonacute Inpatient Value Set). • Acute inpatient encounters (Acute Inpatient Value Set). • Emergency department (ED) visits (ED Value Set).
Step 2 Assign each diagnosis to one comorbid Clinical Condition (CC) category using Table CC—Comorbid. Exclude all diagnoses that cannot be assigned to a comorbid CC category. For members with no qualifying diagnoses from face-to-face encounters, skip to the Risk Adjustment Weighting section. All digits must match exactly when mapping diagnosis codes to the comorbid CCs.
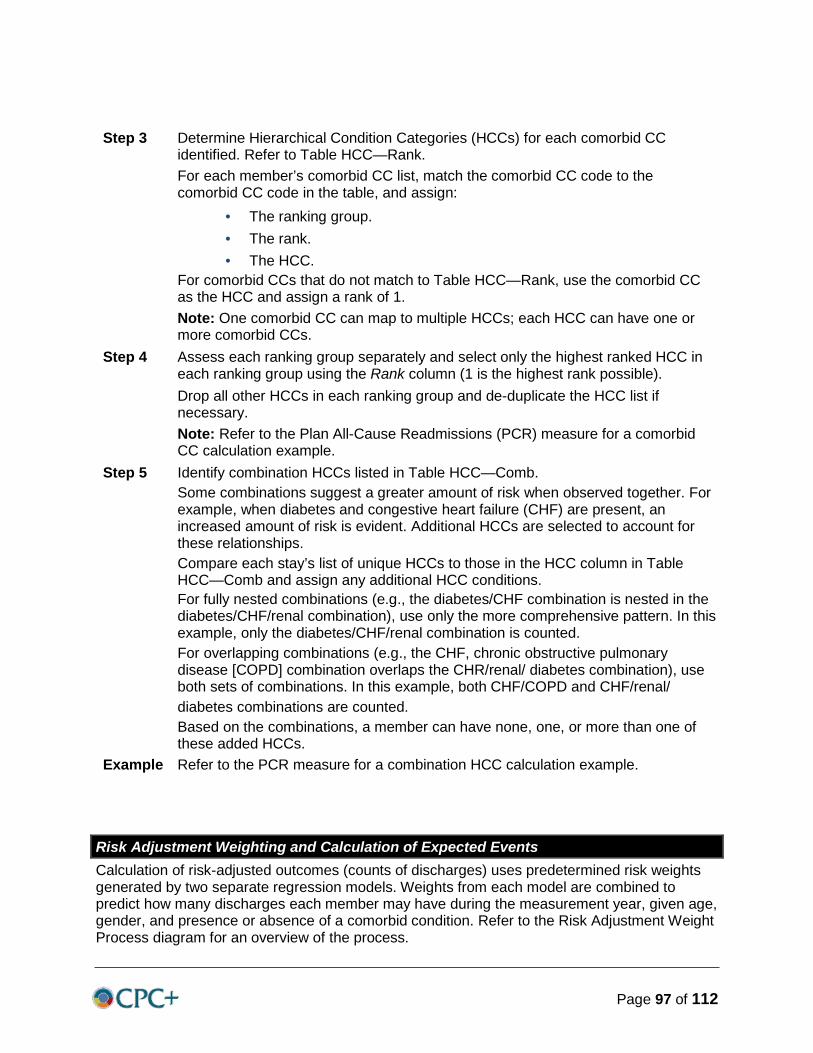
Page 97 of 112
Step 3 Determine Hierarchical Condition Categories (HCCs) for each comorbid CC identified. Refer to Table HCC—Rank. For each member’s comorbid CC list, match the comorbid CC code to the comorbid CC code in the table, and assign:
• The ranking group. • The rank. • The HCC.
For comorbid CCs that do not match to Table HCC—Rank, use the comorbid CC as the HCC and assign a rank of 1. Note: One comorbid CC can map to multiple HCCs; each HCC can have one or more comorbid CCs.
Step 4 Assess each ranking group separately and select only the highest ranked HCC in each ranking group using the Rank column (1 is the highest rank possible). Drop all other HCCs in each ranking group and de-duplicate the HCC list if necessary. Note: Refer to the Plan All-Cause Readmissions (PCR) measure for a comorbid CC calculation example.
Step 5 Identify combination HCCs listed in Table HCC—Comb. Some combinations suggest a greater amount of risk when observed together. For example, when diabetes and congestive heart failure (CHF) are present, an increased amount of risk is evident. Additional HCCs are selected to account for these relationships. Compare each stay’s list of unique HCCs to those in the HCC column in Table HCC—Comb and assign any additional HCC conditions. For fully nested combinations (e.g., the diabetes/CHF combination is nested in the diabetes/CHF/renal combination), use only the more comprehensive pattern. In this example, only the diabetes/CHF/renal combination is counted. For overlapping combinations (e.g., the CHF, chronic obstructive pulmonary disease [COPD] combination overlaps the CHR/renal/ diabetes combination), use both sets of combinations. In this example, both CHF/COPD and CHF/renal/ diabetes combinations are counted. Based on the combinations, a member can have none, one, or more than one of these added HCCs.
Example Refer to the PCR measure for a combination HCC calculation example.
Risk Adjustment Weighting and Calculation of Expected Events Calculation of risk-adjusted outcomes (counts of discharges) uses predetermined risk weights generated by two separate regression models. Weights from each model are combined to predict how many discharges each member may have during the measurement year, given age, gender, and presence or absence of a comorbid condition. Refer to the Risk Adjustment Weight Process diagram for an overview of the process.

Page 98 of 112
For each member in the eligible population, assign Predicted Probability of Discharge (PPD) risk weights. Calculate the PPD for each service utilization category: Surgery, Medicine, Total. Step 1 For each member with a comorbidity HCC category, link the PPD weights.
• For the Medicare product line, use the following tables: ◦ For Surgery: Use Table IHUS-MA-PPD-ComorbidHCC. ◦ For Medicine: Use Table IHUM-MA-PPD-ComorbidHCC. ◦ For Total: Use Table IHUT-MA-PPD-ComorbidHCC.
• For the commercial product line, use the following tables: ◦ For Surgery: Use Table IHUS-Comm-PPD-ComorbidHCC. ◦ For Medicine: Use Table IHUM-Comm-PPD-ComorbidHCC. ◦ For Total: Use Table IHUT-Comm-PPD-ComorbidHCC.
Step 2 Link the age-gender PPD weights for each member. • For the Medicare product line, use the following tables:
◦ For Surgery: Use Table IHUS-MA-PPD. ◦ For Medicine: Use Table IHUM-MA-PPD. ◦ For Total: Use Table IHUT-MA-PPD.
• For the commercial product line, use the following tables: ◦ For Surgery: Use Table IHUS-Comm-PPD. ◦ For Medicine: Use Table IHUM-Comm-PPD. ◦ For Total: Use Table IHUT-Comm-PPD.
Step 3 Identify the base PPD risk weight for each member. • For the Medicare product line, use the following tables:
◦ For Surgery: Use Table IHUS-MA-PPD. ◦ For Medicine: Use Table IHUM-MA-PPD. ◦ For Total: Use Table IHUT-MA-PPD.
• For the commercial product line, use the following tables: ◦ For Surgery: Use Table IHUS-Comm-PPD. ◦ For Medicine: Use Table IHUM-Comm-PPD. ◦ For Total: Use Table IHUT-Comm-PPD.
Step 4 Sum all PPD weights (i.e., HCC, age, gender, base weight) associated with the member for each category (Medicine, Surgery, Total).
Step 5 Calculate the predicted probability of having at least one discharge in the measurement year based on the sum of the weights for each member, for each category (Surgery, Medicine, Total), using the formula below.
Note: The risk adjustment tables were released on November 2, 2015, and posted to www.ncqa.org.
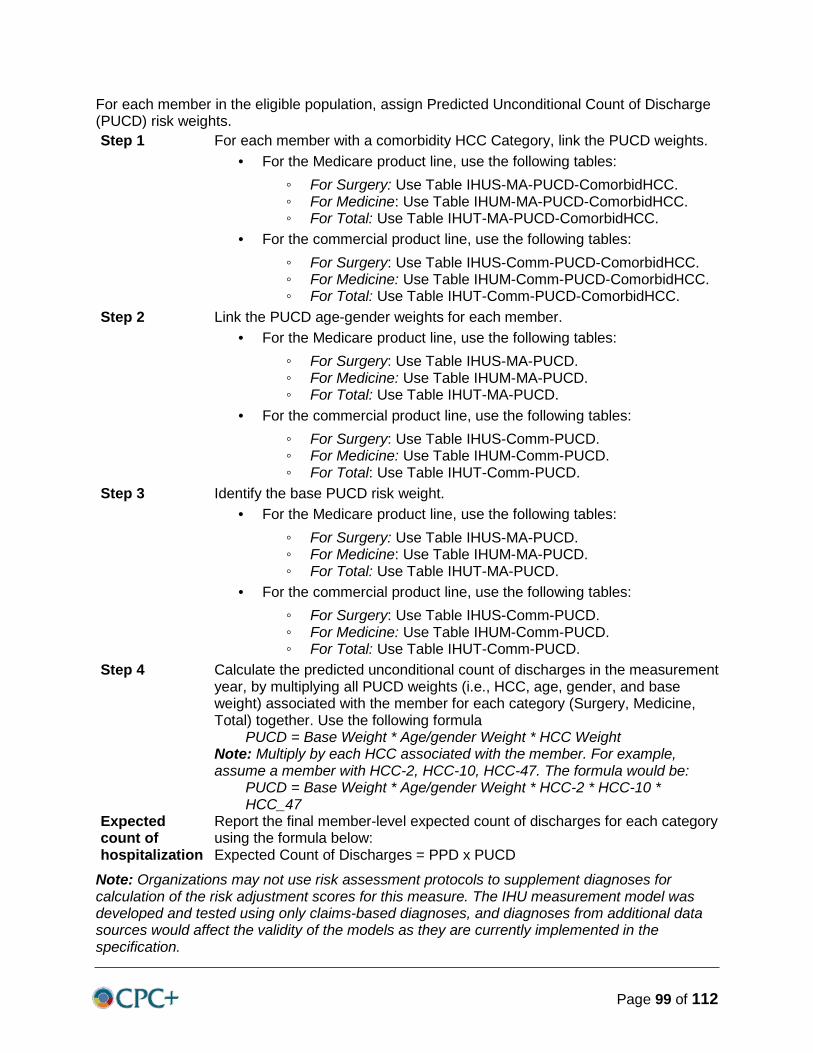
Page 99 of 112
For each member in the eligible population, assign Predicted Unconditional Count of Discharge (PUCD) risk weights. Step 1 For each member with a comorbidity HCC Category, link the PUCD weights.
• For the Medicare product line, use the following tables: ◦ For Surgery: Use Table IHUS-MA-PUCD-ComorbidHCC. ◦ For Medicine: Use Table IHUM-MA-PUCD-ComorbidHCC. ◦ For Total: Use Table IHUT-MA-PUCD-ComorbidHCC.
• For the commercial product line, use the following tables: ◦ For Surgery: Use Table IHUS-Comm-PUCD-ComorbidHCC. ◦ For Medicine: Use Table IHUM-Comm-PUCD-ComorbidHCC. ◦ For Total: Use Table IHUT-Comm-PUCD-ComorbidHCC.
Step 2 Link the PUCD age-gender weights for each member. • For the Medicare product line, use the following tables:
◦ For Surgery: Use Table IHUS-MA-PUCD. ◦ For Medicine: Use Table IHUM-MA-PUCD. ◦ For Total: Use Table IHUT-MA-PUCD.
• For the commercial product line, use the following tables: ◦ For Surgery: Use Table IHUS-Comm-PUCD. ◦ For Medicine: Use Table IHUM-Comm-PUCD. ◦ For Total: Use Table IHUT-Comm-PUCD.
Step 3 Identify the base PUCD risk weight. • For the Medicare product line, use the following tables:
◦ For Surgery: Use Table IHUS-MA-PUCD. ◦ For Medicine: Use Table IHUM-MA-PUCD. ◦ For Total: Use Table IHUT-MA-PUCD.
• For the commercial product line, use the following tables: ◦ For Surgery: Use Table IHUS-Comm-PUCD. ◦ For Medicine: Use Table IHUM-Comm-PUCD. ◦ For Total: Use Table IHUT-Comm-PUCD.
Step 4 Calculate the predicted unconditional count of discharges in the measurement year, by multiplying all PUCD weights (i.e., HCC, age, gender, and base weight) associated with the member for each category (Surgery, Medicine, Total) together. Use the following formula
PUCD = Base Weight * Age/gender Weight * HCC Weight Note: Multiply by each HCC associated with the member. For example, assume a member with HCC-2, HCC-10, HCC-47. The formula would be:
PUCD = Base Weight * Age/gender Weight * HCC-2 * HCC-10 * HCC_47
Expected count of hospitalization
Report the final member-level expected count of discharges for each category using the formula below: Expected Count of Discharges = PPD x PUCD
Note: Organizations may not use risk assessment protocols to supplement diagnoses for calculation of the risk adjustment scores for this measure. The IHU measurement model was developed and tested using only claims-based diagnoses, and diagnoses from additional data sources would affect the validity of the models as they are currently implemented in the specification.
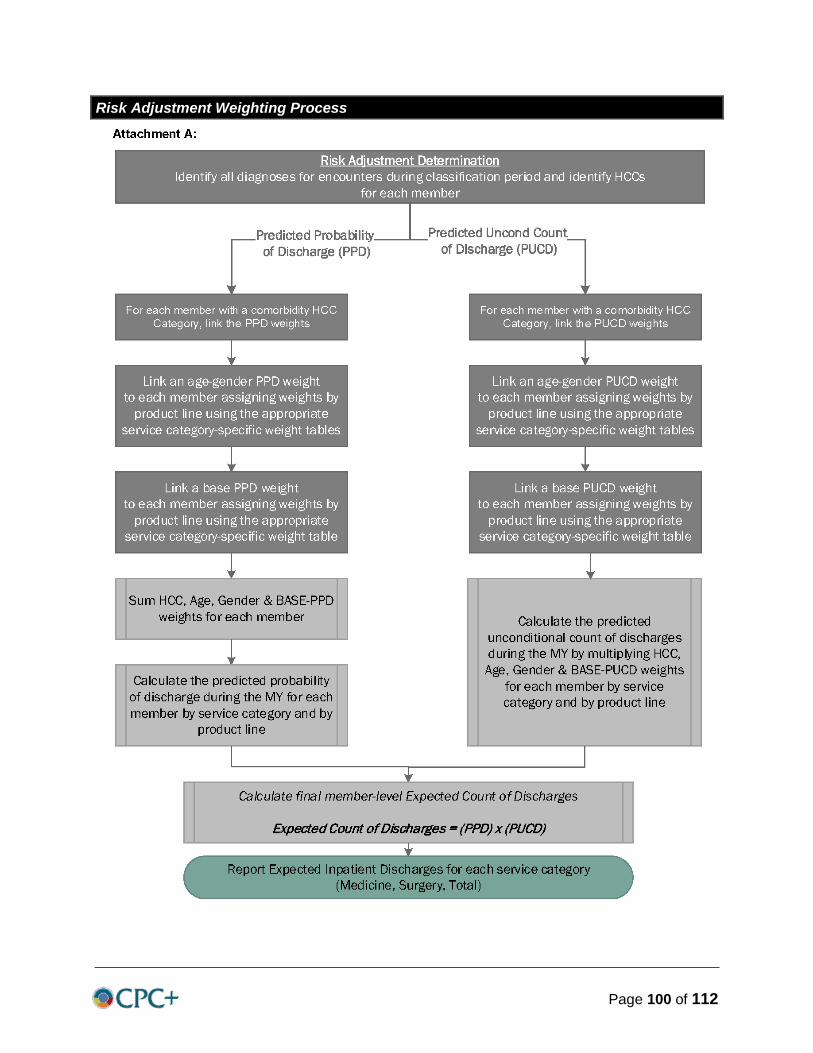
Page 100 of 112
Risk Adjustment Weighting Process
Page 101 of 112
Reporting: Number of Members in the Eligible Population The number of members in the eligible population for each age and gender group and the overall total. Enter these values into the reporting table (Table IHU-A-2/3).
Reporting: Number of Observed Events The number of observed discharges within each age and gender group and the overall total for each category (Surgery, Medicine, Total).
Reporting: Observed Discharges per 1,000 Members The number of observed discharges divided by the number of members in the eligible population, multiplied by 1,000 within each age and gender group and the overall total for each category (Surgery, Medicine, Total).
Reporting: Number of Expected Events The number of expected discharges within each age and gender group and the overall total for each category (Surgery, Medicine, Total).
Emergency Department Utilization (EDU)
Summary of Changes to HEDIS 2016 • First-year measure.
Description For members 18 years of age and older, the risk-adjusted ratio of observed to expected emergency department (ED) visits during the measurement year.
Definitions
Classification period
The year prior to the measurement year.
PPV Predicted probability of a visit. The predicted probability of a member having an emergency department visit in the measurement year.
PUCV Predicted unconditional count of visits. The unconditional count of emergency department visits for members during the measurement year.

Page 102 of 112
Eligible Population
Product lines Commercial, Medicare (report each product line separately). Ages 18 and older as of December 31 of the measurement year. Continuous enrollment
The measurement year and the year prior to the measurement year.
Allowable gap No more than one gap in enrollment of up to 45 days during each year of continuous enrollment.
Anchor date December 31 of the measurement year. Benefit Medical. Event/diagnosis None
Calculation of Observed Events
Step 1 Count each visit to an ED that does not result in an inpatient encounter once, regardless of the intensity or duration of the visit. Count multiple ED visits on the same date of service as one visit. Identify all ED visits during the measurement year using either of the following: • An ED Visit (ED Value Set). • A procedure code (ED procedure Code Value Set) with an ED place of
service code (ED POS Value Set).
Step 2 Exclude encounters with any of the following: • A principal diagnosis of mental health or chemical dependency (Mental and
Behavioral Disorders Value Set). • Psychiatry (Psychiatry Value Set). • Electroconvulsive Therapy (Electroconvulsive Therapy Value Set). • Alcohol or drug rehabilitation or detoxification (AOD Rehab and Detox Value
Set).
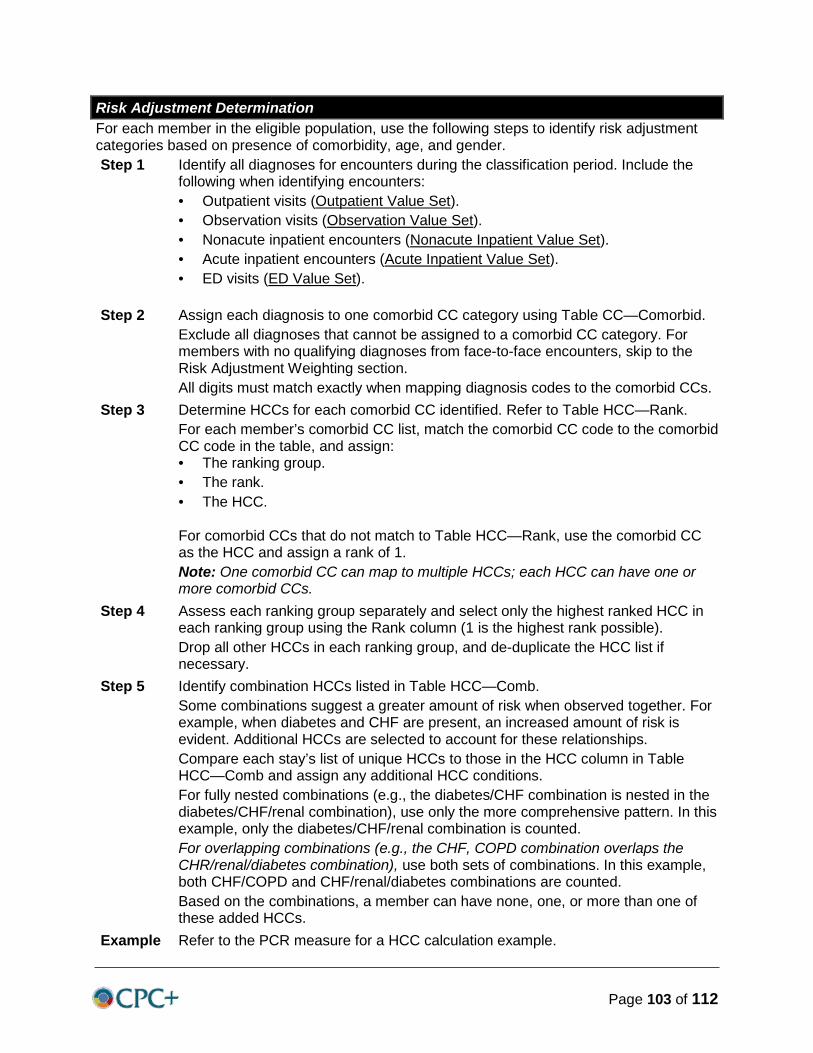
Page 103 of 112
Risk Adjustment Determination For each member in the eligible population, use the following steps to identify risk adjustment categories based on presence of comorbidity, age, and gender. Step 1 Identify all diagnoses for encounters during the classification period. Include the
following when identifying encounters: • Outpatient visits (Outpatient Value Set). • Observation visits (Observation Value Set). • Nonacute inpatient encounters (Nonacute Inpatient Value Set). • Acute inpatient encounters (Acute Inpatient Value Set). • ED visits (ED Value Set).
Step 2 Assign each diagnosis to one comorbid CC category using Table CC—Comorbid. Exclude all diagnoses that cannot be assigned to a comorbid CC category. For members with no qualifying diagnoses from face-to-face encounters, skip to the Risk Adjustment Weighting section. All digits must match exactly when mapping diagnosis codes to the comorbid CCs.
Step 3 Determine HCCs for each comorbid CC identified. Refer to Table HCC—Rank. For each member’s comorbid CC list, match the comorbid CC code to the comorbid CC code in the table, and assign: • The ranking group. • The rank. • The HCC.
For comorbid CCs that do not match to Table HCC—Rank, use the comorbid CC as the HCC and assign a rank of 1. Note: One comorbid CC can map to multiple HCCs; each HCC can have one or more comorbid CCs.
Step 4 Assess each ranking group separately and select only the highest ranked HCC in each ranking group using the Rank column (1 is the highest rank possible). Drop all other HCCs in each ranking group, and de-duplicate the HCC list if necessary.
Step 5 Identify combination HCCs listed in Table HCC—Comb. Some combinations suggest a greater amount of risk when observed together. For example, when diabetes and CHF are present, an increased amount of risk is evident. Additional HCCs are selected to account for these relationships. Compare each stay’s list of unique HCCs to those in the HCC column in Table HCC—Comb and assign any additional HCC conditions. For fully nested combinations (e.g., the diabetes/CHF combination is nested in the diabetes/CHF/renal combination), use only the more comprehensive pattern. In this example, only the diabetes/CHF/renal combination is counted. For overlapping combinations (e.g., the CHF, COPD combination overlaps the CHR/renal/diabetes combination), use both sets of combinations. In this example, both CHF/COPD and CHF/renal/diabetes combinations are counted. Based on the combinations, a member can have none, one, or more than one of these added HCCs.
Example Refer to the PCR measure for a HCC calculation example.
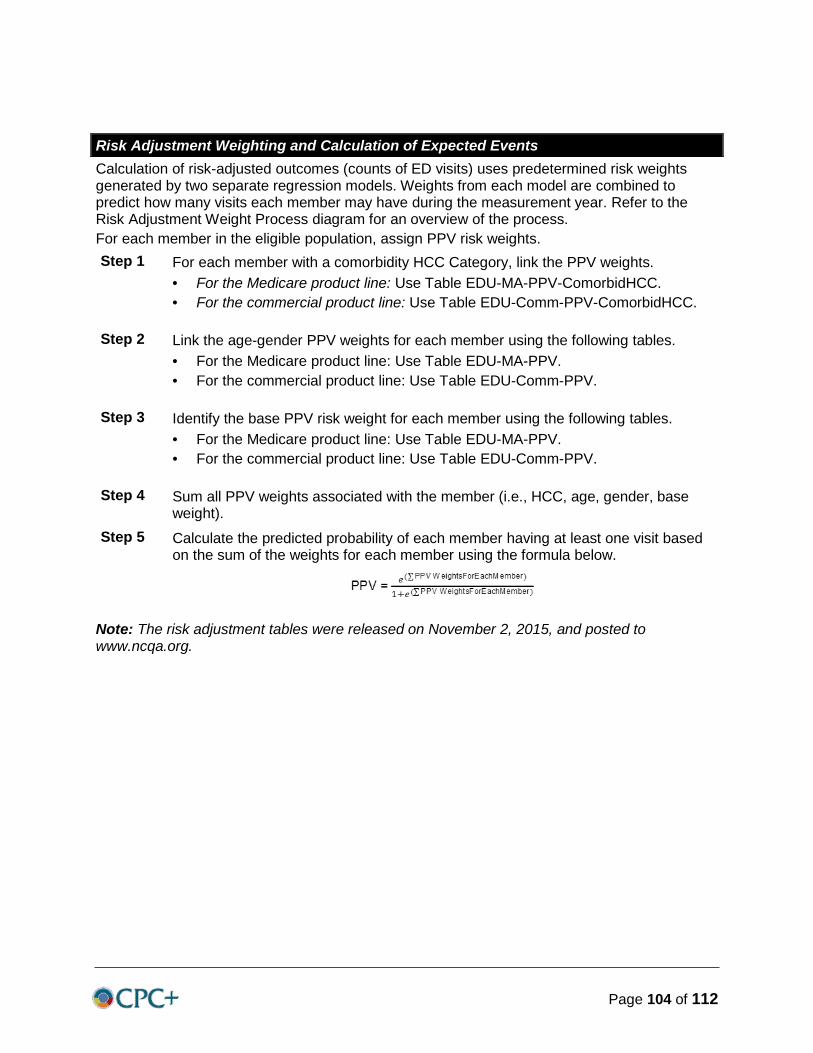
Page 104 of 112
Risk Adjustment Weighting and Calculation of Expected Events Calculation of risk-adjusted outcomes (counts of ED visits) uses predetermined risk weights generated by two separate regression models. Weights from each model are combined to predict how many visits each member may have during the measurement year. Refer to the Risk Adjustment Weight Process diagram for an overview of the process. For each member in the eligible population, assign PPV risk weights. Step 1 For each member with a comorbidity HCC Category, link the PPV weights.
• For the Medicare product line: Use Table EDU-MA-PPV-ComorbidHCC. • For the commercial product line: Use Table EDU-Comm-PPV-ComorbidHCC.
Step 2 Link the age-gender PPV weights for each member using the following tables. • For the Medicare product line: Use Table EDU-MA-PPV. • For the commercial product line: Use Table EDU-Comm-PPV.
Step 3 Identify the base PPV risk weight for each member using the following tables. • For the Medicare product line: Use Table EDU-MA-PPV. • For the commercial product line: Use Table EDU-Comm-PPV.
Step 4 Sum all PPV weights associated with the member (i.e., HCC, age, gender, base weight).
Step 5 Calculate the predicted probability of each member having at least one visit based on the sum of the weights for each member using the formula below.
Note: The risk adjustment tables were released on November 2, 2015, and posted to www.ncqa.org.

Page 105 of 112
For each member in the eligible population, assign PUCV risk weights.
Step 1 For each member with a comorbidity HCC Category, link the PUCV weights. • For the Medicare product line: Use Table EDU-MA-PUCV-
ComorbidHCC. • For the commercial product line: Use Table EDU-Comm-PUCV-
ComorbidHCC.
Step 2 Link the PUCV age-gender weights for each member using the following tables. • For the Medicare product line: Use Table EDU-MA-PUCV. • For the commercial product line: Use Table EDU-Comm-PUCV.
Step 3 Identify the base PUCV risk weight for each member using the following tables. • For the Medicare product line: Use Table EDU-MA-PUCV. • For the commercial product line: Use Table EDU-Comm-PUCV.
Step 4 Calculate the predicted unconditional count of ED visits in the measurement year, by multiplying all PUCV weights (i.e., HCC, age, gender, and base weight) for each member together. Use the following formula
PUCD = Base Weight * Age/gender Weight * HCC Weight Note: Multiply by each HCC associated with the member. For example, assume a member with HCC-2, HCC-10, HCC-47. The formula would be: PUCV = Base Weight * Age/gender Weight * HCC-2 * HCC-10 * HCC_47
Expected count of hospitalization
Report the final member-level expected count of ED visits for each category using the formula below: Expected Count of ED Visits = PPV x PUCV
Expected count of hospitalization
Report the final member-level expected count of ED visits for each category using the formula below: Expected Count of ED Visits = PPV x PUCV
Note: Organizations may not use Risk Assessment Protocols to supplement diagnoses for calculation of the risk adjustment scores for this measure. The EDU measurement model was developed and tested using only claims-based diagnoses, and diagnoses from additional data sources would affect the validity of the models as they are currently implemented in the specification.
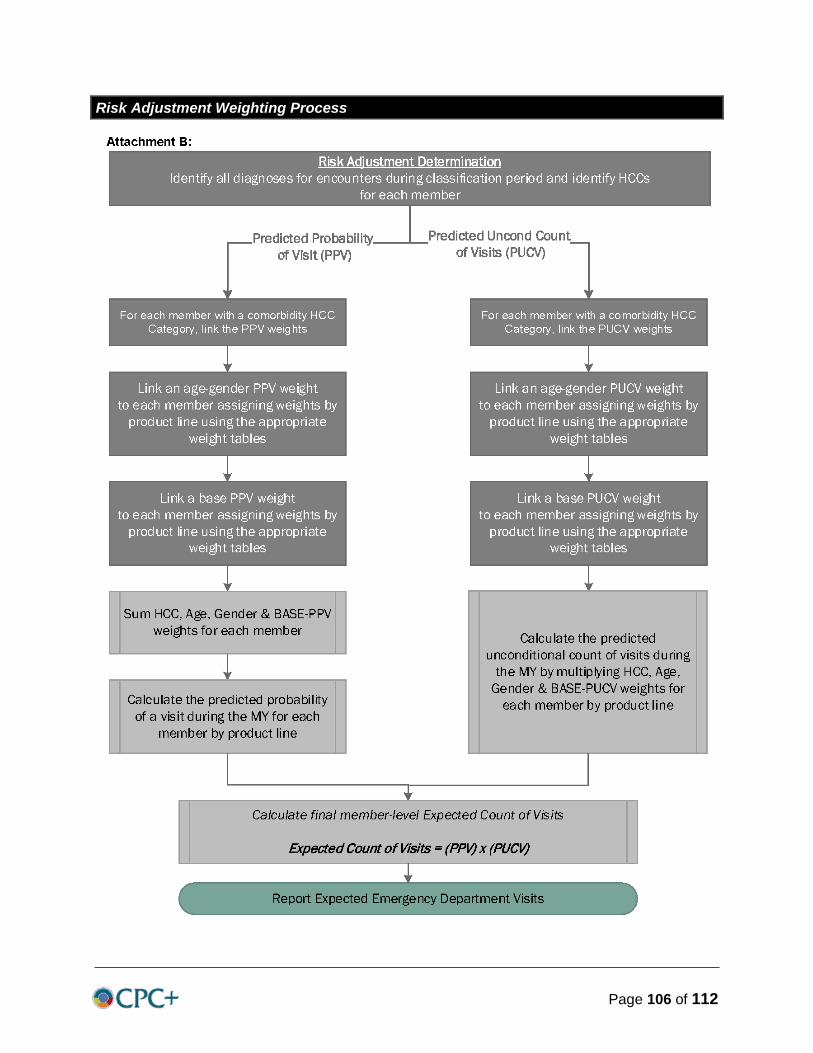
Page 106 of 112
Risk Adjustment Weighting Process

Page 107 of 112
Reporting: Number of Members in the Eligible Population The number of members in the eligible population for each age and gender combination and enter these values into the reporting table (Table EDU-A-2/3).
Reporting: Number of Observed Events The number of observed ED visits within each age and gender group and the overall total.
Reporting: Observed Visits per 1,000 Members The number of observed ED visits divided by the number of members in the eligible population, multiplied by 1,000 within each age and gender group and the overall total.
Reporting: Number of Expected Events The number of expected ED visits within each age and gender group and the overall total.
NOTICE AND DISCLAIMER
The Inpatient Hospital Utilization and Emergency Department Utilization measures and specifications were developed by the National Committee for Quality Assurance (“NCQA”) under the Performance Measurements contract (HHSM-500-2006-00060C) with CMS and are included in HEDIS® with permission of CMS. The HEDIS measures and specifications are not clinical guidelines and do not establish a standard of medical care. NCQA makes no representations, warranties, or endorsement about the quality of any organization or physician that uses or reports performance measures and NCQA has no liability to anyone who relies on such measures or specifications. HEDIS measures cannot be modified without the permission of NCQA. Any use of HEDIS measures for commercial purposes requires a license from NCQA.
Limited proprietary coding is contained in the measure specifications for convenience. Users of the proprietary code sets should obtain all necessary licenses from the owners of these code sets. NCQA disclaims all liability for use or accuracy of any coding contained in the specifications.
The American Medical Association holds a copyright to the CPT® codes contained in the measures specifications.
The American Hospital Association holds a copyright to the Uniform Bill Codes (“UB”) contained in the measure specifications. The UB Codes in the HEDIS specifications are included with the permission of the AHA. The UB Codes contained in the HEDIS specifications may be used by health plans and other health care delivery organizations for the purpose of calculating and reporting HEDIS measure results or using HEDIS measure results for their internal quality improvement purposes. All other uses of the UB Codes require a license from the AHA. Anyone desiring to use the UB Codes in a commercial product to generate HEDIS results, or for any other commercial use, must obtain a commercial use license directly from the AHA. To inquire about licensing, contact [email protected].
HEDIS® The Healthcare Effectiveness Data and Information Set (HEDISâ) is a registered trademark of NCQA.

Page 108 of 112
[This page was intentionally left blank.]
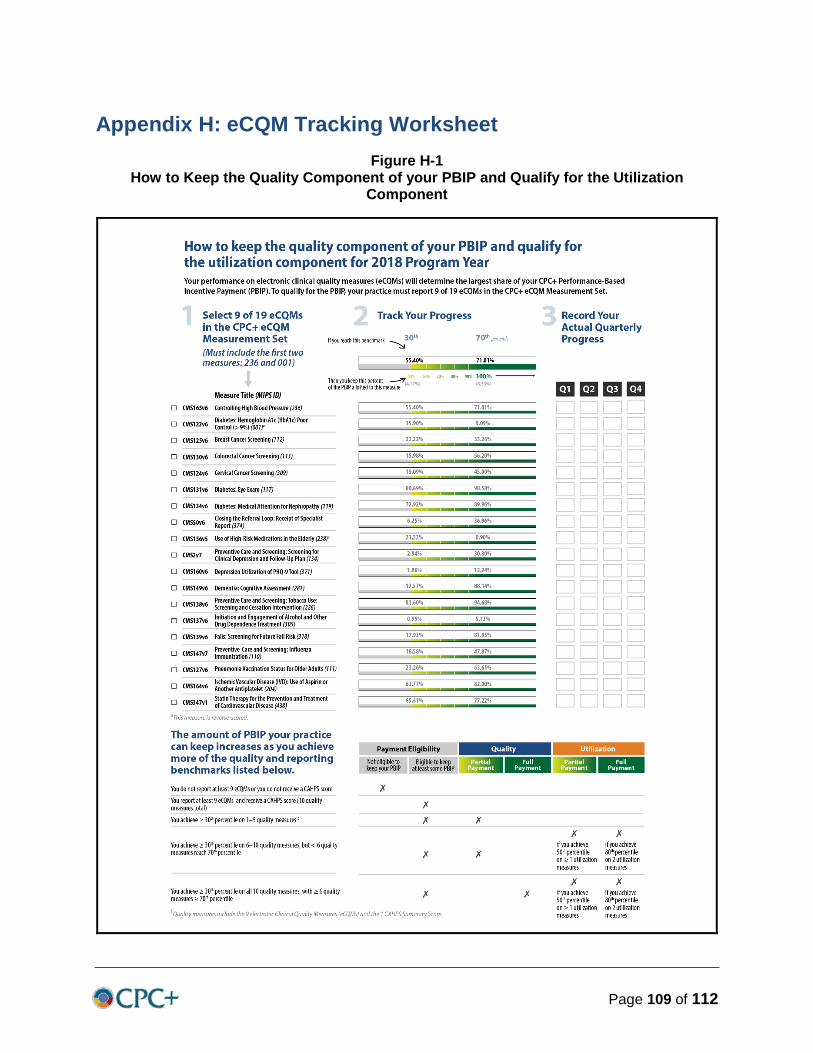
Page 109 of 112
Appendix H: eCQM Tracking Worksheet Figure H-1
How to Keep the Quality Component of your PBIP and Qualify for the Utilization Component

Page 110 of 112
[This page was intentionally left blank.]

Page 111 of 112
Appendix I: Evaluation and Management (E&M) Claims in Hybrid Payment
CPT E&M OFFICE VISTS DESCRIPTION 99201 OFFICE VISITS—NEW (EVALUATION AND MANAGEMENT) 99202 OFFICE VISITS—NEW (EVALUATION AND MANAGEMENT) 99203 OFFICE VISITS—NEW (EVALUATION AND MANAGEMENT) 99204 OFFICE VISITS—NEW (EVALUATION AND MANAGEMENT) 99205 OFFICE VISITS—NEW (EVALUATION AND MANAGEMENT) 99211 OFFICE VISITS—ESTABLISHED (EVALUATION AND MANAGEMENT) 99212 OFFICE VISITS—ESTABLISHED (EVALUATION AND MANAGEMENT) 99213 OFFICE VISITS—ESTABLISHED (EVALUATION AND MANAGEMENT) 99214 OFFICE VISITS—ESTABLISHED (EVALUATION AND MANAGEMENT) 99215 OFFICE VISITS—ESTABLISHED (EVALUATION AND MANAGEMENT) 99354 OFFICE VISITS—ESTABLISHED (EVALUATION AND MANAGEMENT) 99355 OFFICE VISITS—ESTABLISHED (EVALUATION AND MANAGEMENT)
Note: CPT stands for Current Procedural Terminology.

Page 112 of 112
[This page was intentionally left blank.]
Top Related