


Languages
Pages
Legal


R E S EARCH ART I C L E
CANCER
Cortical GABAergic excitation contributes to epilepticactivities around human gliomaJohan Pallud,1,2,3,4 Michel Le Van Quyen,1,2* Franck Bielle,1,5* Christophe Pellegrino,6,7*Pascale Varlet,4,8 Marianne Labussiere,1,2 Noémie Cresto,1,2 Marie-Joseph Dieme,5 Michel Baulac,1,2,9
Charles Duyckaerts,1,5 Nazim Kourdougli,6,7 Geneviève Chazal,6,7 Bertrand Devaux,3,4
Claudio Rivera,6,7,10 Richard Miles,1,2 Laurent Capelle,1,11 Gilles Huberfeld1,2,9,12,13†
http://stm.sciencem
aD
ownloaded from
Brain gliomas are highly epileptogenic. Excitatory glutamatergic mechanisms are involved in the generation ofepileptic activities in the neocortex surrounding gliomas. However, chloride homeostasis is known to be per-turbed in glioma cells. Thus, the contribution of g-aminobutyric acidergic (GABAergic) mechanisms that dependon intracellular chloride merits closer study. We studied the occurrence, networks, cells, and signaling basis of ep-ileptic activities in neocortical slices from the peritumoral surgical margin resected around human brain gliomas.Postoperative glioma tissue from 69% of patients spontaneously generated interictal-like discharges, synchro-nized, with a high-frequency oscillation signature, in superficial layers of neocortex around areas of glioma infil-tration. Interictal-like events depended both on glutamatergic AMPA receptor–mediated transmission and ondepolarizing GABAergic signaling. GABA released by interneurons depolarized 65% of pyramidal cells, in whichchloride homeostasis was perturbed because of changes in expression of neuronal chloride cotransporters: KCC2(K-Cl cotransporter 2) was reduced by 42% and expression of NKCC1 (Na-K-2Cl cotransporter 1) increased by 144%.Ictal-like activities were initiated by convulsant stimuli exclusively in these epileptogenic areas. This study showsthat epileptic activities are sustained by excitatory effects of GABA in human peritumoral neocortex, as reported intemporal lobe epilepsies, suggesting that both glutamate and GABA signaling and cellular chloride regulation pro-cesses, all also involved in oncogenesis as already shown, induce an imbalance between synaptic excitation andinhibition underlying epileptic discharges in glioma patients. Thus, the control of chloride in neurons and gliomacells may provide a therapeutic target for patients with epileptogenic gliomas.
g.o
by Pauline Roca on June 19, 2017
rg/
INTRODUCTIONDiffusely growing gliomas, graded as grades II to IV according toWorldHealth Organization (WHO) definition, are highly epileptogenic pri-mary brain tumors in adults. Epilepsy incidence varies from 60 to100% in low-grade and 25 to 60% in high-grade gliomas (1, 2). Epilepticactivities seem to arise from the neocortex surrounding gliomas (3–5),and glioma cell infiltration may promote growth and recurrence oftumors at sites around their spatial core (6, 7).
Epileptic activity has often been linked to changes in the balance be-tween excitatory and inhibitory synaptic signaling. Recent data showthat massive excitatory glutamate release (8) underlies epileptic activityand contributes to neuronal death as tumors progress. Potassium (K+)buffering (9, 10) and glutamate clearance (11–13) are both impaired sothat extracellular levels are elevated in peritumoral neocortex (14–17).
1Sorbonne Universités, University Pierre and Marie Curie (UPMC) University of Paris 06, F-75005Paris, France. 2Institut du Cerveau et de laMoelle Epinière, INSERMUMRS975, CNRS UMR7225,UPMC University of Paris 06, F-75013 Paris, France. 3Service de Neurochirurgie, CentreHospitalier Sainte-Anne, F-75014 Paris, France. 4University Paris Descartes, Pôle de rechercheet d’enseignement supérieur (PRES) Sorbonne Paris Cité, F-75005 Paris, France. 5Servicede Neuropathologie, Centre Hospitalo-Universitaire Pitié-Salpêtrière, Assistance Publique–Hôpitaux de Paris (AP-HP), F-75013 Paris, France. 6INSERM, Institut de Neurobiologie de laMéditerranée (INMED), Parc Scientifique de Luminy, F-13009 Marseille, France. 7Aix-Marseille University, UMR S901, Parc Scientifique de Luminy, F-13009 Marseille, France.8Service de Neuropathologie, Centre Hospitalier Sainte-Anne, F-75014 Paris, France. 9Unitéd’Epileptologie, Centre Hospitalo-Universitaire Pitié-Salpêtrière, AP-HP, F-75013 Paris,France. 10Neuroscience Center, University of Helsinki, 00014 Helsinki, Finland. 11Service deNeurochirurgie, Centre Hospitalo-Universitaire Pitié-Salpêtrière, AP-HP, F-75013 Paris,France. 12Département de Neurophysiologie, UPMC, Centre Hospitalo-Universitaire Pitié-Salpêtrière, AP-HP, F-75013 Paris, France. 13Infantile Epilepsies and Brain Plasticity, INSERM,Unit U1129, University Paris Descartes, PRES Sorbonne Paris Cité, CEA, F-75015 Paris, France.*These authors contributed equally to this work.†Corresponding author. E-mail: [email protected]
www.S
On the other hand, neuronal inhibitionmay be defective. In the neocortexsurrounding a tumor, g-aminobutyric acid A (GABAA) receptor expres-sion (18) and the numbers of inhibitory interneurons and synapses are re-duced (5, 19, 20). Work on nontumoral human epileptic tissue suggeststhat GABAergic synapses generate depolarizing effects, which contrib-ute to epileptic activities (21–24). GABAA receptor channels are mainlypermeable to chloride (Cl−). If the driving force for Cl− induces an in-ward Cl− flux, a cell will be hyperpolarized. In contrast, an outward fluxof Cl−will depolarize neurons andmay result in a functional excitation. Inmature neurons, intracellular Cl− concentration is normally maintained atlow levels, by extrusion via the K-Cl cotransporter 2 (KCC2), whereas Cl−
loading by Na-K-2Cl cotransporter 1 (NKCC1) is reduced (25). Recentdata on human tissue suggest that Cl− homeostasis is altered in gliomas.Cl− concentrations are increased both in neurons (26, 27) and inmigrat-ing glioma cells (28, 29), loaded by NKCC1 (26, 30, 31), which is highlyexpressed in human peritumoral neocortex (32). The loading of neu-rons with Cl−may underlie epileptogenic effects, whereas its accumula-tion in glioma cells contributes to oncologic processes.We therefore askedwhether the effects of a defective Cl− homeostasis on GABAergic signalingmight be involved in epileptogenesis in human peritumoral neocortex.
RESULTS
Identification of a spontaneous interictal-like activityWestudied 81 slices from47 fresh brain tissue specimens obtained fromthe “surgical margin” (the removed neocortex that surrounds the mac-roscopic tumor) from 29 patients with supratentorial, hemispheric, anddiffuse low-grade (n = 17, WHO grade II) or high-grade (n = 12, 4
cienceTranslationalMedicine.org 9 July 2014 Vol 6 Issue 244 244ra89 1

R E S EARCH ART I C L E
WHO grade III and 8 WHO grade IV) gliomas (Fig. 1A and table S1)(33). Spontaneous activitywas recorded from74 of 81 (91.4%) slices from42 of 47 (89.4%) brain tissue specimens from 28 of 29 (96.6%) patients.The activity included spontaneous interictal-like discharges (IIDs), con-sisting of a field potential and multiunit firing, in records from 36 of 81slices (44.4%) from 25 of 47 tissues (53.2%) from 20 of 29 patients (69%)(Fig. 1B). Multiunit discharges alone were recorded from the remaining38 of 45 slices (84.4%). IIDs were more frequent in slices (n = 32 of 66,
www.S
48.5%) from patients (n = 17 of 22, 77.3%) with preoperative seizures thanin those (n = 4 of 15, 26.7%) from patients (n = 3 of 7, 42.9%) withoutseizures (P = 0.05) (Fig. 1C).
Spatial distribution of interictal-like activityWe asked whether sites of IID generation were correlated with re-gions of tumor infiltration. Only infrequent multiunit activity wasrecorded from tissue (14 slices from 7 patients) obtained at distances of
by Pauline R
oca on June 19, 2017http://stm
.sciencemag.org/
Dow
nloaded from
A
Cx
TuTu
Cx
Cx
Tu
D "Low" tumor infiltration"High" tumor infiltrationTumor mass
H&EH&E
Ki67Ki67
Spontaneous interictal-like activityNo activity
C
SeizuresYes No
n = 5
n = 17
n = 5
n = 2
P = 0.05
Seizure controlYesNo
n = 3
n = 11
n = 2
n = 6
ns
Perc
enta
ge
of p
atie
nts
0
25
50
75
100
Perc
enta
ge
of s
lices
0
25
50
75
100
Infiltration
Low
P = 0.005
n = 5
n = 2
n = 1
n = 6
n = 4
HighTumor
P = 0.009
Macroscopictumor component
Yes
n = 21
n = 6
No
n = 24
n = 30
n = 14
Control
Tu
Ctrl
Cx1
Cx2
B
Cx
50 µV500 ms
Tu
Imagingabnormalities
YesNo
n = 10
n = 17
n = 26
P = 0.004
Tumor gradeLow High
n = 29
n = 21
n = 16
n = 15
ns
Histopathology
n = 28
Fig. 1. IIDs are generated in the humanneocortex infiltrated by glioma cells. (A)
Example of a left parietal low-grade (WHOgrade II) glioma. The tumor appears as a hy-persignal area on a Fluid Attenuated InversionRecovery (FLAIR) sequence (far left), as a hypo-signal area on a three-dimensional spoiledgradientsequence (near left), andaspale,hyper-trophied, and infiltrated gyri on intraoperativephotographs (mid right). Brain tissue specimenswere sampled inside the tumor (Tu) and fromtheneocortex (Cx) outsidemacroscopic tumorinfiltration. In areas outside visible tumor ab-normalities (Cx), we detected only an infiltra-tion by glioma cells [hematoxylin and eosin(H&E) staining, ×200]. Tumor infiltration wasobvious in tissue from areas of visible imag-ing tumor abnormalities (Tu; H&E staining,×200). Scale bar, 100 mm. (B) Multiple extra-cellular recordings of IIDs from a slice con-taining both the solid tumor component andadjacent infiltrated neocortex. Electrode loca-tions: Cx1, superficial neocortical layer; Cx2,mid-neocortical layers; Tu, solid tumor tissue.Ctrl shows a record from noninfiltrated neo-cortex in a control tissue from another tumorspecimen. (C) The proportion of patients orslices from which IIDs were (black) or werenot (white) detected, grouped by history ofseizures (29 patients; P = 0.05, Fisher’s exacttest), preoperative seizure control with anti-epileptic drugs [22 patients; ns, not significant(Fisher’s exact test)], tumor grade (81 slices;low-grade versus high-grade; ns, Fisher’s ex-act test), macroscopic tumor component onMRI (81 slices; inside versus outside regions ofFLAIR hypersignal on MRI; P = 0.004, Fisher’sexact test), presence of a macroscopic tumorcomponent on gross histopathological analy-sis (81 slices; presence versus absence versuscontrol; 14 slices; P = 0.009, Fisher’s exact test),and histopathological analyses (18 slices; tu-mormass versus high tumor infiltration ver-sus low tumor infiltration by isolated tumorcells; P = 0.005, Fisher’s exact test). (D) Clas-sical histopathogical features of a gliomawith H&E (upper) and Ki67 (lower) stains.The tumor mass (left) is devoted of anyneurons. The area of high tumor infiltration(middle) is a neocortical tissue infiltrated by10 or more tumor cells per high-power field.The area of low tumor infiltration (right) is aneocortical tissue infiltrated by isolated glio- ma cells (fewer than 10 glioma cells per high-power field). Scale bars, 100 mm; 25 µm (insets).cienceTranslationalMedicine.org 9 July 2014 Vol 6 Issue 244 244ra89 2

R E S EARCH ART I C L E
by Pauline R
oca on June 19, 2017http://stm
.sciencemag.org/
Dow
nloaded from
~30 mm from image-defined abnormalities during surgical access todifferent tumors (Fig. 1B).Histopathological analysis revealed no tumorinfiltration by isolated tumor cells at this distance in tissues obtainedfrom these patients (7 slices from 4 insular gliomas, 4 slices from 2 fron-tal gliomas, and 3 slices from amesial temporal glioma) (Fig. 1, B andC).IIDs were generated significantly more frequently in slices devoid ofany macroscopic tumor component as defined on magnetic resonanceimaging (MRI) and according to intraoperative localization [“outside im-aging abnormalities” (60.5%) versus “inside” (26.3%);P= 0.004] and on
www.S
histopathological analyses [“absence of macroscopic tumor compo-nent” (55.6%) versus “presence” (22.2%); P = 0.009] (Fig. 1C). IIDs wererecorded more frequently in slices with high tumor infiltration (6 of 7,85.7%) than in slices with low tumor infiltration (2 of 7, 28.7%) andnever in sliceswith a solid tumormass (0 of 4, 0%) (P= 0.005) (Fig. 1, CandD). A link betweenmolecular defects in the glioma and the recordingof IID was explored. The density of CD3+ (P = 0.852), CD20+ (P = 0.472),andCD68+ cells (P = 0.645) and Ki67+ cells in neocortex (P = 0.852)or in white matter (P = 0.772) had no significant influence (fig. S1).
II III IV V VI
D
Prop. speed(mm/s)
0
25
Cortical depth(mm)
0
4
Lateral extent(mm)
0
4
1 s50 µV
100 ms
1* * * * * * * *2 3 4 1 2 3 4
B
50 µV 40 ms
Filtered (200–400 Hz)
II III IV V VI
1 s
200
400
600
50
200
150
100
0
Time (ms) 30 60 90 120 0
C Filtered (200–400 Hz)
40 ms
II III IV V VI
1 s 50 µV
200
400
600
0 50
200
150
100
Time (ms) 30 60 90 120 0
A Raw
FP
MUA
1 s 40 ms
50 µV
50 µV
75 µV
Freq
uen
cy (H
z)
200
400
600
50
200
150
100
Pow
er (µ
V2 )
Filtered (250–350 Hz)
Raw
Time (ms) 30 60 90 120 0
20 µV50 ms
0
1 m
m
E
1l e2l e
3l e4l e
Fig. 2. IIDs are restricted to superficialneocortical layers and are generated in
multiple sites. (A) Extracellular recordsof IIDs. They consist of bursts of multiunitactivity (MUA; >300-Hz high-pass filter)correlated with field potentials (FP; <100-Hzlow-pass filter) (left). Expanded raw, MUA,and FP traces are shown in themiddle. HFOs(filtered to pass 250 to 350 Hz) are detectedduring IIDs (upper right). The green dottedline shows the onset of the IID FP. Time fre-quency plots (lower right) show a meandominant frequency of 251 ± 69 Hz (n =572 events). (B and C) Multiple extracellularrecords of IIDs from slices containing infil-trated neocortex. In (B), four electrodes areplaced at different depths of the same neo-cortical column.They showthat IIDsandHFOswere synchronous in a vertical column-likeregionwith field onset, maximal amplitude,and the largest HFO at the deep border oflayer III. In (C), four electrodes are placed atthe interface between layers III and IV at thesamedepth over a lateral distance of 1mm.They show a spatially restricted lateralspread of IIDs and HFOs. HFOs were neverdetected in the absence of IIDs. (D) IIDs areinitiated at multiple foci in infiltrated neo-cortex. Multiple records from a slice of infil-trated neocortex with four electrodes (el)located at the interface between layers IIIand IV at separations of: el1—1 mm—el2—3mm—el3—1mm—el4. Expanded tracesofevents *1, *2, *3, and*4are shown in themid-dle. (E) Mean ± SD of the neocortical depth,lateral extent, and propagation speed of IIDsin the recorded slices. IIDswere recorded at ameanmaximal depth of 2.1 ± 1.5mm (range,0.5 to 5; n = 31 slices) from the pia mater,propagated laterally over a mean distanceof 1.3 ± 0.94mm(range1 to5;n=22 slices) ata speed of 19 ± 3 mm s−1.cienceTranslationalMedicine.org 9 July 2014 Vol 6 Issue 244 244ra89 3

R E S EARCH ART I C L E
by Pauline R
oca on June 19, 2017http://stm
.sciencemag.org/
Dow
nloaded from
Thus, IIDs are not generated in the tu-mor mass, but our recordings suggestthat they may arise from regions of tu-mor infiltration surrounding neocorticalgliomas.
Cortical organization andelectrophysiological characteristicsIIDs consisted of field potential associatedwith bursts of multiunit firing (Fig. 2A).Their mean amplitude was 57.9 ± 11.5 mV(range, 22.5 to 166.2), their mean durationfrom onset to peak was 24.4 ± 7.9 ms(range, 7.4 to 44), and they recurred witha mean frequency of 0.9 ± 0.7 Hz (range,0.1 to 4.2) (n = 9723 events; n = 36 slices).High-frequency oscillations (HFOs) werenested within IIDs in 40.7% of extra-cellular records (11 of 27 slices; n = 9 pa-tients). They occurred during 71.9% ofIIDs, and the mean dominant frequencywas 251 ± 69 Hz (range, 150 to 350) (Fig.2A).HFOwere never recorded fromcon-trol tissue or sites without IIDs (Fig. 2, BandC).HFOs thus tended to confirm theepileptic nature of IIDs (34).
IIDs were synchronous within “verti-cal” column-like regions in 31 of 36 slices(Fig. 2B). They were recorded at a meanmaximal depth of 2.1 ± 1.5 mm (range,0.5 to 5; n = 31 slices) from the pia mater(Fig. 2B). IIDswere initiated preferentiallyfrom layers III and IV (28 of 31 slices) andtypically propagated to superficial layers(Fig. 2, C and D). HFOs were restrictedto layers III and IV, suggesting that IIDswere generated locally. IIDs propagatedfromtheir initiation site over amean lateraldistance of 1.3 ± 0.94 mm (range, 1 to 5;n = 22 slices) (Fig. 2, C and E) at a speedof 19 ± 3 mm s−1. Multiple, partly over-lapping, asynchronous IID foci were de-tected in 25 of 36 slices (Fig. 2D). Themean distance between foci was 1.8 ±1.2 mm (range, 0.7 to 5; n = 22 slices). Spa-tial patterns of IID initiation and spreadwere similar in adjacent slices from 10of 30 brain tissue specimens.
Thus, IIDs are generated at multipleneocortical sites surrounding gliomasand are spatially restricted to superficialand mid-neocortical layers.
Pharmacology and cellular basisof interictal-like activityWenext examined the role of glutamater-gic and GABAergic signaling in the gene-sis of IIDs. The N-methyl-D-aspartate
B
10 µV
Time (s) 0 0.1 0.3 0.4
PSP pro
bab
ility
Interneuron 40
80
120
160
0.3
0.2
0.1
0.4
Frequ
ency
Pyramidal cellDepolarizing PSPHyperpolarizing PSP
Total count
Total count
Pyramidal cellAP
InterneuronAP
IID FPC
Control
Washout
500 ms
D
1 s
10 mV
Interneuron
–56 mV
50 ms
10 mV
Pyramidal cell hyperpolarized during interictal discharges
–66 mV
10 mV
Pyramidal cell depolarized during interictal discharges
–63 mV
500 ms
A Control
Washout
Control
Washout
Control
+ DL-APV
Washout Washout
Control
Fig. 3. IIDs depend on glutamatergic and GABAergicsignals andare initiatedby interneuron firing. (A) Pharma-cology of IIDs. TheNMDA receptor blocker DL-APV (50 µM) didnot modify extracellularly recorded IIDs, but they were sup-pressed by the AMPA receptor antagonist DNQX (20 µM)
www.ScienceTranslatio
(left). The GABAA receptor antagonists picrotoxin (50 µM) and gabazine (10 µM) reversibly blocked IIDs (right).(B) Cellular basis of IIDs. Spontaneous intracellular (upper) and extracellular (lower) records of neurons frominfiltrated neocortex. Expanded traces of single IIDs at right. An interneuron (top, black) fired before and duringIID initiation. Some pyramidal cells were depolarized (middle, blue), and others were hyperpolarized during IIDs(bottom, red). (C) Timing of cellular firing during IIDs. Mean population field activity (IID FP; top) plotted againstsequential raster traces and peri-event histogramof interneuron firing (interneuronAP and count). Raster tracesand peri-event histogram for firing of an excited pyramidal cell (pyramidal cell AP and count). The green dottedline shows the onset of the IID FP. Timing of the peak of depolarizing PSPs is shown by blue dots, and timing ofthe peak of hyperpolarizing PSPs is shownby red dots. The time course of interneuron firing (black line) and theprobability of depolarizing (red) andhyperpolarizingPSPs (blue) are shown in the lowerbox. (D) Hyperpolarizinginterneurons with DAGO (10 µM), a m-opioid receptor agonist, reversibly suppressed IID FPs.
nalMedicine.org 9 July 2014 Vol 6 Issue 244 244ra89 4

R E S EARCH ART I C L E
by Pauline R
oca on June 19, 2017http://stm
.sciencemag.org/
Dow
nloaded from
(NMDA) receptor antagonist DL-2-amino-5-phosphonopentanoic acid(DL-APV, 50 mM; n= 6) had no effect, but the AMPA receptor antagonist6,7-dinitroquinoxaline-2,3-dione (DNQX, 20mM;n=6) irreversibly sup-pressed IIDs (Fig. 3A, left). IIDs were reversibly suppressed by GABAA
receptor antagonists picrotoxin (50mM;n=6) or gabazine (10 mM;n=5)(Fig. 3A, right). These data indicate that both excitatory and inhibitorysynapses are involved in IID generation.
Intracellular recordings were made from single pyramidal cells andinterneurons to characterize the neuronal and synaptic local networkbasis of IID generation and specifically to examine the role of depolari-zing responses to GABA. Themean resting potential of recorded pyram-idal cells [n = 20 from 11 epileptic patients (10 cells from grade II, 5 cellsfrom grade III, and 5 cells from grade IV gliomas)] was −60.3 ± 8.1 mV(range, −50.0 to −79.0), and mean input resistance was 44.2 ± 15.8 MW(range, 30 to 68). Interneurons [n = 2, from 2 epileptic patients (1grade II and 1 grade IV gliomas)] were distinguished by a fast firingpattern and a short action potential duration (35). They fired for 39± 7ms(range, 22 to 199) before IID initiation at a mean frequency of 78 ± 36Hz(range, 34 to 142;n=32 events) andwere always active during IIDs (Fig.3B). The behavior of pyramidal cells during IIDs was variable. Cellsdistant from foci (n = 3 from 1 epileptic patient with a grade II glioma)did not consistently receive synaptic events during IIDs. Seventeencells were recordedwithin the IID area. At resting potential, 6 (35.3%) ofthese neurons received hyperpolarizing synaptic events during IIDs(Fig. 3B). The remaining 11 of 17 cells (64.7%) received depolarizingsynaptic events and sometimes fired during IIDs (Fig. 3B). In contrastto interneurons, they never discharged before the onset of the IID field.The restingmembrane potential (mean,−62.6 ± 10.3mV; range,−79.0 to−50.0) and the input resistance (mean, 47.0 ± 19.1 MW; range, 30.0 to68.0) of cells that displayed depolarizing synaptic events were similarto the restingmembrane potential (mean, −58.8 ± 4.6mV; range, −68.0to −56.0) and input resistance (mean, 40.1 ± 14.1 MW; range, 30.0 to50.0) of cells that received hyperpolarizing synaptic events during IIDs(P = 0.859 and P = 0.800, respectively). The excitability of the two cellgroups was also similar. Depolarizing pulses of 0.5 nA and duration of100 ms induced action potentials at 6.9 ± 9.0 Hz in 11 cells that firedduring IIDs, and identical stimuli applied to neurons that did not fireduring IIDs induced action potentials at 6.8 ± 9.2 Hz (P = 0.460). Wenext compared the timing of firing and synaptic events received by in-terneurons (n = 2) and pyramidal cells (n = 5) during IIDs (Fig. 3C).Both interneurons consistently fired before IID onset and before py-ramidal cell discharges. Depolarizing postsynaptic potentials (PSPs)also tended to precede hyperpolarizing PSPs, suggesting that interneuronfiring may have contributed to IID initiation. We tested this hypothesisusing the m-opioid receptor agonist [3H][D-Ala2,N-Me-Phe4,Gly5-ol]enkephalin (DAGO, 10 mM; n = 5) to hyperpolarize interneurons andeffectively remove them from the local network. DAGO reversibly sup-pressed IIDs in all 5 of 5 cases (Fig. 3D), reinforcing the interneurons’drive hypothesis.
Depolarizing responses to GABA during IIDsInterneuron firing preceded IID onset, and 64.7% of pyramidal cellswere depolarized during IIDs. We asked whether pyramidal cell de-polarization could result from GABAA release by measuring the com-pound reversal potential of PSPs impinging on pyramidal cells, whichcombine inhibitory and excitatory inputs [n = 15 from 9 epileptic pa-tients (7 cells from grade II, 5 cells from grade III, and 3 cells fromgradeIV gliomas)] during IIDs (Fig. 4A). Two distinct behaviors were appar-
www.S
ent (Fig. 4B). In 6 of 15 pyramidal cells (40%), synaptic events reversednegative to resting potential with a mean driving force of 7.8 ± 3.9 mV(range, 4 to 14) [mean reversal potential, −66.6 ± 4.0 mV (range, −72to −62.5)]. In the remaining 9 of 15 cells (60%), synaptic events re-versed at values depolarized from resting potential with a mean driv-ing force of −13.4 ± 10.4mV (range, −28 to −6) [mean reversal potential,−49.1 ± 10.8 mV (range, −40 to −73)]. The mean resting potential ofthe depolarized (−58.8 ± 4.6 mV; n = 6) and hyperpolarized (62.5 ±10.0 mV; n = 9) subgroups of cells was not significantly different (P =0.414). Thus, GABAergic signaling depolarized about 60% of pyram-idal cells situated in IID foci, similar to the 65% of cells receiving adepolarizing PSP during IIDs.
Because IIDs were associated with depolarizing actions of GABAand were present in regions of tumoral infiltration, we asked whetherthe depolarizing effects of GABAwere limited to zones of infiltration. Ininfiltrated tissues, 7 of 8 recorded pyramidal cells (87.5%) were depolar-ized byGABAduring IIDs. In contrast, depolarizationwas detected in 4of 9 cells recorded (44.4%) from tissue with no macroscopic or histo-pathological evidence for infiltration (P = 0.050) (Fig. 4B). The propor-tion of cells depolarized by GABAwas higher in grade IV gliomas (n=5 of 5) than in grade III (n = 2 of 5) or grade II (n = 4 of 7) gliomas (P =0.050) (33).
Changes in expression or function of molecules that regulate Cl−
homeostasis could account for depolarizing GABAergic effects andcontribute to tumor infiltration. The K-Cl cotransporter NKCC1 is ex-pressed at low levels in nonjuvenile tissue (36), and Cl− extrusion by thetransporter KCC2maintains low levels of internal Cl− inmature tissues,assuring hyperpolarizing effects ofGABA (37).Wemeasured the levels ofboth transporters in Western blot analyses of 27 brain tissue specimensobtained from the “surgical margin” of 14 patients with supratentorialgliomas (6 grade II, 5 grade III, and 3 grade IV; 9 with a history ofseizures) and from 4 patients with a cerebral metastasis of a carcinoma(4 control samples obtained during surgical access to deep-seated tu-mor; no history of seizures). NKCC1 protein expression was signif-icantly increased in Western blots of peritumoral tissue (144 ± 31%)compared to control (100 ± 16%; P = 0.004) and was significantly in-creased in Western blot of tissues from epileptic patients (146 ± 31%)compared to nonepileptic patients (113 ± 25%; P = 0.002) (Fig. 4D).NKCC1 expression by glioma cells (30, 31, 38) might mask possiblechanges of the protein in neurons of the infiltrated neocortex.We there-fore correlated NKCC1 expression with glioma infiltration. There wasno significant difference of NKCC1 expression in peritumoral tissueswith a high tumor infiltration (139 ± 25%) and those with a low tumor in-filtration (146 ± 34%) using a neuron-specific reference protein (b3-tubulin;P = 0.676) or using a glial-specific reference protein (a-tubulin; 192 ± 52%versus 158 ± 65%; P= 0.833) (fig. S2). Similarly, there was no significantdifference ofNKCC1 expression betweenhigh-grade gliomas (139± 25%)and low-grade gliomas (146 ± 35%; P = 0.676). An up-regulation ofNKCC1 in peritumoral pyramidal cells seems likely to have epileptogenicactions.We tested this hypothesis using bumetanide at doses that act se-lectively to suppressNKCC1 function in neurons (8 mM). In 6 of 6 slices,bumetanide reversibly suppressed IIDs over a period of 50 ± 10 min(range, 45 to 60), presumably reflecting the time taken to establish newsteady-state Cl− levels in neurons (Fig. 4C). These results reflect an in-crease in chloride loading, highlighting a possible change in chlorideflux after GABAA receptor activation.
Because intraneuronal concentrations of Cl− mainly depend onequilibrium between NKCC1-mediated Cl− load and KCC2-mediated
cienceTranslationalMedicine.org 9 July 2014 Vol 6 Issue 244 244ra89 5
R E S EARCH ART I C L E
Cl− extrusion, we then investigated KCC2 protein expression. KCC2proteinwas significantly decreased inWestern blot of peritumoral tissue(42 ± 36%) compared to control (100 ± 44%; P = 0.031). Nevertheless,KCC2 was not significantly decreased in Western blot of tissues fromepileptic patients (40 ± 35%) compared to nonepileptic patients (75 ±49%; P = 0.158) (Fig. 4C). There was also no significant difference ofKCC2 expression in peritumoral tissues with high tumor infiltration
by Pauline R
oca on June 19, 2017http://stm
.sciencemag.org/
Dow
nloaded from
--
-
)
l
-
-
)
)
)
--
t
,-
t
,-
www.S
(43 ± 37%) and those with low tumor infiltration (39 ± 39%; P = 0.112).Similarly, there was no significant difference of KCC2 expression in high-grade gliomas (44 ± 37%) and low-grade gliomas (41 ± 38%; P = 0.899).Because protein expression does not demonstrate function of the pro-tein, we next examined neuronal expression of KCC2 by immuno-histochemistry with a KCC2-specific antibody (Fig. 4E). The numberof KCC2 negative neurons was significantly higher in peritumoral tissue
500 ms
Control
Washout
+ 8 µM bumetanide
50 µV
C
Reve
rsal
po
t. (m
V) –40
–60
–80
–40–60–80Resting pot. (mV)
B P = 0.019
100
50
0
Perc
enta
ge
Tumor
n = 1
No
n = 5
100
50
0Perc
enta
ge
of c
ells
Control Glioma
E
0
KCC2
NeuN0
Control Glioma
No expressionCytoplasm expressionMembrane expression
0
Vm (mV)
–40
–80–100–120
–15
–10
–5
15
10
5
Co
mp
ou
nd
po
stsy
nap
tic
po
ten
tial
am
plit
ud
e (m
V)
0
A
50 ms
Amplitude (mV)
–70
–80
–90
–100
–60
–50
–40
–30
D
AntiNKCC1150 kD
Anti tubulin50 kD
AntiKCC2
150 kD
Anti3 tubulin
55 kD
Ctrl Glioma
KCC2 intensityNKCC1 intensity P = 0.002
No YesEpilepsy
2
1
0
P = 0.004
Ctrl Glioma
ns
No YesEpilepsy
2
1
0
P = 0.031
Ctrl Glioma
Ctrl Glioma
n = 7
n = 4
HLHL
Fig. 4. Cl− regulation impairment contributes to IIDs. (A) GABAA reversal poten
tial (Vrev) in pyramidal cells. PSP amplitudeduring IIDs was measured in pyramidal cellsof the neocortex infiltrated by glioma cellsmaintained at different potentials. Recordsare shown (at the left) andmembrane potential (Vm) plotted (at right) fromone cellwith aVrev of−71mV (white arrowandopen squaresand another cell with Vrev values of −48 mV(black arrow and filled circles). (B) Correlationof Vrev and resting potential for 15 pyramidacells. Reversal potentials were depolarizingwith respect to rest in nine cells (filled circlesabove the diagonal line), and hyperpolarizingin six cells (open circles below the line). Theproportion of pyramidal cells depolarizedby GABA during IIDs (black part of the histogram, “Depol” versuswhite part, “Hyper”) wassignificantly higher in tissues with tumor infiltration than in tissues with no infiltration(n = 17 cells; P = 0.019, Fisher’s exact test). (CBlocking the K-Cl cotransporter NKCC1withbumetanide (8 µM) reversibly suppressedspontaneous IID FPs. (D) RepresentativeWesternblots forNKCC1 (left) andKCC2 (rightin control neocortex and areas of low (“lowinfiltr”) and high infiltration (“high infiltr”around human gliomas. NKCC1 expressionwas normalized to a nonneuronal-specificmarker, a-tubulin. KCC2 expression was normalized to a neuron-specific marker, b3 tubulin. Histogram representing normalizedNKCC1 protein quantification shows thaNKCC1 is significantly increased in gliomasamples as compared to controls (n = 27P = 0.004, Mann-Whitney test) and in epileptic samples as compared to nonepilepticsamples (n = 27, P = 0.002, Mann-Whitneytest). Histogram representing normalizedKCC2 protein quantification shows thaKCC2 is significantly decreased in gliomasamples as compared to controls (n = 27P = 0.031, Mann-Whitney test) but not in epileptic samples as compared to nonepilepticsamples (n = 27, P = 0.158, Mann-Whitneytest). (E) Representative images of KCC2 immunoreactivity stained with neuronal nuclear antigen (NeuN) marker.Left: The fluorescence and the immunohistochemical labeling are distribut-ed along the plasma membrane (arrowhead) of the cells in control tissue.Middle: In a glioma sample, the distribution of KCC2 immunoreactivity (flu-orescence and immunohistochemistry) in neurons of infiltrated neocortexranges frommembrane staining (open arrowhead) to staining in the cy-toplasmic region (filled arrowhead) to a loss of staining (open circle).Right: The quantification of KCC2 fluorescence redistribution for each cellshows a significant decrease of membrane staining (n = 27, P = 0.01, Fish-er’s exact test) and a significant increase in the loss of staining (n = 27, P =0.04, Fisher’s exact test) in glioma samples as compared to controls. Scalebar, 10 mm.
cienceTranslationalMedicine.org 9 July 2014 Vol 6 Issue 244 244ra89 6

R E S EARCH ART I C L E
(45 ± 13.2%) than in control tissue (12 ± 6.5%) (P = 0.04). Furthermore,when KCC2 was detected in neurons of peritumoral neocortex, immu-nostaining tended to be cytoplasmic (38.6%) rather than membranous(15.8%), compared to a largely membranous (71.3%) rather than cyto-plasmic (16.2%) expression in control neurons. Exclusive membraneKCC2 immunostaining was much lower in neurons of peritumoral neo-cortex (15.8 ± 6.7%) than controls (71.3 ± 4.2%) (P = 0.01). These differ-ences in neuronal expression site should reduce KCC2 functionality inperitumoral neurons.
Together, these data point to an impaired Cl− homeostasis inepileptogenic neocortex surrounding a glioma. GABA-mediated de-
www.S
polarization of a majority of peritumoral pyramidal cells is corre-lated with both an increase of NKCC1 expression and a loss of KCC2immunoreactivity.
Induction of ictal-like activityIctal-like discharges (IDs) were induced pharmacologically in peritu-moral tissue. Combining two proconvulsant stimuli, an increase of ex-tracellular K+ to 8 mM and a reduction of external Mg2+ to 0.25 mM(24), induced IDs in 7 of 19 slices (36.8%) where IIDs were generated(3 of 8 patients, 37.5%). Two IDpatterns could be distinguished (Fig. 5A).The first consisted of recurrent rhythmic bursts of frequency 2.9 ± 0.9 Hz
by Pauline R
oca on June 19, 2017http://stm
.sciencemag.org/
Dow
nloaded from
Even
ts (n
)
0
200
0 100 300Amplitude (µV)
Interictal-like dischargePre-ictal discharge
400
P < 0.001
Late
ral e
xten
t (m
m)
0
3
6P < 0.001
Am
plit
ud
e (µ
v)
0
600ns
Freq
uen
cy (H
z)
0
2
1
P < 0.001
Du
rati
on
(ms)
0
50
25
C
Am
plit
ud
e (
v)
0
125
250
Duration (min)0 1 32 34 3630
5 s
B
Raw
MUA
Freq
uen
cy(H
z) 15
10
5
20
0 50
200
150
100
5 s
A
Pow
er (µ
V2 )
Ctrl
Control
5 s
D
Control
Control
p
g
b
Fig. 5. IDs are preceded by a specific pre-ictal activity. (A) Extracellular records of an
ID induced by exposure to 0.25 mM Mg2+and 8 mM K+ in the infiltrated neocortex.PIDs (black-filled circles) recurred beforeseizure onset, followed by rhythmic bursts.MUA and time frequency plot of the localfield potential are shown below. The greendotted line shows the onset of the seizure-like event. Ctrl shows a record from nonin-filtrated neocortex in a control tissue fromanother tumor specimen with only an indi-vidual cell firing and no IID, PID, or ID afterexposure to 0.25mMMg2+ and 8mMK+ for90 min. (B) PIDs emerge during the transi-tion to ictal-like activity in vitro. Extracellularrecords of the transition to ictal-like activity(0.25 mM Mg2+ and 8 mM K+). The greendotted line shows the onset of the seizure-like event. Amplitudes of FPs during the transi-tion show the emergenceof larger PIDs (filledcircles), but the amplitudes of IIDs (open cir-cles) did not change. Bottom: IIDs before con-vulsant application (left) and co-occurrenceof PIDs and IIDs during the transition (right).(C) Differences in IID and PID FPs. Amplitudedistributions of all FPs during the transitiondistinguish between IIDs and PIDs. Mean ± SDof the amplitude (n = 913 events, P < 0.001,Mann-Whitney test), duration (n = 913 events,P<0.001,Mann-Whitney test), frequency (n=913 events, P = 0.193, Mann-Whitney test),and lateral extent (n = 913 events, P < 0.001,Mann-Whitney test) of IIDs (white) and PIDs(black) at steady state. (D) PIDs do not dependon GABAergic signaling. Extracellular recordsof IIDs (white dots), PIDs (black dots), andIDs at steady state in a 0.25 mM Mg2+ and8mMK+ solution. TheGABAA receptor antag-onist picrotoxin (50 mM, for 30min) reversiblyblocked IIDs, but not PIDs (upper trace). TheGABAA receptor antagonist gabazine (10 mM,for 40 min) blocked IDs, but not PIDs (middletrace). The NKCC1 antagonist bumetanide(8 mM, for 45 min) blocked IDs, but not PIDs(lower trace).
cienceTranslationalMedicine.org 9 July 2014 Vol 6 Issue 244 244ra89 7
R E S EARCH ART I C L E
(range, 1.2 to 4.3; n = 34 events). The second involved an initial fast,low-voltage activity (meanduration, 0.8 ± 0.1 s; range, 0.65 to 0.99;n=8events) at 270 ± 97 Hz (range, 118 to 410), which then evolved intorhythmic bursts. The mean duration of IDs was 34.1 ± 17.7 s (range,6.2 to 62.1). The transition from IIDs to IDs occurred over 34.0 ±10.2 min (range, 20 to 50; n = 6 slices). IDs then recurred at an intervalof 54.7 ± 62.4 s (range, 7.5 to 397.0; n= 86 events) in the continued pres-
by Pauline R
oca on June 19, 2017http://stm
.sciencemag.org/
Dow
nloaded from
ence of proconvulsants. Slices of controlbrain tissue (n = 14) did not generate IDsin response to the sameproepileptic stimuli,increasing extracellular K+ to 8 mM alone(n = 8 slices) or coupled to a reduction ofexternal Mg2+ to 0.25 mM (n = 6 slices)(Fig. 5A).
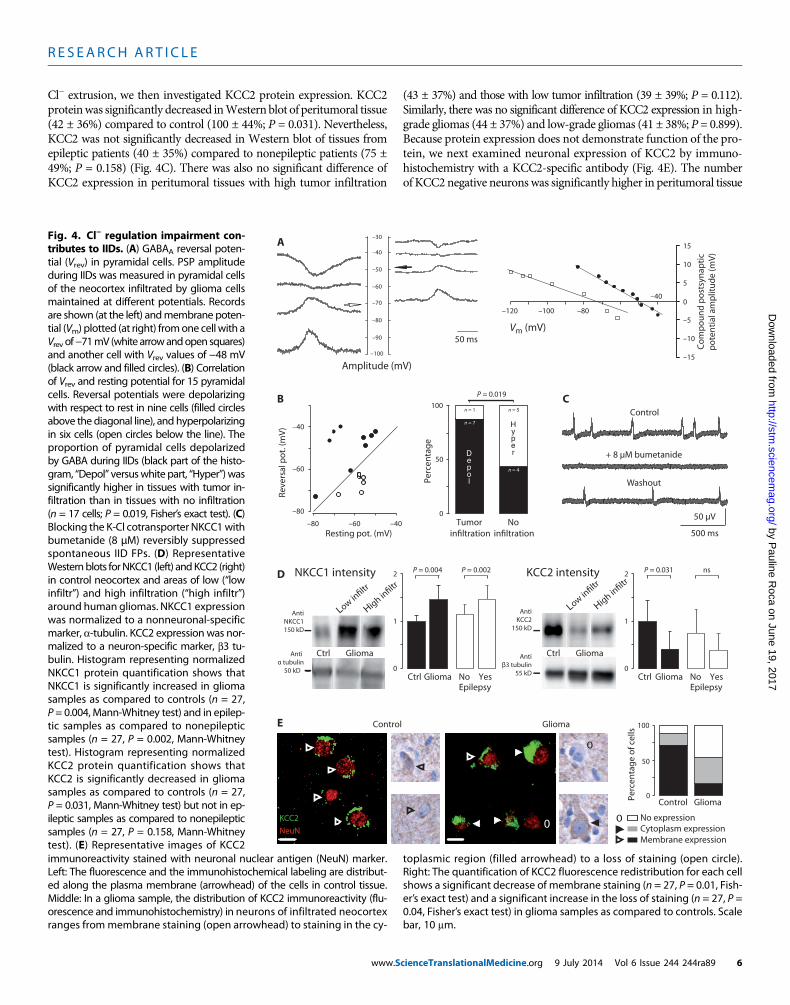
Pre-ictal discharge emergenceand dynamicsPre-ictal discharges (PIDs)were recorded in14 of 19 slices exposed to proconvulsantstimuli. In 7 of 7 slices, PIDs precededIDs, and comparable large field potentialswere detected in 7 of 12 slices that did notexhibit later IDs. PID amplitude increasedduring the transition to ictal discharges,and PIDs occurred concurrently with IIDsduring this transition (Fig. 5, B and C). Atsteady state (n = 446 events from 5 slices),PID amplitude and duration were largerthan those of IIDs (mean, 336 ± 114 versus58 ± 11 mV, P < 0.001, n = 446; 32.5 ± 8.6versus 24.4±7.9ms,n=446 and467 events,P < 0.0001), but frequencies were similar(0.9 ± 0.6 versus 0.93 ± 0.7 Hz; P = 0.727).PID fields were recorded from column-like regionswithmaximal amplitude in su-perficial neocortical layers III and IV (7of 7 slices) at distances of 1.4 ± 0.7 mm(range, 1 to 3; n=7 slices) from the piama-ter. PIDs propagated laterally for distancesup to 3.5 ± 1.3 mm (range, 1.5 to 5; n = 9slices) from their initiation site. PIDswerenever induced by identical stimuli in slicesof control tissue (n = 14).
We next examined the role of GA-BAergic signaling in PIDs and IDs andcompared it to the pharmacology of IIDs.PIDs were not affected by GABAA recep-tor antagonists (picrotoxin, 50 mM; n = 4;gabazine, 10mM;n=3patients; applicationof 45 to 70min; Fig. 5D). Both IIDs and IDswere reversibly suppressed by the sameGABAA receptor antagonists (picrotoxin,50 mM; n = 4; gabazine, 10 mM; n = 3 pa-tients) over amean period of 33 ± 6.6min(range, 30 to 40; Fig. 5D). This pharma-cological profile suggests the involvementof depolarizing effects of GABA on IIDsand IDs. We therefore tested the effects of
www.S
the blockade of the Cl− cotransporter NKCC1 with low doses of thediuretic bumetanide. At 8 mM, bumetanide abolished IIDs and IDswithin 45 min (n = 4) (Fig. 5D). As expected, it did not affect PIDs inrecords longer than 75 min (Fig. 5D).
HFOs associated with PIDs differed from those nested in IIDs(Fig. 6A). HFOs were detected in 91% of electrodes recording PIDs(11 of 12; n = 3 patients) as opposed to ~40% for IIDs. HFOs occurred
Del
ay (s
)
0
– 0.4
– 0.2
0.2
0.4
Time (s)
C
II III IV V VI
B
5 s
Seizureonset
0.5
0.6
0.7
0.3
0.4
Cro
ss-c
orr
elat
ion
50 ms
F iltered (250–350 H z )
Raw
20 µV
200
400
600
0 50
200
150
100
Pow
er (µ
V2 )
T ime (ms) 50 100 150 200 0
Freq
uen
cy (H
z)
# H
FOs
100
200
0
Frequency (Hz)100 200 300 400
# H
FOs
Time to FP onset (ms) 500–50 200150100
150
300
450
0
26.0 ± 13.4
50 ms
F iltered (250–350 H z )
Raw
Time (ms) 50 100 150 200 0
50 µV
Freq
uen
cy (H
z)
200
400
600
0
Pow
er (µ
V2 )
50
200
150
100
# H
FOs
Time to FP onset (ms)
500–50 100
5
10
15
020150
Frequency (Hz)100 200 300 400
# H
FOs
10
20
0
81.3 ± 38.7
A IIDs PIDs
Fig. 6. Interictal, pre-ictal, and onset of ictal-like events depend on dynamic organization of pop-ulation activities. and onset of ictal-like events depend on dynamic organization of population
activities. (A) HFOs occurring during IIDs (left, n = 284 events) and PIDs (right, n = 294 events). For eachtype of activity, top left: HFO recording (red trace) during an FP (black trace); bottom left: HFO timefrequency representation; top right: histogram of HFO timing with respect to a population event (themean frequency ± SD is indicated); bottom right: histogram of HFO frequency distribution during pop-ulation event. Population FP onset is shown as a green dotted line. Mean frequency of HFOs during IIDsand PIDs was 266 ± 90 Hz versus 251 ± 69 Hz, respectively. HFOs associated with IIDs had a narrow fre-quency spectrum and were restricted to the onset of an IID. HFOs during PIDs spanned the frequencyspectrum and persisted throughout PIDs. (B) Dual extracellular records during the initiation of aseizure-like event, with seizure onset shown by a green dotted line. IIDs (open circles) and PIDs (filledcircles) during the transition are shown above. PIDs are progressively recruited and recur before seizureonset. (C) Time delay and cross correlation of PIDs initiated at two distinct foci recorded by two electrodes.During seizure initiation, synchrony progressively increased, and propagation delay between the two PIDfoci was reduced.cienceTranslationalMedicine.org 9 July 2014 Vol 6 Issue 244 244ra89 8

R E S EARCH ART I C L E
Dow
nloaded fro
throughout PIDs but were restricted to IID onset. The range of HFOfrequencies associated with PIDs was wider than that for IIDs, althoughmean dominant frequencies were similar (266 ± 90 versus 251 ± 69Hz).These data suggest that IIDs and PIDs may result from distinct pro-cesses with different spatial and temporal characteristics.
We explored the dynamics of PIDs at ID onset. Once IDs occurredin recurring fashion, each ID (n = 34 events; n = 7 slices) was precededby 5 ± 4 PIDs (range, 1 to19) during 11.7 ± 7.7 s (range, 3.5 to 36.9) at afrequency of 0.46 ± 0.2 Hz (range, 0.07 to 0.69). When PIDs were gen-erated at distinct foci, the transition to ID was associated with anincreased synchrony and conduction speed between foci (n = 12 eventsfrom 2 slices from 2 patients) (Fig. 6, B and C).
These data indicate that the neocortex surrounding glioma generatestwo forms of synchronous epileptiform activities during the transitionto IDs. IIDs depend on depolarizing GABA and AMPA receptor–mediated glutamatergic signaling, whereas GABAergic transmissiondoes not contribute to PIDs. ID initiation requires functional GABAergicsignaling and involves depolarizing effects of GABA, which could berelated to Cl− accumulation in pyramidal cells, induced by recurring,synchronous PIDs.
by Pauline R
oca on June 19, 2017http://stm
.sciencemag.org/
m
DISCUSSION
Wehave shown that peritumoral neocortex infiltrated by glioma cells inslices of human tissue generates spontaneous epileptic discharges,which depend on both AMPA glutamatergic andGABAergic signaling.The onset of IIDs was preceded by interneuron firing. GABA depolar-ized a small majority of pyramidal cells in infiltrated tissues, reflectingchanges in Cl− homeostasis due to both a reduced KCC2 and increasedNKCC1 expression. Excited peritumoral tissue generated IDs precededby PIDs, but none of these glioma-related epileptiform activities weredetected in nonepileptic control tissue. Features of epileptiform activi-ties generatedbyperitumoral cortexwere similar to those of nontumoral,sclerotic, epileptic human temporal lobe (21, 22, 24), suggesting a com-mon basis of pathological activities.
This spontaneous population synchrony generated by tissue fromadult patients with gliomas should be classified as epileptic because(i) it is comparable to interictal epileptic activity recorded during gliomasurgery (3–5); (ii) neuronal activity was recorded from most slices, butonly half of the tissues generated IIDs; (iii) IIDswere generated focally atsimilar sites in adjacent slices from the same brain tissue; (iv) IIDs weregenerated in multiple peritumoral foci (4, 5), but never in control sam-ples; (v) HFOs, linked to zones of active epileptogenesis (39, 40), werenested in IIDs; and (vi) IDs were induced exclusively in slices that gen-erated IIDs. Thus, the peritumoral neocortex around gliomas is a pivotalstructure both for the genesis of epileptic activity and for infiltrationby glioma cells (6, 7). This link may explain the antiepileptic effects ofoncologic treatments (41–44) and the increase in seizure frequency astumors progress (45).
Our data suggest that interneuron firing preceded IIDs. The re-sulting pyramidal cell depolarization may contribute to IID initiationbecause GABAA receptor activation depolarized ~60% of pyramidalcells of peritumoral neocortex, owing to an excessive Cl− load mediatedby NKCC1. These data recall results from sclerotic nontumoral humanepileptic tissue (21, 22) and are consistent with molecular defects iden-tified in peritumoral tissues (32). In neurons with altered Cl− homeosta-sis, the reversal potential of GABA-evoked current depolarizes, and the
www.S
efficacy of GABAergic inhibition is reduced (32). Reversal potentialsmeasured here, based on compound GABAergic and glutamatergicPSPs, point to depolarizing effects of GABA. Our results support dis-equilibrium between an excitatory glutamatergic drive and an inhibito-ry GABAergic brake, a brake that can be switched into an accelerator.An increased glutamatergic drive (8, 14, 16, 17), due to both an increasedrelease fromglioma cells via the systemxc
− cystine-glutamate transporter(9, 12) and impaired glutamate uptake by glial cells (11), would con-tribute to synchrony and excitotoxicity (8, 12). Conversely, perturbedGABAergic signaling in peritumoral tissue may favor oncogenesis, andit is known that GABA regulates glioma cell proliferation (29). Intra-cellular Cl− concentrations in migrating and proliferating glioma cellsmay reach ~100 mM (26, 27). These concentrations are actively main-tained by the NKCC1 cotransporter (26, 31), which is strongly expressedin glioma cells (30, 32) and gangliogliomas (human glioneuronal tumors)(32, 46). Blockade of NKCC1 reduces tumor growth in animal models(31). Several mechanisms may contribute to NKCC1 up-regulation inperitumoral neurons: (i) extracellular hyperosmolarity (47) due to Cl−
and K+ release by tumor cells may enhance neuronal NKCC1 expres-sion (27, 48); (ii) BDNF (brain-derived neurotrophic factor) releaseby glioma cells (49, 50) reduces KCC2 expression (51) and so shouldweaken Cl− extrusion; (iii) the activation of WNK kinases by epidermalgrowth factor receptor–dependent signals may activate NKCC1 in bothglioma cells andneurons (52); (iv) newly formedneurons emerging fromneurogenesis in response to glioma development may share animmature phenotype (53). We note that NKCC1 expression does notdepend on tumor grade and that more neurons were depolarized byGABA in grade IV gliomas, although they are less often associatedwith seizures than low-grade gliomas (54, 55). This apparent paradoxmay be explained if highly destructive and rapidly growing grade IVgliomas restrain epileptogenicity.
This study, performed on human tissue rather than animal modelsof gliomas, has some limitations. Synaptic connectivity is reduced inslices, and influences from distant brain regions are lost. The slicingprocedure traumatizes and may alter Cl− regulation in neurons atdepths less than 50 mm from the surface (56). However, most cellsin this study were recorded deeper, no abnormal activity was obtainedfrom control tissues, and epileptiform activities were reliably pro-duced by the same area in adjacent slices. Furthermore, in an animalmodel of brain tumors, the seizure threshold assessed by GABAA
blocker administration was increased compared to controls (57), sug-gesting that our results have in vivo correlates. In some areas, abnormalor epileptiform activities were recorded in slices, but seizures were notdetected preoperatively, possibly because in situ, these aberrant electri-cal events remained restricted and did not reach a threshold for prop-agation. Seizures might also be missed or delayed in patients withgliomas.
Altogether, these data point to a similar defect in Cl− homeostasisand GABAergic signaling in two distinct epileptic syndromes: peri-tumoral cortical regions of human gliomas and sclerotic humantemporal lobe (21, 22, 24). This defect, together with an excessive glu-tamatergic excitatory drive, may be a common feature of human epi-leptogenesis. Further, molecules that control Cl− homeostasis may beuseful therapeutic targets for both epileptogenesis, as highlighted inthe present study, and tumor infiltration, as previously studied inanimal models (31). The efficacy of GABAergic antiepileptic drugs andtheir potential negative effects on glioma evolution will need to beinvestigated.
cienceTranslationalMedicine.org 9 July 2014 Vol 6 Issue 244 244ra89 9

R E S EARCH ART I C L E
by Pauline R
oca on June 19, 2017http://stm
.sciencemag.org/
Dow
nloaded from
SUPPLEMENTARY MATERIALS
www.sciencetranslationalmedicine.org/cgi/content/full/6/244/244ra89/DC1Materials and MethodsFig. S1. CD3+, CD20+, CD68+, and Ki67+ cells do not influence IIDs in regions of tumor infiltration.Fig. S2. NKCC1 expression does not depend on tumor infiltration or tumor grade in glioma-infiltrated neocortex.Table S1. Clinical, imaging, neuropathological, molecular, and follow-up findings of the 47 patientsunder study.References (58–60)
REFERENCES AND NOTES
1. M.S. van Breemen, E. B. Wilms, C. J. Vecht, Epilepsy in patients with brain tumours: Epi-demiology, mechanisms, and management. Lancet Neurol. 6, 421–430 (2007).
2. J. Pallud, L. Capelle, G. Huberfeld, Tumoral epileptogenicity: How does it happen? Epilepsia54, 30–34 (2013).
3. J. F. Hirsch, J. Buisson-Ferey, M. Sachs, J. C. Hirsch, J. Scherrer, Electrocorticogram and unitaryactivites with expanding lesions in man. Electroencephalogr. Clin. Neurophysiol. 21, 417–428(1966).
4. M. S. Berger, S. Ghatan, M. M. Haglund, J. Dobbins, G. A. Ojemann, Low-grade gliomasassociated with intractable epilepsy: Seizure outcome utilizing electrocorticography duringtumor resection. J. Neurosurg. 79, 62–69 (1993).
5. M. M. Haglund, M. S. Berger, D. D. Kunkel, J. E. Franck, S. Ghatan, G. A. Ojemann, Changes ing-aminobutyric acid and somatostatin in epileptic cortex associated with low-gradegliomas. J. Neurosurg. 77, 209–216 (1992).
6. J. Pallud, P. Varlet, B. Devaux, S. Geha, M. Badoual, C. Deroulers, P. Page, E. Dezamis,C. Daumas-Duport, F. X. Roux, Diffuse low-grade oligodendrogliomas extend beyondMRI-defined abnormalities. Neurology 74, 1724–1731 (2010).
7. J. Pallud, Diffuse low-grade gliomas: What does “complete resection” mean? in Tumors ofthe central nervous system: Gliomas, glioblastomas. Part 2. (Springer Netherlands, Dordrecht,2011), pp. 153–161.
8. S. C. Buckingham, S. L. Campbell, B. R. Haas, V. Montana, S. Robel, T. Ogunrinu, H. Sontheimer,Glutamate release by primary brain tumors induces epileptic activity. Nat. Med. 17, 1269–1274(2011).
9. A. Bordey, H. Sontheimer, Electrophysiological properties of human astrocytic tumor cellsin situ: Enigma of spiking glial cells. J. Neurophysiol. 79, 2782–2793 (1998).
10. M. L. Olsen, H. Sontheimer, Functional implications for Kir4.1 channels in glial biology:From K+ buffering to cell differentiation. J. Neurochem. 107, 589–601 (2008).
11. Z. C. Ye, J. D. Rothstein, H. Sontheimer, Compromised glutamate transport in human gliomacells: Reduction–mislocalization of sodium-dependent glutamate transporters and enhancedactivity of cystine–glutamate exchange. J. Neurosci. 19, 10767–10777 (1999).
12. J. de Groot, H. Sontheimer, Glutamate and the biology of gliomas. Glia 59, 1181–1189 (2011).13. T. Takano, J. H. Lin, G. Arcuino, Q. Gao, J. Yang, M. Nedergaard, Glutamate release pro-
motes growth of malignant gliomas. Nat. Med. 7, 1010–1015 (2001).14. A. Hamberger, B. Nyström, S. Larsson, H. Silfvenius, C. Nordborg, Amino acids in the neu-
ronal microenvironment of focal human epileptic lesions. Epilepsy Res. 9, 32–43 (1991).15. S. A. Lyons, W. J. Chung, A. K. Weaver, T. Ogunrinu, H. Sontheimer, Autocrine glutamate
signaling promotes glioma cell invasion. Cancer Res. 67, 9463–9471 (2007).16. H. J. Marcus, K. L. Carpenter, S. J. Price, P. J. Hutchinson, In vivo assessment of high-grade
glioma biochemistry using microdialysis: A study of energy-related molecules, growthfactors and cytokines. J. Neurooncol. 97, 11–23 (2010).
17. M. Roslin, R. Henriksson, P. Bergström, U. Ungerstedt, A. T. Bergenheim, Baseline levels ofglucose metabolites, glutamate and glycerol in malignant glioma assessed by stereotacticmicrodialysis. J. Neurooncol. 61, 151–160 (2003).
18. H. K. Wolf, D. Roos, I. Blümcke, T. Pietsch, O. D. Wiestler, Perilesional neurochemicalchanges in focal epilepsies. Acta Neuropathol. 91, 376–384 (1996).
19. P. Marco, R. G. Sola, S. Ramón y Cajal, J. DeFelipe, Loss of inhibitory synapses on the somaand axon initial segment of pyramidal cells in human epileptic peritumoural neocortex:Implications for epilepsy. Brain Res. Bull. 44, 47–66 (1997).
20. B. Schaller, S. J. Rüegg, Brain tumor and seizures: Pathophysiology and its implications fortreatment revisited. Epilepsia 44, 1223–1232 (2003).
21. I. Cohen, V. Navarro, S. Clemenceau, M. Baulac, R. Miles, On the origin of interictal activityin human temporal lobe epilepsy in vitro. Science 298, 1418–1421 (2002).
22. G. Huberfeld, L. Wittner, S. Clemenceau, M. Baulac, K. Kaila, R. Miles, C. Rivera, Perturbedchloride homeostasis and GABAergic signaling in human temporal lobe epilepsy. J. Neurosci.27, 9866–9873 (2007).
23. R. Köhling, A. Lücke, H. Straub, E. J. Speckmann, I. Tuxhorn, P. Wolf, H. Pannek, F. Oppel,Spontaneous sharp waves in human neocortical slices excised from epileptic patients.Brain 121 (Pt. 6), 1073–1087 (1998).
www.Sc
24. G. Huberfeld, L. Menendez de la Prida, J. Pallud, I. Cohen, M. Le Van Quyen, C. Adam,S. Clemenceau, M. Baulac, R. Miles, Glutamatergic pre-ictal discharges emerge at thetransition to seizure in human epilepsy. Nat. Neurosci. 14, 627–634 (2011).
25. R. Miles, P. Blaesse, G. Huberfeld, L. Wittner, K. Kaila, in Chloride Homeostasis and GABASignaling in Temporal Lobe Epilepsy, J. L. Noebels, M. Avoli, M. A. Rogawski, R. W. Olsen,A. V. Delgado-Escueta, Eds. [National Center for Biotechnology Information (US), Bethesda(MD), ed. 4, 2012].
26. C. W. Habela, N. J. Ernest, A. F. Swindall, H. Sontheimer, Chloride accumulation drivesvolume dynamics underlying cell proliferation and migration. J. Neurophysiol. 101,750–757 (2009).
27. C. W. Habela, M. L. Olsen, H. Sontheimer, ClC3 is a critical regulator of the cell cycle innormal and malignant glial cells. J. Neurosci. 28, 9205–9217 (2008).
28. C. Labrakakis, S. Patt, J. Hartmann, H. Kettenmann, Functional GABAA receptors on humanglioma cells. Eur. J. Neurosci. 10, 231–238 (1998).
29. S. Z. Young, A. Bordey, GABA’s control of stem and cancer cell proliferation in adult neuraland peripheral niches. Physiology (Bethesda) 24, 171–185 (2009).
30. N. J. Ernest, H. Sontheimer, Extracellular glutamine is a critical modulator for regulatoryvolume increase in human glioma cells. Brain Res. 1144, 231–238 (2007).
31. B. R. Haas, H. Sontheimer, Inhibition of the Sodium-Potassium-Chloride Cotransporter Isoform-1reduces glioma invasion. Cancer Res. 70, 5597–5606 (2010).
32. L. Conti, E. Palma, C. Roseti, C. Lauro, R. Cipriani, M. de Groot, E. Aronica, C. Limatola, Anom-alous levels of Cl− transporters cause a decrease of GABAergic inhibition in human peri-tumoral epileptic cortex. Epilepsia 52, 1635–1644 (2011).
33. D. N. Louis, H. Ohgaki, O.D. Wiestler, W. K. Cavenee (Eds.), World Health Organization Clas-sification of Tumours of the Central Nervous System (IARC press, 2007).
34. A. Bragin, I. Mody, C. L. Wilson, J. Engel Jr., Local generation of fast ripples in epilepticbrain. J. Neurosci. 22, 2012–2021 (2002).
35. L. Menendez de la Prida, R. Benavides-Piccione, R. Sola, M. A. Pozo, Electrophysiologicalproperties of interneurons from intraoperative spiking areas of epileptic human temporalneocortex. Neuroreport 13, 1421–1425 (2002).
36. V. I. Dzhala, D. M. Talos, D. A. Sdrulla, A. C. Brumback, G. C. Mathews, T. A. Benke, E. Delpire,F. E. Jensen, K. J. Staley, NKCC1 transporter facilitates seizures in the developing brain. Nat.Med. 11, 1205–1213 (2005).
37. C. Rivera, J. Voipio, J. A. Payne, E. Ruusuvuori, H. Lahtinen, K. Lamsa, U. Pirvola, M. Saarma,K. Kaila, The K+/Cl− co-transporter KCC2 renders GABA hyperpolarizing during neuronalmaturation. Nature 397, 251–255 (1999).
38. N. J. Ernest, A. K. Weaver, L. B. Van Duyn, H. W. Sontheimer, Relative contribution of chlo-ride channels and transporters to regulatory volume decrease in human glioma cells. Am.J. Physiol. Cell Physiol. 288, C1451–C1460 (2005).
39. J. Engel Jr., A. Bragin, R. Staba, I. Mody, High-frequency oscillations: What is normal andwhat is not? Epilepsia 50, 598–604 (2009).
40. G. Foffani, Y. G. Uzcategui, B. Gal, L. Menendez de la Prida, Reduced spike-timing reliabilitycorrelates with the emergence of fast ripples in the rat epileptic hippocampus. Neuron 55,930–941 (2007).
41. M. M. Zaatreh, K. S. Firlik, D. D. Spencer, S. S. Spencer, Temporal lobe tumoral epilepsy:Characteristics and predictors of surgical outcome. Neurology 61, 636–641 (2003).
42. R. Soffietti, B. G. Baumert, L. Bello, A. von Deimling, H. Duffau, M. Frénay, W. Grisold, R. Grant,F. Graus, K. Hoang-Xuan, M. Klein, B. Melin, J. Rees, T. Siegal, A. Smits, R. Stupp, W. Wick,European Federation of Neurological Societies, Guidelines on management of low-gradegliomas: Report of an EFNS–EANO Task Force. Eur. J. Neurol. 17, 1124–1133 (2010).
43. A. Pace, A. Vidiri, E. Galiè, M. Carosi, S. Telera, A. M. Cianciulli, P. Canalini, D. Giannarelli,B. Jandolo, C. M. Carapella, Temozolomide chemotherapy for progressive low-gradeglioma: Clinical benefits and radiological response. Ann. Oncol. 14, 1722–1726 (2003).
44. J. H. Sherman, K. Moldovan, H. K. Yeoh, R. M. Starke, N. Pouratian, M. E. Shaffrey, D. Schiff,Impact of temozolomide chemotherapy on seizure frequency in patients with low-gradegliomas. J. Neurosurg. 114, 1617–1621 (2011).
45. A. Rosati, A. Tomassini, B. Pollo, C. Ambrosi, A. Schwarz, A. Padovani, B. Bonetti, Epilepsy incerebral glioma: Timing of appearance and histological correlations. J. Neurooncol. 93,395–400 (2009).
46. E. Aronica, K. Boer, S. Redeker, W. G. Spliet, P. C. van Rijen, D. Troost, J. A. Gorter, Differ-ential expression patterns of chloride transporters, Na+-K+-2Cl−-cotransporter and K+-Cl−-cotransporter, in epilepsy-associated malformations of cortical development. Neuroscience145, 185–196 (2007).
47. J. S. Kim, W. B. Kim, Y. B. Kim, Y. Lee, Y. S. Kim, F. Y. Shen, S. W. Lee, D. Park, H. J. Choi, J. Hur,J. J. Park, H. C. Han, C. S. Colwell, Y. W. Cho, Y. I. Kim, Chronic hyperosmotic stress convertsGABAergic inhibition into excitation in vasopressin and oxytocin neurons in the rat. J. Neurosci.31, 13312–13322 (2011).
48. S. C. Buckingham, S. Robel, Glutamate and tumor-associated epilepsy: Glial cell dys-function in the peritumoral environment. Neurochem. Int. 63, 696–701 (2013).
49. Q. Yan, H. L. Yu, J. T. Li, Study on the expression of BDNF in human gliomas. Sichuan DaXue Xue Bao Yi Xue Ban 40, 415–417 (2009).
ienceTranslationalMedicine.org 9 July 2014 Vol 6 Issue 244 244ra89 10

R E S EARCH ART I C L E
http://stm.s
Dow
nloaded from
50. A. Chiaretti, L. Aloe, A. Antonelli, A. Ruggiero, M. Piastra, R. Riccardi, G. Tamburrini, C. Di Rocco,Neurotrophic factor expression in childhood low-grade astrocytomas and ependymomas.Childs Nerv. Syst. 20, 412–419 (2004).
51. C. Rivera, J. Voipio, J. Thomas-Crusells, H. Li, Z. Emri, S. Sipilä, J. A. Payne, L. Minichiello,M. Saarma, K. Kaila, Mechanism of activity-dependent downregulation of the neuron-specific K-Cl cotransporter KCC2. J. Neurosci. 24, 4683–4691 (2004).
52. K. T. Kahle, J. Rinehart, P. de Los Heros, A. Louvi, P. Meade, N. Vazquez, S. C. Hebert, G. Gamba,I. Gimenez, R. P. Lifton, WNK3 modulates transport of Cl− in and out of cells: Implications forcontrol of cell volume and neuronal excitability. Proc. Natl. Acad. Sci. U.S.A. 102, 16783–16788(2005).
53. J. Macas, M. C. Ku, C. Nern, Y. Xu, H. Bühler, M. Remke, M. Synowitz, K. Franz, V. Seifert, K. H. Plate,H. Kettenmann, R. Glass, S. Momma, Generation of neuronal progenitor cells in responseto tumors in the human brain. Stem Cells 32, 244–257 (2014).
54. K. Lote, A. E. Stenwig, K. Skullerud, H. Hirschberg, Prevalence and prognostic significanceof epilepsy in patients with gliomas. Eur. J. Cancer 34, 98–102 (1998).
55. J. Pallud, E. Audureau, M. Blonski, N. Sanai, L. Bauchet, D. Fontaine, E. Mandonnet, E. Dezamis,D. Psimaras, J. Guyotat, P. Peruzzi, P. Page, B. Gal, E. Párraga, M. H. Baron, M. Vlaicu, R. Guillevin,B. Devaux, H. Duffau, L. Taillandier, L. Capelle, G. Huberfeld, Epileptic seizures in diffuse low-grade gliomas in adults. Brain 137, 449–462 (2014).
56. V. Dzhala, G. Valeeva, J. Glykys, R. Khazipov, K. Staley, Traumatic alterations in GABAsignaling disrupt hippocampal network activity in the developing brain. J. Neurosci. 32,4017–4031 (2012).
57. A. Beaumont, M. Clarke, I. R. Whittle, The effects of malignant glioma on the EEG andseizure thresholds: An experimental study. Acta Neurochir. 138, 370–381 (1996).
58. S. E. Connor, R. Gunny, T. Hampton, R. O’gorman, Magnetic resonance image registration andsubtraction in the assessment of minor changes in low grade glioma volume. Eur. Radiol. 14,2061–2066 (2004).
59. M. A. Hammoud, B. L. Ligon, R. elSouki, W. M. Shi, D. F. Schomer, R. Sawaya, Use of intra-operative ultrasound for localizing tumors and determining the extent of resection: Acomparative study with magnetic resonance imaging. J. Neurosurg. 84, 737–741 (1996).
www.Sc
60. R. J. Staba, C. L. Wilson, A. Bragin, I. Fried, J. Engel Jr., Quantitative analysis of high-frequencyoscillations (80–500 Hz) recorded in human epileptic hippocampus and entorhinal cortex.J. Neurophysiol. 88, 1743–1752 (2002).
Acknowledgments: We thank L. Menendez de la Prida, S. Mahon, and S. Charpier for criticalreading of the manuscript. We are grateful to K. Mokthari, C. Adam, and to the staff of theService de Neuropathologie for the excellent technical assistance. We thank C. Lytle (Universityof California, Riverside) and K. Kaila (University of Helsinki) for gifts of antibodies. We alsothank C. Karachi, F. Chrétien, C. Oppenheim, J.-F. Meder, and E. Dezamis for their neurosurgical,neuroimaging, and neuropathological contributions. The paper is dedicated to Marceau whowas born during the late revision process. Funding: Supported by grants from the UPMC(Convergence CVG1106), the INSERM, the CNRS, the AP-HP, the Fédération pour la Recherchesur le Cerveau, the European Research Council (322721). Author contributions: J.P., N.C., andG.H. performed experiments. M.L.V.Q., J.P., and G.H. analyzed electrophysiological data. F.B., C.P.,P.V., N.K., M.-J.D., M.L., G.C. and C.D. performed morphological and immunohistochemicalanalyses. M.B., B.D., C.R., R.M., L.C., J.P., and G.H. contributed to the design of the experiments.L.C. and J.P. provided postoperative tissues. J.P. and G.H. wrote the manuscript. Competinginterests: P.V. serves as a consultant on the advisory boards of Hoffmann-La Roche andBoehringer Ingelheim. The other authors declare that they have no competing interests.
Submitted 18 November 2013Accepted 6 May 2014Published 9 July 201410.1126/scitranslmed.3008065
Citation: J. Pallud, M. Le Van Quyen, F. Bielle, C. Pellegrino, P. Varlet, M. Labussiere, N. Cresto,M.-J. Dieme, M. Baulac, C. Duyckaerts, N. Kourdougli, G. Chazal, B. Devaux, C. Rivera, R. Miles,L. Capelle, G. Huberfeld, Cortical GABAergic excitation contributes to epileptic activities aroundhuman glioma. Sci. Transl. Med. 6, 244ra89 (2014).
ci
ienceTranslationalMedicine.org 9 July 2014 Vol 6 Issue 244 244ra89 11
by Pauline R
oca on June 19, 2017encem
ag.org/

Cortical GABAergic excitation contributes to epileptic activities around human glioma
Devaux, Claudio Rivera, Richard Miles, Laurent Capelle and Gilles HuberfeldCresto, Marie-Joseph Dieme, Michel Baulac, Charles Duyckaerts, Nazim Kourdougli, Geneviève Chazal, Bertrand Johan Pallud, Michel Le Van Quyen, Franck Bielle, Christophe Pellegrino, Pascale Varlet, Marianne Labussiere, Noémie
DOI: 10.1126/scitranslmed.3008065, 244ra89244ra89.6Sci Transl Med
seizures and tumor growth, a two-for-one hit.invade into normal brain tissue. Perhaps drugs that block chloride uptake could interfere with both glioma-induced take up too many chloride ions. Glioma tumor cells also take up too much chloride, which helps them spread andthem on instead. Also seen in temporal lobe epilepsy, this unusual cell behavior happens because the neurons
turnsanomalously to the neurotransmitter GABA. Usually GABA turns neurons off, but when gliomas are nearby, it . show that the epileptic activity in the brain around gliomas happens because neurons respondet alPallud
Gliomas, a common brain tumor, frequently induce epileptic seizures as they grow, but it is not clear why.Chloride Causes Seizures in Glioma
ARTICLE TOOLS http://stm.sciencemag.org/content/6/244/244ra89
MATERIALSSUPPLEMENTARY http://stm.sciencemag.org/content/suppl/2014/07/07/6.244.244ra89.DC1
CONTENTRELATED
http://stm.sciencemag.org/content/scitransmed/8/328/328ra27.fullhttp://stke.sciencemag.org/content/sigtrans/8/383/ra65.fullhttp://stm.sciencemag.org/content/scitransmed/7/289/289ra86.fullhttp://science.sciencemag.org/content/sci/346/6216/1529.fullhttp://science.sciencemag.org/content/sci/346/6216/1458.fullhttp://stke.sciencemag.org/content/sigtrans/7/334/re3.fullhttp://stm.sciencemag.org/content/scitransmed/4/127/127ra36.fullhttp://stm.sciencemag.org/content/scitransmed/5/184/184ra59.fullhttp://stm.sciencemag.org/content/scitransmed/5/201/201ra119.fullhttp://stm.sciencemag.org/content/scitransmed/5/209/209ra152.full
REFERENCES
http://stm.sciencemag.org/content/6/244/244ra89#BIBLThis article cites 57 articles, 18 of which you can access for free
PERMISSIONS http://www.sciencemag.org/help/reprints-and-permissions
Terms of ServiceUse of this article is subject to the
is a registered trademark of AAAS.Science Translational Medicinetitle licensee American Association for the Advancement of Science. No claim to original U.S. Government Works. TheScience, 1200 New York Avenue NW, Washington, DC 20005. 2017 © The Authors, some rights reserved; exclusive
(ISSN 1946-6242) is published by the American Association for the Advancement ofScience Translational Medicine
by Pauline R
oca on June 19, 2017http://stm
.sciencemag.org/
Dow
nloaded from
Top Related