


Languages
Pages
Legal

University of Rhode Island University of Rhode Island
DigitalCommons@URI DigitalCommons@URI
Open Access Dissertations
2020
CONFIRMATORY FACTOR ANALYSIS OF THE WISC-IV WITH A CONFIRMATORY FACTOR ANALYSIS OF THE WISC-IV WITH A
TRINIDAD REFERRED SAMPLE TRINIDAD REFERRED SAMPLE
Cherisse Rambarose University of Rhode Island, [email protected]
Follow this and additional works at: https://digitalcommons.uri.edu/oa_diss
Recommended Citation Recommended Citation Rambarose, Cherisse, "CONFIRMATORY FACTOR ANALYSIS OF THE WISC-IV WITH A TRINIDAD REFERRED SAMPLE" (2020). Open Access Dissertations. Paper 1190. https://digitalcommons.uri.edu/oa_diss/1190
This Dissertation is brought to you for free and open access by DigitalCommons@URI. It has been accepted for inclusion in Open Access Dissertations by an authorized administrator of DigitalCommons@URI. For more information, please contact [email protected].
CONFIRMATORY FACTOR ANALYSIS OF THE WISC-IV
WITH A TRINIDAD REFERRED SAMPLE
BY
CHERISSE RAMBAROSE
A DISSERTATION SUBMITTED IN PARTIAL FULFILLMENT OF THE
REQUIREMENTS FOR THE DEGREE OF
DOCTOR OF PHILOSOPHY
IN
PSYCHOLOGY
UNIVERSITY OF RHODE ISLAND
2019
DOCTOR OF PHILOSOPHY DISSERTATION
OF
CHERISSE RAMBAROSE
APPROVED:
Dissertation Committee:
Major Professor W. Grant Willis Lisa L. Harlow Susan Trostle Brand
Nasser H. Zawia
DEAN OF THE GRADUATE SCHOOL
UNIVERSITY OF RHODE ISLAND 2019

ABSTRACT
There has been an extensive amount of research in the intelligence-assessment
literature on the structure of the Wechsler Intelligence Scale for Children, fourth
edition (WISC-IV; 2003a). Numerous studies show that the test’s general factor
structure replicates across normative and referred groups, in the U.S. and globally.
Thus far, few studies have been done examining the factor structure of this, and other
intelligence tests with Caribbean samples. The current study adds to this body of
literature by examining the factor structure of the WISC-IV with a referred sample
from Trinidad. This study utilized archival data from a sample accessed through
private practices and a public clinic located in the Northeast region of the island of
Trinidad, within the Republic of Trinidad and Tobago (N = 261). Data were extracted
from client files and included age (M = 11.13, SD = 2.76), gender (males n = 182),
DSM diagnosis, WISC-IV subtest scaled scores and composite standard scores, and
other variables that were not used in this study due to incomplete data. An examination
of subtest and composite mean scores showed that measures of visual-spatial
processing speed (Coding and Symbol Search) and the overall processing speed
standard score fell almost one and one-half standard deviations below the normative
mean, and lower compared with other cognitive domain scores in this sample.
Confirmatory factor analysis procedures were completed examining six different
configurations: one-, two-, three- and four-factor models, and two hierarchical (direct
and indirect) models that account for the influence of four factors plus a general
intelligence factor (g). The four-factor model, which excluded a g factor, yielded
superior fit with the data based on an examination of several fit indices (χ2, χ2/df ratio,
comparative fit index [CFI], root mean square error of approximation [RMSEA],

iii
standardized root mean-square residual [SRMSR], Akaike information criterion
[AIC]). The indirect-hierarchical model, which represents the WISC-IV interpretive
model, was not considered the most appropriate for the sample in this study. Reasons
for these results are postulated, study limitations are explored, and areas for future
research are considered.
iv
ACKNOWLEDGEMENTS
I wish to extend my sincerest gratitude to my major professor Dr. W. Grant
Willis for his guidance, encouragement, and scholarly mentorship during the doctoral
program and in the process of completing my dissertation. Dr. Willis provided quick
and thorough feedback, showed genuine interest and respect for my work, and helped
push me toward the finish line when I needed it the most. I am grateful to Dr. Lisa
Harlow, my inside committee member and multivariate/SEM professor for sharing her
expertise and helping me to work through the data analysis portions of my dissertation.
I wish to thank Dr. Sandy Hicks in the College of Education for her contributions,
encouragement and feedback during the research process. Of particular importance, I
truly appreciated Dr. Hicks’ and Dr. Harlow’s pep talks, which have motivated me and
fueled my passion for research. Additionally, I am grateful to my outside committee
member, Dr. Susan Trostle Brand, in the College of Education for her interest in my
work and contribution in making my dissertation a success.
There are several other people I wish to thank who have been integral to the
completion of this dissertation. Special thanks to the psychologists in Trinidad who
agreed to help by allowing me access to their data. Without their trust and cooperation,
this dissertation would not have been possible. I need to thank my colleague and
psychology graduate student, Marie Tate, for the time and energy she spent working
with me to problem-solve challenges that arose during statistics-consultation meetings.
Deepest gratitude to Dr. Alexander Knights for his encouragement, brainstorming
sessions, research and statistics advice, and for the time put into supporting me
through the process of completing my dissertation. Additionally, I wish to thank Ms.

v
Allyson-Hamel Smith and Dr. Jane Holmes Bernstein for their inspiration and
investment into my clinical training in assessment, and overall professional growth as
a psychologist. Ms. Hamel-Smith, Dr. Holmes Bernstein, and the psychologists who
participated in this study understood the importance of developing the sparse body of
existing assessment research in the Trinidad and Tobago context.
There are many more people who have supported me along this journey, who
have helped me to reach the goals I set out to accomplish. Words cannot express how
grateful I am to my family and relatives in Trinidad and New York City who have
cared for me in my life, and throughout the process of completing my doctorate. I also
wish to recognize the friends and colleagues who I have met during my professional
journey, all of whom have been instrumental in helping me to be a better student and
learner. Through undergraduate, master’s, and now a doctoral program, my peers
inspired, challenged, encouraged, and validated me. I am ever grateful to my Master’s
cohort from the University of the West Indies, Trinidad and Tobago, whose friendship
and collegial support have had an invaluable contribution to my growth as a
psychologist. Additionally, my cohort and friends at the University of Rhode Island
(URI) were integral to my success as a doctoral student, and to my ability to adapt and
flourish in my doctoral program. Specifically, I want to thank Khadijah Cyril and
Mehwish Shahid who supported me through this process, and became my family away
from home.
It took a village. There are many more people in my village who have
supported me along this journey. To the people I mentioned, ones I have not, and those

vi
I have lost along the way, I am forever grateful for your love, guidance,
encouragement, and for walking this journey with me.

vii
DEDICATION
This dissertation is dedicated to my family. My parents Seudath Rambarose
and Juliet Rambarose taught me the benefit of hard work, sacrifice, and perseverance. I
never knew I would make it this far, but they somehow knew that I could. I am
grateful for my mom’s love and good heart; she taught me the importance of
friendship, and seeing the good in others. My sister, Sarita Rambarose, of whom I am
so proud, challenged me to be a good role model, and inspires me to find the zest in
life. My dad was a dreamer, and he taught me how to set goals, be adventurous, aim
high, and persist. Though he is no longer with us, I continue to dream and work toward
living the full life that he intended for his children.

viii
TABLE OF CONTENTS
ABSTRACT………………………………………………………………………….. ii
ACKNOWLEDGEMENTS………………………………………………………… iv
DEDICATION…………………………………………………………………….... vii
TABLE OF CONTENTS………………………………………………………….. viii
LIST OF TABLES………………………………………………...……………....... ix
LIST OF FIGURES……………………………………………...………………....... x
CHAPTER 1………………………………………………………...……………….. 1
INTRODUCTION…………………………………………………………….. 1
CHAPTER 2………………………………………………...……………………….. 6
REVIEW OF THE LITERATURE…………………………………………… 6
CHAPTER 3……………………………………………………………………...… 26
METHOD……………………………………………………………………. 26
CHAPTER 4……………………………………………………………...………… 34
RESULTS……………………………………………………………………. 34
CHAPTER 5 ……………………………………………………...………………... 49
DISCUSSION…………………………………...…………………………... 49
BIBLIOGRAPHY…………………………...……………………………………... 70
ix
LIST OF TABLES
TABLE PAGE
Table 1. DSM Diagnostic Categories for Participants ……………………………… 27
Table 2. Exploratory factor matrix for core subtests on the WISC-IV for the US
Standardization Sample (WISC-IV Technical and Interpretive Manual; Wechsler,
2003) ...…………………………………………………………….………………… 28
Table 3. Descriptive Statistics for Test Scores from the Trinidad Sample .………….34
Table 4. Means and Standard Deviations for DSM Diagnostic Categories for Trinidad
Sample …...…………………………………………………………...……………... 36
Table 5. Correlation Matrix for Subtest Scores from the Trinidad Sample ……….... 37
Table 6. Correlation Matrix for Composite/Index Scores from the Trinidad Sample .37
Table 7. Confirmatory Factor Analysis Fit Statistics for Six Structural Models from the
Trinidad Sample …………………………………………………………………….. 40
Table 8. Standardized Loadings for the Four Factor, Indirect Higher-Order, and Direct
Hierarchical Models from the Trinidad Sample ……………………………………. 41
Table 9. Follow-up ANOVA results for the five composite scores for each agency group………………………………………………………………….………..……. 48
x
LIST OF FIGURES
FIGURE PAGE
Figure 1. The Cattel-Horn-Carroll (CHC) three-stratum model illustrated using the
WISC-IV measurement model …….…...…………………………………………… 12
Figure 2. WISC-IV Four-Factor, Higher-Order/Indirect-Hierarchical Structure …… 18
Figure 3. Plot of Correlated Four Factor Model from the Trinidad sample…………. 42
Figure 4. Plot of the Higher-Order/Indirect Hierarchical Model from the Trinidad
sample ……………………………………………………………………………...... 43
Figure 5. Plot of the Direct Hierarchical Model from the Trinidad sample ………… 45

1
CHAPTER 1
INTRODUCTION
Since the inception of the field, assessment of intelligence has been a core
practice of clinical and school psychologists (Vasquez-Nuttall et al., 2007). Initially
developed over a century ago in response to social and economic changes spurred by
the Industrial Revolution (Oakland, 2004), intelligence tests continue to be revised and
widely utilized in contemporary clinical and educational settings in the United States
(US) and globally. Intelligence tests are used in schools, child and adult medical
clinics, hospitals, criminal-justice facilities, and a range of mental-health
organizations. Results of intelligence tests often are integrated with additional
assessment measures and other key sources of information to inform diagnostic,
placement, and treatment decisions for a wide range of neurological and
neurodevelopmental conditions (e.g., brain injury, cognitive impairment related to
aging, intellectual disability, Attention-deficit/Hyperactivity Disorder [ADHD],
Specific Learning Disability [SLD], Autism Spectrum Disorder [ASD]). As such, the
results of these tests and how they are interpreted have great significance on individual
outcomes as well as the systems within which they function.
Over the years, several tests of intelligence have been developed and
empirically evaluated, and continue to be revised and adapted. Of the available
measures, the Wechsler intelligence scales are among the most widely used and
validated measures for assessing cognitive ability in the US and worldwide (Ambreen
& Kamal, 2014; Bowden, Saklofske, & Weiss, 2011; Dang, Weiss, Pollack &
Nguyen, 2012; Saklofske, Weiss, Beal & Coalson, 2003). The Wechsler scales are

2
normed and standardized for use with various populations (e.g., US, Canada, United
Kingdom, Australia, Germany, Austria and Switzerland, France, Mexico, India,
Sweden, China, and Japan; Grégoire et al., 2008). Although versions of the Wechsler
scales have been adapted for use with various countries and cultural groups, it is often
more difficult to find well-validated intelligence tests in developing countries. As
such, it is not uncommon to find cross-cultural applications of the test with groups for
whom the test was not standardized. This is the case in Trinidad and Tobago (T&T)
and other Caribbean nations.
Statement of the Problem
In T&T, the US versions of the Wechsler scales (Wechsler, 2003a, 2008, 2014,
2012) are typically used in practice, as there is no comparable test of cognitive or
intellectual ability that has been normed and validated with persons from this
population. Without empirical support, the use of tests normed on one population with
another may produce biased results and inaccurate interpretations. This practice leads
to the question of whether a test, developed on one population, can measure
intellectual potential accurately for persons from another population with unshared
cultural experiences.
The content included in standardized tests reflects the social and educational
experiences and acculturative expectations of the culture in which the test was
developed. Standardized tests are developed for use with specific populations, and
ideally should be used with persons who belong to, or are represented by, the
normative group with which the test was developed. The use of the US version of the
Wechsler scales with a T&T sample raises concerns for cultural bias, and questions
3
the validity of the results obtained with an examinee who is not represented in the
standardization sample.
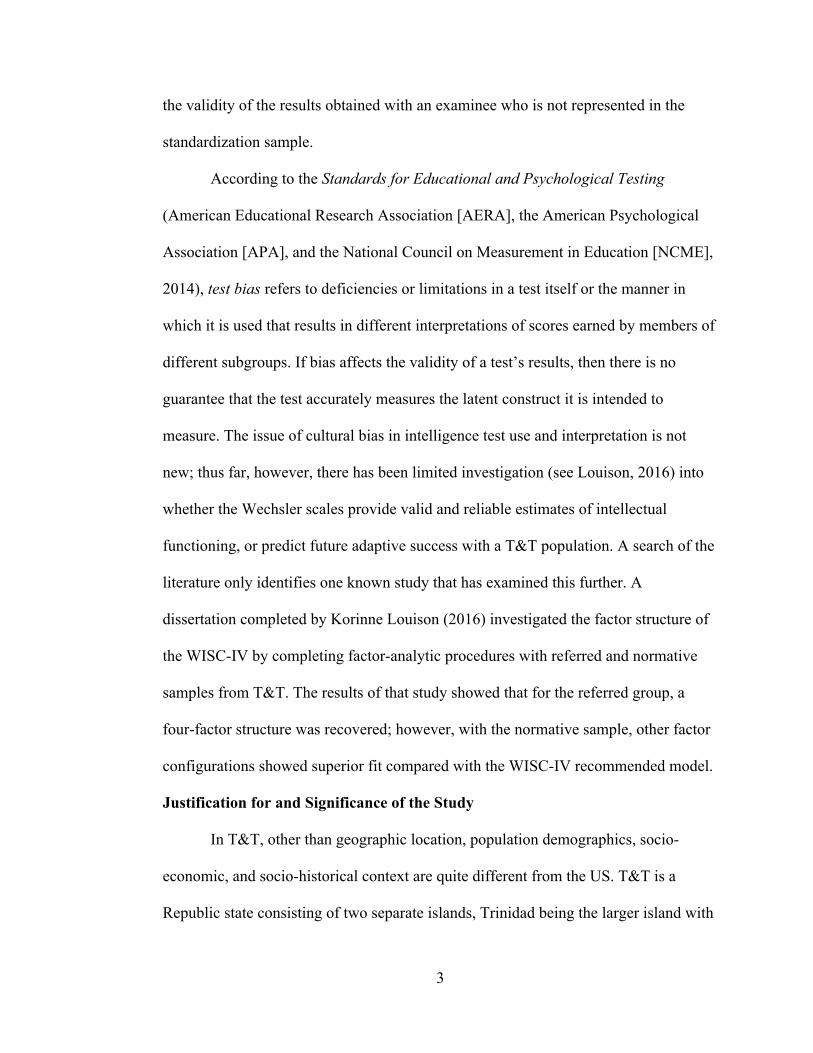
According to the Standards for Educational and Psychological Testing
(American Educational Research Association [AERA], the American Psychological
Association [APA], and the National Council on Measurement in Education [NCME],
2014), test bias refers to deficiencies or limitations in a test itself or the manner in
which it is used that results in different interpretations of scores earned by members of
different subgroups. If bias affects the validity of a test’s results, then there is no
guarantee that the test accurately measures the latent construct it is intended to
measure. The issue of cultural bias in intelligence test use and interpretation is not
new; thus far, however, there has been limited investigation (see Louison, 2016) into
whether the Wechsler scales provide valid and reliable estimates of intellectual
functioning, or predict future adaptive success with a T&T population. A search of the
literature only identifies one known study that has examined this further. A
dissertation completed by Korinne Louison (2016) investigated the factor structure of
the WISC-IV by completing factor-analytic procedures with referred and normative
samples from T&T. The results of that study showed that for the referred group, a
four-factor structure was recovered; however, with the normative sample, other factor
configurations showed superior fit compared with the WISC-IV recommended model.
Justification for and Significance of the Study
In T&T, other than geographic location, population demographics, socio-
economic, and socio-historical context are quite different from the US. T&T is a
Republic state consisting of two separate islands, Trinidad being the larger island with
4
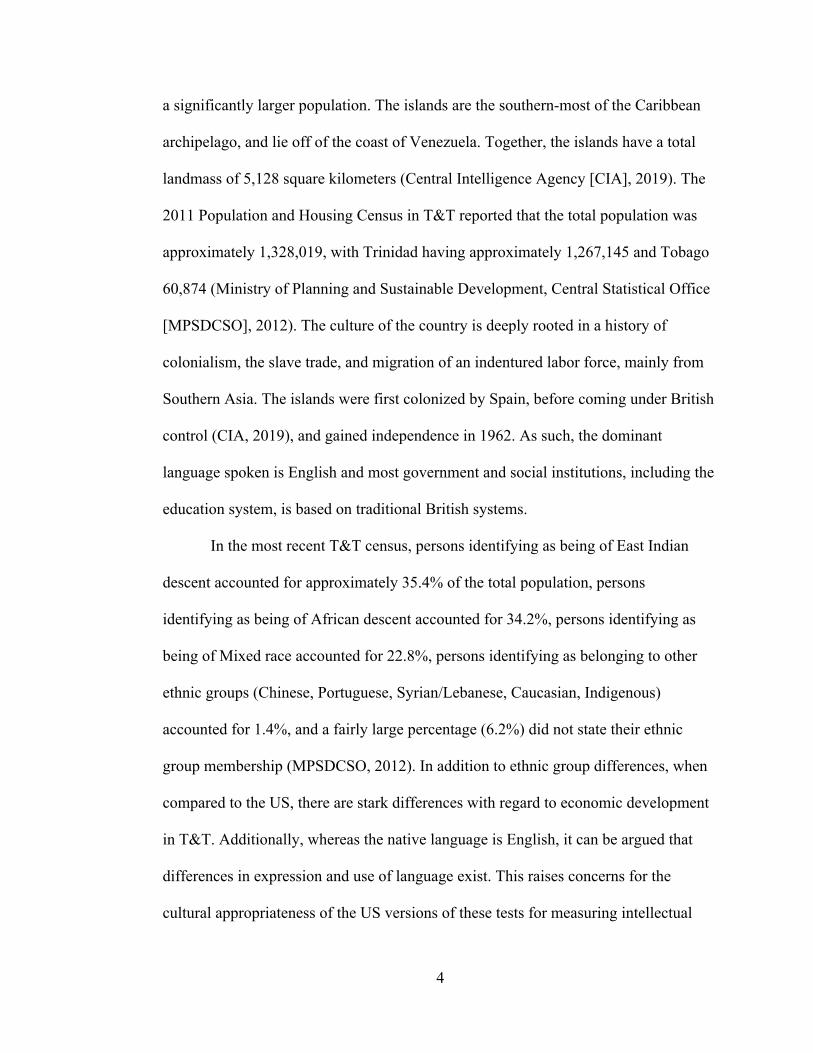
a significantly larger population. The islands are the southern-most of the Caribbean
archipelago, and lie off of the coast of Venezuela. Together, the islands have a total
landmass of 5,128 square kilometers (Central Intelligence Agency [CIA], 2019). The
2011 Population and Housing Census in T&T reported that the total population was
approximately 1,328,019, with Trinidad having approximately 1,267,145 and Tobago
60,874 (Ministry of Planning and Sustainable Development, Central Statistical Office
[MPSDCSO], 2012). The culture of the country is deeply rooted in a history of
colonialism, the slave trade, and migration of an indentured labor force, mainly from
Southern Asia. The islands were first colonized by Spain, before coming under British
control (CIA, 2019), and gained independence in 1962. As such, the dominant
language spoken is English and most government and social institutions, including the
education system, is based on traditional British systems.
In the most recent T&T census, persons identifying as being of East Indian
descent accounted for approximately 35.4% of the total population, persons
identifying as being of African descent accounted for 34.2%, persons identifying as
being of Mixed race accounted for 22.8%, persons identifying as belonging to other
ethnic groups (Chinese, Portuguese, Syrian/Lebanese, Caucasian, Indigenous)
accounted for 1.4%, and a fairly large percentage (6.2%) did not state their ethnic
group membership (MPSDCSO, 2012). In addition to ethnic group differences, when
compared to the US, there are stark differences with regard to economic development
in T&T. Additionally, whereas the native language is English, it can be argued that
differences in expression and use of language exist. This raises concerns for the
cultural appropriateness of the US versions of these tests for measuring intellectual

5
functioning with persons from T&T. To address these concerns, the current study
aimed to gain a better understanding of the validity of the Wechsler Intelligence Scale
for Children, fourth edition (WISC-IV; Wechsler, 2003a), for use with children in
T&T. The construct of intelligence, how it is typically measured, and the importance
of cultural appropriateness of test usage were reviewed, and planned analyses were
conducted.
6
CHAPTER 2
REVIEW OF THE LITERATURE
Scientific inquiry into defining and measuring intelligence began taking root in
the mid 19th Century, whereas the widespread application and perceived importance
of examining this construct become cemented in the early 20th Century (Gottfredson
& Saklofske, 2009). In the US and other Industrialized nations, economic, political
and social changes occurring at the turn of the 20th Century led to increasing needs to
educate more children and youth at higher levels, to meet the special learning needs of
students, and to help ensure children and other individuals with severe disorders were
provided appropriate care (Farrell, Jimerson, Oakland, 2007; Oakland, 2004).
Assessment methods were developed to measure and identify those needs and guide
decision making for developing appropriate programs and supports for children with
special needs (Oakland, 2004), with intelligence tests playing a role in that process.
Intelligence test use has a long and contentious history in the field, both in
terms of socio-political factors (e.g., issues of cultural bias) as well as issues related to
defining and conceptualizing the intelligence construct. There is no agreed-upon
definition of the construct intelligence (Sternberg, 1997); secondly, reliance on theory
is a relatively new advancement in the measurement of human intelligence, as earlier
versions of intelligence test batteries were developed without a clear and well-
established theoretical framework (Keith & Reynolds, 2010; Schneider & McGrew,
2012). The following review outlines the conceptualization of intelligence as a
construct, the development of a guiding theoretical framework and model for
understanding and measuring intelligence, issues of validity and reliability, and
7
presents literature on the use of the Wechsler Intelligence Scale for Children (WISC)
with various populations.
Defining Intelligence
Intelligence is a latent trait, abstract and difficult to define. Sternberg (1997)
presents a review of the various definitions that have been applied. He comments that
the literature-base on intelligence has generated various definitions over time, and
provided examples of common elements found in definitions. Intelligence has been
defined as higher-level abilities related to executive functions (e.g., abstract reasoning,
problem solving, decision making), the ability to learn, adaptation to environmental
demands, and based on cultural values (Sternberg, 1997). The manual for the newest
version of the WISC incorporates these themes and defines intelligence as an
individual’s capacity to understand the world and the resourcefulness to cope with its
challenges (Wechsler, 2014). Despite its lack of a coherent and established definition
across fields, researchers agree that intellectual thinking is critical to daily human
functioning (Dang et al., 2011) and has been shown to predict success in academic and
occupational settings (Brody, 1997).
Sternberg’s (1997) review of definitions of intelligence highlights that there is
an interaction whereby human beings do not just adapt to their environments, but
actively shape them. He offered the following definition, “Intelligence comprises the
mental abilities necessary for adaptation to, as well as shaping and selection of, any
environmental context…a process of lifelong learning, one that starts in infancy and
continues throughout the life span” (Sternberg, 1997, p. 1030). Sternberg’s definition
suggests that intelligence is a fluid concept, shaped by the interaction of the individual

8
with the environment and changes with time. The idea of viewing intelligence as a
transactional person-environment concept relates to Bronfenbrenner’s (1977, 1994)
social-ecological theory of human development, and Vygotsky’s (1978) socio-cultural
theory of cognitive development. From these two theoretical frameworks, the
significant impact of the environment and culture on intellectual and cognitive
development becomes clear. These frameworks highlight that, in many ways,
development is context specific and what it means to learn and to exhibit intellectual
behavior is not universal.
Although there are consistent themes related to neurological functioning and
environmental adaptation, there still remains no one, agreed-upon definition of
intelligence in the literature. The definition of a construct is important, particularly as
it relates to ease of measurement, replication, and application of the construct to
various research questions. In addition to variations in definition, intelligence tests
have been criticized for the application of these measures in schools and clinics
without guidance from a coherent evidence-based theory. As such, over the years
conceptual theories of measuring intelligence have been highly researched mainly
using factor analytic methods, and test developers have placed increasing emphasis on
incorporating theory into instruments for measuring intelligence.
Conceptualizing Intelligence
The Cattell-Horn-Carroll (CHC) theory provides a taxonomy of human
cognitive abilities that organizes over 100 years of research into a systematic
theoretical framework for understanding and measuring intelligence, and related
variables (Schneider & McGrew, 2012). The CHC model is a synthesis of the Cattell–
9
Horn fluid-crystallized (Gf–Gc) model of intelligence (1966) with the Carroll Three-
Stratum model (1993), which were both influenced by Spearman’s (1927)
conceptualization of general intellectual functioning (Keith & Reynolds, 2012;
McGrew, 2009; Schneider & McGrew, 2012). Developed through factor-analytic
methods, CHC theory is a multidimensional, hierarchical model that includes an
overarching general intellectual ability factor, broad interrelated ability factors, and an
array of narrow sub-skill variables.
The Binet-Simon test (1905) is credited as the first practical test of intelligence
applied to measure intellectual differences. This and other early intelligence tests
conceptualized and measured intelligence using a unidimensional construct (Newton
& McGrew, 2010). Spearman, one of the earliest intelligence theorists, expanded on
this concept of a general intelligence factor, symbolized as g, and included sub-skills
of g, termed s, which he considered specific abilities related to g (Spearman, 1927).
Research by Spearman and early theorists such as Thurstone (1938) applied factor-
analytic methods to expand the idea of a general intelligence factor, to include several,
broad highly correlated but distinct factors (Alfonso, Flanagan, & Radwan, 2005;
Horn & Blankson, 2012). It was Cattell and Horn’s Gf-Gc theory; however, that
provided the basis for the modern CHC model (Schneider & McGrew, 2012).
Cattell (1943) purported that Spearman’s g was better explained by the
inclusion of two factors: general fluid (Gf) and general crystallized (Gc) intelligence.
According to Cattell, Gf includes inductive and deductive reasoning abilities that are
influenced by biological and neurological factors, and incidental learning through
interaction with the environment (Alfonso Flanagan, & Radwan, 2012). In contrast, Gc
10
includes acquired knowledge abilities that largely reflect acculturation, (Alfonso et al.,
2005). Gc represents the degree to which an individual has learned practical, useful
knowledge and mastered valued skills relevant to the culture (Keith & Reynolds,
2010). Cattell (1943) postulated that Gf increases until adolescence and then slowly
declines, and incorporates the function of the whole cortex (Schneider & McGrew,
2012). Gc in contrast, consists of knowledge previously learned, initially through the
operation of fluid ability, but no longer requires insightful perception or novel problem
solving (Schneider & McGrew, 2012). According to Cattell (1943), most learning
occurs through effort and several other non-ability-related variables such as
availability and quality of education, family resources and expectations, and individual
interests and goals (Schneider & McGrew, 2012). These collective differences in time,
resources, and effort spent on learning were termed investment (Cattell, 1963; Horn &
Blankson, 2012; Schneider & McGrew, 2012). As with other early theorists, Cattell
observed a high correlation between Gf and Gc, and hypothesized that Gf supports the
development of Gc via investment (Schneider & McGrew, 2012). Spearman also noted
the high correlation among sub-skill factors, as well as among varying measures of
ability, a phenomenon he termed the positive manifold and saw it as evidence for the
existence of a g factor (Horn & Blankson, 2012; Schneider & McGrew, 2012).
Building on Cattell’s work, Horn expanded Gf-Gc theory to include several broad
ability factors (Gv: visual processing, Gs: processing speed, SAR/Gsm: short-term
apprehension and retrieval, TSR/Glr: fluency of retrieval form long-term storage; Horn
& Cattell, 1966; Schneider & McGrew, 2012). Reviews by Horn and Blankson (2012)
and Schneider and McGrew (2012) outline and describe these sub-skills.
11
Carroll’s (1993) seminal work Human Cognitive Abilities, A Survey of Factor
Analytic Studies examined 460 datasets found in the factor-analytic literature at the
time, and re-analyzed the data using exploratory factor-analytic (EFA) methods. Based
on analyses of the large body of work since Spearman, Carroll synthesized and
organized an empirically based taxonomy of human cognitive abilities into a
systematic, coherent framework (McGrew, 2009; Schneider & McGrew, 2012).
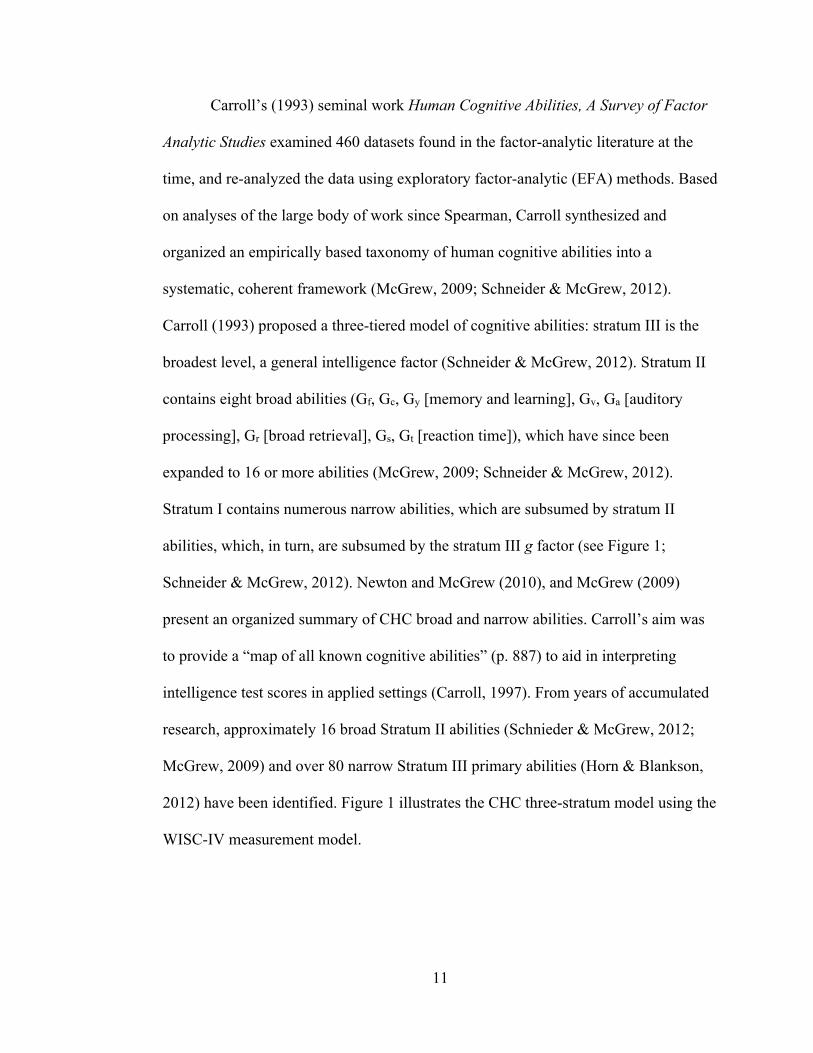
Carroll (1993) proposed a three-tiered model of cognitive abilities: stratum III is the
broadest level, a general intelligence factor (Schneider & McGrew, 2012). Stratum II
contains eight broad abilities (Gf, Gc, Gy [memory and learning], Gv, Ga [auditory
processing], Gr [broad retrieval], Gs, Gt [reaction time]), which have since been
expanded to 16 or more abilities (McGrew, 2009; Schneider & McGrew, 2012).
Stratum I contains numerous narrow abilities, which are subsumed by stratum II
abilities, which, in turn, are subsumed by the stratum III g factor (see Figure 1;
Schneider & McGrew, 2012). Newton and McGrew (2010), and McGrew (2009)
present an organized summary of CHC broad and narrow abilities. Carroll’s aim was
to provide a “map of all known cognitive abilities” (p. 887) to aid in interpreting
intelligence test scores in applied settings (Carroll, 1997). From years of accumulated
research, approximately 16 broad Stratum II abilities (Schnieder & McGrew, 2012;
McGrew, 2009) and over 80 narrow Stratum III primary abilities (Horn & Blankson,
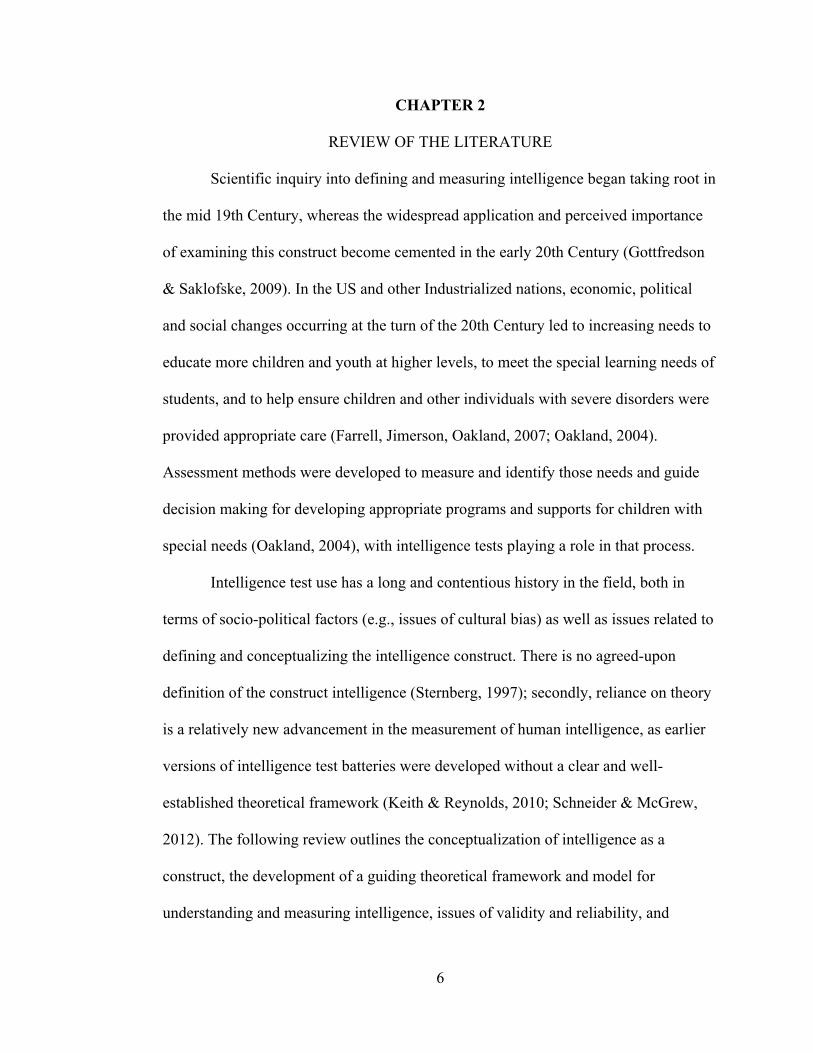
2012) have been identified. Figure 1 illustrates the CHC three-stratum model using the
WISC-IV measurement model.
12
Figure 1. The Cattel-Horn-Carroll (CHC) three-stratum model illustrated using the WISC-IV measurement model. General intelligence (g) sits at Stratum III, the broad domain subskills that predict g are in Stratum II, and Stratum I consists of observable and measurable skills (McGrew, 2009).
g
Perceptual Reasoning: Gf (fluid reasoning), Gv
(visual processing)
Block Design
Matrix Reasoning
Picture Concepts
Verbal Comprehension: Gc (crystallized
knowledge)
Similarities Vocabulary Comprehension
Working Memory: Gsm (short-term memory)
Processing Speed: Gs (cognitive processing
speed)
Digit Span Coding Letter-
Number Seq. Symbol Search 12

13
There was a clear need for the classification and organization of the large body
of research of intelligence test theory. The CHC model and its systematic taxonomy of
cognitive abilities have become popular with contemporary researchers, test
developers, and practitioners over the years. Since the development of the CHC
model, many new and revised intelligence batteries are incorporating CHC theory
(Alfonso et al., 2012). Keith and Reynolds (2010) reviewed the factor-analytic
research of several different intelligence batteries, and found that most contemporary
intelligence batteries were either explicitly grounded in CHC theory, or strongly
influenced by the theory. The Woodcock–Johnson Psychoeducational Battery,
Revised (WJ-R; Woodcock & Johnson, 1989) was the first published test officially to
apply the Gf-Gc theory to assessment practice particularly in educational settings
(Schneider & McGrew, 2012; Keith & Reynolds, 2010). Since then, the CHC model
has been widely incorporated into newer tests and revised versions of older tests
including the Differential Ability Scales (DAS, 2007), Kaufman Assessment Battery
(1983), Stanford-Binet (2003), Wechsler scales (2003a, 2008, 2012, 2014), Reynolds
Intellectual Assessment Scales (RIAS, 2015), and the neuropsychological Cognitive
Assessment System (CAS, 2014; Keith & Reynolds, 2010)
Factor-analytic methods traditionally have been used by intelligence theorists
and test developers to formulate and conceptualize intelligence, and determine its
measurement. In fact, the study of cognitive abilities is closely tied to historical
developments in exploratory (EFA) and confirmatory factor analysis (CFA)
(Schneider & McGrew, 2012), and early intelligence theories and factor-analytic
methods were developed in tandem (Keith & Reynolds, 2012). The psychometric

14
evidence provided for the CHC structural framework in Carroll’s (1993) book, and the
body of research since then makes it difficult to refute that the model is measuring
related variables of an underlying latent construct. Robust psychometric support for
the CHC model has been shown in the related literature. Findings across a multitude of
studies employing EFA, CFA, and multi-group factor-analysis methods have been
applied to test the model’s validity. Additionally, factorial invariance for the CHC
structure of intelligence has been observed in a large majority of studies.
CHC based tests such as the Wechsler Intelligence Scales have been tested and
generally replicated within and across clinical/referred samples, cross-cultural samples
(US ethnic groups, international), and across age and gender groups suggesting that
the constructs measured by intelligence tests appear to be invariant across groups. The
Wechsler Intelligence Scale for Children, fourth edition (WISC-IV; Wechsler, 2003a)
has been adapted and standardized in Canada (both English and French versions), the
United Kingdom, Australia, Germany, Austria and Switzerland, France, Mexico,
India, Sweden, China, and Japan (Grégoire et al., 2008). The structure of the CHC
model has been replicated across referred samples, including children with ADHD
(Styck & Watkins, 2017), Specific Learning Disabilities (Styck & Watkins, 2016) and
other clinical groups (e.g., Canivez, 2014; Devena, Gay, & Watkins, 2013; Nakano &
Watkins, 2013; Watkins et al., 2013). Factorial invariance of the CHC model is
observed across age groups (Chen, Keith, Chen, & Chang, 2009; Bickley, Keith, &
Wolfle, 1995; Keith, Fine, Taub, Reynolds, Kranzler, 2006).
In addition to psychometric support, Alfonso, Flanagan, and Radwan (2012)
claim that CHC theory has an impressive body of evidence related to developmental,
15
neurocognitive, and outcome-criterion support. CHC validated measures of broad and
narrow abilities have been shown to predict outcomes in writing achievement (e.g.,
Floyd, McGrew & Evans, 2008), mathematics (Floyd, Evans, & McGrew, 2003; Taub,
Keith, Floyd & McGrew, 2008), reading decoding (Floyd, Keith, Taub & McGrew,
2007), and other measures of reading achievement (Evans, Floyd, McGrew &
Leforgee, 2002).
Although the CHC model is currently the most widely accepted and applied
theoretical framework for describing the structure of human intelligence, there are
several issues that need to be considered (Keith & Reynolds, 2010). The CHC model
currently does not provide a definition of intelligence that can be applied across
contexts. Evidence for the validity of the CHC has mainly focused on construct
validation through the use of CFA. Keith and Reynolds (2010) suggest a more
rigorous approach that tests both the measurement structure of a test, and theory
behind it. Cross-battery CFA (CB-CFA) analyzes tests from one battery with subtests
from other intelligence test batteries (Keith & Reynolds, 2010). Similar to
discriminant validation procedures, different instruments drawn from different
orientations may offer a better opportunity to confirm or disconfirm each instrument’s
structure (Keith & Reynolds, 2010). Compared to other abilities, Gc is more easily
influenced by factors such as experience, education, and cultural opportunities
(Schneider & McGrew, 2012). This raises two major issues; Gc is theoretically broader
than what current intelligence tests measure, and no test of Gc can be culture-free
(Keith & Reynolds, 2010). Relating to the second point in particular, the cultural
validity of intelligence theories and tests has been a source of debate since the very
16
beginning. Gf is also a measure of fluid reasoning within context, and is dependent on
culturally relevant environmental demands. Issues of cultural bias, and a method to
address cultural bias is reviewed subsequently.
Wechsler Intelligence Scale for Children
Since the development of the Wechsler Bellevue Intelligence Scale in 1939
(Boake, 2002), Wechsler intelligence scales reflect over 70 years of intelligence test
research and development (Wechsler, 2003b). Intelligence tests typically produce
scores traditionally described as intelligence quotients, abbreviated as IQ. Historically,
IQ referred to the score achieved by dividing measured mental age by chronological
age, a ratio process that is no longer in use (Neisser et al., 1996). Though an
antiquated term, IQ has held its use in modern applications. Contemporary intelligence
tests like the WISC use statistical procedures to derive standardized, deviation (versus
ratio) IQ scores, which are considered global estimates of intellectual functioning.
The Wechsler test batteries are differentiated by age group and comprise tests
for preschoolers, children and teens aged 6 to 16, and adults aged 16 to 90 years old.
The scales have been updated and revised over time to incorporate new norms, and
changes in the intelligence theory such the CHC model. The WISC is currently in its
fifth revision; however, for this study, the fourth edition of the WISC was used. At the
time this research was conducted on the island of Trinidad, the newest edition of the
test was not yet commonly used in public agencies, as such, data for the WISC-IV
were more accessible.
Reflecting the CHC hierarchical model, the WISC-IV has 15 subtests
measuring various sub-skills. The scores derived from the tests follow a three-stratum

17
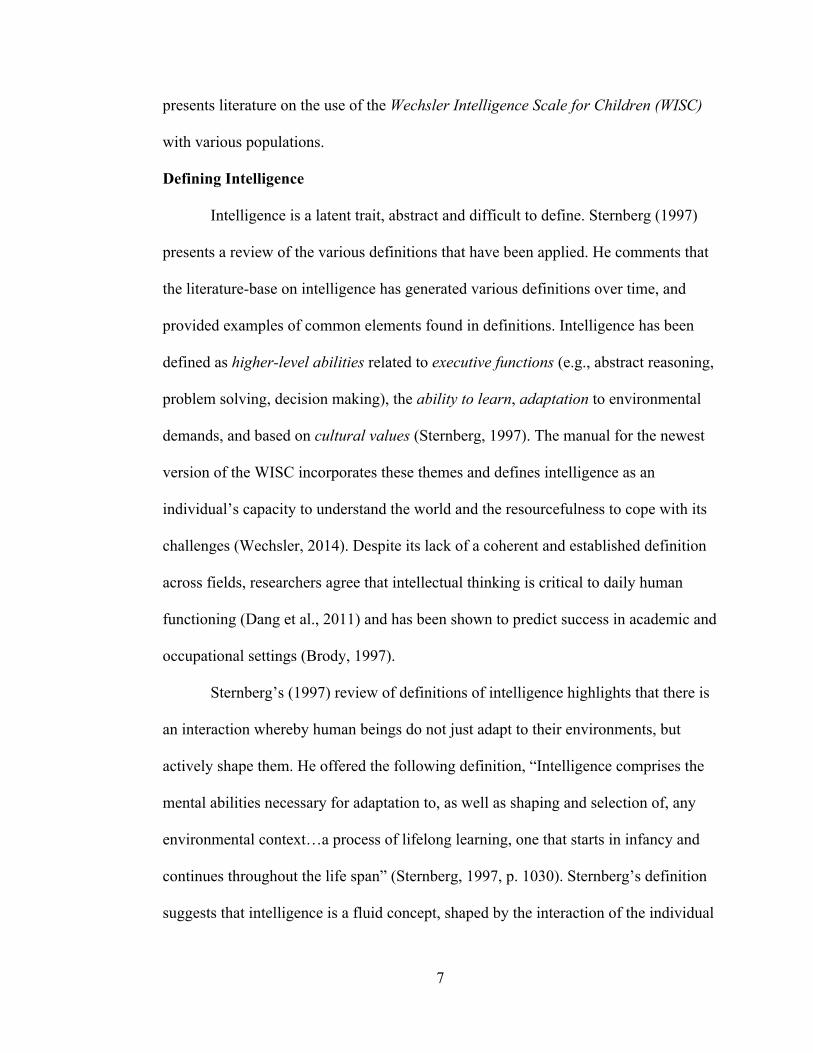
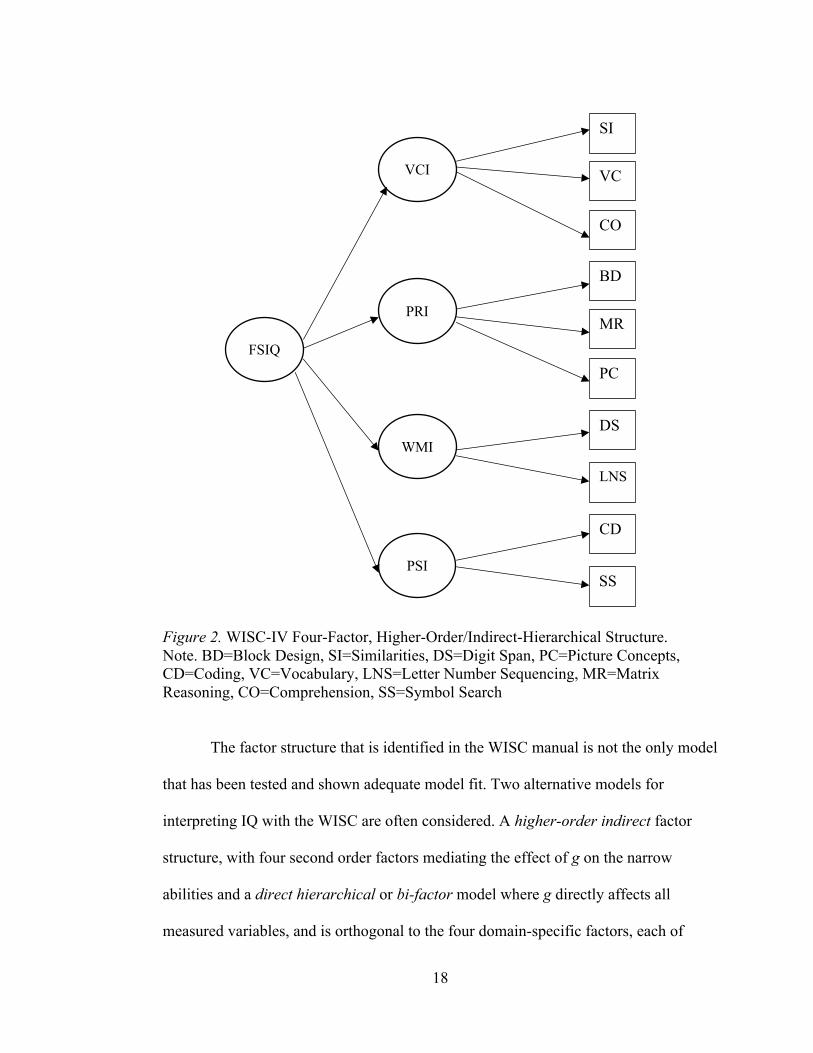
structure of the CHC model. Figure 2 illustrates the WISC-IV’s four-factor higher-
order or indirect hierarchical model influenced by CHC theory and extrapolated using
factor-analytic methods. In stratum I are the subtests; 10 of these subtests are core or
compulsory, and 5 are supplemental (not included in Figure 2). At stratum II, the 15
subtests are grouped into four, theoretical, factor-based index scores: Verbal
Comprehension Index (VCI, cf. Gc), Perceptual Reasoning Index (PRI, cf. Gv and Gf),
Working Memory Index (WMI, cf. Gsm), and Processing Speed Index (PSI, cf. Gs). At
the third strata, the Full Scale IQ (FSIQ) is based on the sum of the 10 core subtests
(three VC, three PR, two WM, and two PS), and considered the most reliable measure
of g (Wechsler, 2003b).
18
Figure 2. WISC-IV Four-Factor, Higher-Order/Indirect-Hierarchical Structure.
Note. BD=Block Design, SI=Similarities, DS=Digit Span, PC=Picture Concepts,
CD=Coding, VC=Vocabulary, LNS=Letter Number Sequencing, MR=Matrix
Reasoning, CO=Comprehension, SS=Symbol Search
The factor structure that is identified in the WISC manual is not the only model
that has been tested and shown adequate model fit. Two alternative models for
interpreting IQ with the WISC are often considered. A higher-order indirect factor
structure, with four second order factors mediating the effect of g on the narrow
abilities and a direct hierarchical or bi-factor model where g directly affects all
measured variables, and is orthogonal to the four domain-specific factors, each of
CO
VC
SI
MR
BD
PC
DS
LNS
CD
SS
FSIQ
VCI
PRI
WMI
PSI

19
which also affect a subset of the measured variables (Styck & Watkins, 2016). Direct
hierarchical models are also considered nested-factor models, where all subtests are
loaded directly both on a g factor and on the other broad factors, with the factors
generally orthogonal or uncorrelated (Gignac, 2008; Keith & Reynolds, 2012).
Although both models indicate that the subtests are affected both by g and one or more
broad abilities, the nature of that influence differs (Keith & Reynolds, 2012). The
higher-order model assumes that g influences individual tests through the broad
abilities, the direct-hierarchical model does not infer the relation between g and the
broad (first-order) factors, instead only specifying that the subtests measure both g and
broad abilities.
Some studies suggest no significant difference between models, though a large
number of studies show support for the direct-hierarchical/bi-factor model with g as a
separate but related factor, accounting for most of the common variance among factors
(e.g., Canivez, 2014; Canivez, Watkins, & Dombrowski, 2016; Devena, Gay &
Watkins, 2013; Dombrowski, Canivez, Watkins & Beaujean, 2015; Gignac, 2008;
Golay, Reverte, Rossier, Favez, & Lecerf, 2013; Styck & Watkins, 2016; Watkins,
Canivez, James, James & Good, 2013). Additionally, in the dissertation by Louison
(2016), CFA analyses with the normative T&T sample showed support for the direct-
hierarchal model.
These findings maintain the underlying conceptual importance of g, but stray
from the traditional three-stratum hierarchical CHC model, where g is assumed to
mediate the relationship between the secondary and primary abilities; rather g is
directly related to primary abilities in a more meaningful way. Although CHC abilities
20
appear to be measuring underlying cognitive abilities, a re-evaluation of the structure
of the CHC model may be necessary considering these findings.
Results of intelligence tests have direct influence on the outcomes of
examinees. IQ test scores are combined with other measures of academic, emotional,
adaptive, and neurological functioning to determine access to supports and services.
Thus, inaccurate test results can have detrimental effects on individuals, their families,
and the systems within which they operate. As such, it is imperative that test results
are reliable and valid, and the inferences made from these results reflect an accurate
estimate of the construct being measured. Accurate, unbiased testing leads to better
predictive power.
Reliability and Validity
Standardized tests address two important characteristics. First, an examinee’s
score can be compared with a normative group consisting of others who share
important characteristics (e.g., age, gender, language, cultural background).
Additionally, standardized tests aim to ensure consistency of format and procedures in
use and administration to reduce the influence of extraneous variables on the construct
being measured. Reducing external influences minimizes error and ensures that the
results garnered produce reliable and valid information about the test taker.
Reliability refers to the consistency and precision of results (Urbina, 2004).
Reliability measures target consistency of measurement over time, forms of a test, or
the internal consistency of instruments, and is evaluated with the intent to assess
measurement error because reliability is inversely related to measurement error.
Although some level of random error is expected, systematic and consistent error in
21
measurement represents a source of bias and limits the validity of test results (Urbina,
2004).
Validity is concerned with how accurately a test measures a construct or latent
trait of interest. If a test is a valid measure of a specific construct, ideally it should
have strong reliability; however, if a test consistently produces similar results, this
does not guarantee that it is a valid measure of the intended construct. Concerns for
bias can arise when the validity of a standardized test is questioned. There are various
types of evidence of validity in measurement tools that test developers examine to
reduce bias such as content validity, criterion-related validity, and construct validity
(Wechsler, 2003b). Construct validity is relevant to understanding the underlying
psychological processes tests measure (Brown, Reynolds & Whitaker, 1999).
Generally, construct validity examines whether the pattern of relationships among
measures of a trait is related or unrelated to other traits and is consistent with
theoretical expectations (Barker, Pistrang, & Elliott, 2002). One way to establish
construct validity is by showing that the measure shows a pattern of high correlations
with related measures (convergent validity) and low correlations with measures of
unrelated constructs (discriminant validity; van deVijver & Tanzer, 2004). Construct
validation procedures can also be applied early in test development.
Traditionally, factor-analytic methods have been used in the development of
intelligence theory and intelligence tests (Keith & Reynolds, 2012). CFA is a
structural equation modeling (SEM) method applied to assess the relationships among
sets of measures or items and their respective hypothesized latent factors (Harlow,
2014). CFA is a theory-driven approach used to test how well a set of items fit with a

22
predetermined theoretical model. The Wechsler scales, in addition to other
contemporary tests of intelligence, commonly use CFA to examine the measures’ fit
with the CHC model. CFA analyses with the WISC-IV with the US standardization
sample have yielded strong factor loadings that fit the structure of intelligence
hypothesized by CHC theory. CFA was used for this project to determine whether a
similar model fit of the CHC model was replicated with a sample from the island of
Trinidad. Observed differences in the factor structure may indicate a number of
possibilities: test items may be interpreted differently by the two different groups, the
nature of the construct may vary due to cultural differences, the test may measure
completely different constructs for the two groups, or groups may apply different
cognitive processes to respond to items (Warne, Yoon & Price, 2014). Moreover,
differential factor structures would raise concerns about bias.
Cultural Adaptation of Intelligence Tests
The WISC-IV has been adapted and standardized in Canada (both English and
French versions), the United Kingdom, Australia, Germany, Austria and Switzerland,
France, Mexico, India, Sweden, China, and Japan (Grégoire et al., 2008). As can be
seen from this list, the WISC has been culturally adapted for several developed
countries, though, for many developing countries there are limited, well adapted
intelligence tests (Dang et al., 2011).
Culture implies shared values, knowledge, communication (Greenfield, 1997),
and meaning (Serafica & Vargas, 2006). For a test to be applied cross-culturally, these
domains should be shared among the normative groups (Greenfield, 1997). Grégoire et
al. (2008) argue that intelligence cannot be assessed independently of any cultural
23
influence; there is no culture-free test, thus, cross-cultural applications may lead to
biased interpretations. Cross-cultural adaptation goes beyond linguistics. Even in the
UK, an English-speaking country, some items on verbal subtests from US WISC were
modified during adaptation (Grégoire et al., 2008). Whether verbal or non-verbal, all
tests include information relevant to the culture in which the test was developed, and
contain items reflecting what is considered intelligent within that particular culture.
In cross-cultural adaptations of the Wechsler scales, the verbal subtests are the
most frequently modified across languages and cultures (Grégoire et al., 2008). That
observation does not suggest that other subtests are less culturally loaded. Non-verbal
tests are not culture-free (Ortiz, Ochoa, & Dynda, 2012); cultural experiences provide
a framework through which we perceive, analyze, and process non-verbal stimuli
(Grégoire et al., 2008). Pérez-Arce (1999) discusses the concept of an “ecological
brain,” and posits that cultural knowledge and experience provide an interpretive
framework that guides reasoning and problem solving. Cultural environment has a
significant impact on intellectual skills (Gopaul-McNicol & Armour-Thomas, 2002);
to be considered intelligent or adaptive means to excel in the skills valued by one’s
own group (Neisser et al., 1996). All tests are culturally loaded and contain items
reflecting what is considered to be intelligent within that culture (Suzuki, Prevost, &
Short, 2008). As such, the cross-cultural application of tests that were developed for
one culture, as is the case with the WISC-IV in T&T, may not accurately reflect the
underlying latent trait that the test was designed to measure.
24
Research Objective
The objective of this study was to determine whether the factor structure of the
WISC-IV could be replicated with a Trinidadian sample. This objective was examined
using CFA to determine model fit of the four-factor hierarchical model of the WISC-
IV. The results of this study have implications for determining the construct validity
and applicability of this tool for measuring intellectual functioning with this
population. This study is similar in objective, method, and scope to Watkins et al.
(2013) and Louison (2016). In Watkins et al. (2013), researchers completed a factor
analytic study of the WISC-IV with a referred sample in Ireland with the UK version
of the test. The factor structure was replicated and model fit established with a sample
of 794 Irish children. In Louison (2016), hierarchical models were not tested with the
referred sample, but only with the normative sample and a direct-hierarchical model
was determined to have superior fit. This study sought to examine whether results
would be replicated with a different sample from the island of Trinidad. Results were
compared with other global studies that have used samples from various countries, as
well as studies that have used clinical samples.
CFA Models
Six models were tested based on models that have been explored in the WISC-
IV manual (Wechsler, 2003b), as well as previous research with referred and cross-
cultural samples (see Canivez, 2014; Chen et al, 2009; Devena, Gay, & Watkins,
2013; Louison, 2016; Nakano & Watkins, 2013; San Miguel Montes, Allen, Puente, &
Neblina, 2010; Watkins, 2010; Watkins et al., 2013). Models tested included one-,

25
two-, three- and four-factor models, and two hierarchical (direct and indirect) models
that accounted for the influence of four factors plus a general intelligence factor (g).
26
CHAPTER 3
METHOD
Participants
Data were extracted from client records for children and adolescents who had
been referred for evaluation of learning difficulties and other disabilities (N = 261).
Records were sourced from private practices and one public agency in Trinidad. Of
note, the psychologists that agreed to participate and provide authorization had private
practices mainly located in the north-west and north-central regions in Trinidad. Data
were not collected on the island of Tobago, mainly due to constraints with time and
available resources. The sample consisted of children and adolescents aged 6 to 16
years old, with an average age of 11 years old (M = 11.13, SD = 2.76). There were
more males (n = 182, 69.7%) in the sample compared to females (n = 79, 30.3%).
Clinical diagnoses were included in client records for most participants, though for
19.5% of participants a diagnosis was not discovered in the records. Twenty percent
(20.7%) of the records reported that the participant met criteria for at least two
diagnoses; 1.9% reported three or more diagnoses. Of the cases with more than one
diagnosis, Attention-Deficit/Hyperactivity Disorder (ADHD) was often a co-morbid
diagnosis. Table 1 lists the diagnostic categories for the participants.

27
Table 1
DSM Diagnostic Categories for Participants Diagnosis Frequency Percent
Intellectual Disability 47 18.0
Attention-Deficit/Hyperactivity Disorder (ADHD) 43 16.5
Specific Learning Disability (SLD) 39 14.9
Language Disorder 8 3.1
Autism Spectrum Disorder/Pervasive Developmental Disorder 6 2.3
Family or Peer Relational Issues 3 1.1
Major Depressive Disorder 2 0.8
Anxiety Disorder 1 0.4
Auditory Processing Difficulties 1 0.4
Developmental Motor Coordination Disorder 1 0.4
Two diagnoses 54 20.7
Three or more diagnoses 5 1.9
No diagnosis recorded 51 19.5
Measures
The most recent version of the Wechsler Intelligence Scale for Children is the
fifth edition, the WISC-V (2014). In this study, however, the fourth edition WISC-IV
(2003a) was used rather than the newest version of the test; because as the WISC-V is
relatively new, large amounts of data were not readily available particularly from
public agencies. Only the ten core subtests of the WISC-IV were analyzed;
supplemental subtests are rarely used in practice with clinical samples. For the WISC-
IV, scaled-score conversions (M = 10, SD = 3) of raw scores are provided for all
subtests; index scores are expressed and interpreted using normalized standard scores
(M = 100, SD = 15). The Full Scale IQ (M = 100, SD = 15) is a general intelligence
composite score composed of three verbal-comprehension subtests, three perceptual-
reasoning subtests, two working-memory subtests, and two processing-speed subtests.
Reliability coefficients reported in technical manuals are usually high for
Wechsler scales, all typically above .70. For the WISC-IV, internal consistency
28
reliability was obtained using the split-half method for all subtests with the exception
of the processing-speed subtests; test-retest reliability was obtained for these speeded
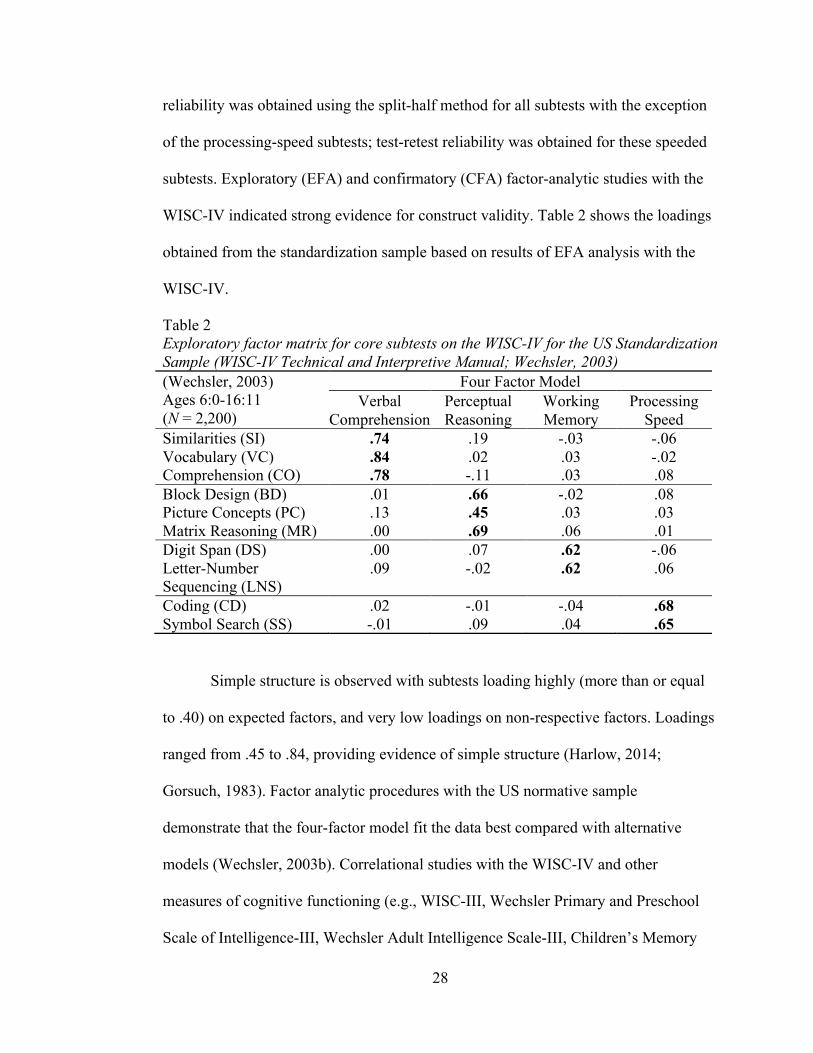
subtests. Exploratory (EFA) and confirmatory (CFA) factor-analytic studies with the
WISC-IV indicated strong evidence for construct validity. Table 2 shows the loadings
obtained from the standardization sample based on results of EFA analysis with the
WISC-IV.
Table 2
Exploratory factor matrix for core subtests on the WISC-IV for the US Standardization Sample (WISC-IV Technical and Interpretive Manual; Wechsler, 2003) (Wechsler, 2003)
Ages 6:0-16:11
(N = 2,200)
Four Factor Model
Verbal
Comprehension
Perceptual
Reasoning
Working
Memory
Processing
Speed
Similarities (SI) .74 .19 -.03 -.06
Vocabulary (VC) .84 .02 .03 -.02
Comprehension (CO) .78 -.11 .03 .08
Block Design (BD) .01 .66 -.02 .08
Picture Concepts (PC) .13 .45 .03 .03
Matrix Reasoning (MR) .00 .69 .06 .01
Digit Span (DS) .00 .07 .62 -.06
Letter-Number
Sequencing (LNS)
.09 -.02 .62 .06
Coding (CD) .02 -.01 -.04 .68
Symbol Search (SS) -.01 .09 .04 .65
Simple structure is observed with subtests loading highly (more than or equal
to .40) on expected factors, and very low loadings on non-respective factors. Loadings
ranged from .45 to .84, providing evidence of simple structure (Harlow, 2014;
Gorsuch, 1983). Factor analytic procedures with the US normative sample
demonstrate that the four-factor model fit the data best compared with alternative
models (Wechsler, 2003b). Correlational studies with the WISC-IV and other
measures of cognitive functioning (e.g., WISC-III, Wechsler Primary and Preschool
Scale of Intelligence-III, Wechsler Adult Intelligence Scale-III, Children’s Memory
29
Scale) provide evidence for convergent validity. Correlation coefficients for validity
measures generally exceeded .60.
Procedure
University of Rhode Island Institutional Review Board (IRB) approval was
sought and granted in March 2018. Approval was sought and granted in October 2017
from the Research Ethics Committee of the North West Regional Health Authority
(NWRHA), Ministry of Health of Trinidad and Tobago. Data collection started in July
2018 and ended in December 2018. Psychologists/practitioners employed at public
and private agencies in Trinidad were contacted via email and asked to participate in
the study. Practitioners in Tobago were not approached due to convenience and time
constraints. Data were not collected on the island of Tobago, and it is uncertain
whether there were participants in this study who were born or raised on that island,
though it is unlikely. As such, even though the country that the sample was taken from
is officially called the Republic of Trinidad and Tobago, the sample better represents
children and youth from the island of Trinidad who are typically referred for
psychological assessment.
Practitioners who agreed to participate were asked to sign an IRB approved
letter of authorization either to allow the researchers to access client data or to
participate in the data collection process. Data were collected from one public
agency/clinic; however, most of the data (69.7%) were gathered from private
psychological practices with five practitioners providing client data. Of the five
practitioners at the private agencies, four worked at the same clinic, though managed
their individual private practices. Some practitioners opted to extract the data
30
themselves and were provided with a blank database with the necessary variable
headings. Others allowed access to one of the primary researchers to extract scores
and other requested data from client files.
Client files that contained an IQ test administered between 2013 to 2018 were selected
for review. Of note, there is no guarantee that all cases selected for sample inclusion
were full citizens of Trinidad and Tobago, or lived most of their lives in the country,
as in some cases this information may not have been included or readily available in
files. That being said, it is fair to assume that the sample is representative of youth
who are referred for psychological evaluation in Trinidad, with higher representation
of those from private practice agencies.
Demographic data (age, gender), diagnosis, and school were recorded. No
names, addresses, or other identifying information related to clients were recorded or
stored. An identification number was provided for each client in the database.
Practitioners also were assigned an identification number; no identifying information
was recorded or stored for the practitioners. IQ test scores were recorded for each
client, as well as academic scores once these were available. Reading and Math
composite scores were mostly from the Wechsler Individual Achievement Test,
second (WIAT-II) or third (WIAT-III) editions, but were not used in this study’s
analyses due to inconsistent reporting of academic test score results in client files. It
was initially intended to explore mean differences or factor invariance based on school
type – government (public), government assisted (e.g., religious charter schools), or
public. However, there was much difficulty sourcing information on which schools
fell into the three categories, and this variable was not explored further.
31
In Trinidad and Tobago there is no established research that indicates expected
score differences based on ethnicity or other demographic characteristics. As such,
researchers purposefully did not sample to create stratified groups based on
race/ethnicity. Within this population, poverty, socioeconomic status (SES) and
related factors (e.g., access to education, nutrition, chronic stress) were seen as more
important to consider as potentially contributing to any observed group differences.
Thus, private/public school was considered as a possible proxy for SES to assess
possible differences in scores based on this variable if it were available in the data
collected from the schools.
Several guidelines for appropriate sample sizes for factor-analytic studies are
suggested in the literature. Most guidelines propose that fairly large sample sizes are
required, typically at least 100 to 200 participants (for reviews see Guadagnoli &
Velicer, 1988; Harlow, 2014; MacCallum, Widaman, Zhang & Hong, 1999).
Compiling larger sample sizes is ideal, though this is not always feasible. When using
factor analysis, MacCallum et al., (1999) suggest that sample sizes of less than 100
may be appropriate with high communality (estimates of the shared variance among
subtests) and well determined factors. Factor-analytic models may require fewer
participants than common guidelines suggest if the model yields high estimates of
shared variance among variables (greater than or equal to .30), factors show high
loadings on at least three or four variables, and show good simple structure
(Guadagnoli & Velicer, 1988; Harlow, 2014). Therefore, with a larger sample the
impact of sampling error on factor-analytic models may be reduced, and making
generalizations or inferences from a sample is strengthened as sample size increases
32
(Harlow, 2014). Considering these various criteria, a sample of 261 participants was
determined to be adequate, although, a larger sample would be preferred in the future.
Descriptive statistics and correlation tables were computed using SPSS version
21. CFA models were computed using the lavaan (latent variable analysis; Rosseel,
2012) package in R which computes parameters using maximum likelihood
estimation. The semPaths package in R was used to create CFA diagrams for the
models tested. Six models were tested based on four WISC-IV factor structures
examined in the test manual (Wechsler, 2003b) as well as what have been tested in
CFA studies with referred and non-clinical samples (e.g., Canivez, 2014; Nakano &
Watkins, 2013; Watkins, 2010; Watkins et al., 2013,). The first included a one-factor
structure with all ten subtests loading on a single g factor. The second model included
a two-factor model whereby five subtests that require higher language demand (verbal
expression and oral listening skills: SI, VC, CO, DS, LNS) loaded on a verbal factor,
and five subtests that require visual-spatial abilities (BD, PC, MR, CD, SS) loaded on
a non-verbal factor. The third model contained the verbal comprehension factor and
the perceptual reasoning factor with their respective subtests, with a third, cognitive
processing, that combined processing speed and working memory subtests. The fourth
model was a correlated factor model that included the four WISC-IV factors with their
respective subtests, without accounting for the effect of g. The fifth model examined
the WISC-IV four factor model with the inclusion of the higher-order/hierarchical g
factor as recommended in the test manual (Bodin, Pardini, Burns, & Stevens, 2009;
Nakano & Watkins, 2013; Wechsler, 2003b). A higher-order model implies full
mediation, whereby the association between a higher-order factor (g) and the observed

33
variables (subtests) is mediated fully by the lower-order factors (composites; Yung,
Thissen & McLeod, 1999). The sixth model examined a direct hierarchical (Gignac,
2008) or bi-factor model. With this model, only direct effects are estimated, as such,
each observed variable (subtest) is free to contribute variance directly to the g factor,
as well as directly contribute variance to the individual factor that the observed
variable (subtest) on to which is intended to be loaded. Results of the descriptive
statistics, correlations, and CFAs are outlined in the next chapter.
34
CHAPTER 4
RESULTS
Descriptive Statistics
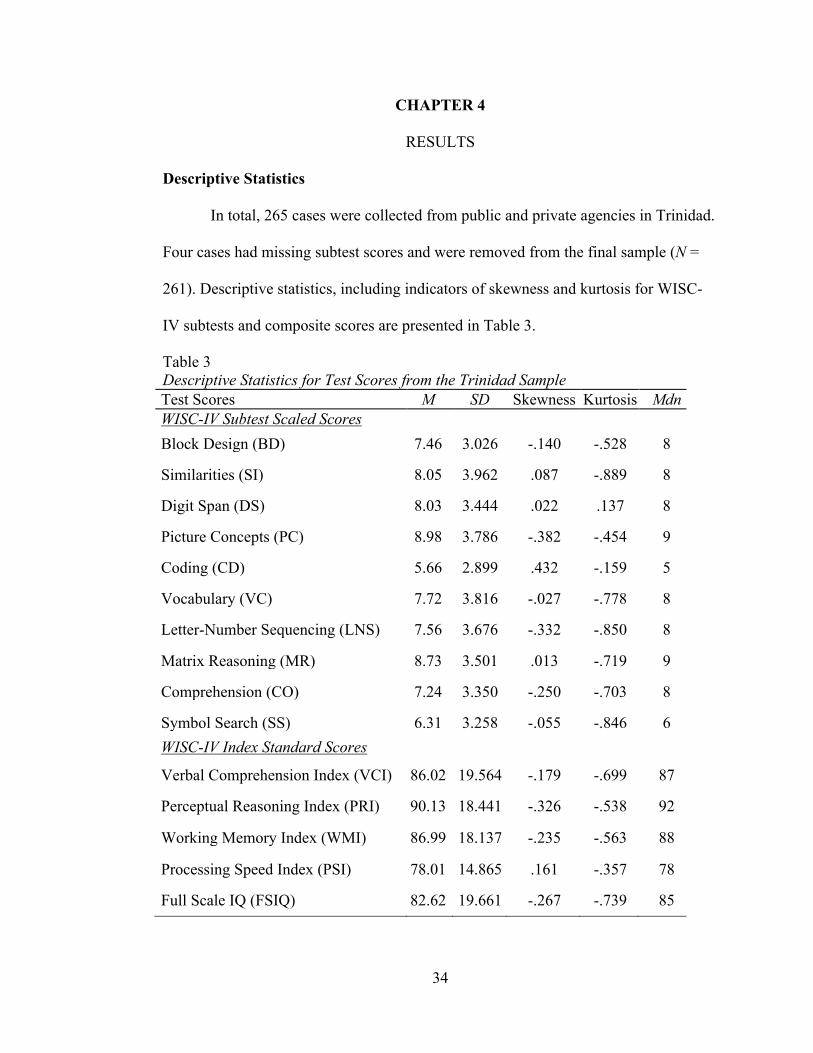
In total, 265 cases were collected from public and private agencies in Trinidad.
Four cases had missing subtest scores and were removed from the final sample (N =
261). Descriptive statistics, including indicators of skewness and kurtosis for WISC-
IV subtests and composite scores are presented in Table 3.
Table 3
Descriptive Statistics for Test Scores from the Trinidad Sample Test Scores M SD Skewness Kurtosis Mdn WISC-IV Subtest Scaled Scores
Block Design (BD) 7.46 3.026 -.140 -.528 8
Similarities (SI) 8.05 3.962 .087 -.889 8
Digit Span (DS) 8.03 3.444 .022 .137 8
Picture Concepts (PC) 8.98 3.786 -.382 -.454 9
Coding (CD) 5.66 2.899 .432 -.159 5
Vocabulary (VC) 7.72 3.816 -.027 -.778 8
Letter-Number Sequencing (LNS) 7.56 3.676 -.332 -.850 8
Matrix Reasoning (MR) 8.73 3.501 .013 -.719 9
Comprehension (CO) 7.24 3.350 -.250 -.703 8
Symbol Search (SS) 6.31 3.258 -.055 -.846 6
WISC-IV Index Standard Scores
Verbal Comprehension Index (VCI) 86.02 19.564 -.179 -.699 87
Perceptual Reasoning Index (PRI) 90.13 18.441 -.326 -.538 92
Working Memory Index (WMI) 86.99 18.137 -.235 -.563 88
Processing Speed Index (PSI) 78.01 14.865 .161 -.357 78
Full Scale IQ (FSIQ) 82.62 19.661 -.267 -.739 85
35
With the US standardization sample, scaled score means were all 10 (SD = 3;
exception of LNS: M = 10.1, SD = 3). With the Trinidad sample, subtest means ranged
from 5.66 (CD, SD = 2.90) to 8.98 (PC, SD = 3.79), and scores ranged from a scaled
score of 1 to 19. Composite means ranged from 78.01 (PSI) to 90.13 (PRI), with
scores as low as 45 and as high as 135. As seen in other studies using referred samples
(Canivez, 2014; Davena, Gay & Watkins, 2013; Louison, 2016; San Miguel Montes et
al., 2010; Watkins, 2010; Watkins et al., 2013; Watkins et al., 2006), means were
generally lower and somewhat more variable than the standardization sample. Of
interest, compared with other studies using referred samples, processing speed scores
are notably lower with the Trinidad sample. In general, scores on the PSI were lower
compared with other cognitive domains in this sample, and about one and a half
standard deviations (22.5 points) from the normal population mean of 100. Scores on
the PRI were somewhat higher than other index scores in the Trinidad sample. In
Table 4, means and standard deviations are provided for the various diagnostic
categories that were reported for participants. Persons diagnosed with ADHD
generally had the highest composite scores. As expected, the group diagnosed with
Intellectual Disabilities had mean scores approximately two standard deviations below
the population mean, as well as compared with the Trinidad sample mean.
To examine the effect of very low scores on sample means, the data for the
four composite scores was sorted to highlight standard scores that fell more than two
standard deviations from the mean (< 70). Participant cases that contained three or
four of their domain composite scores under 70 were removed and means were re-
calculated. Participants cases with composite scores higher than two standard
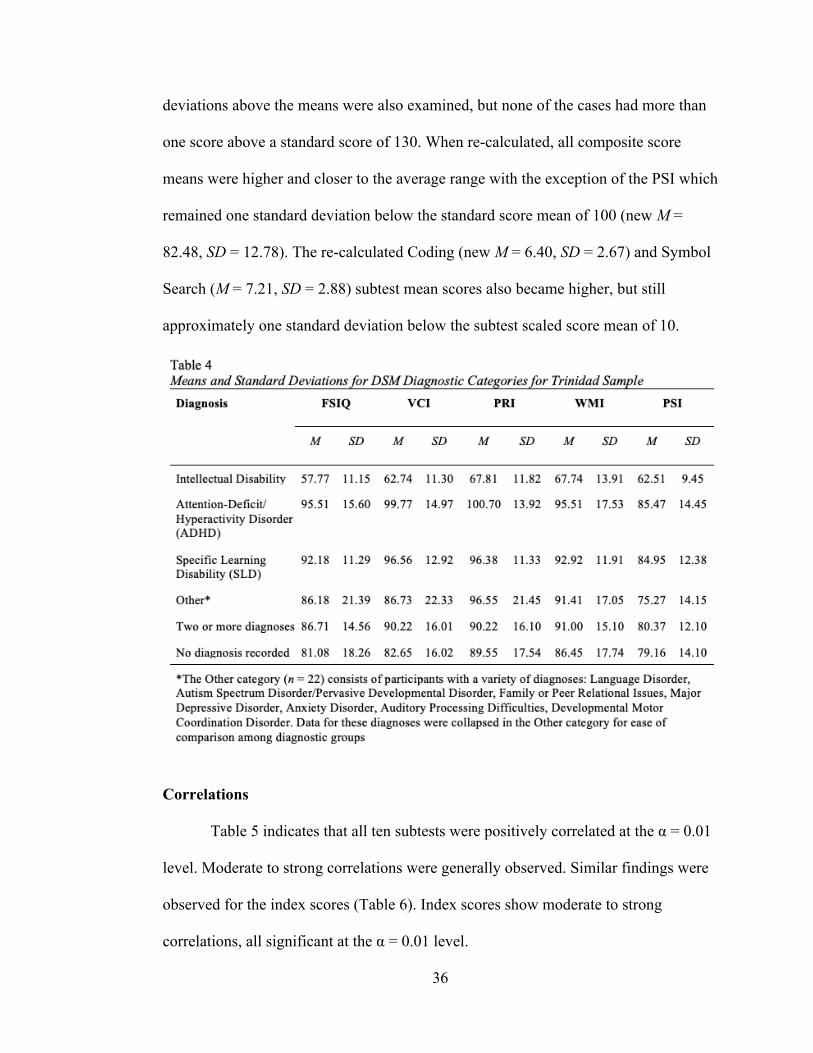
36
deviations above the means were also examined, but none of the cases had more than
one score above a standard score of 130. When re-calculated, all composite score
means were higher and closer to the average range with the exception of the PSI which
remained one standard deviation below the standard score mean of 100 (new M =
82.48, SD = 12.78). The re-calculated Coding (new M = 6.40, SD = 2.67) and Symbol
Search (M = 7.21, SD = 2.88) subtest mean scores also became higher, but still
approximately one standard deviation below the subtest scaled score mean of 10.
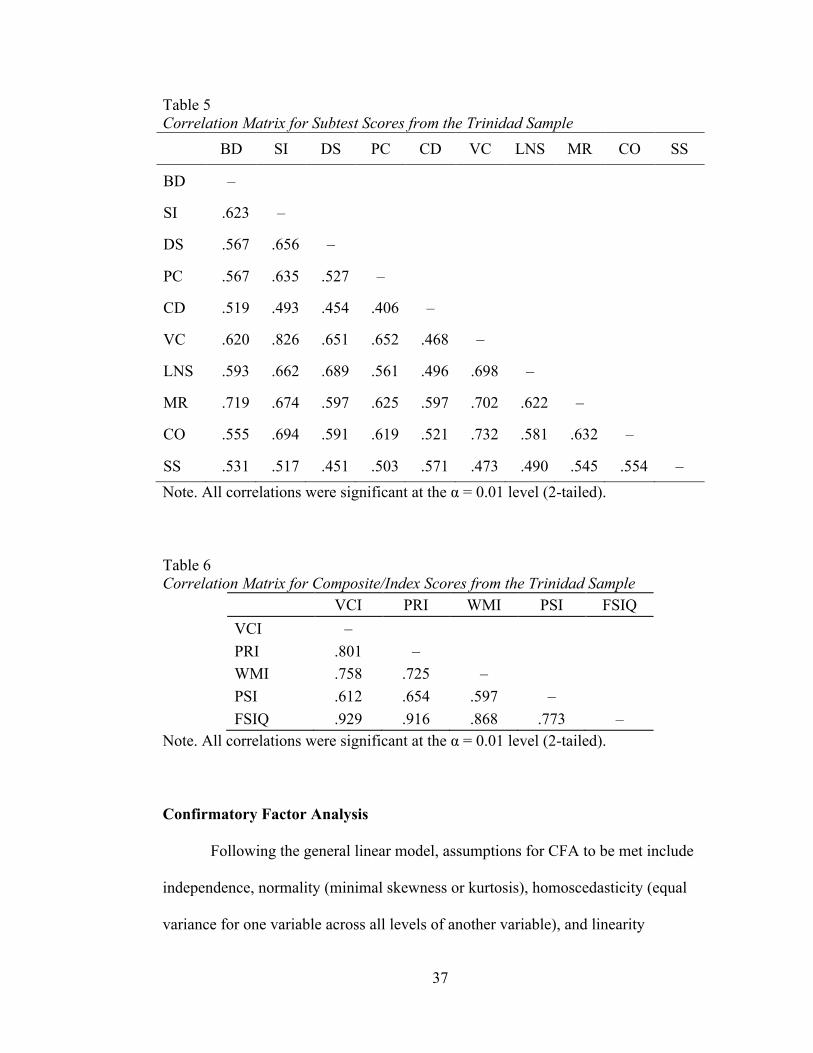
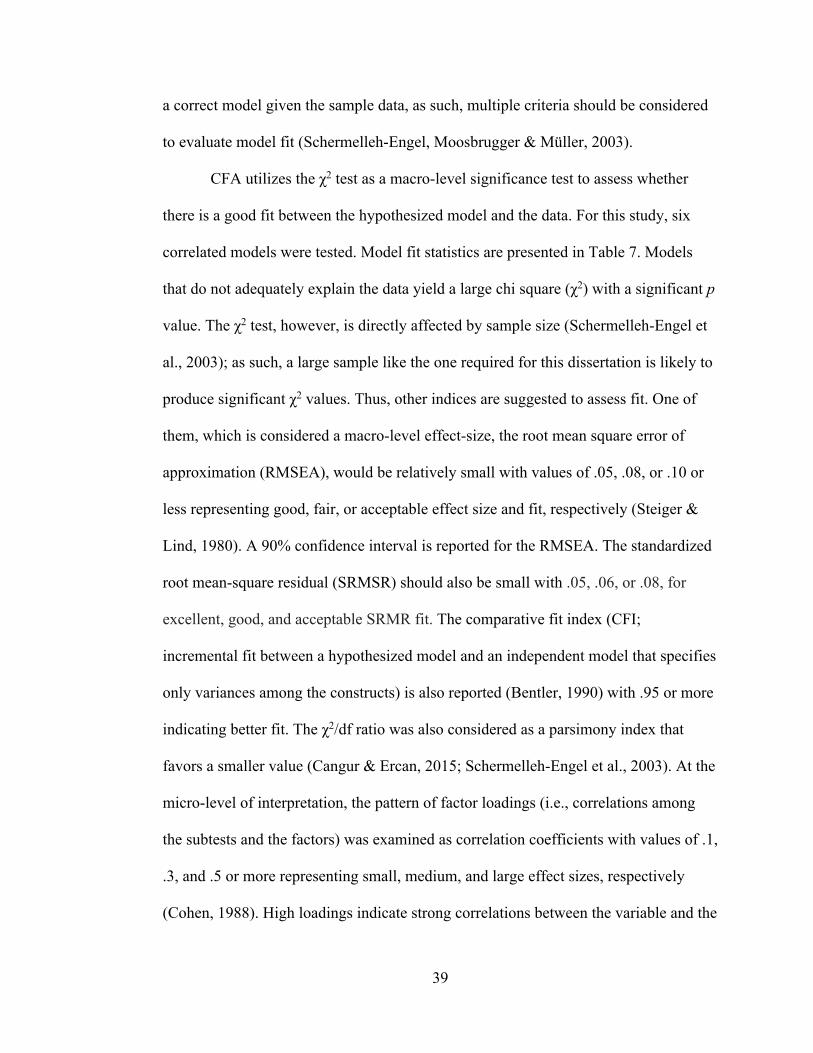
Correlations
Table 5 indicates that all ten subtests were positively correlated at the α = 0.01
level. Moderate to strong correlations were generally observed. Similar findings were
observed for the index scores (Table 6). Index scores show moderate to strong
correlations, all significant at the α = 0.01 level.
37
Table 5
Correlation Matrix for Subtest Scores from the Trinidad Sample
BD SI DS PC CD VC LNS MR CO SS
BD –
SI .623 –
DS .567 .656 –
PC .567 .635 .527 –
CD .519 .493 .454 .406 –
VC .620 .826 .651 .652 .468 –
LNS .593 .662 .689 .561 .496 .698 –
MR .719 .674 .597 .625 .597 .702 .622 –
CO .555 .694 .591 .619 .521 .732 .581 .632 –
SS .531 .517 .451 .503 .571 .473 .490 .545 .554 –
Note. All correlations were significant at the α = 0.01 level (2-tailed).
Table 6
Correlation Matrix for Composite/Index Scores from the Trinidad Sample VCI PRI WMI PSI FSIQ
VCI –
PRI .801 –
WMI .758 .725 –
PSI .612 .654 .597 –
FSIQ .929 .916 .868 .773 –
Note. All correlations were significant at the α = 0.01 level (2-tailed).
Confirmatory Factor Analysis
Following the general linear model, assumptions for CFA to be met include
independence, normality (minimal skewness or kurtosis), homoscedasticity (equal
variance for one variable across all levels of another variable), and linearity

38
(relationships among variables do not change directions after a certain point; Harlow,
2014). Displayed in Table 3, skewness values were within an acceptable range (− 1.0
to + 1.0), as were kurtosis values (below 1.0) indicating relatively symmetric and
homogeneously spread univariate distributions.
The moderate to large correlations among the subtests in Table 5 and the index
scores in Table 6 suggest that the relationships among the scores are relatively linear.
Similarly, there does not appear to be evidence for multicollinearity among the subtest
scores nor among the four index scores, as all correlations were less than .90 (Harlow,
2014). There were correlations of .929 and .916 between the FSIQ score and the VCI
and PRI index scores, respectively; however, that is to be expected as the FSIQ score
is a composite and is derived from the subtests. Additionally, Myers (1990) states that
a variance inflation factor indicating an R-squared less than .90, which corresponds to
a correlation of .95, would suggest that collinearity is not present, which is consistent
with these data.
CFA is a multivariate method that delineates the underlying dimensions in a
set of variables or, in this case, subtests, to determine fit with a theoretical model
(Kline, 2016). Factor-analytic methods can be used to test the theory about the
conceptual nature of underlying dimensions within a set of variables by assessing the
nature of the common-factor variance, or shared variance among variables, while
acknowledging the presence of error variance within the variables (Harlow, 2014). An
examination of model fit determines the degree to which the structural-equation model
fits the sample data, though there is no single statistical significance test that identifies
39
a correct model given the sample data, as such, multiple criteria should be considered
to evaluate model fit (Schermelleh-Engel, Moosbrugger & Müller, 2003).
CFA utilizes the χ2 test as a macro-level significance test to assess whether
there is a good fit between the hypothesized model and the data. For this study, six
correlated models were tested. Model fit statistics are presented in Table 7. Models
that do not adequately explain the data yield a large chi square (χ2) with a significant p
value. The χ2 test, however, is directly affected by sample size (Schermelleh-Engel et
al., 2003); as such, a large sample like the one required for this dissertation is likely to
produce significant χ2 values. Thus, other indices are suggested to assess fit. One of
them, which is considered a macro-level effect-size, the root mean square error of
approximation (RMSEA), would be relatively small with values of .05, .08, or .10 or
less representing good, fair, or acceptable effect size and fit, respectively (Steiger &
Lind, 1980). A 90% confidence interval is reported for the RMSEA. The standardized
root mean-square residual (SRMSR) should also be small with .05, .06, or .08, for
excellent, good, and acceptable SRMR fit. The comparative fit index (CFI;
incremental fit between a hypothesized model and an independent model that specifies
only variances among the constructs) is also reported (Bentler, 1990) with .95 or more
indicating better fit. The χ2/df ratio was also considered as a parsimony index that
favors a smaller value (Cangur & Ercan, 2015; Schermelleh-Engel et al., 2003). At the
micro-level of interpretation, the pattern of factor loadings (i.e., correlations among
the subtests and the factors) was examined as correlation coefficients with values of .1,
.3, and .5 or more representing small, medium, and large effect sizes, respectively
(Cohen, 1988). High loadings indicate strong correlations between the variable and the

40
underlying dimension. In addition to high loadings on expected factors, subtests
should not load highly on non-expected factors (i.e., not have loadings of .30 or more
on more than one dimension; Harlow, 2014). This pattern of loadings would result in
observed simple structure. Comparison of Akaike information criterion (AIC; Akaike,
1974) values was also considered, whereby the best model would have a lower value
(Keith et al., 2006; Lecerf, Rossier, Favez, Reverte, & Coleaux, 2010; Watkins et al.,
2013).
Table 7
Confirmatory Factor Analysis Fit Statistics for Six Structural Models from the Trinidad Sample Model χ2 df CFI RMSEA [90%CI] AIC
One factor 149.752 35 0.937 0.112 [0.094 – 0.131] 12,205.054
Two factors (V, NV) 101.184 34 0.963 0.087 [0.068 – 0.107] 12,158.486
Three factors (VC, PR, WM+PS) 98.648 32 0.963 0.089 [0.070 – 0.110] 12,159.950
Four factors (VC, PR, WM, PS) 56.524 29 0.985 0.060 [0.036 – 0.084] 12,123.826
Indirect hierarchical/higher order 68.165 31 0.979 0.068 [0.046 – 0.090] 12,131.467
Direct hierarchical* 54.429 27 0.985 0.062 [0.038 – 0.086] 12,125.731
V = verbal, NV = non-verbal, VC = Verbal Comprehension, PR = Perceptual
Reasoning, WM = Working Memory, PS = Procession Speed.
*Equality constraints were applied with the WM and PS factors in the direct
hierarchical model to ensure identification.
Table 8 displays the standardized factor loadings for the three models that
showed the best fit with the data. The four-factor and indirect models both show high
loadings for the relationships between the indicators and their respective factors.
Loadings for these models were also significant at the p ≤ .001 level.
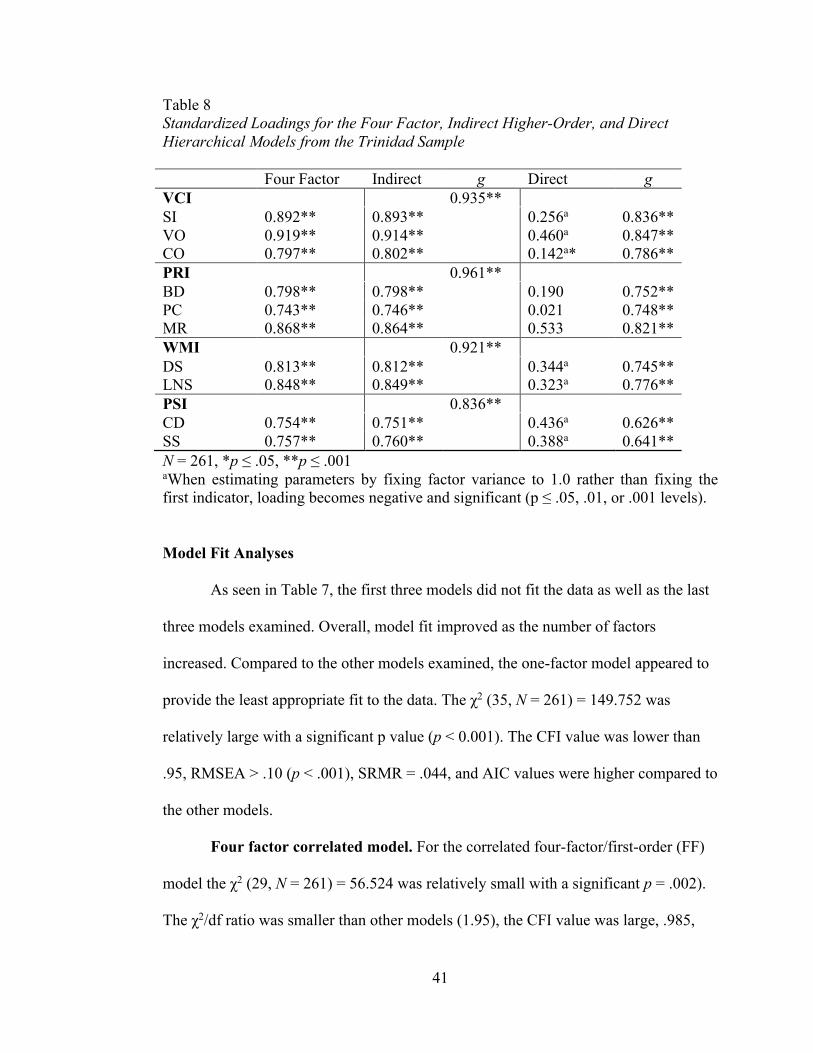
41
Table 8
Standardized Loadings for the Four Factor, Indirect Higher-Order, and Direct Hierarchical Models from the Trinidad Sample
Four Factor Indirect g Direct g VCI 0.935**
SI 0.892** 0.893** 0.256a 0.836**
VO 0.919** 0.914** 0.460a 0.847**
CO 0.797** 0.802** 0.142a* 0.786**
PRI 0.961**
BD 0.798** 0.798** 0.190 0.752**
PC 0.743** 0.746** 0.021 0.748**
MR 0.868** 0.864** 0.533 0.821**
WMI 0.921**
DS 0.813** 0.812** 0.344a 0.745**
LNS 0.848** 0.849** 0.323a 0.776**
PSI 0.836**
CD 0.754** 0.751** 0.436a 0.626**
SS 0.757** 0.760** 0.388a 0.641**
N = 261, *p ≤ .05, **p ≤ .001 aWhen estimating parameters by fixing factor variance to 1.0 rather than fixing the
first indicator, loading becomes negative and significant (p ≤ .05, .01, or .001 levels).
Model Fit Analyses
As seen in Table 7, the first three models did not fit the data as well as the last
three models examined. Overall, model fit improved as the number of factors
increased. Compared to the other models examined, the one-factor model appeared to
provide the least appropriate fit to the data. The χ2 (35, N = 261) = 149.752 was
relatively large with a significant p value (p < 0.001). The CFI value was lower than
.95, RMSEA > .10 (p < .001), SRMR = .044, and AIC values were higher compared to
the other models.
Four factor correlated model. For the correlated four-factor/first-order (FF)
model the χ2 (29, N = 261) = 56.524 was relatively small with a significant p = .002).
The χ2/df ratio was smaller than other models (1.95), the CFI value was large, .985,

42
RMSEA = .06, and the SRMR = .03, with all of these indicating excellent fit. The AIC
value was also the lowest compared to the other models. Factor loadings for the four-
factor model, as illustrated in Table 8, were strong with values ranging from .743 to
.919 indicating large effect sizes. Loadings were all significant at the p < .001 level.
This model is illustrated in Figure 3.
Figure 3. Plot of Correlated Four Factor Model from the Trinidad sample.
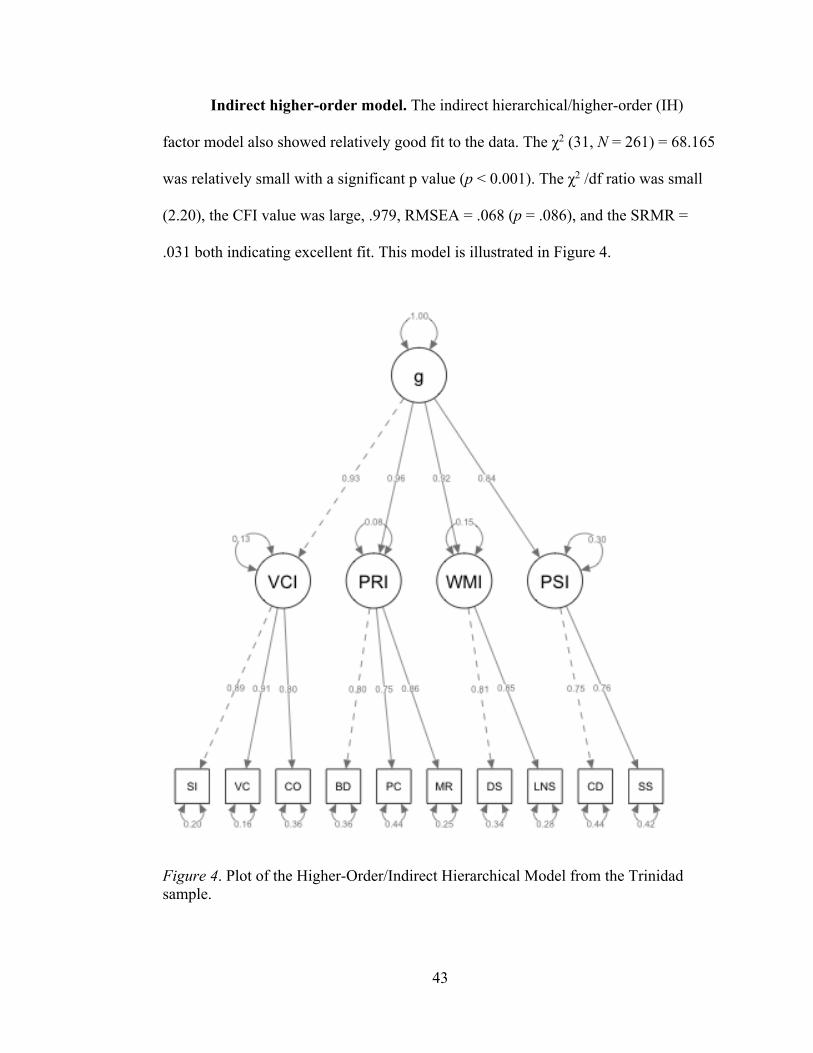
43
Indirect higher-order model. The indirect hierarchical/higher-order (IH)
factor model also showed relatively good fit to the data. The χ2 (31, N = 261) = 68.165
was relatively small with a significant p value (p < 0.001). The χ2 /df ratio was small
(2.20), the CFI value was large, .979, RMSEA = .068 (p = .086), and the SRMR =
.031 both indicating excellent fit. This model is illustrated in Figure 4.
Figure 4. Plot of the Higher-Order/Indirect Hierarchical Model from the Trinidad
sample.
44
Consistent with the FF model, the AIC value for the IH model was also lower
compared with other models, but not lower than the FF model. Factor loadings for the
IH model were strong with values ranging from .746 to .914 indicating large effect
sizes. Loadings were all significant at the p < .001 level.
Direct hierarchical model. Equality constraints were applied to the direct
hierarchical (DH) model for factors that contained only two indicators. With this
model, rather than fixing factor variances to be 1.0, the first indicator for each factor
was set at 1.0 to estimate the other indicators. As such, the indicators that were
constrained to be equal were also each set at 1.0. PG 40 in Lisa’s notes: you usually
can only constrain parameters that are freely estimated and not fixed. When the model
was estimated by fixing the factor variances at 1.0 rather than the loadings, the model
produced negative loadings. Without adding these constraints, the direct hierarchical
model was unidentified and showed inadequate fit: χ2 (30, N = 261) = 213.534 (p =
0.001), the CFI value was lower than .95 (0.899), RMSEA > .10, and AIC values were
the highest compared to the other models. With constraints, the model was identified
and fit indices improved. The constrained bi-factor or direct hierarchical model
yielded a relatively low χ2 (27, N = 261) = 54.429 (p = 0.001), the χ2/df ratio was good
(2.02) and the CFI value was high .985. The RMSEA = .062 (p = .184) and the SRMR
= .027, both indicating excellent fit. Factor loadings for the ten subtests and g with the
constrained DH model were strong with values ranging from .626 to .847, indicating
large effect sizes. Subtest:g loadings were all significant at the p < .001 level. A
different picture was observed for subtest-domain loadings. For the four cognitive

45
domains, subtest loadings ranged from .021 to .533. With the exception of one
loading, loadings for this model yielded small to medium effect sizes.
Figure 5. Plot of the Direct Hierarchical Model from the Trinidad sample.
46
Multivariate Analysis of Variance
In addition to the CFA analyses reported above, multivariate analysis of
variance (MANOVA) analyses were completed to explore possible group differences
among the six practitioner groups across the five composite/factor scores. As
aforementioned, data for this study were collected from six agencies, one of which
was a public clinic, the other five sources were from private practice agencies. The
dependent variables in the MANOVA analyses were the five composite scores or
WISC-IV factors: VCI, PRI, WMI, PSI and FSIQ. In the dataset the agency or
practitioner groups were numbered 1 through 6. For the purpose of interpretation, they
are presented in the results section labelled P1 though P6. P4 represented the public
clinic.
Preliminary analyses were conducted to test for the assumptions of MANOVA
before the main analyses were completed. Skewness and kurtosis values for all
dependent variables were acceptable indicating that that variables are normally
distributed. As seen in Table 6, the correlations among the composite scores showed
moderate to strong correlations among the composite scores. Specifically,
multicollinearity (r ≥ .90) was observed in correlations between the FSIQ and VCI,
and with the FSIQ and PRI. Scatter plots for pairs of variables generally showed an
even diagonal ellipse for the spread of scores, from the bottom left to top right of the
plots. The only exception was the PSI variable which, although it maintained a
somewhat elliptical spread, showed some bunching of scores in the middle of the
scatterplots and to the bottom left of the graphs when paired with the other composite
scores. Additionally, Box’s Test of Equality of Covariance Matrices was completed to
47
examine homoscedasticity or homogeneity of variance. Results indicated a significant
F-test (F[75, 9368.55] =2.93, p < .001), suggesting that some heteroscedasticity was
observed in the data. Follow-up analyses using Levene’s test of equality of error
variances revealed that there was evidence of homoscedasticity for the VCI, PRI and
FSIQ variables, but indicated significant heteroscedasticity for WMI (F[5, 255) =
3.03, p =.011]), and PSI (F[5, 255) = 2.81, p = .017]) variables. Based on preliminary
analyses, violations of the some of the assumptions of MANOVA were observed, as
such, Pillai’s Trace was used to examine differences in the composite scores
(dependent variable) across the six groups as it is more robust against violations.
Results of the main MANOVA analyses show statistically significant
differences for the five composites examined based on agency grouping, F(25, 1275)
= 7.09, p < .001; Pillai’s trace = .610, partial η2 = .122; with a small to medium effect
size. This suggest that about 12% of the variance is significantly shared between the
IV agency group, and a linear combination of the DVs. Follow up ANOVA analysis
revealed significant group differences (p < .001) across all the IQ composites, with
small to medium effect sizes. Table 9 displays means and standard deviations, in
addition to follow-up ANOVA results for the five composite scores for each agency.
Post-hoc analyses were completed using the Scheffé test due to unequal group sizes
and its conservative nature. Means for each composite score were compared across the
individual groups. P4, the public agency group, showed significant mean differences
across each composite score compared with the other private practitioner groups with
the exception of P1. Unlike other composites, the PSI variable did not show significant
groups differences, with the exception of P4 and P5.

48
Table 9 Follow-up ANOVA results for the five composite scores for each agency group.
Note. p < .001 for all ANOVA results
48
49
CHAPTER 5
DISCUSSION
Sample Characteristics and Mean Scores
The sample used in this dissertation consisted of children and adolescents who
had been referred for a psychoeducational evaluation. As with clinical samples (e.g.,
Bodin et al, 2009; Canivez, 2014; San Miguel Montes et al., 2010; Watkins et al.,
2013), there were more boys in this sample, with girls representing only a third of the
sample. Over 20% of the sample had received diagnoses of one or more
neurodevelopmental disabilities or psychological disorders, and about the same
amount had no diagnosis reported in their records. Eighteen percent of the sample had
received a diagnosis of an Intellectual Disability, and 16.5% received a diagnosis of
ADHD. About 70% of the data came from private psychological practices. Participant
ages ranged from 6 to 16, with the average person being 11 years old.
Comparable to studies using referred samples, means for the current study
were generally lower than the US standardization sample. In particular, processing-
speed subtests Coding and Symbol Search, and the PSI scores were more than one
standard deviation from the normative sample mean. Scores on the perceptual
reasoning subtests and the PRI were somewhat higher, and approaching normative
means. Higher PRI scores were also observed in other studies with clinical samples
(e.g., San Miguel Montes, 2010). Median scores for all subtests were within one
standard deviation of the US normative sample, with the exception of the processing
speed scores. Unlike other studies using referred samples, the Coding, Symbol Search
and overall PSI means for the Trinidad sample were particularly low. This observation

50
was a unique finding with a Trinidad sample. The dissertation by Louison (2016)
showed similar findings, with means for Coding and the PSI scores all being lower
than other scores in both a referred and non-clinical sample (Coding M = 7.0; PSI M =
87.3).
Due to the sample having large proportion of participants with a diagnosis of
Intellectual Disabilities, it may be possible that these cases would affect overall mean
scores as the cognitive profile of persons with that diagnosis typically involves scores
falling two standard deviations or more below the standard score mean (Wechsler,
2003b). To determine whether these cases significantly affected processing speed
scores, participants with cases having either all, or three of their composite scores
falling below 70 were removed and means were re-calculated. Although processing
speed score means became higher, these scores were still lower compared with other
domains and still about one standard deviation below the scaled score and standard
score means.
De Clercq-Quaegebeur (2010) showed somewhat similar findings with a
French sample diagnosed with Learning Disabilities. The Coding mean score (M =
7.2) was lower than that for verbal and perceptual-reasoning subtest scores, but that
study’s sample showed greater deficits in the working-memory subtests with scaled
scores lower than seven for Digit Span and Letter-Number Sequencing (De Clercq-
Quaegebeur, 2010). San Miguel Montes (2010) examined WISC-IV scores with a
Spanish speaking sample of Puerto Rican descent that had been administered the
WISC–IV Spanish version. Their Coding mean score was lower than other subtest
scores (M = 7.5), though not as low as with this study (San Miguel Montes, 2010).
51
Devena et al. (2013) utilized a hospital sample, and as with the studies referenced
previously, their Coding mean score was the lowest compared to other subtests (M =
7.18), but still not as low as with the current Trinidad sample.
Lower processing speed in a Trinidad referred sample compared with US and
other international samples can be related to various mediating factors. In Trinidad and
Tobago (T&T), schools and the education system are highly structured and
achievement driven. In primary schools, students in Standard Five (Grade 6) are
required to take a Secondary Entrance Assessment Examination (SEA), whereby
performance determines acceptance into a Secondary School. Families are given a
choice of four possible schools which they rank from highest to lowest preferred,
though the decision is largely based on exam performance and the discretion of the
Ministry of Education (De Lisle, 2012; De Lisle, Smith, Keller, & Jules, 2012). This
system is similar to that of historic and in some cases current practices in developing
countries of sorting students into schools based on performance on a standardized
assessment, a practice that has long been established to lead to inequitable outcomes
for less advantaged students. The use of SEA examinations to determine educational
placement has largely retained its importance in the educational system in T&T
despite the little work that has been done on evaluating the validity and usefulness of
those examination systems in the Caribbean (De Lisle, 2012). Another high-stakes
examination is the Caribbean Secondary Education Certificate (CSEC) that is similar
to the Scholastic Aptitude Test (SAT) in the US and occurs in Form 5 (Grade 11). It is
often the case that students are referred for psychoeducational evaluation in order to
qualify for accommodations for these high-stakes exams. As part of the
52
psychoeducational examination, students are required to complete IQ testing, in
addition to other forms of cognitive, academic and social/emotional testing. The
results of the psychoeducational evaluation determine whether students are provided
with testing accommodations on the SEA examination, with the IQ test results
weighing heavily on the decision. Anxiety can have an inverse relationship with scores
on intelligence tests (Meijer & Oostdam, 2007); thus, psychological evaluation and
high-stakes testing in general may present a source of anxiety unique to students in
T&T. If so, the cognitive load that accompanies this anxiety can lead to slower and
less efficient working speeds, particularly if a student was referred because they are
already struggling to perform academically in school.
In addition to test anxiety, Petty and Harrell (1977) and Grégoire et al. (2008)
indicate that test-wiseness and motivation are important sources of error variance in
educational testing and psychological measurement. Test-wiseness or test stimulus
familiarity can explain differences in performance across subtests, as the more familiar
one is with the structure of a test or testing conditions, the more likely one is to have
better outcomes on that test. Test-wiseness can be related to country affluence, with
more affluent countries likely to be more acquainted with psychological evaluation
(Grégoire et al., 2008). Additionally, the motivation to display one’s skills or abilities
may depend on the amount of previous exposure to psychological tests, the freedom to
participate or not (Grégoire et al., 2008), or high levels of pressure to perform. At this
time, the reasons for lower processing-speed scores observed in this study and in
Louison (2016) are not empirically supported in the literature, and outside the scope of

53
the current research (i.e., anxiety was not directly measured) and can only be
speculative.
CFA: Model Fit Analyses
The aim of this study was determining whether the WISC-IV factor structure
replicated with a Trinidad sample. For this study, data were extracted from archival
records for a clinical sample of children and adolescents between the ages of 6 to 16.
Data were collected from a sample of 261 participants. Confirmatory factor analysis
was applied to test whether the indirect hierarchical/higher-order (IH) WISC-IV
structure recommended in the test manual would emerge from the data, but also five
additional models were tested to determine whether another model would provide
better fit to the Trinidad sample. Results of CFA with the US normative sample
(outlined in the WISC-IV test manual) demonstrate that the IH four-factor WISC-IV
model fit the data best compared with alternative models, and thus, this model is
suggested by the test developer as the best for interpreting general IQ as a construct
and its related cognitive domains (Wechsler, 2003b). Results of this study indicated
that although the WISC-IV IH structure showed acceptable fit to the data with the
Trinidad referred sample, a first order four-factor model provided better fit to the data.
Six models were tested using CFA methods, and fit indices were examined.
The six models included: (a) ten subtests all loading directly onto one g factor; (b) a
two-factor model consisting of a verbal (subtests that demand English language and
listening) and a non-verbal factor (subtests measuring visual-motor or visual-
perceptual abilities); (c) a three-factor model with a verbal comprehension factor,
visual-perceptual factor, and cognitive proficiency factor (working memory and
54
processing-speed skills); (d) a four-factor/first order (FF) model with verbal-
comprehension, perceptual-reasoning, working-memory, and processing-speed factors,
without the influence of g, (e) the higher-order/indirect hierarchical (IH) WISC-IV
model suggested in the test manual, that is, four correlated factors that load onto g and
act as mediators between g and the subtests; and (f) a direct hierarchical (DH) model
where the ten subtests indirectly load onto g as well as their respective four factors.
Although the fifth model is more reflective of a CHC framework, the first and sixth
more closely align with Spearman’s conceptualization of g.
CFA procedures were completed and several fit indices were examined (i.e. χ2,
χ2/df ratio, CFI, RMSEA, SRMR, AIC). Fit improved with the addition of factors. The
one-factor, two-factor, and three-factor models did not represent the data as well as the
latter three models. The FF, IH, and DH models provided better empirical fit to the
data, with the FF model being the most parsimonious, and offering the best overall fit
indices. This pattern of better fit with increasing factors, specifically with four-factor
models has been shown consistently in the literature (Canivez, 2014; Louison, 2016;
Nakano & Watkins, 2013; Rowe, Dandridge, Pawlish, Thompson, & Ferrier, 2014;
Watkins, 2010; Watkins et al., 2013; Wechsler, 2003b). Generally, when tested, either
the FF, IH and DH models are selected as best representing the data with normal and
referred samples. Of the three, however, there has been some variability in which
model is selected as the most appropriate based on an examination of fit indices,
parsimony, and theory.
In this study, three models emerged as providing good fit with the data, the FF,
DH and the IH model (based on the WISC-IV structure). The χ 2diff values for the three

55
models indicated that FF and DH models were not significantly different; however the
IH model was significantly different from the other two models. The DH model was
dropped as it was the least parsimonious of the three, and some factor loadings were
non-significant and smaller than the acceptable threshold for statistical effect sizes. Of
the six models, the FF and IH models were seen as providing the best fit for the data,
and had an almost identical pattern of strong factor loadings, all significant at the p <
.001 level. Further comparison of the FF and IH models indicated that although the IH
model fit better with the existing CHC three-stratum theory and had more degrees of
freedom, the FF model had a lower χ2/df ratio, higher CFI, and lower RMSEA. The
FF model was also the more parsimonious of the two models, and was selected as best
representing the data in this study.
This finding has implications for interpreting the WISC-IV with referred
samples in Trinidad. Combining subtest or composite scores into a single overarching
IQ score may not be the best representation of intellectual functioning with referred
Trinidad samples. Rather, examining the four index scores independently may be a
more appropriate conceptualization of intelligence with this sample and others like it.
Rowe et al. (2014) found similar results with a sample of students who were tested for
gifted and talented (GT) programs. The sample used in Rowe et al. (2014) and the one
used in this study have some similarities. Students considered and tested for GT or
who are eligible for GT programs tend to have higher scores compared with
population means (Rowe, Miller, Ebenstein, & Thompson, 2012; Winner, 2000). An
examination of subtest and index score means in Rowe et al. (2012) shows a pattern of
deviation from the mean similar to what was observed in this study, except that for the

56
GT sample, the scores were significantly above the mean. Other parallels between
their sample and the one used for this study is a pattern of lower processing-speed
subtests and index scores compared to other domain scores. Although the GT sample
showed CD, SS and PSI scores in the average range, the scores were lower compared
with other domain scores. For this study, processing-speed scores were lower
compared with other cognitive domains.
Louison (2016) completed a multi-aim study examining the factor structure of
several models with both referred and normative samples from T&T. Like this study,
for the referred group, the author found that a four-factor model fit the data better than
one, two, or three-factor models. The author of that study however, did not examine
hierarchical models with the referred sample. The second aim of Louison (2016)
examined several measurement models including hierarchical models with a T&T
normative sample. Similar to the current study, the FF, IH and DH models showed
good fit with those data; however, the DH model was shown to provide a superior fit
when compared with other models. It may be possible that with a normative T&T
sample, g has more importance in explaining the relationship among subtests.
The WISC-IV manual recommends that the FSIQ or general intelligence score
not be interpreted as the best estimate of overall intellectual ability if there are
significant discrepancies among subtest or index scores. For referred or non-normal
samples, variability in scores is expected as often the individuals are referred due to
observed impairment or difference in one or more areas of cognitive or academic
functioning. The results of the current study as well as for Rowe et al. (2012), and
Louison (2016; with a T&T referred sample) support this recommendation, as the FF
57
model suggests that keeping interpretation at the index-score level is likely more
appropriate for samples that differ diagnostically from the norm.
That being said, several studies using referred samples have shown different
results, whereby hierarchical models, either the IH or DH are chosen to best fit their
data. The traditional WISC-IV factor structure (IH model) has been replicated with
samples of referred children in Bodin et al. (2009), Styck and Watkins (2017), and
Nakano & Watkins (2014). In Bodin et al. (2009), CFA was conducted examining the
higher-order factor structure of the WISC-IV with a large hospital sample. This study
did not examine a DH model, but included FF and IH models in the analyses. CFA
results favored the IH model with their sample (Bodin et al., 2009). Results described
in Styck and Watkins (2017) showed that the IH model recommended by the WISC-
IV was replicated with an ADHD sample. Similar findings were observed with
Nakano and Watkins (2014) with a referred Native American sample. The authors
examined the same six models outlined in this current study and found that the IH
model best represented their data (Nakano & Watkins, 2014). In general it was found
that these studies found overall good fit with both a FF and IH model, though the IH
models were chosen on the basis of one or two fit indices.
Watkins (2006) suggested that the WISC-IV IH factor structure was not the
best model for interpreting performance on the intelligence test. Watkins (2006)
recommended examining by transforming the four first-order factors to be orthogonal
to each other and to the second-order g factor. According to Watkins (2006),
interpreting a second-level factor on the basis of first-level factors can be misleading
because performance on the subtests reflects a mixture of both first-order factors and g
58
(McClain, 1996). This recommendation suggests the application of a DH model to
examine the relationship between the subtests and factors, and to interpret intelligence
test results. Watkins (2010) examined the same six models that were analyzed in this
current study and found that the DH model produced fit indices that best represented
the data. Canivez (2014) found very similar results with CFA procedures examining
six models using a referred sample; the DH model was chosen as superior when
compared with FF or IH models. Gomez, Vance, and Watson (2017) found that
though the IH and DH models showed good fit, the DH model was found to be
superior based an examination of fit indices with normative and low-IQ samples.
Interestingly, Devena et al. (2013) found similar findings as the current study when
examining the same six models. Although fit indices and factor loadings were
observed to be better for the FF model, the authors reported that no model showed
superior fit over the other, suggesting that the differences among models were
marginal. The authors chose the DH based on “ease of interpretation and breadth of
influence” (Devena et al., 2013, p. 596). According to Keith and Reynolds (2012),
measurement and theory are intertwined and it is important to select an approach to
interpretation on theoretical grounds as well as practical ones. In the study by Devena
et al. (2013), however, the FF model appears to show the best fit based on an
examination of fit indices, and may have been the superior model.
In the study by Watkins et al. (2013), CFA analyses resulted in strong
replication of previous examinations of the internal structure of the WISC–IV with an
Irish sample (N = 794). Watkins et al. (2013) recruited a sample of participants who
were referred to an educational psychologist in the Republic of Ireland. For their
59
study, participants would have been tested using the United Kingdom version of the
WISC-IV, which has the same factor structure as the US version. Watkins et al.
(2013) tested the same six models as the current study. Similarly, the FF, IH, DH
(constrained) models showed adequate fit with their data, compared with one-, two-,
or three-factors models. Although the FF model showed overall better fit, and
appeared parsimonious compared with the DH model, the investigators found the DH
model to be superior (Watkins et al., 2013). Factor loadings ranged from .61 to .93.
Additionally, the researchers found that the higher-order g factor accounted for
substantially greater portions of WISC–IVUK common and total variance relative to the
factor index scores. According to the authors, although the FF model yielded better fit
to the data, meaningful differences in fit statistics were not observed between the FF,
IH and DH models (Watkins et al., 2013). More so, Watkins et al. (2013) also
suggested that because the latent factors were highly correlated, a higher-order
structure is implied, as such the FF model was seen as an inadequate explanation of
the WISC-IV factor structure.
Studies that have identified the DH model as the best compared with the IH
and FF models have recommended that based on overall model fit and their findings
of the g factor accounting for more sources of variance compared with the individual
domains, interpretation of intelligence test scores should be focused at the FSIQ level,
or if examined at the factor level should be done with extreme caution (Watkins et al.,
2013, Canivez, 2014). However, it is often the case that neuropsychologists, school
and clinical psychologists, routinely go beyond the FSIQ to look for strengths and

60
weaknesses among a client’s cognitive skills (Fiorello, Hale, McGrath, Ryan, &
Quinn, 2002).
In the current Trinidad sample, there was a discrepancy between cognitive
domains whereby the PSI score was significantly lower than the other domains. For
both clinical and typical populations, as subtest or factor variability increases, there is
less shared variance among the underlying domains/abilities when predicting the FSIQ
(Fiorello et al., 2002; Fiorello et al., 2007; Hale et al., 2001). Although domain
variability is expected in both clinical and non-clinical populations, this may be more
likely observed in clinical populations as individuals are often referred due to
displaying specific neurocognitive weaknesses, yielding an unequal IQ profile. Some
studies have found evidence to support idiographic (individual) Index interpretation
over nomothetic (general) interpretation of a global FSIQ score for Specific Learning
Disability (SLD), Attention-Deficit/Hyperactivity Disorder (ADHD), and Traumatic
Brain Injury (TBI) populations (Fiorello et al., 2001; Fiorello et al., 2007; Hale et al.,
2001). Hale et al. (2007) recommend that practitioners move beyond global IQ
interpretation to methods for objective idiographic interpretation.
Compared with US normative and clinical samples with mixed diagnoses,
lower processing-speed scores on the WISC-IV were observed with this sample and
the referred and non-referred samples utilized in Louison (2016). The FSIQ or g
construct is a composite of all four domain scores, including the processing speed
scores, and thus if PSI scores with the Trinidad sample in this study were low, it is
expected that FSIQ scores would also be lower. Based on the work by Fiorello et al.
(2001), Fiorello et al. (2007), and Hale et al. (2001), as well as what is recommended
61
in the WISC-IV manual, if domain scores are discrepant, interpretation should remain
at the domain or composite level, as such a FF model is likely more clinically relevant.
Additionally, it may be that lower processing speed scores on the WISC-IV in this
sample and the referred and non-referred samples utilized in Louison (2016) suggest
that processing speed, at least the way it is measured on this test, may not be a good
predictor of intellectual ability for Trinidadian children. This begs the question, are
there other cognitive or intellectual strengths characteristic of Trinidadian children that
the WISC-IV is not measuring? Are foreign-based tests adequately representing
intellectual functioning? Examination of these questions are outside the scope of this
study but are important to explore for future research.
Although the WISC-IV four-factor model presented in the manual (Wechsler,
2003) made an attempt to more closely align with modern CHC theory (Keith et al.,
2006), it is only partially in accordance with the mainstream CHC model of
intelligence (Golay et al., 2012; Lecerf et al., 2010). Some studies have examined the
WISC-IV factor structure testing five- and six-factor models that more closely align
with CHC theory. It must be noted that typically these studies have had access to the
full 15 core plus supplemental subtests of the WISC-IV, and mainly used normative
samples. Only the 10 core subtests were used in the current study as with most clinical
samples only the mandatory tests are administered when the WISC-IV test battery is
used in practice. Among those studies that tested alternative models, Weiss et al.
(2013) and Keith et al. (2006) tested the validity of a four- versus five-factor structure
using the WISC-IV standardization sample and tested several models allowing for
different cross-loadings. Keith et al. (2006) compared the four-factor IH WISC-IV

62
structure (VCI, PRI, WMI, PSI) with a CHC five-factor model that split the PRI index
into two factors representing visual-spatial (Gv: Block Design and the supplemental
test Picture Completion) and fluid reasoning domains (Gf: Matrix Reasoning, Picture
Concepts, and the supplemental test Arithmetic). The authors argued that though the
four-factor IH model fit the data well, the five-factor model showed better fit (Keith et
al., 2006). Weiss et al. (2013) split the PRI index into Gv and Gf. The authors found
that both models showed good fit to the data, and were invariant across both normative
and clinical samples (Weiss, et al., 2013).
Lecerf et al. (2010) used data from the French WISC-IV standardization
sample to examine several different factor configurations. The authors found support
for a six-factor model structure with the French WISC-IV with the PRI split into Gv
(Block Design and Picture Completion which cross-loaded on Gc) and Gf (Matrix
Reasoning, Picture Concepts), and the supplemental test Arithmetic loading on its own
quantitative knowledge (Gq) factor. Similarly, Golay et al. (2012) also used the French
WISC-IV standardization sample data to test both four- and five-factor DH and IH
model structures in both clinical and non-clinical samples, and found stronger support
for a CHC-based five-factor model with either of the hierarchical configurations. As
with other studies, Golay et al. (2012) split the PRI index into two factors Gv (Block
Design, Picture Completion) and Gf (Matrix Reasoning, Picture Concepts). Chen et al.
(2009) found that both four- and five-factor models showed adequate fit in a large
sample of Taiwanese children, with strong support for a five-factor CHC model where
the Similarities subtest loaded on Gf and not Gc.
63
The most recent version of the WISC, the fifth edition, (WISC-V; Wechsler,
2014) favors a five-factor IH model. Based on studies like the ones reviewed and cited
previously, and on contemporary research on the utility of the CHC framework for
conceptualizing intellectual abilities, the WISC-V splits the WISC-IV PRI into two
domains, the Fluid Reasoning Index (Gf) and the Visual-Spatial Index (Gv; Wechsler,
2014). Additionally, new subtests were added in the revisions for both these indices.
Five- or six-factor models were not examined in this study, but may be considered for
future research.
MANOVA Results
Results of the MANOVA analyses indicated statistically significant mean
differences for the five composites scores across all agency/practitioner groups.
Follow-up ANOVA results showed statistically significant group differences for the
individual five composite scores. Additionally, post-hoc analyses indicated that the
public agency group showed significantly lower means for the composite scores with
the exception of one private practitioner group. Differences between the public agency
group compared with the private practice groups were not surprising. In Trinidad,
persons who access public clinics for psychological services typically are from lower
income households. Research has highlighted that SES can be related to IQ test
performance, specifically, there have been trends showing that lower IQ scores can be
linked with lower SES and vice versa (Weiss & Saklofkse, 2020). Among the many
reasons for these findings in the literature, one likely explanation is that parents with
less financial means, possibly access psychological services only when the child needs
are significant. An interesting finding from post-hoc analyses indicated that for the PSI

64
or processing speed score, significant groups differences were not as evident with the
exception of two out of the six groups. This finding supports the observation that the
PSI score is generally lower across groups compared with the other composite scores.
Limitations
Several limitations of this study should be considered. A random sample was
not used in this study. For the practitioners that provided data or allowed access to
clinical files, it was usually an exhaustive list of cases selected for data extraction.
Once the client data met the study requirements, cases were selected for inclusion in
the database. Additionally, this sample was a clinical sample referred for a range of
academic and other difficulties, and not guaranteed to represent non-clinical children
between the ages of 6 to 16 in Trinidad. Cases were also sampled from private
practices and one public agency mainly located in the north-west and north-central
regions in Trinidad. Sampling did not extend to other regions in Trinidad and did not
include Tobago. Moreover, a majority of the sample came from private practices,
which may lead to a higher percentage of the sample coming from homes where
parents can afford to pay for services, which are often expensive in T&T. Without a
non-clinical comparison group, it is uncertain whether the results of this study are
generalizable to the larger T&T population. With more time and resources, a larger,
more representative sample, one involving data from clients across Trinidad and
including Tobago, as well as both clinical and non-clinical samples would provide
results that could be more generalizable. Additionally, access to a more representative
clinical and non-clinical sample would allow researchers opportunities to develop
norms specific to T&T.
65
Measures of socio-economic status (SES) were not be readily available to be
examined in this study; as such there is no appropriate means to determine the impact
of SES on the scores obtained. About 70% of the sample came from private practices.
It is more likely that clients who accessed services from private practices were from a
higher SES background. Even if the private practices did pro-bono or voluntary work,
or clients sought services through employee benefits (e.g., Employee Assistance
Programs), a large proportion of their clients were paying clients. Data sourced from
the public agency were taken from clients who were not required to pay. As such, the
sample and findings may not be largely representative of persons from lower SES
backgrounds. If a larger sample were generated from public agencies and clinics, it
would be interesting to explore whether the findings in this study could be replicated
across groups based on SES. The implications of those results could inform diagnostic
frameworks and intervention planning for persons from more vulnerable sub-
populations within T&T.
This study used archival data from various sources. Therefore, the accuracy of
administration and scoring procedures are assumed. Analyses in this study were
limited to the ten core subtests of the WISC-IV as data from the five supplemental
subtests were not available, as is typical for referred samples. More subtests included
in the analyses allow for more flexibility in the models tested. With all 15 subtests a
variety of model configurations could have been tested. Although the WISC-IV basic
factor structure was replicated in this study, more research is needed to explore other
configurations (e.g., Golay et al., 2013) that could possibly better represent T&T
WISC-IV data. The newest version of the WISC, the WISC-V, recommends

66
interpretation based on a five-factor IH structure that more strongly aligns with the
CHC theoretical framework. In this study, data for the older version of the WISC were
examined, because at the time data were collected, public agencies in T&T were still
widely using the fourth version. Further research is needed with the newer WISC-V to
explore whether the results of this study will hold with other versions of this test.
Summary and Conclusion
US based standardized tests of intelligence are commonly used in assessment
in T&T. Wechsler scales are frequently used; however, published work on the
psychometric properties and appropriateness for use with a T&T population is limited
in the current literature. The results of this study have significant implications for
supporting the continued use of the WISC-IV, or other Wechsler scales with this
population, or discerning whether different assessment approaches (e.g., response to
intervention models) need to be considered in practice and policy.
With the current Trinidad sample, although the recommended factor structure
in the WISC-IV was acceptably replicated with the data, a first-order four-factor
configuration provided superior fit to the data. These findings suggest that with
referred samples in Trinidad, interpretation of the cognitive or intellectual abilities
measured by the WISC-IV might best be examined at the index/composite score level.
Evidence for models that included a general factor showed adequate fit, but were not
the best based on fit indices and expectations of parsimony. The WISC-IV first-order
factor structure may provide the best interpretive model for this sample due to
observed variability among subtest means and composite scores means. In the current
sample, processing-speed mean scores were significantly lower compared with other
67
scores. The WISC-IV manual suggests that the FSIQ/g factor is a less reliable estimate
of intelligence when subtest and composite scores are discrepant. This may account
for the results of the CFA observed in this study. Lower processing speed scores was
also found in the dissertation by Louison (2016) with both a clinical and non-clinical
T&T sample. Together these findings may be indicative of a trend of lower processing
scores on the WISC-IV with individuals from T&T, which can depress overall FSIQ
scores and lead to underestimations of overall intellectual functioning. More research
into the WISC-IV processing-speed scores, and processing speed in general may be
warranted with a T&T population.
Factor analysis is a useful tool for informing how best to interpret relationships
among subtests and exploring the theoretical structure of an instrument; however,
clinical utility should be considered (Prifitera, Weiss, Saklofske, & Rolfhus, 2005;
Weiss et al., 2013). Although the FF model does not fit closely with the three-stratum
CHC model, that configuration may fit best with a referred Trinidad sample. This may
be due to composite-score mean discrepancies, or that the WISC-IV may not
accurately measure processing speed in the current sample of referred individuals.
Future Directions
Assessment involves a comprehensive, integrative process of data collection
and information gathering. Results of assessment inform diagnosis, and are used to
tailor intervention and appropriate supports to individual psychological, emotional,
cognitive, and physical needs. Intelligence testing has remained an essential part of the
assessment process in health and educational settings. Schools and health facilities use
intelligence tests as part of the assessment process to gather information about
68
individuals’ cognitive functioning, and the results inform diagnostic and educational
placement decisions. Thus, ongoing research is needed in the field of diagnostic
testing to ensure that methods and procedures are accurate, valid, and culturally
appropriate.
There is great need for continued research in intelligence testing in T&T.
Although it is important to consider alternative methods, these are beyond the scope of
the current research, and should be considered for continued or future research. Future
studies can employ sophisticated procedures such as latent variable modelling, which
combines a measurement model and a predicative model. One main goal of
psychological testing is ideally to predict functioning or important outcomes.
Predictors that can be considered for a latent variable model can include SEA
performance, other academic outcomes. This study also highlighted that research on
the impact of SES on IQ score performance is warranted.
Additionally, qualitative research on what it means to be intelligent within this
population and context is needed to provide evidence for content validity. More
research is needed into the content validity of the WISC with a T&T population. As
with the development of the WISC and other intelligence tests, content validity could
be examined through meaningful exploration into the relationship between the test
content and the construct it is intended to measure. Differential item functioning or
item-response theory analyses could be conducted in future studies to determine
whether there is bias with individual items rather than the whole test. It would be
interesting to examine how a Trinidad sample would fair with individual items
compared with a US sample. In addition to CFA, an alternative method would be to
69
examine group mean differences using a comparison matched US referred sample. For
this, factorial invariance methods can be applied.
Overall, there has been a paucity of research with the Wechsler scales and
intelligence test use and interpretation in T&T and there is a clear need for more work
in this area, particularly as special education and psychological practice in T&T
continues to grow and develop.
70
BIBLIOGRAPHY
Akaike, H. (1974). A new look at the statistical model identification. In Selected
Papers of Hirotugu Akaike (pp. 215-222). Springer, New York, NY.
Alfonso, V. C., Flanagan, D. P., & Radwan, S. (2012). The impact of the Cattell–
Horn–Carroll theory on test development and interpretation of cognitive and
academic abilities. In D. Flanagan & P. Harrison (Eds.), Contemporary
intellectual assessment: Theories, tests, and issues (3rd ed., pp. 185-202). New
York, NY: Guilford Press.
Ambreen, S. & Kamal, A. (2014). Development of Norms of the Adapted Verbal
Comprehension Index Subtests of WISC-IV for Pakistani Children. Journal of
Behavioural Sciences, 24(1), 85-97.
American Educational Research Association (AERA), American Psychological
Association (APA), & National Council on Measurement in Education
(NCME). (2014). Standards for educational and psychological testing.
Washington, DC: AERA.
Barker, C., Pistrang, N. & Elliott, R. (2002). Research methods in Clinical
Psychology: An introduction for students and practitioners (2nd ed.). West
Sussex, England: John Wiley & Sons, Ltd,
Bentler, P. M. (1990). Comparative fit indexes in structural models. Psychological
Bulletin, 107, 238– 246.
Bickley, P. G., Keith, T. Z., & Wolfle, L. M. (1995). The three-stratum theory of
cognitive abilities: Test of the structure of intelligence across the life span.
Intelligence, 20(3), 309-328.

71
Binet, A. (1905). The Development of Intelligence in Children (The Binet–Simon test)
trans. Elizabeth Kite. Baltimore: Williams and Wilkins.
Boake, C. (2002). From the Binet–Simon to the Wechsler–Bellevue: Tracing the
history of intelligence testing. Journal of Clinical and Experimental
Neuropsychology, 24(3), 383-405.
Bodin, D., Pardini, D. A, Burns, T. G., & Stevens, A. B. (2009). Higher order factor
structure of the WISC-IV in a clinical neuropsychological sample. Child
Neuropsychology, 15(5), 417–424 doi:10.1080/09297040802603661
Bowden, S. C., Saklofske, D. H., & Weiss, L. G. (2011). Invariance of the
measurement model underlying the Wechsler Adult Intelligence Scale–IV in
the United States and Canada. Educational and Psychological Measurement,
71(1), 186–199, doi: 10.1177/0013164410387382
Brody, N. (1997). Intelligence, schooling, and society. American Psychologist, 52(10),
1046-1050.
Bronfenbrenner, U. (1977). Toward an experimental ecology of human
development. American Psychologist, 32(7), 513-522.
Bronfenbrenner, U. (1994). Ecological models of human development. Readings on
the Development of Children, 2(1), 37-43.
Brown, R. T., Reynolds, C. R. & Whitaker, J. S. (1999). Bias in mental testing since
bias in mental testing. School Psychology Quarterly, 14(3), 208-238.
Cangur, S., & Ercan, I. (2015). Comparison of model fit indices used in structural
equation modeling under multivariate normality. Journal of Modern Applied
Statistical Methods, 14(1), 152-167.
72
Canivez, G. L. (2014). Construct validity of the WISC-IV with a referred sample:
Direct versus indirect hierarchical structures. School Psychology Quarterly,
29(1), 38-51.
Canivez, G. L., Watkins, M. W., & Dombrowski, S. C. (2015). Factor structure of the
Wechsler Intelligence Scale for Children–Fifth Edition: Exploratory factor
analyses with the 16 primary and secondary subtests. Psychological
Assessment. Advance online publication, 28, 975-986.
http://dx.doi.org/10.1037/pas0000238
Carroll, J. B. (1993). Human cognitive abilities: A survey of factor-analytic studies.
Cambridge University Press.
Carroll, J. B. (1997). Theoretical and technical issues in identifying a factor of general
intelligence. In B. Devlin, S. E. Fienberg, D. P. Resnick, & K. Roeder (Eds.),
Intelligence, genes, and success: Scientists respond to the bell curve (pp. 125–
156). New York: Springer-Verlag.
Cattell, R. B. (1943). The measurement of adult intelligence. Psychological Bulletin,
40(3), 153-193.
Central Intelligence Agency. (2019). Trinidad and Tobago, World Factbook.
Retrieved from https://www.cia.gov/library/publications/the-world-
factbook/geos/td.html
Chen, H. Y., Keith, T. Z., Chen, Y. H., & Chang, B. S. (2009). What does the WISC-
IV measure? Validation of the scoring and CHC-based interpretative
approaches. Journal of Research in Education Sciences, 54(3), 85-108.

73
Cohen, J. (1988). Statistical power analysis for the behavioral sciences. San Diego,
CA: Academic Press.
Dang, H., Weiss, B., Pollack, A., & Nguyen, M. C. (2011). Adaptation of the
Wechsler Intelligence Scale for Children-IV (WISC-IV) for Vietnam.
Psychological Studies, 56(4), 387–392.
De Clercq-Quaegebeur, M., Séverine Casalis, Marie-Pierre Lemaitre, Béatrice
Bourgois, Marie Getto and Louis Vallée N J Learn Disabil 2010 43: 563
originally published online 8 July 2010DOI: 10.1177/0022219410375000
De Lisle, J. (2012). Secondary school entrance examinations in the Caribbean:
Legacy, policy, and evidence within an era of seamless education. Caribbean
Curriculum, 19, 109–143.
De Lisle, J., Smith, P., Keller, C., & Jules, V. (2012). Differential outcomes in high-
stakes eleven plus testing: the role of gender, geography, and assessment
design in Trinidad and Tobago. Assessment in Education: Principles, Policy &
Practice, 19(1), 45-64.
Devena, S. E., Gay, C. E., & Watkins, M. W. (2013). Confirmatory factor analysis of
the WISC-IV in a hospital referral sample. Journal of Psychoeducational
Assessment, 31(6), 591-599.
Dombrowski, S. C., Canivez, G. L., Watkins, M. W., & Beaujean, A. A. (2015).
Exploratory bifactor analysis of the Wechsler Intelligence Scale for Children—
Fifth Edition with the 16 primary and secondary subtests. Intelligence, 53, 194-
201.
74
Elliott, CD (2007). Differential Ability Scales. San Antonio, TX: Harcourt
Assessment.
Evans, J. J., Floyd, R. G., McGrew, K. S., & Leforgee, M. H. (2002). The relations
between measures of Cattell-Horn-Carroll (CHC) cognitive abilities and
reading achievement during childhood and adolescence. School Psychology
Review, 31(2), 246-262.
Farrell, P. T., Jimerson, S. R., & Oakland, T. D. (2007). School Psychology
Internationally: A Synthesis of Findings. In S. R. Jimerson, T. D. Oakland, &
P. T. Farrell (Eds.), The Handbook of International School Psychology (pp.
501-509). Thousand Oaks, CA, US: Sage Publications, Inc.
Fiorello, C. A., Hale, J. B., Holdnack, J. A., Kavanagh, J. A., Terrell, J., & Long, L.
(2007). Interpreting intelligence test results for children with disabilities: Is
global intelligence relevant?. Applied Neuropsychology, 14(1), 2-12.
Fiorello, C. A., Hale, J. B., McGrath, M., Ryan, K., & Quinn, S. (2002). IQ
interpretation for children with flat and variable test profiles. Learning and
Individual Differences, 13(2), 115-125.
Floyd, R. G., Evans, J. J., & McGrew, K. S. (2003). Relations between measures of
Cattell‐Horn‐Carroll (CHC) cognitive abilities and mathematics achievement
across the school‐age years. Psychology in the Schools, 40(2), 155-171.
Floyd, R. G., Keith, T. Z., Taub, G. E., & McGrew, K. S. (2007). Cattell-Horn-Carroll
cognitive abilities and their effects on reading decoding skills: g has indirect
effects, more specific abilities have direct effects. School Psychology
Quarterly, 22(2), 200-233.

75
Floyd, R. G., McGrew, K. S., & Evans, J. J. (2008). The relative contributions of the
Cattell‐Horn‐Carroll cognitive abilities in explaining writing achievement
during childhood and adolescence. Psychology in the Schools, 45(2), 132-144.
Gignac, G. E. (2008). Higher-order models versus direct hierarchical models: g as
superordinate or breadth factor? Psychology Science, 50(1), 21-43.
Golay, P., Reverte, I., Rossier, J., Favez, N., & Lecerf, T. (2013). Further insights on
the French WISC–IV factor structure through Bayesian structural equation
modeling. Psychological Assessment, 25(2), 496-508.
Gomez, R., Vance, A., & Watson, S. (2017). Bifactor model of WISC-IV:
Applicability and measurement invariance in low and normal IQ groups.
Psychological Assessment, 29(7), 902.
Gopaul-McNicol, S., & Armour-Thomas, E. (2002). Assessment and culture:
Psychological tests with Minority populations. San Diego, CA: Academic
Press.
Gorsuch, R. L. (1983). Factor analysis (2nd ed.). Hillsdale, NJ: Lawrence Erlbaum
Associates, Inc.
Gottfredson, L., & Saklofske, D. H. (2009). Intelligence: Foundations and issues in
assessment. Canadian Psychology/Psychologie canadienne, 50(3), 183-195.
Government of the Republic of Trinidad and Tobago, Ministry of Planning and
Sustainable Development, Central Statistical Office. (2012). Trinidad and
Tobago 2011 Population and Housing Census, Demographic Report. Port of
Spain: Central Statistical Office
https://guardian.co.tt/sites/default/files/story/2011_DemographicReport.pdf
76
Greenfield, P. M. (1997). You can't take it with you: Why ability assessments don't
cross cultures. American psychologist, 52(10), 1115-1124.
Grégoire, J., Georgas, J., Saklofske, D. H., van de Vijver, F., Wierzbicki, C., Weiss, L.
G., & Zhu, J. (2008). Cultural issues in clinical use of the WISC-IV. In
Prifitera, A., Saklofske, D. H., & Weiss, L. G. (Eds.), WISC-IV Clinical
assessment and intervention, (2nd Ed., pp. 495-522). San Diego, CA: Academic
Press.
Guadagnoli, E., & Velicer, W. F. (1988). Relation to sample size to the stability of
component patterns. Psychological Bulletin, 103(2), 265-275.
Hale, J. B., Fiorello, C. A., Kavanagh, J. A., Holdnack, J. A., & Aloe, A. M. (2007). Is
the demise of IQ interpretation justified? A response to special issue authors.
Applied Neuropsychology, 14(1), 37-51.
Hale, J. B., Fiorello, C. A., Kavanagh, J. A., Hoeppner, J. A. B., & Gaither, R. A.
(2001). WISC-III predictors of academic achievement for children with
learning disabilities: Are global and factor scores comparable? School
Psychology Quarterly, 16(1), 31.
Harlow, Lisa L. (2014). The essence of multivariate thinking: Basic themes and
methods (2nd edition). New York, NY: Taylor and Francis.
Horn, J. L., & Cattell, R. B. (1966). Refinement and test of the theory of fluid and
crystallized general intelligences. Journal of Educational Psychology, 57(5),
253-270. http://dx.doi.org/10.1037/h0023816
Horn, J. L. & Blankson, A. N. (2012). Foundations for better understanding of
cognitive abilities. In D. P. Flanagan and P. L. Harrison (Eds.), Contemporary
77
intellectual assessment, Theories, tests and issues (3rd ed., pp. 73-98). New
York: The Guilford Press.
Kaufman, A. S. & Kaufman N. L. (1983). Kaufman Assessment Battery for Children.
Circle Pines, MN: American Guidance Service.
Keith, T. Z., & Reynolds, M. R. (2010). Cattell–Horn–Carroll abilities and cognitive
tests: What we’ve learned from 20 years of research. Psychology in the
Schools, 47(7), 635-650.
Keith, T. Z. & Reynolds, M. (2012). Using confirmatory factor analysis to aid in
understanding the constructs measured by intelligence tests. In D. Flanagan &
P. Harrison (Eds.), Contemporary intellectual assessment: Theories, tests, and
issues (3rd ed., pp. 758-799). New York, NY: Guilford Press.
Keith, T. Z., Fine, J. G., Taub, G. E., Reynolds, M. R., & Kranzler, J. H. (2006).
Higher order, multisample, confirmatory factor analysis of the Wechsler
Intelligence Scale for Children—Fourth Edition: What does it measure. School
Psychology Review, 35(1), 108-127.
Kline, R. B. (2016). Principles and practice of structural equation modeling (4th ed.).
New York: Guilford Press.
Lecerf, T., Rossier, J., Favez, N., Reverte, I., & Coleaux, L. (2010). The four-vs.
alternative six-factor structure of the French WISC-IV. Swiss Journal of
Psychology, 69(4) 221-232.
Louison, K. G. (2016). Assessing the cross-cultural validity of the Wechsler
Intelligence Scale for Children – 4th edition for use in Trinidad and Tobago

78
(Unpublished doctoral dissertation). Goldsmiths, University of London,
London, England.
MacCallum, R. C., Widaman, K. F., Zhang, S., & Hong, S. (1999). Sample size in
factor analysis. Psychological Methods, 4(1), 84-99.
McClain, A. L. (1995). Hierarchical analytic methods that yield different perspectives
on dynamics: Aids to interpretation. Paper presented at the Annual Meeting of
the American Educational Research Association (San Francisco, CA, April 18-
22, 1995).
McGrew, K. S. (2009). CHC theory and the human cognitive abilities project:
Standing on the shoulders of the giants of psychometric intelligence research.
Intelligence, 37, 1–10.
McGrew, K. S. (1997). Analysis of the major intelligence batteries according to a
proposed comprehensive Gf-Gc framework. Journal of Mental Retardation,
89, 215-230.
Meijer, J., & Oostdam, R. (2007). Test anxiety and intelligence testing: A closer
examination of the stage-fright hypothesis and the influence of stressful
instruction. Anxiety, Stress, & Coping, 20(1), 77-91.
Nakano, S., & Watkins, M. W. (2013). Factor structure of the Wechsler Intelligence
Scale for children–fourth edition among referred Native American students.
Psychology in the Schools, 50(10), 957-968.
Myers, R. (1990). Classical and modern regression with applications (2nd edition).
Boston, MA: Duxbury.
79
Naglieri, J. A., Das, J. P., & Goldstein, S. (2014). Cognitive Assessment System,
Second Edition. Austin, TX: Pro-Ed.
Nakano, S., & Watkins, M. W. (2013). Factor structure of the Wechsler Intelligence
Scales for Children–fourth edition among referred Native American
students. Psychology in the Schools, 50(10), 957-968.
Neisser, U., Boodoo, G., Bouchard Jr, T. J., Boykin, A. W., Brody, N., Ceci, S. J.,
Halpern, D. F., Loehlin, J. C., Perloff, R., Sternberg, R. J., & Urbina, S.
(1996). Intelligence: Knowns and unknowns. American Psychologist, 51(2),
77-101.
Newton, J. H., & McGrew, K. S. (2010). Introduction to the special issue: Current
research in Cattell–Horn–Carroll–based assessment. Psychology in the
Schools, 47(7), 621-634.
Oakland, T. (2004). Use of educational and psychological testing internationally.
Applied Psychology, 53 (2), 157-172.
Ortiz, S. O., Ochoa, S. H., Dynda, A. M. (2012). Testing with culturally and
linguistically diverse populations: Moving beyond the verbal–performance
dichotomy into evidence-based practice. In D. P. Flanagan and P. L. Harrison
(Eds.), Contemporary intellectual assessment, Theories, tests and issues (3rd
ed., pp. 526-550). New York: The Guilford Press.
Pérez-Arce, P. (1999). The influence of culture on cognition. Archives of Clinical
Neuropsychology, 14(7), 581–592.
80
Petty, N. E., & Harrell, E. H. (1977). Effect of programmed instruction related to
motivation, anxiety, and test wiseness on Group IQ test performance. Journal
of Educational Psychology, 69(5), 630.
Prifitera, A., Weiss, L. G., Rolfhus, E., & Saklofske, D. H. (2005). The WISC-IV in
the clinical assessment context. In WISC-IV clinical use and interpretation (pp.
3-32). Academic Press.
Reynolds, C. R., & Kamphaus, R. W. (2003). Reynolds Intellectual Assessment Scales
(RIAS), Second Edition. Lutz, FL: Psychological Assessment Resources.
Roid, G. H. (2003). Stanford-Binet Intelligence Scales, Fifth Edition, Technical
Manual. Itasca, IL: Riverside Publishing
Rosseel (2012). lavaan: an R package for structural equation modeling. Journal of
Statistical Software, 48(2), 1–36.
Rowe, E. W., Dandridge, J., Pawlush, A., Thompson, D. F., & Ferrier, D. E. (2014).
Exploratory and confirmatory factor analyses of the WISC-IV with gifted
students. School Psychology Quarterly, 29(4), 536–552.
Rowe, E. W., Miller, C., Ebenstein, L. A., & Thompson, D. F. (2012). Cognitive
predictors of reading and math achievement among gifted referrals. School
Psychology Quarterly, 27(3), 144-153.
Saklofske, D. H., Weiss, L. G., Beal, A. L., & Coalson, D. (2003). The Wechsler
Scales for assessing children's intelligence: Past to present. In J. Georgas, L. G.
Weiss, F. J. R. van de Vijver, & D. H. Saklofske (Eds.), Culture and children's
intelligence: Cross-cultural analysis of the WISC-III (pp. 3-21). San Diego,
CA, US: Academic Press.

81
San Miguel Montes, L. E., Allen, D. N., Puente, A. E., & Neblina, C. (2010). Validity
of the WISC–IV Spanish for a clinically referred sample of Hispanic children.
Psychological Assessment, 22(2), 465-469.
Schermelleh-Engel, K., Moosbrugger, H., & Müller, H. (2003). Evaluating the fit of
structural equation models: Tests of significance and descriptive goodness-of-
fit measures. Methods of Psychological Research Online, 8(2), 23-74.
Schneider, J. W. & McGrew, K. S. (2012). The Cattell–Horn–Carroll model of
intelligence. In D. Flanagan & P. Harrison (Eds.), Contemporary intellectual
assessment: Theories, tests, and issues (3rd ed., pp. 99-144). New York, NY:
Guilford Press.
Serafica, F. C., & Vargas, L. A. (2006). Cultural diversity in the development of child
psychopathology. In D. Cicchetti & D. J. Cohen (Eds.), Developmental
psychopathology: Vol. 1. Theory and method (2nd ed., pp. 588– 626).
Hoboken, NJ: Wiley
Spearman, C. (1904). “General Intelligence,” objectively determined and measured.
The American Journal of Psychology, 15(2), 201-292.
Steiger, J. H., & Lind, J. C. (1980). Statistically based tests for the number of factors.
Paper presented at the annual spring meeting of the Psychometric Society,
May, Iowa City, IA.
Sternberg, R. J. (1997). The concept of intelligence and its role in lifelong learning
and success. American Psychologist, 52(10), 1030-1037.
82
Styck, K. M., & Watkins, M. W. (2016). Structural validity of the WISC-IV for
students with learning disabilities. Journal of Learning Disabilities, 49(2),
216-224.
Styck, K. M., & Watkins, M. W. (2017). Structural validity of the WISC-IV for
students with ADHD. Journal of Attention Disorders, 21(11), 921-928.
Suzuki, L. A., Prevost, L., & Short, E. (2008). Multicultural issues and the assessment
of aptitude. In L. A. Suzuki & J. G. Ponterotto (Eds.), Handbook of
multicultural assessment: Clinical, psychological, and educational
applications (3rd ed., pp. 490-519). San Francisco: John Wiley & Sons.
Taub, G. E., Keith, T. Z., Floyd, R. G., & McGrew, K. S. (2008). Effects of general
and broad cognitive abilities on mathematics achievement. School Psychology
Quarterly, 23(2), 187-198.
Urbina, S. (2004). Essentials of behavioral science series. Essentials of psychological
testing. Hoboken, NJ, US: John Wiley & Sons Inc.
Van de Vijver, F., & Tanzer, N. K. (2004). Bias and equivalence in cross-cultural
assessment: An overview. Revue Européenne de Psychologie
Appliquée/European Review of Applied Psychology, 54(2), 119-135.
Vazquez-Nuttall, E., Li, C., Dynda, A. M., Ortiz, S. O., Armengol, C. G., Walton, J.
W., & Phoenix, K. (2007). Cognitive assessment of culturally and
linguistically diverse students. In G. B. Esquivel, E. C. Lopez & S. Nahari
(Eds.), Handbook of multicultural school psychology: An interdisciplinary
perspective (265-288). Mahwah, NJ: Lawrence Ealbuam & Associates, Inc.
83
Vygotsky, L. (1978). Interaction between learning and development. In M. Cole, V.
John-Steiner, S. Scribner & E. Souberman (Eds.), Mind in society: The
development of higher psychological processes (pp. 79–91). Cambridge, MA:
Harvard University Press.
Warne, R. T., Yoon, M., & Price, C. J. (2014). Exploring the various interpretations of
“test bias”. Cultural Diversity and Ethnic Minority Psychology, 20(4), 570-
582.
Watkins, M. W. (2010). Structure of the Wechsler Intelligence Scale for Children—
Fourth Edition among a national sample of referred students. Psychological
Assessment, 22(4), 782-787.
Watkins, M. W., Canivez, G. L., James, T., James, K., & Good, R. (2013). Construct
validity of the WISC–IVUK with a large referred Irish sample. International
Journal of School & Educational Psychology, 1(2), 102-111, DOI:
10.1080/21683603.2013.794439
Watkins, M. W., Wilson, S. M., Kotz, K. M., Carbone, M. C., & Babula, T. (2006).
Factor structure of the Wechsler Intelligence Scale for Children–Fourth Edition
among referred students. Educational and Psychological Measurement, 66(6),
975-983.
Wechsler, D. (2003a). Wechsler intelligence scale for children, fourth edition,
administration and scoring manual. San Antonio, TX; Pearson.
Wechsler, D. (2003b). Wechsler intelligence scale for children, fourth edition,
technical and interpretive manual. San Antonio, TX: Psychological
Corporation.
84
Wechsler, D. (2008). Wechsler adult intelligence scale, fourth edition, administration
and scoring manual. San Antonio, TX: Pearson.
Wechsler, D. (2012). Wechsler preschool and primary scale of intelligence, fourth
edition, administration and scoring manual. San Antonio, TX: The
Psychological Corporation.
Wechsler, D. (2014). Wechsler intelligence scale for children, fifth edition, technical
and interpretive manual. Bloomington, MN: Pearson.
Weiss, L. G., Keith, T. Z., Zhu, J., & Chen, H. (2013). WISC-IV and clinical
validation of the four-and five-factor interpretative approaches. Journal of
Psychoeducational Assessment, 31(2), 114-131.
Weiss, L. G., & Saklofske, D. H. (2020). Mediators of IQ test score differences across
racial and ethnic groups: The case for environmental and social
justice. Personality and Individual Differences, 161, 109962.
Winner, E. (2000). The origins and ends of giftedness. American psychologist, 55(1),
159.
Woodcock, R. W., & Johnson, M. B. (1989). WJ-R Tests of Cognitive Ability. Itasca,
IL: Riverside Publishing.
Yung, Y. F., Thissen, D., & McLeod, L. D. (1999). On the relationship between the
higher-order factor model and the hierarchical factor
model. Psychometrika, 64(2), 113-128.
Top Related