


Languages
Pages
Legal


Conference Call – Q1/19 Results
Bad Homburg, 02 May 2019
Frankfurt stock exchange: FRE │ US ADR program: FSNUY │ www.fresenius.com/investors

Safe Harbor Statement
This presentation contains forward-looking statements that are subject to various risks and uncertainties. Future results could differ materially from those described in these forward-looking statements due to certain factors, e.g. changes in business, economic and competitive conditions, regulatory reforms, results of clinical trials, foreign exchange rate fluctuations, uncertainties in litigation or investigative proceedings, and the availability of financing. Fresenius does not undertake any responsibility to update the forward-looking statements contained in this presentation.
Q1/19 Results, 02 May 2019 © Fresenius SE & Co. KGaA Investor Relations 2

Q1/19 Highlights
● Solid start to the year; growth investments on track
● Fresenius Kabi with continued good growth in Q1/19
● Helios Germany stabilized; Helios Spain with continued dynamic growth
● Fresenius Medical Care with strong financial performance supported by agreements that materialized earlier than planned
● Fresenius Medical Care closes NxStage transaction
● Group guidance confirmed despite expected earnings dilutionfrom NxStage
Q1/19 Results, 02 May 2019 © Fresenius SE & Co. KGaA Investor Relations 3

Fresenius Kabi: Off to a good start to the year
IV Generics in North America• Tough prior-year comp
• More competition for selected molecules
• 36 Kabi-marketed IV drugs currently designated in shortage vs. 37 at Q4/18
• 4 new product launches YTD; on track to meet expectation of ~15 launches
• Stable prices in our base product portfolio Clinical Nutrition• Excellent growth of parenteral nutrition
especially in China• Enteral Nutrition growth mainly driven
by Latin America and Europe
Transfusion/Cell Technology business• Good progress of carve out• Evaluation of all potential options
Q1/19 Results, 02 May 2019 © Fresenius SE & Co. KGaA Investor Relations
Biosimilars• Earlier than expected EU launch of Idacio®
(Adalimumab) imminent• Preparations for launch in individual EU
countries well underway• Small sales contribution from Idacio®
expected in 2019
4

Fresenius Helios: Update
Helios Germany
Attractive employer for nurses• Ca. 600 additional nurses hired in Q1/19
• Benign impact on P&L in 2019: all incremental nurses (net) placed in 2019 will be fully reimbursed
Collective labor agreements in line with expectations• 2019 – 2020: Agreed salary increase of
+2.5% p.a. with doctors' union Marburger Bund
• Agreed salary increase with labor union (nurses) ver.di of 3% for 2019, 2.5% starting 1 Jan 2020 and from 1 Nov 2020 by a further 1%
New business models• Prevention 2.0
• Roll-out of occupational risk prevention
Helios Spain
Acquisition of two ORP companies• New service offerings
• Complementary to existing ORP network
Clínica Medellin, Colombia• Closing of transaction on April 25
• Annual sales of ~€50 million
Q1/19 Results, 02 May 2019 © Fresenius SE & Co. KGaA Investor Relations 5
Financial Review Q1/19
Q1/19 Results, 02 May 2019 © Fresenius SE & Co. KGaA Investor Relations 6

Fresenius Group: Q1/19 Key Financials
Q1/19 Results, 02 May 2019 © Fresenius SE & Co. KGaA Investor Relations
€m Q1/191 IFRS 16effect
specialitems
Q1/19 reported
Δ YoY cc2
Sales 8,517 -22 - 8,495 5%
EBIT 1,111 19 -15 1,115 2%
Net interest -133 -48 -3 -184 6%
Income taxes -229 8 4 -217 16%
Net income3 465 -8 -4 453 0%
Balance sheet total 59,316 5,669 - 64,985
Operating Cashflow 118 171 - 289
1 Before special items, adjusted for IFRS 16 effect2 On a comparable basis: Q1/18 adjusted for divestitures of Care Coordination activities at FMC3 Net income attributable to shareholders of Fresenius SE & Co. KGaA
For a detailed overview of special items and adjustments please see the reconciliation tables on slides 25-34.
7
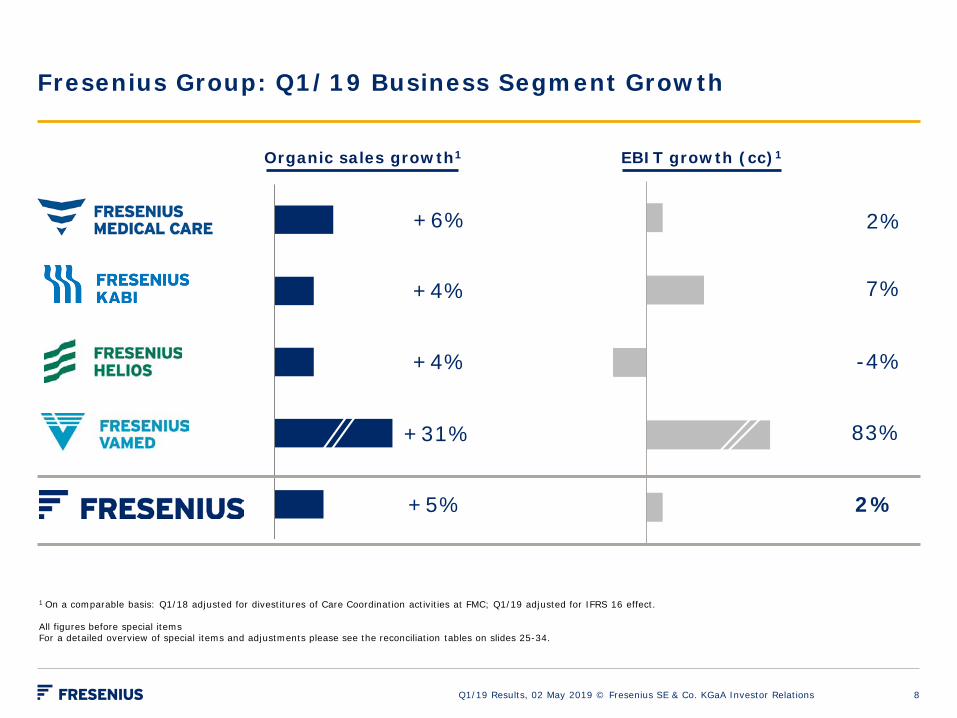
1 On a comparable basis: Q1/18 adjusted for divestitures of Care Coordination activities at FMC; Q1/19 adjusted for IFRS 16 effect.
All figures before special itemsFor a detailed overview of special items and adjustments please see the reconciliation tables on slides 25-34.
Fresenius Group: Q1/19 Business Segment Growth
Organic sales growth1
Q1/19 Results, 02 May 2019 © Fresenius SE & Co. KGaA Investor Relations
EBIT growth (cc)1
+6%
+4%
+4%
+31%
2%
7%
-4%
83%
+5% 2%
8

Fresenius Kabi: Q1/19 Regional Highlights (1/2)
Q1/19 Results, 02 May 2019 © Fresenius SE & Co. KGaA Investor Relations
North America
• -2% organic growth
• Tough prior-year comp
• Easing of shortage tailwinds
• Continued significant launch activity
• Confirm FY/19 outlook: Low to mid-single-digit organic sales growth
Europe
• 3% organic growth
• Enteral nutrition with dynamic growth momentum
• Launch of biosimilar Idacio®
(Adalimumab) imminent
• Confirm FY/19 outlook: Low to mid-single-digit organic sales growth
9
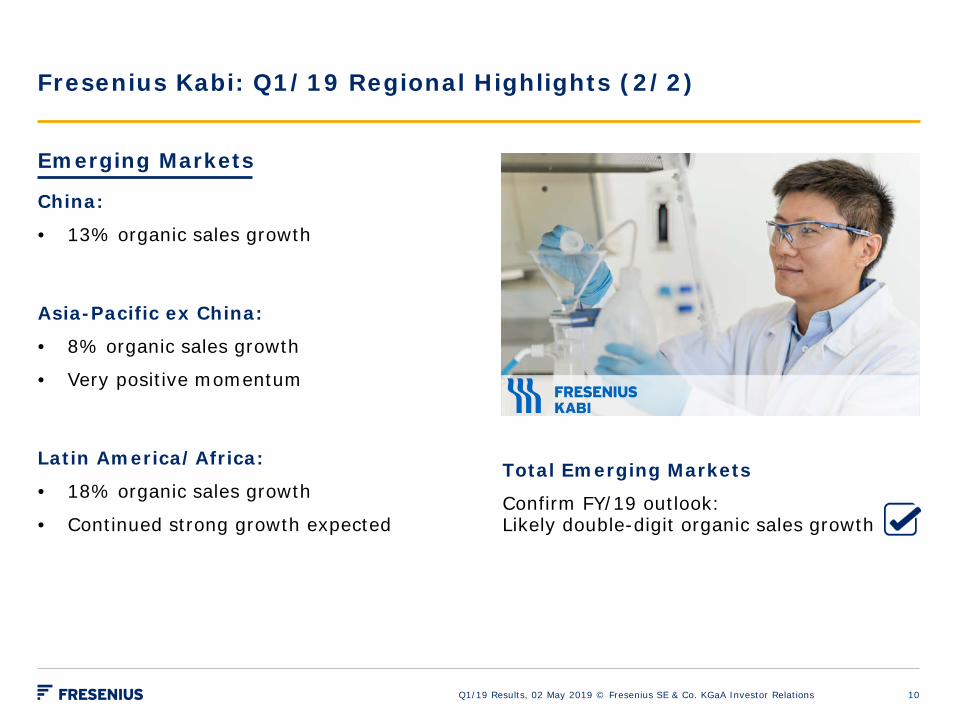
Fresenius Kabi: Q1/19 Regional Highlights (2/2)
Emerging Markets
China:
• 13% organic sales growth
Asia-Pacific ex China:
• 8% organic sales growth
• Very positive momentum
Latin America/Africa:
• 18% organic sales growth
• Continued strong growth expected
Q1/19 Results, 02 May 2019 © Fresenius SE & Co. KGaA Investor Relations
Total Emerging Markets
Confirm FY/19 outlook: Likely double-digit organic sales growth
10
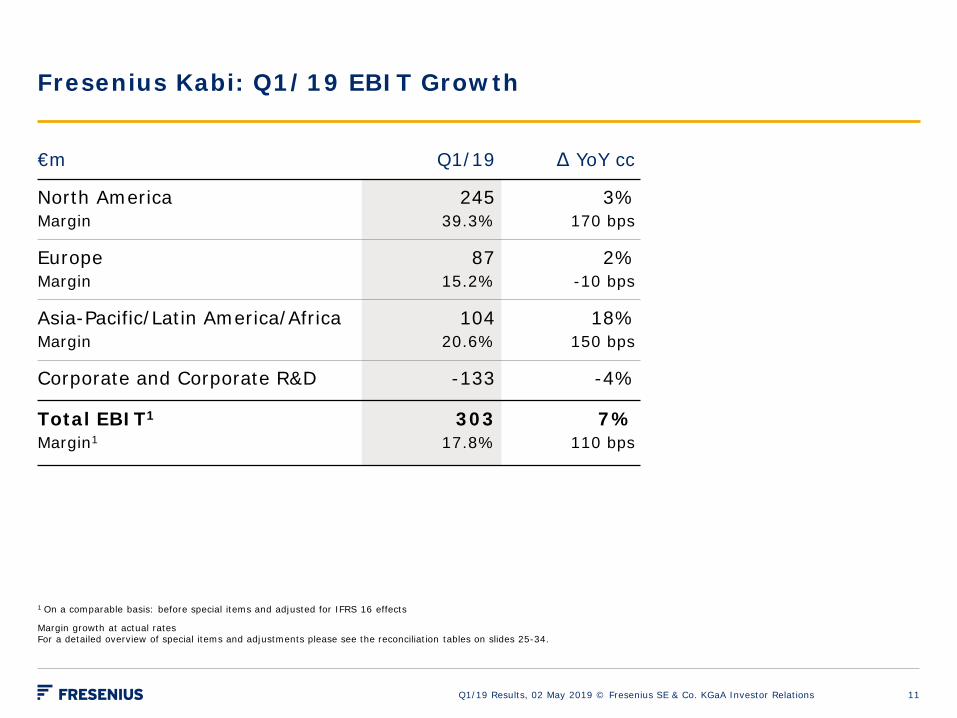
Fresenius Kabi: Q1/19 EBIT Growth
Q1/19 Results, 02 May 2019 © Fresenius SE & Co. KGaA Investor Relations
€m Q1/19 Δ YoY cc
North AmericaMargin
24539.3%
3%170 bps
EuropeMargin
8715.2%
2%-10 bps
Asia-Pacific/Latin America/AfricaMargin
10420.6%
18%150 bps
Corporate and Corporate R&D -133 -4%
Total EBIT1
Margin1303
17.8%7%
110 bps
1 On a comparable basis: before special items and adjusted for IFRS 16 effects
Margin growth at actual ratesFor a detailed overview of special items and adjustments please see the reconciliation tables on slides 25-34.
11
1 Organic sales growth
Helios Spain
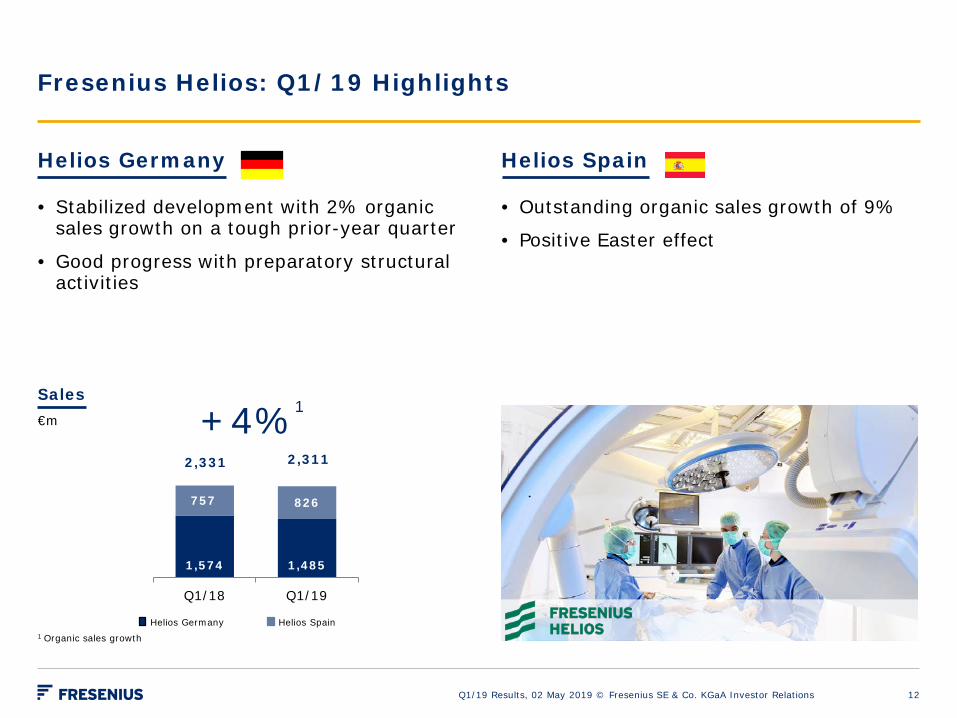
Fresenius Helios: Q1/19 Highlights
Helios Germany
• Stabilized development with 2% organic sales growth on a tough prior-year quarter
• Good progress with preparatory structural activities
Helios Spain
• Outstanding organic sales growth of 9%
• Positive Easter effect
Sales€m
Q1/19 Results, 02 May 2019 © Fresenius SE & Co. KGaA Investor Relations
1,574 1,485
757 826
Q1/18 Q1/19
Helios Germany
+4%1
2,3112,331
12
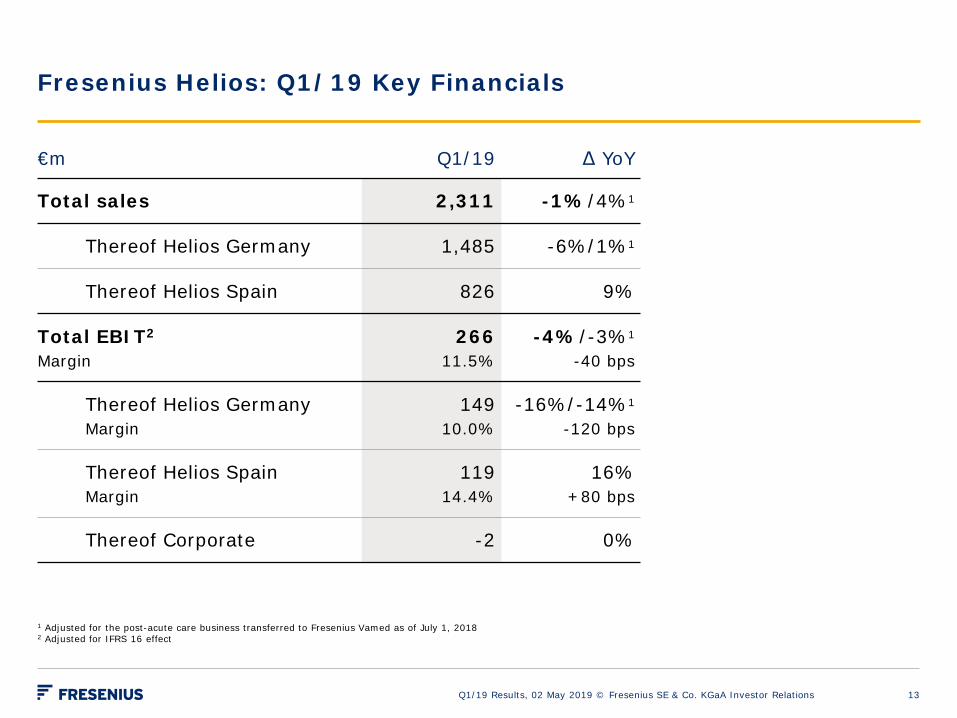
Fresenius Helios: Q1/19 Key Financials
Q1/19 Results, 02 May 2019 © Fresenius SE & Co. KGaA Investor Relations
€m Q1/19 Δ YoY
Total sales 2,311 -1%/4%1
Thereof Helios Germany 1,485 -6%/1%1
Thereof Helios Spain 826 9%
Total EBIT2
Margin266
11.5%-4%/-3%1
-40 bps
Thereof Helios GermanyMargin
14910.0%
-16%/-14%1
-120 bps
Thereof Helios SpainMargin
11914.4%
16%+80 bps
Thereof Corporate -2 0%
1 Adjusted for the post-acute care business transferred to Fresenius Vamed as of July 1, 20182 Adjusted for IFRS 16 effect
13
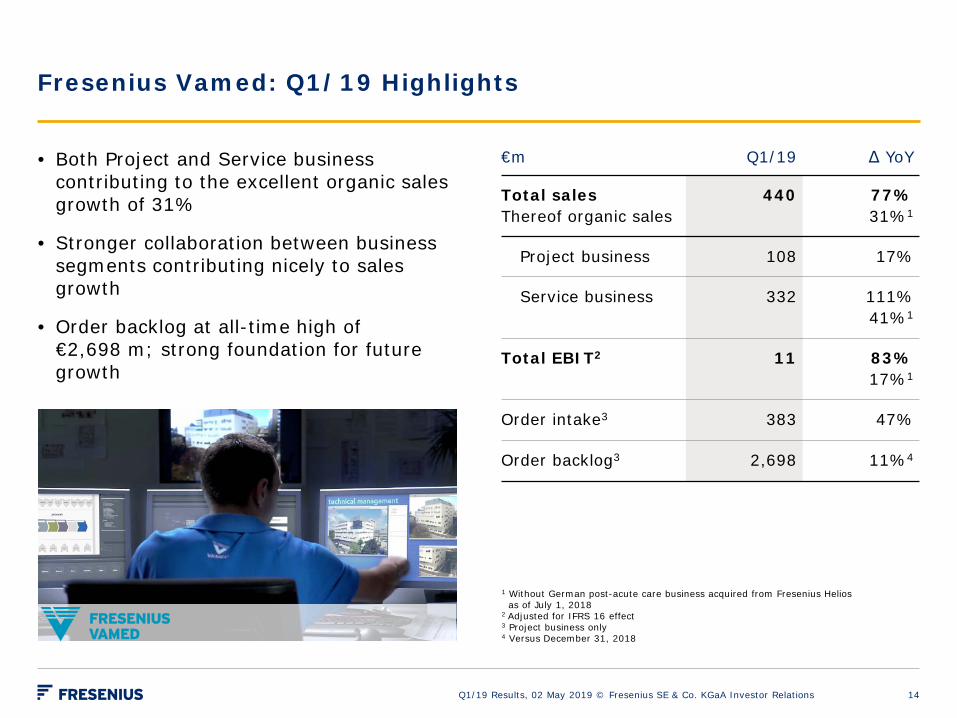
Fresenius Vamed: Q1/19 Highlights
1 Without German post-acute care business acquired from Fresenius Helios as of July 1, 2018
2 Adjusted for IFRS 16 effect 3 Project business only4 Versus December 31, 2018
• Both Project and Service business contributing to the excellent organic sales growth of 31%
• Stronger collaboration between business segments contributing nicely to sales growth
• Order backlog at all-time high of €2,698 m; strong foundation for future growth
€m Q1/19 Δ YoY
Total salesThereof organic sales
440 77%31%1
Project business 108 17%
Service business 332 111%41%1
Total EBIT2 11 83% 17%1
Order intake3 383 47%
Order backlog3 2,698 11%4
Q1/19 Results, 02 May 2019 © Fresenius SE & Co. KGaA Investor Relations 14
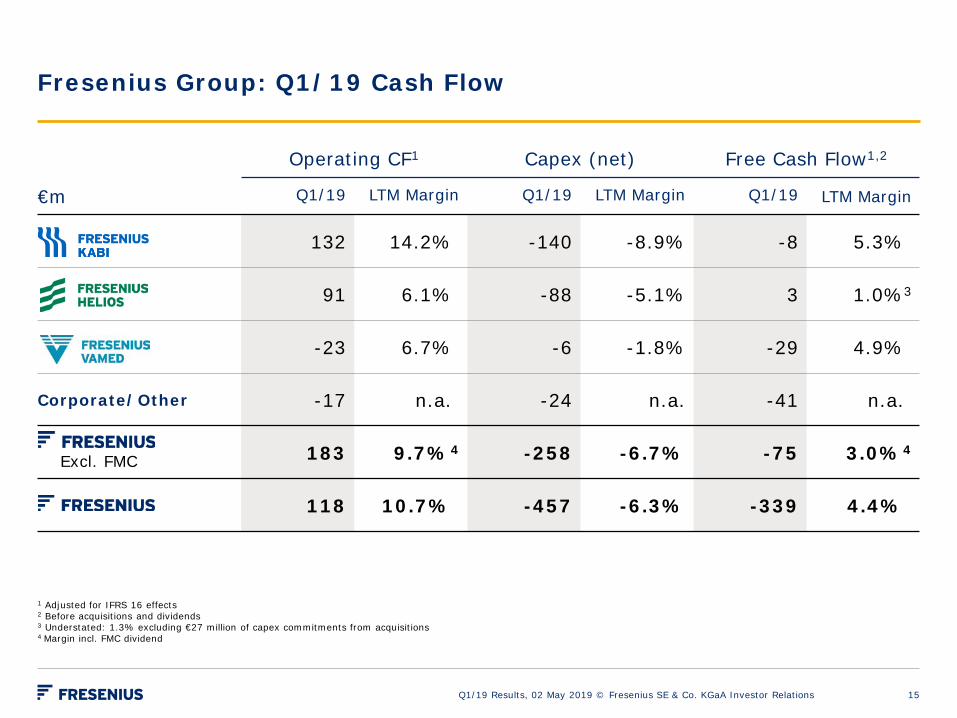
Fresenius Group: Q1/19 Cash Flow
Operating CF1 Capex (net) Free Cash Flow1,2
€m Q1/19 LTM Margin Q1/19 LTM Margin Q1/19 LTM Margin
132 14.2% -140 -8.9% -8 5.3%
91 6.1% -88 -5.1% 3 1.0%3
-23 6.7% -6 -1.8% -29 4.9%
Corporate/Other -17 n.a. -24 n.a. -41 n.a.
183 9.7%4 -258 -6.7% -75 3.0%4
118 10.7% -457 -6.3% -339 4.4%
1 Adjusted for IFRS 16 effects2 Before acquisitions and dividends3 Understated: 1.3% excluding €27 million of capex commitments from acquisitions 4 Margin incl. FMC dividend
Excl. FMC
Q1/19 Results, 02 May 2019 © Fresenius SE & Co. KGaA Investor Relations 15
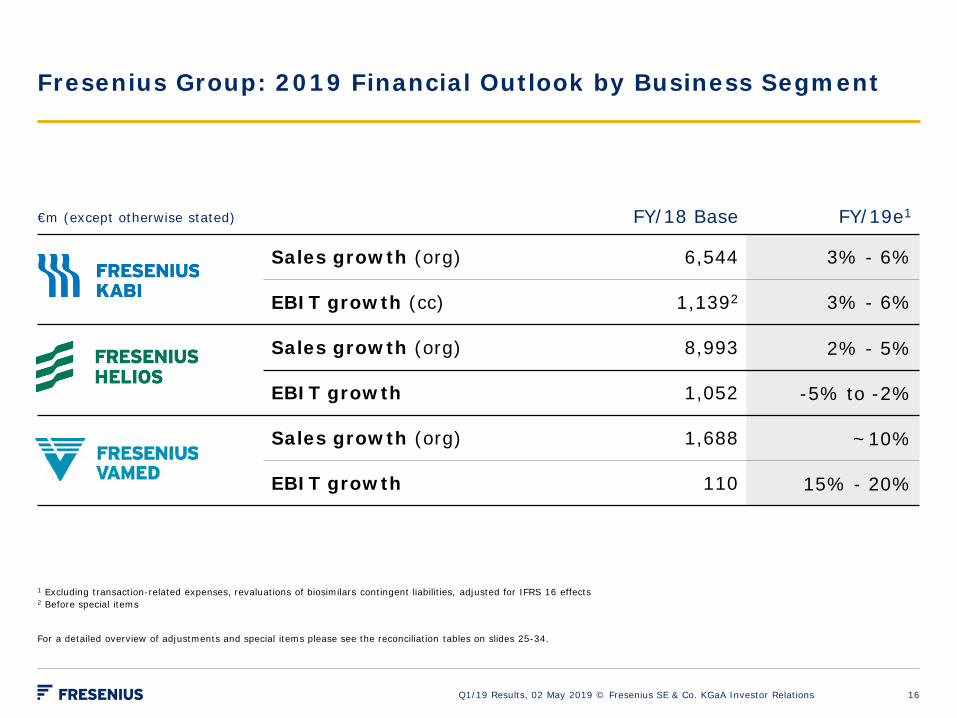
€m (except otherwise stated) FY/18 Base FY/19e1
Sales growth (org) 6,544 3% - 6%
EBIT growth (cc) 1,1392 3% - 6%
Sales growth (org) 8,993 2% - 5%
EBIT growth 1,052 -5% to -2%
Sales growth (org) 1,688 ~10%
EBIT growth 110 15% - 20%
1 Excluding transaction-related expenses, revaluations of biosimilars contingent liabilities, adjusted for IFRS 16 effects2 Before special items
For a detailed overview of adjustments and special items please see the reconciliation tables on slides 25-34.
Fresenius Group: 2019 Financial Outlook by Business Segment
Q1/19 Results, 02 May 2019 © Fresenius SE & Co. KGaA Investor Relations 16
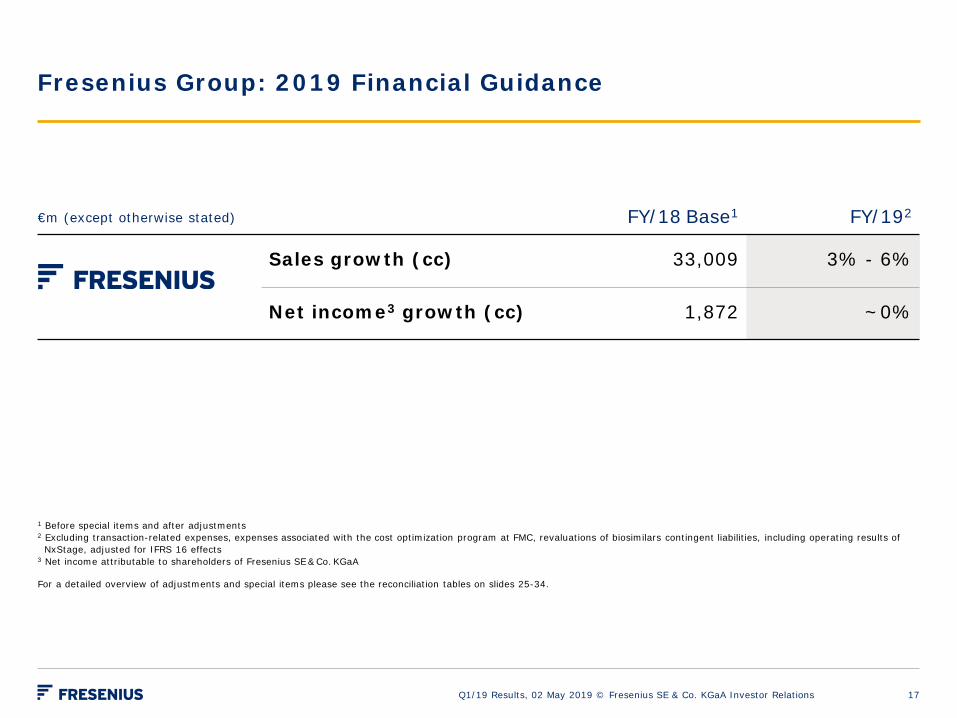
€m (except otherwise stated) FY/18 Base1 FY/192
Sales growth (cc) 33,009 3% - 6%
Net income3 growth (cc) 1,872 ~0%
Fresenius Group: 2019 Financial Guidance
1 Before special items and after adjustments2 Excluding transaction-related expenses, expenses associated with the cost optimization program at FMC, revaluations of biosimilars contingent liabilities, including operating results of
NxStage, adjusted for IFRS 16 effects3 Net income attributable to shareholders of Fresenius SE &Co.KGaA
For a detailed overview of adjustments and special items please see the reconciliation tables on slides 25-34.
Q1/19 Results, 02 May 2019 © Fresenius SE & Co. KGaA Investor Relations 17

Attachments
Q1/19 Results, 02 May 2019 © Fresenius SE & Co. KGaA Investor Relations 18
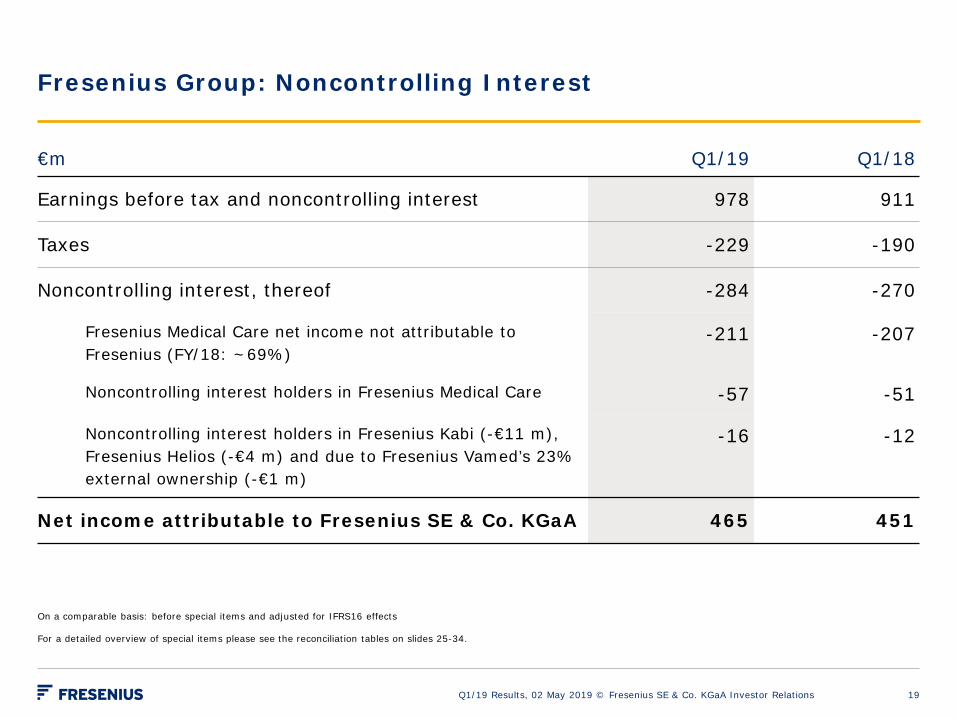
Fresenius Group: Noncontrolling Interest
Q1/19 Results, 02 May 2019 © Fresenius SE & Co. KGaA Investor Relations
€m Q1/19 Q1/18
Earnings before tax and noncontrolling interest 978 911
Taxes -229 -190
Noncontrolling interest, thereof -284 -270
Fresenius Medical Care net income not attributable to Fresenius (FY/18: ~69%)
-211 -207
Noncontrolling interest holders in Fresenius Medical Care -57 -51
Noncontrolling interest holders in Fresenius Kabi (-€11 m), Fresenius Helios (-€4 m) and due to Fresenius Vamed’s 23% external ownership (-€1 m)
-16 -12
Net income attributable to Fresenius SE & Co. KGaA 465 451
On a comparable basis: before special items and adjusted for IFRS16 effects
For a detailed overview of special items please see the reconciliation tables on slides 25-34.
19
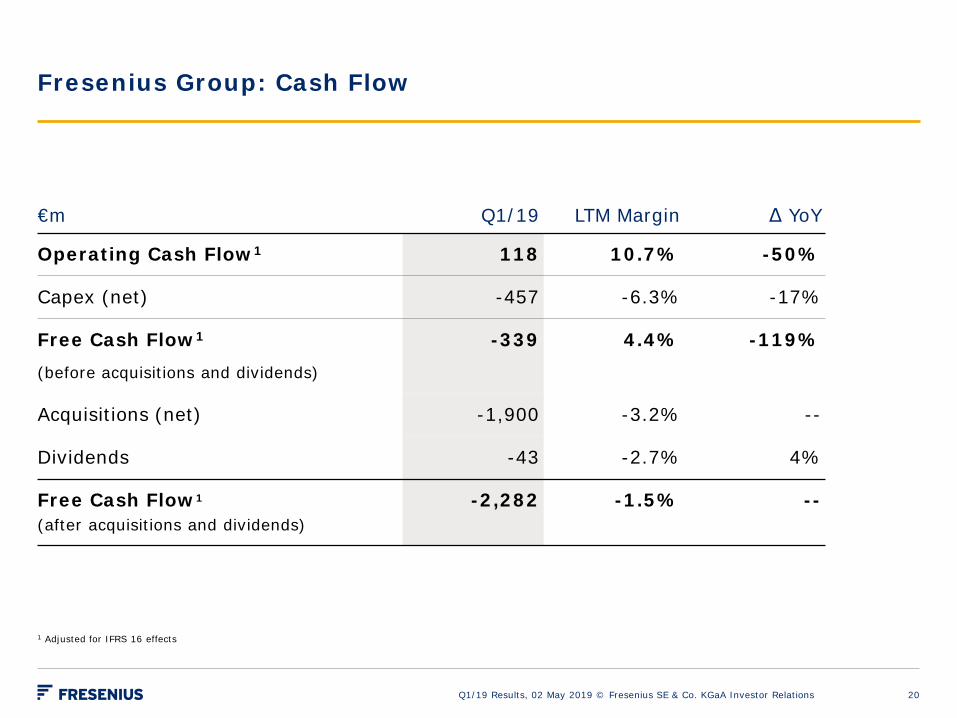
Fresenius Group: Cash Flow
Q1/19 Results, 02 May 2019 © Fresenius SE & Co. KGaA Investor Relations
€m Q1/19 LTM Margin Δ YoY
Operating Cash Flow1 118 10.7% -50%
Capex (net) -457 -6.3% -17%
Free Cash Flow1
(before acquisitions and dividends)
-339 4.4% -119%
Acquisitions (net) -1,900 -3.2% --
Dividends -43 -2.7% 4%
Free Cash Flow1
(after acquisitions and dividends) -2,282 -1.5% --
20
1 Adjusted for IFRS 16 effects
2.592.67
2.55 2.53
3.22
2.65
2.33
2.98
3.00 2.97
2.84
2.98
3.022.96 2.91
3.09
2,00
2,50
3,00
3,50
4,00
2010 2011 2012 2013 2014 2015 2016 Q1 Q2 Q3 Q4 Q1 Q2 Q3 Q4 Q1
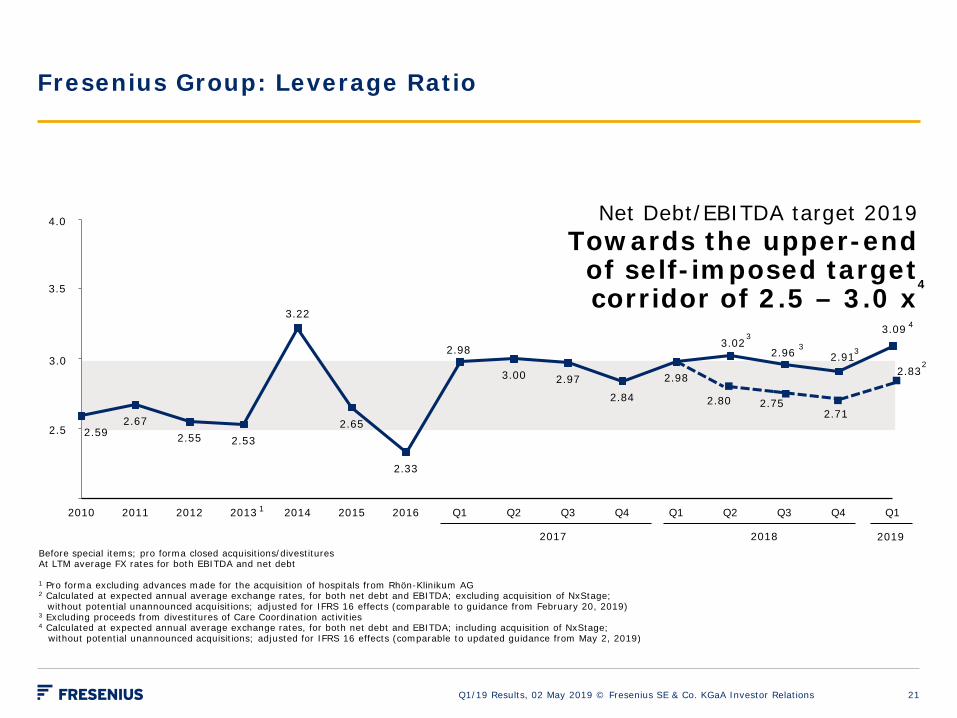
Before special items; pro forma closed acquisitions/divestituresAt LTM average FX rates for both EBITDA and net debt
1 Pro forma excluding advances made for the acquisition of hospitals from Rhön-Klinikum AG2 Calculated at expected annual average exchange rates, for both net debt and EBITDA; excluding acquisition of NxStage;
without potential unannounced acquisitions; adjusted for IFRS 16 effects (comparable to guidance from February 20, 2019)3 Excluding proceeds from divestitures of Care Coordination activities4 Calculated at expected annual average exchange rates, for both net debt and EBITDA; including acquisition of NxStage;
without potential unannounced acquisitions; adjusted for IFRS 16 effects (comparable to updated guidance from May 2, 2019)
Fresenius Group: Leverage Ratio
Q1/19 Results, 02 May 2019 © Fresenius SE & Co. KGaA Investor Relations
Net Debt/EBITDA target 2019Towards the upper-end of self-imposed target corridor of 2.5 – 3.0 x
1
4.0
3.5
3.0
2.5
4
2017 2018
2.752.71
33 3
2.80
2019
21
2.83
4
2
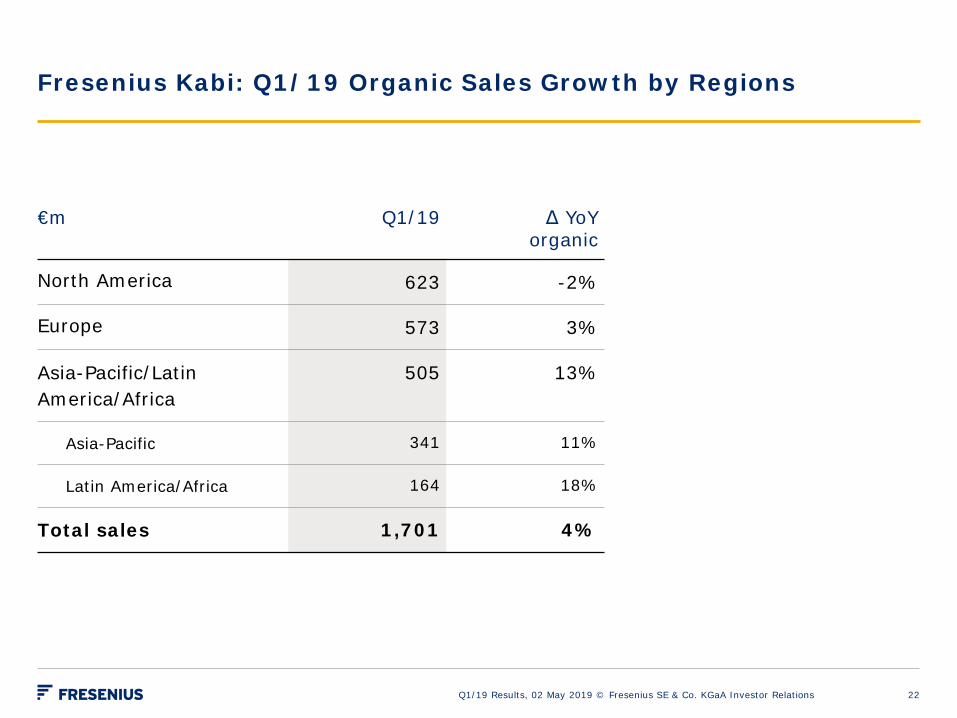
Fresenius Kabi: Q1/19 Organic Sales Growth by Regions
€m Q1/19 Δ YoYorganic
North America 623 -2%
Europe 573 3%
Asia-Pacific/Latin America/Africa
505 13%
Asia-Pacific 341 11%
Latin America/Africa 164 18%
Total sales 1,701 4%
Q1/19 Results, 02 May 2019 © Fresenius SE & Co. KGaA Investor Relations 22
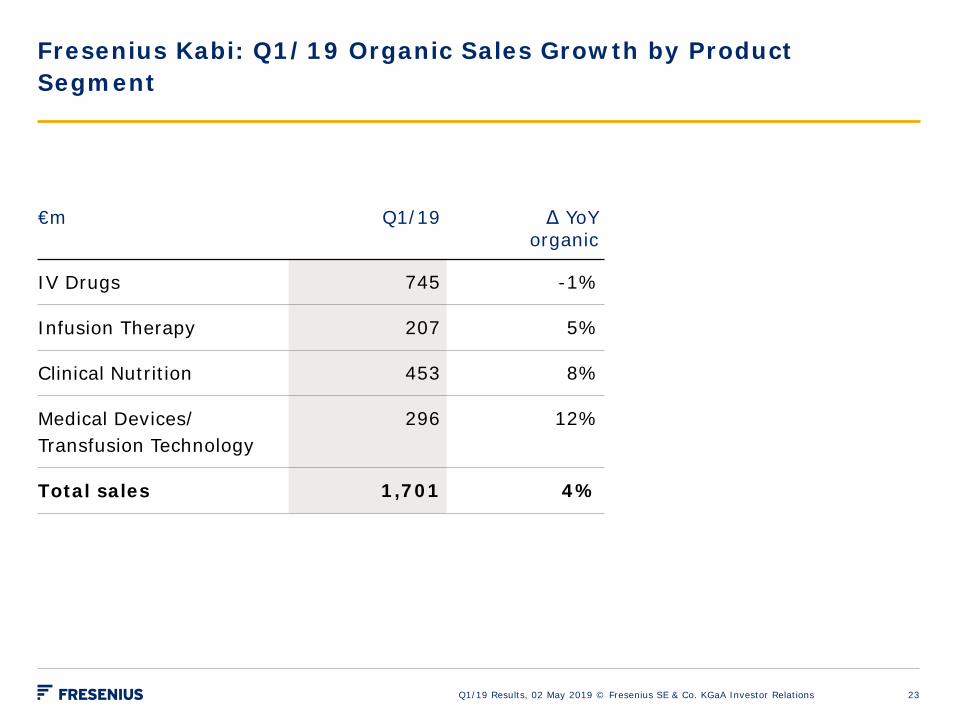
Fresenius Kabi: Q1/19 Organic Sales Growth by Product Segment
€m Q1/19 Δ YoYorganic
IV Drugs 745 -1%
Infusion Therapy 207 5%
Clinical Nutrition 453 8%
Medical Devices/Transfusion Technology
296 12%
Total sales 1,701 4%
23Q1/19 Results, 02 May 2019 © Fresenius SE & Co. KGaA Investor Relations
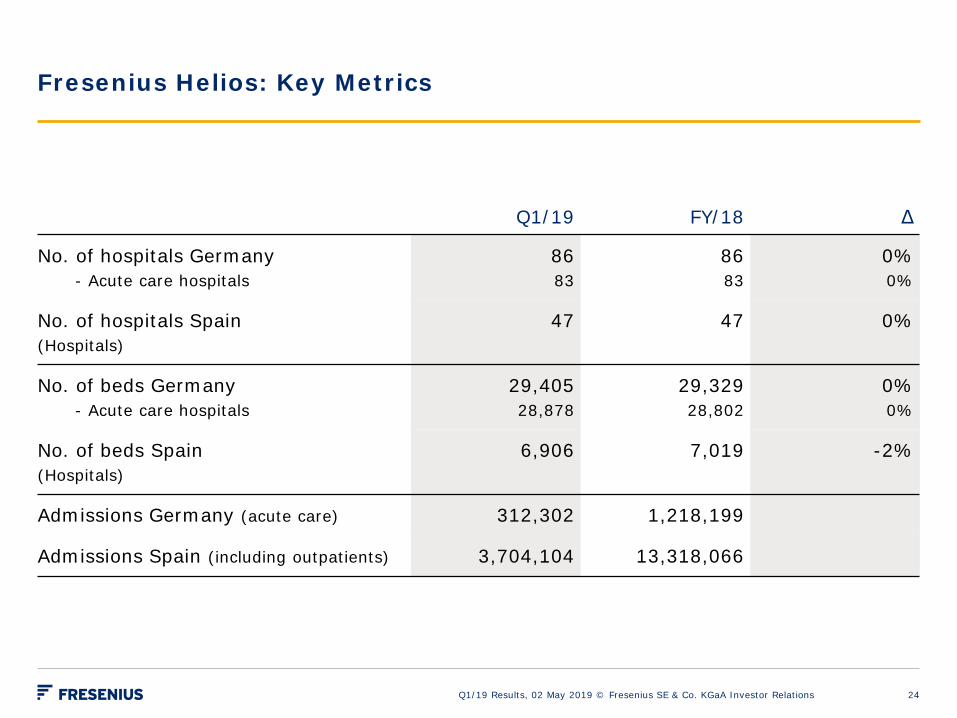
Fresenius Helios: Key Metrics
Q1/19 Results, 02 May 2019 © Fresenius SE & Co. KGaA Investor Relations
Q1/19 FY/18 Δ
No. of hospitals Germany- Acute care hospitals
8683
8683
0%0%
No. of hospitals Spain(Hospitals)
47 47 0%
No. of beds Germany- Acute care hospitals
29,405 28,878
29,329 28,802
0%0%
No. of beds Spain(Hospitals)
6,906 7,019 -2%
Admissions Germany (acute care) 312,302 1,218,199
Admissions Spain (including outpatients) 3,704,104 13,318,066
24
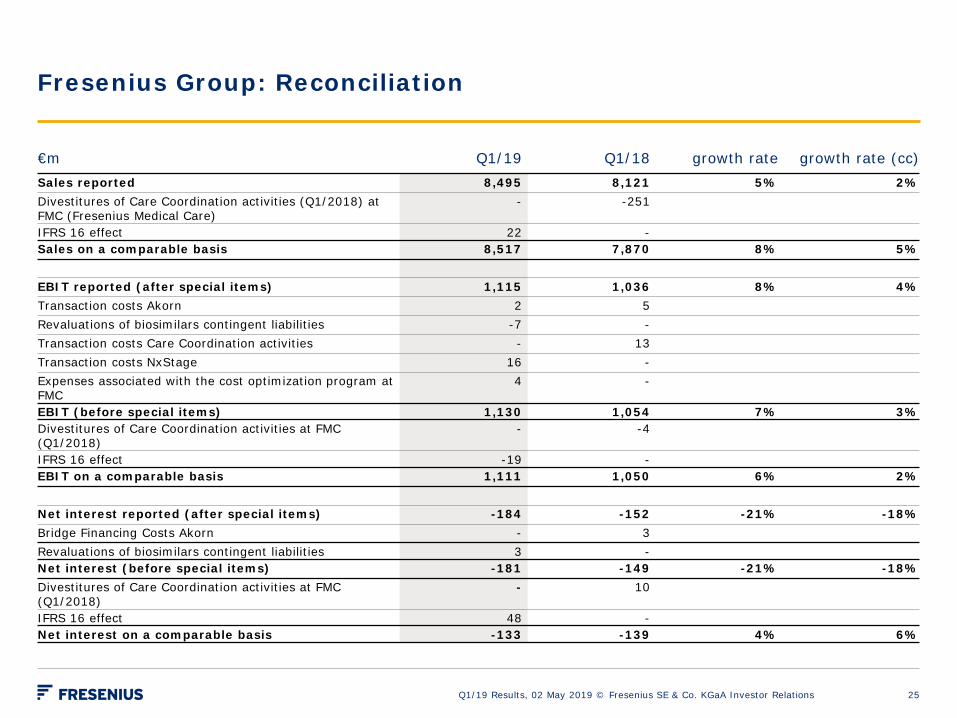
Fresenius Group: Reconciliation
Q1/19 Results, 02 May 2019 © Fresenius SE & Co. KGaA Investor Relations
€m Q1/19 Q1/18 growth rate growth rate (cc)Sales reported 8,495 8,121 5% 2%Divestitures of Care Coordination activities (Q1/2018) at FMC (Fresenius Medical Care)
- -251
IFRS 16 effect 22 -Sales on a comparable basis 8,517 7,870 8% 5%
EBIT reported (after special items) 1,115 1,036 8% 4%Transaction costs Akorn 2 5Revaluations of biosimilars contingent liabilities -7 -Transaction costs Care Coordination activities - 13Transaction costs NxStage 16 -Expenses associated with the cost optimization program at FMC
4 -
EBIT (before special items) 1,130 1,054 7% 3%Divestitures of Care Coordination activities at FMC (Q1/2018)
- -4
IFRS 16 effect -19 -EBIT on a comparable basis 1,111 1,050 6% 2%
Net interest reported (after special items) -184 -152 -21% -18%Bridge Financing Costs Akorn - 3Revaluations of biosimilars contingent liabilities 3 -Net interest (before special items) -181 -149 -21% -18%Divestitures of Care Coordination activities at FMC (Q1/2018)
- 10
IFRS 16 effect 48 -Net interest on a comparable basis -133 -139 4% 6%
25
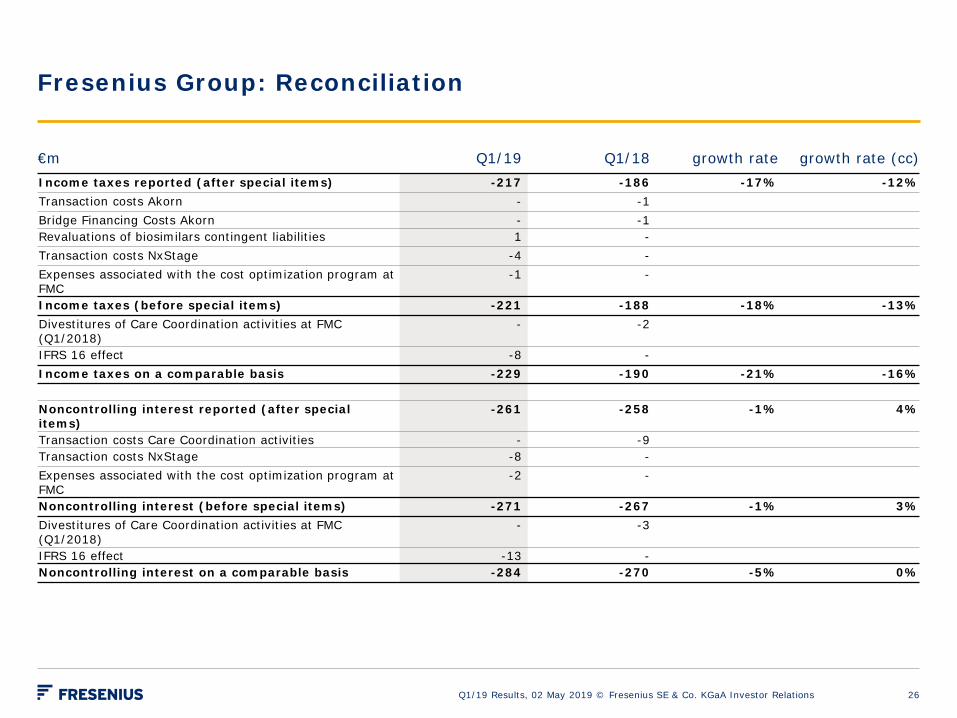
Fresenius Group: Reconciliation
Q1/19 Results, 02 May 2019 © Fresenius SE & Co. KGaA Investor Relations
€m Q1/19 Q1/18 growth rate growth rate (cc)Income taxes reported (after special items) -217 -186 -17% -12%Transaction costs Akorn - -1Bridge Financing Costs Akorn - -1Revaluations of biosimilars contingent liabilities 1 -Transaction costs NxStage -4 -Expenses associated with the cost optimization program at FMC
-1 -
Income taxes (before special items) -221 -188 -18% -13%Divestitures of Care Coordination activities at FMC (Q1/2018)
- -2
IFRS 16 effect -8 -Income taxes on a comparable basis -229 -190 -21% -16%
Noncontrolling interest reported (after special items)
-261 -258 -1% 4%
Transaction costs Care Coordination activities - -9Transaction costs NxStage -8 -Expenses associated with the cost optimization program at FMC
-2 -
Noncontrolling interest (before special items) -271 -267 -1% 3%Divestitures of Care Coordination activities at FMC (Q1/2018)
- -3
IFRS 16 effect -13 -Noncontrolling interest on a comparable basis -284 -270 -5% 0%
26
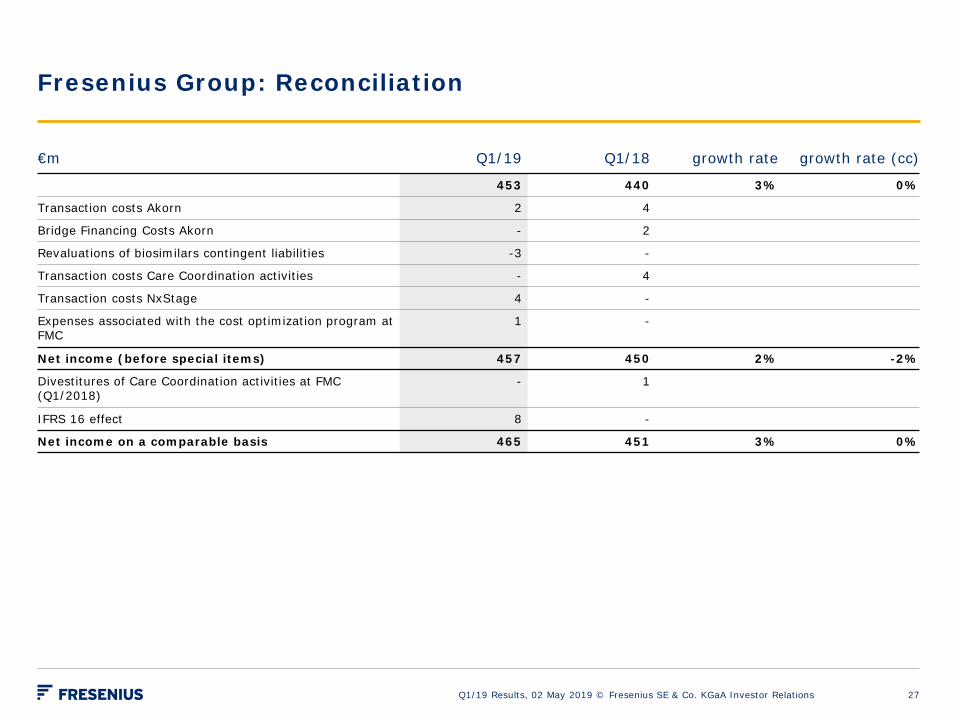
Fresenius Group: Reconciliation
Q1/19 Results, 02 May 2019 © Fresenius SE & Co. KGaA Investor Relations
€m Q1/19 Q1/18 growth rate growth rate (cc)
453 440 3% 0%
Transaction costs Akorn 2 4
Bridge Financing Costs Akorn - 2
Revaluations of biosimilars contingent liabilities -3 -
Transaction costs Care Coordination activities - 4
Transaction costs NxStage 4 -
Expenses associated with the cost optimization program at FMC
1 -
Net income (before special items) 457 450 2% -2%
Divestitures of Care Coordination activities at FMC (Q1/2018)
- 1
IFRS 16 effect 8 -
Net income on a comparable basis 465 451 3% 0%
27
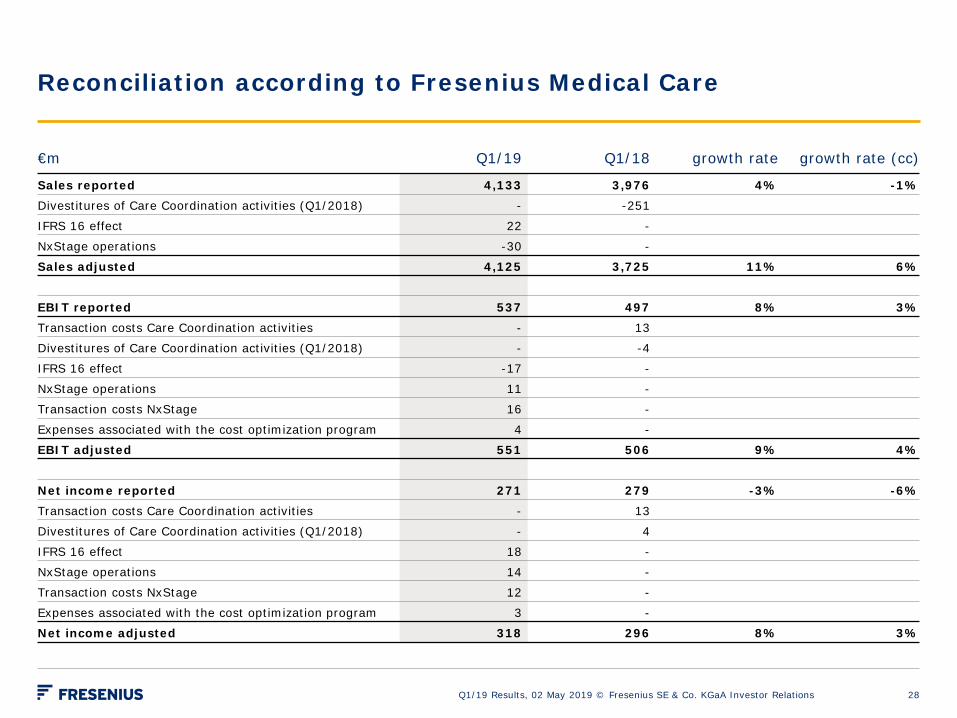
Reconciliation according to Fresenius Medical Care
Q1/19 Results, 02 May 2019 © Fresenius SE & Co. KGaA Investor Relations
€m Q1/19 Q1/18 growth rate growth rate (cc)
Sales reported 4,133 3,976 4% -1%Divestitures of Care Coordination activities (Q1/2018) - -251
IFRS 16 effect 22 -
NxStage operations -30 -
Sales adjusted 4,125 3,725 11% 6%
EBIT reported 537 497 8% 3%Transaction costs Care Coordination activities - 13
Divestitures of Care Coordination activities (Q1/2018) - -4
IFRS 16 effect -17 -
NxStage operations 11 -
Transaction costs NxStage 16 -
Expenses associated with the cost optimization program 4 -
EBIT adjusted 551 506 9% 4%
Net income reported 271 279 -3% -6%Transaction costs Care Coordination activities - 13
Divestitures of Care Coordination activities (Q1/2018) - 4
IFRS 16 effect 18 -
NxStage operations 14 -
Transaction costs NxStage 12 -
Expenses associated with the cost optimization program 3 -
Net income adjusted 318 296 8% 3%
28
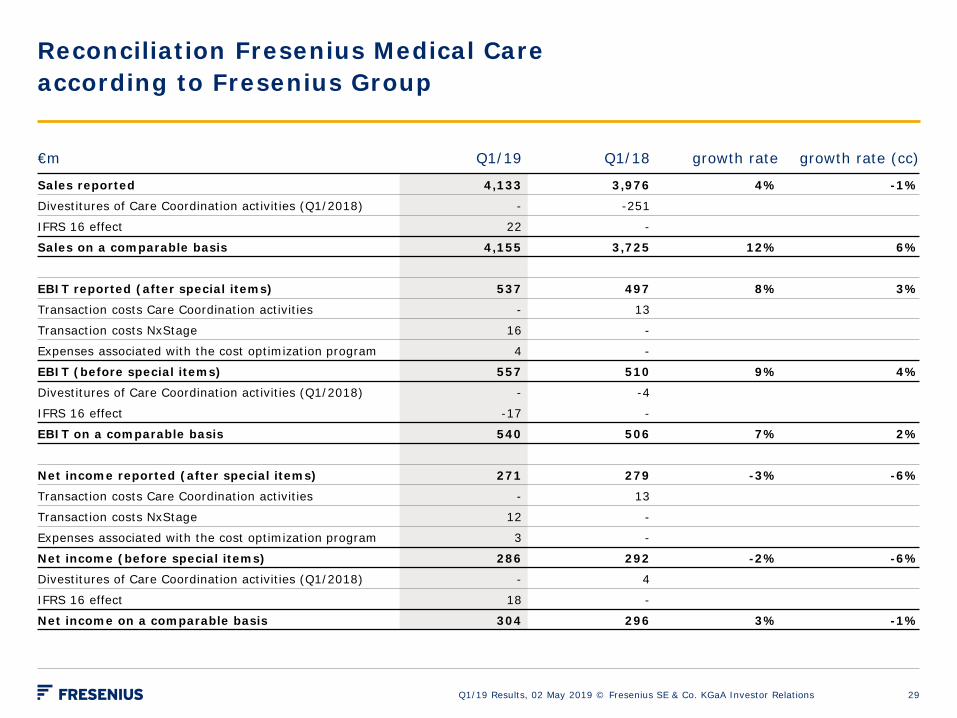
Reconciliation Fresenius Medical Care according to Fresenius Group
Q1/19 Results, 02 May 2019 © Fresenius SE & Co. KGaA Investor Relations
€m Q1/19 Q1/18 growth rate growth rate (cc)
Sales reported 4,133 3,976 4% -1%
Divestitures of Care Coordination activities (Q1/2018) - -251
IFRS 16 effect 22 -
Sales on a comparable basis 4,155 3,725 12% 6%
EBIT reported (after special items) 537 497 8% 3%
Transaction costs Care Coordination activities - 13
Transaction costs NxStage 16 -
Expenses associated with the cost optimization program 4 -
EBIT (before special items) 557 510 9% 4%
Divestitures of Care Coordination activities (Q1/2018) - -4
IFRS 16 effect -17 -
EBIT on a comparable basis 540 506 7% 2%
Net income reported (after special items) 271 279 -3% -6%
Transaction costs Care Coordination activities - 13
Transaction costs NxStage 12 -
Expenses associated with the cost optimization program 3 -
Net income (before special items) 286 292 -2% -6%
Divestitures of Care Coordination activities (Q1/2018) - 4
IFRS 16 effect 18 -
Net income on a comparable basis 304 296 3% -1%
29
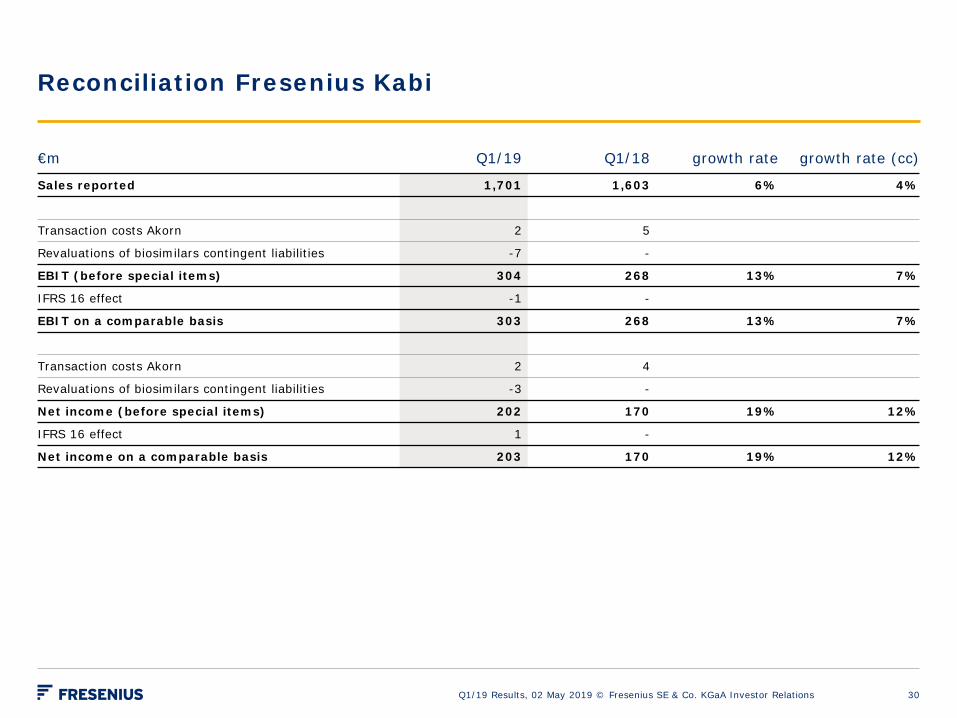
Reconciliation Fresenius Kabi
Q1/19 Results, 02 May 2019 © Fresenius SE & Co. KGaA Investor Relations
€m Q1/19 Q1/18 growth rate growth rate (cc)
Sales reported 1,701 1,603 6% 4%
Transaction costs Akorn 2 5
Revaluations of biosimilars contingent liabilities -7 -
EBIT (before special items) 304 268 13% 7%
IFRS 16 effect -1 -
EBIT on a comparable basis 303 268 13% 7%
Transaction costs Akorn 2 4
Revaluations of biosimilars contingent liabilities -3 -
Net income (before special items) 202 170 19% 12%
IFRS 16 effect 1 -
Net income on a comparable basis 203 170 19% 12%
30
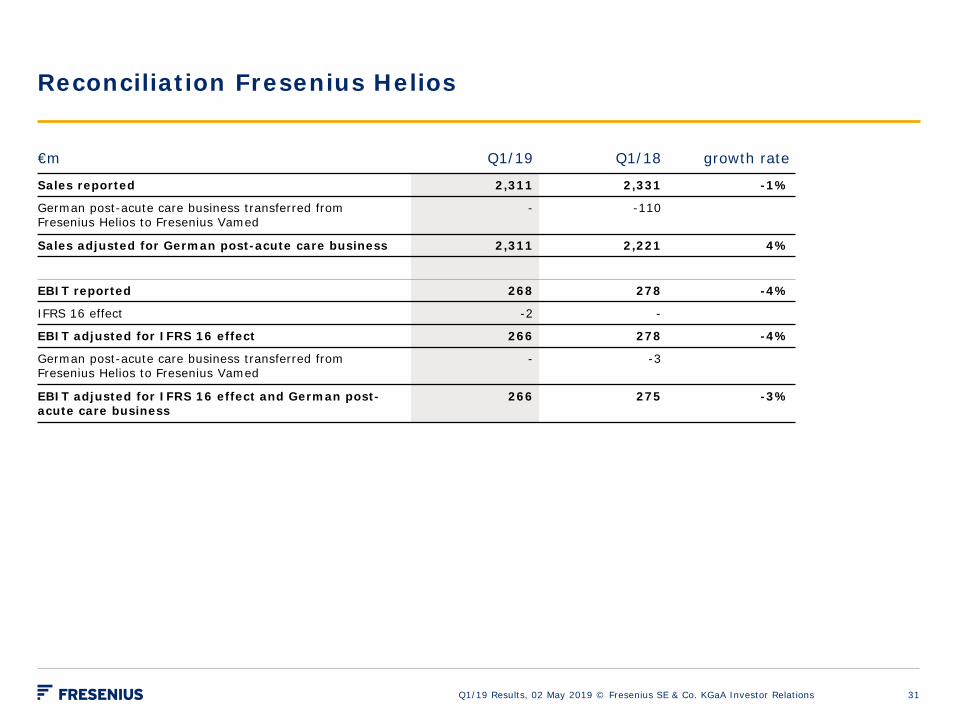
Reconciliation Fresenius Helios
Q1/19 Results, 02 May 2019 © Fresenius SE & Co. KGaA Investor Relations
€m Q1/19 Q1/18 growth rate
Sales reported 2,311 2,331 -1%
German post-acute care business transferred from Fresenius Helios to Fresenius Vamed
- -110
Sales adjusted for German post-acute care business 2,311 2,221 4%
EBIT reported 268 278 -4%
IFRS 16 effect -2 -
EBIT adjusted for IFRS 16 effect 266 278 -4%
German post-acute care business transferred from Fresenius Helios to Fresenius Vamed
- -3
EBIT adjusted for IFRS 16 effect and German post-acute care business
266 275 -3%
31

Reconciliation Fresenius Vamed
Q1/19 Results, 02 May 2019 © Fresenius SE & Co. KGaA Investor Relations
€m Q1/19 Q1/18 growth rate
Sales reported 440 249 77%
German post-acute care business acquired from Fresenius Helios
-110 -
Sales adjusted for German post-acute care business 330 249 33%
EBIT reported 12 6 100%
IFRS 16 effect -1 -
EBIT adjusted for IFRS 16 effect 11 6 83%
German post-acute care business acquired from Fresenius Helios
-4 -
EBIT adjusted for IFRS 16 effect and German post-acute care business
7 6 17%
32

IFRS 16 effect on Group P&L
Q1/19 Results, 02 May 2019 © Fresenius SE & Co. KGaA Investor Relations
€m
Q1/19 before special items adjusted for
IFRS 16 effect IFRS 16 effect
Q1/19 before special itemsaccording to
IFRS 16
Sales 8,517 -22 8,495
EBITDA 1,481 220 1,701
Depreciation and amortization -370 -201 -571
EBIT 1,111 19 1,130
Net interest -133 -48 -181
Income taxes -229 8 -221
Noncontrolling interest -284 13 -271
Net income1 465 -8 457
33
1 Net income attributable to shareholders of Fresenius SE & Co. KGaA

IFRS 16 effect on Group Balance Sheet and Cash Flow
Q1/19 Results, 02 May 2019 © Fresenius SE & Co. KGaA Investor Relations
Balance Sheet
€m
Q1/19adjusted for
IFRS 16 effect IFRS 16 effect
Q1/19according to
IFRS 16
Right-of-use-assets 1901 5,669 5,859Lease liabilities 4142 5,836 6,250Equity 25,997 -167 25,830Total assets 59,316 5,669 64,985
34
1 Reclassification from machinery, equipment and rental equipment under capital leases as of December 31, 20182 Reclassifications from Capital lease obligations and other liabilities as of December 31, 2018
Cash Flow
€m
Q1/19adjusted for
IFRS 16 effect IFRS 16 effect
Q1/19according to
IFRS 16
Operating cash flow 118 171 289Cash flow before acquisitions and dividends -339 171 -168
Free cash flow -2,282 171 -2,111Cash provided by/used for financing activities 1,083 -171 912

Financial Calendar / Contact
Financial Calendar 17 May 2019 Annual General Meeting
30 July 2019 Results Q2/19
29 October 2019 Results Q3/19
Please note that these dates could be subject to change.
ContactInvestor RelationsFresenius SE & Co. KGaAphone: +49 6172 608-2485e-mail: [email protected] further information and current news: www.fresenius.com
Follow us on Twitter www.twitter.com/fresenius_irand LinkedIn: www.linkedin.com/company/fresenius-investor-relations
Q1/19 Results, 02 May 2019 © Fresenius SE & Co. KGaA Investor Relations 35
Top Related