


Languages
Pages
Legal


Confederated Salish and Kootenai Tribes Sustainable Economic Development Study:
A Profile of the Flathead Reservation Economy and Tribal Member Job
and Education Needs
By the Confederated Salish and Kootenai Tribes Economic Development Office, the University of
Montana Bureau of Business and Economic Research, and the Sustainable Economic Development
Project Partners
September 2014
Cover Photo: The Mission Mountains on the Flathead Reservation, by Mr. Mark Mesenko.
1
Acknowledgements
A large group of people worked diligently to produce this report. They all deserve recognition and
thanks! What follows is a modest attempt to bring some of these people to the attention of the readers
of this study.
First, thanks must go to the members of the Confederated Salish and Kootenai Tribes (CSKT) who
completed the questionnaires that provided vital information for this study. Their efforts were
thoughtful, insightful, and thorough. Tribal members also contributed significantly to the study and
questionnaire design by participating in extensive public meetings and survey pre-tests.
Mr. Ron Trahan, Chairman of CSKT; Ms. Carole Lankford, Vice-Chair; Mr. James "Bing" Matt, Secretary;
Mr. Len TwoTeeth, Treasurer; and Tribal Council Members Mr. Lloyd Irvine, Mr. Terry L. Pitts, Mr.
Leonard Gray, Mr. Vernon Finley, Ms. Patty Stevens, and Ms. Shelly Fyant all provided important
guidance for this project.
The Salish/Pend d'Oreilles Culture Committee and the Kootenai Culture Committee gave insightful input
into study and questionnaire design, and both committees were helpful in gaining Tribal membership
support for this project. CSKT Tribal elders were consulted during each phase of this project, and they
provided key advice on the implementation of this study.
The CSKT Economic Development Office, under the initial leadership of Mr. Joe Dupuis, supervised all
aspects of this project. Rebecca Hendrickx, Project Assistant, was invaluable in this effort.
The CSKT Sustainable Economic Development Project Partners/Steering Committee did the lion’s share
of the study and questionnaire design review, and reviewed the drafts of this report. Their endurance,
patience, and wisdom were instrumental to the project’s success. Project Partners include Vern
Clairmont and Ruth Swaney (CSKT Finance Office), Arlene Templer and Kelly Whitworth (CSKT DHRD),
Debbie Krantz (Lake County Job Service), Steve Clairmont (Sovereign Leasing and Financing, Inc.), Marie
Mahugh (Lake County Community Development Corporation), Constance Morigeau (CSKT Social
Services), Amita Patel Greer (Montana Community Development Corporation), Rene Joachim (CSKT
Personnel), Jim Durglo (CSKT Forestry), Heather Sobrepena-George (Montana Indian Country Economic
Development Program), Keith Rennie (SKC), Jennifer Finley (Kicking Horse Job Corps Center), and Penny
Kipp (CSKT Education), and Carolee Wenderoth (CSKT Lands).
2
Finally, recognition must be made of the hard and detail-oriented work done by Ms. Janet Stevens and
Ms. Ramona Alspaugh of the University of Montana’s Bureau of Business and Economic Research
(BBER). They are true survey research professionals. Dr. Paul Polzin and Dr. Bryce Ward, both of BBER,
also contributed economic analysis reported in Chapter 1: Flathead Reservation Economic Profile. The
words and ideas of Dr. Tom Power, Professor Emeritus of Economics at University of Montana, also form
the basis of parts of Chapter 1.
Janet Camel, Project Director and Editor
Economic Development Office, Confederated Salish and Kootenai Tribes
John Baldridge, Principal Data Analyst and Author
Bureau of Business and Economic Research, University of Montana-Missoula
September 2014

3
Table of Contents
Acknowledgements ....................................................................................................................................... 1
List of Tables and Figures .............................................................................................................................. 5
Executive Summary ....................................................................................................................................... 7
Chapter 1: Flathead Reservation Economic Profile 2014 .......................................................................... 12
Introduction ................................................................................................................................................ 12
Structure of this Report .............................................................................................................................. 13
Flathead Reservation Economic Profile ...................................................................................................... 13
Regional Context of the Flathead Reservation Economy ........................................................................... 17
Population Trends ....................................................................................................................................... 17
Narrative Description of the Flathead Reservation Economy .................................................................... 17
Chapter 2: Tribal Member Employment Status, Occupations, Education and Training Experience ....... 21
Employment Status ..................................................................................................................................... 21
Unemployment Rate ................................................................................................................................... 21
Average Weekly Hours Worked .................................................................................................................. 22
Employment by Industry ............................................................................................................................. 22
Private Employers by Industry .................................................................................................................... 23
Tribal Member Occupations ....................................................................................................................... 23
Entrepreneurship ........................................................................................................................................ 24
Education Attainment ................................................................................................................................. 25
Professional Licenses and Certifications ..................................................................................................... 26
Chapter 3: Tribal Member Job, Education and Training Interests ............................................................ 28
New Job Interest ......................................................................................................................................... 28
Commuting to Work ................................................................................................................................... 29
Job Interest by Industry .............................................................................................................................. 30
Job Interest by Occupation ......................................................................................................................... 30
Interest in Employers Other Than CSKT ...................................................................................................... 31
Education and Training Interests ................................................................................................................ 31
Education or Training Programs of Most Interest ...................................................................................... 32
General Job Skills and Job Seeking Skills Training Sought ........................................................................... 33
Interest in Job Training Offered by CSKT .................................................................................................... 34
4
Chapter 4: Barriers to Tribal Member Employment or Job Training ........................................................ 35
Barriers that Impede Employment, Job Training, or Education.................................................................. 35
Most Important Barrier to Employment, Job Training, or Education ......................................................... 36
Telephone and Internet Access .................................................................................................................. 37
Travel to Work or School ............................................................................................................................ 38
Chapter 5: Gaps in the Tribal Workforce ................................................................................................... 39
Unemployed or Not in the Labor Force: Ages 18-60 .................................................................................. 39
Tribal Members Near or Below Poverty ..................................................................................................... 43
Young Adult Tribal Members ...................................................................................................................... 49
Female Tribal Members .............................................................................................................................. 51
Chapter 6: Business Owner/ Entrepreneurial Concerns and Training Needs .......................................... 55
Current or Prospective Business Owners .................................................................................................... 55
Training Interests ........................................................................................................................................ 56
Leasing Needs ............................................................................................................................................. 56
Interest Level in Starting a New Business ................................................................................................... 56
Most Important Barrier to a New or Expanding Business .......................................................................... 57
CSKT’s Strengths in Assisting New or Expanding Businesses ...................................................................... 57
Possible Improvements in CSKT’s Efforts to Assist New or Expanding Businesses .................................... 57
Characteristics of Tribal Members’ Businesses........................................................................................... 58
Chapter 7: Job Training Program Recommendations ............................................................................... 61
Recommended Target Occupations for Training ........................................................................................ 61
Recommended Job Training Program Characteristics ................................................................................ 63
Recommendations Focused on Business Owners or Entrepreneurs .................................................... 63
Appendix 1: Job and Training Needs Survey Methodological Summary ................................................... I1
Appendix 2: Job and Training Needs Survey Questionnaire and Top-Line Results.................................. II1
Appendix 3: Entrepreneur/Business Owner Survey Methodological Summary ..................................... III1
Appendix 4: Entrepreneur/Business Owner Survey Questionnaire and Top-Line Results ..................... IV1

5
List of Tables and Figures Table 1: Flathead Reservation Profile ......................................................................................................... 14
Table 2: Employed American Indian Population ......................................................................................... 15
Table 3: Western Montana Growth Jobs .................................................................................................... 16
Table 4: Private or Non-Profit Employers ................................................................................................... 23
Table 5: Occupations ................................................................................................................................... 23
Table 6: Detailed Education Attainment ..................................................................................................... 25
Table 7: Licenses or Certifications .............................................................................................................. 26
Table 8: General Job Skills ........................................................................................................................... 27
Table 9: Job Seeking Skills ........................................................................................................................... 27
Table 10: Preferred Work Schedule ............................................................................................................ 28
Table 11: Job Interests by Industry ............................................................................................................. 30
Table 12: Occupation Interests ................................................................................................................... 30
Table 13: Type of Training Sought .............................................................................................................. 31
Table 14: Training Program of Most Interest .............................................................................................. 32
Table 15: Interest in General Job Skills Training ......................................................................................... 33
Table 16: Interest in Job Seeking Skills Training ......................................................................................... 33
Table 17: Barriers to Employment or Education ......................................................................................... 35
Table 18: Specific Barriers ........................................................................................................................... 36
Table 19: Most Important Barrier ............................................................................................................... 36
Table 20: Perceived Tribal Transit Problems .............................................................................................. 38
Table 21: Occupations of Unemployed Tribal Members ............................................................................ 39
Table 22: Occupation Interests of the Unemployed ................................................................................... 41
Table 23: Education Interests of the Unemployed ..................................................................................... 41
Table 24: Most Important Job Barrier to the Unemployed ........................................................................ 42
Table 25: Occupations of Low-Income Tribal Members ............................................................................. 44
Table 26: Occupation Interests of those Below Poverty............................................................................. 46
Table 27: Education Interests of those Near or Below the Poverty Treshold ............................................ 47
Table 28: Most Important Job Barrier to those Below the Poverty Threshold........................................... 48
Table 29: Occupations of Young Adults ...................................................................................................... 49
Table 30: Occupation Interests of Young Adults ......................................................................................... 50
Table 31: Education Interests of Young Adults ........................................................................................... 50
Table 32: Most Important Job Barrier to Young Adults .............................................................................. 51
Table 33: Occupations of Women............................................................................................................... 52
Table 34: Occupation Interests of Women ................................................................................................. 53
Table 35: Education Interests of Women ................................................................................................... 53
Table 36: Most Important Job Barrier to Women ...................................................................................... 54
Table 37: Occupation Targets for All Tribal Members ................................................................................ 61
Table 38: Occupation Targets for Unemployed or Low-Income Tribal Members ...................................... 62
Table 39: Occupation Targets for Young Adult or Female Tribal Members ............................................... 62
Table 40: Final Survey Outcomes ................................................................................................................. I2

6
Table 41: Total Survey Responses from Key Groups ................................................................................... I3
Table 42: 2013 Poverty Guidelines .............................................................................................................. I4
Figure 1: Basic Flathead Reservation Industries ......................................................................................... 13
Figure 2: All Flathead Reservation Industries ............................................................................................. 14
Figure 3: % Lake County Wage Growth ...................................................................................................... 15
Figure 4: Employment Status ...................................................................................................................... 21
Figure 5: Employment by Industry .............................................................................................................. 22
Figure 6: Interest in Starting a New Business ............................................................................................. 24
Figure 7: Comparison of Education Attainment ......................................................................................... 25
Figure 8: Level of New Job Interest ............................................................................................................. 28
Figure 9: Commuting Mileage Preference .................................................................................................. 29
Figure 10: Willingness to Commute off Reservation .................................................................................. 29
Figure 11: Interest in Job-Related Training ................................................................................................. 31
Figure 12: Interest in a New CSKT Job Training Program ............................................................................ 34
Figure 13: Number of Barriers Per Household ............................................................................................ 35
Figure 14: Telephone Access ....................................................................................................................... 37
Figure 15: Cell Phone Coverage and Internet Access ................................................................................. 37
Figure 16: Working Vehicle or Drivers’ License .......................................................................................... 38
Figure 17: Education Completed by the Unemployed ................................................................................ 40
Figure 18: Tribal Member Poverty .............................................................................................................. 43
Figure 19: Education Completed by those Near or Below the Poverty Treshold ....................................... 45
Figure 20: Education Completed by Young Adults ...................................................................................... 49
Figure 21: % Male and Female .................................................................................................................... 51
Figure 22: Education Completed by Women .............................................................................................. 52
Figure 23: Business Owner Survey Respondents ........................................................................................ 55
Figure 24: Business Training Interests ........................................................................................................ 56
Figure 25: Presence of Collateral ................................................................................................................ 59
Figure 26: Type of Business Debt ................................................................................................................ 59
Figure 27: Most Difficult Barriers to Business Development ...................................................................... 60
Figure 28: % Male and Female ..................................................................................................................... I3
7
Executive Summary
Purpose The purpose of this study is to provide the
Confederated Salish and Kootenai Tribes (CSKT)
and other economic development partners with
baseline data required to guide future
economic development planning efforts. The
study is the first component of a three-year
Sustainable Economic Development Project
(Project) lead by the CSKT Economic
Development Office and funded by a grant from
the U.S. Department of Health and Human
Services Administration for Native Americans.
The study consists of two parts:
1. A compilation of data summarizing the
economy of the Flathead Reservation,
and
2. An extensive survey of Tribal members’
job and training needs combined with a
brief survey of Tribal business owners
and Tribal members who would like to
start a new business.
Methods The profile of the Flathead Reservation
economy was compiled by the University of
Montana Bureau of Business and Economic
Research (BBER) using Federal economic data,
State of Montana economic data, data provided
by CSKT, and BBER data.
The Job and Training Needs Survey and the
Business Owners’ Survey were designed by
BBER under the supervision of CSKT and several
Project partners. CSKT undertook an extensive
outreach effort to gain Tribal member input on
areas of study and questionnaire language.
BBER extensively tested the Jobs and Training
Survey before administration. The survey was
conducted by mail during May-July 2014. It
studied all enrolled Tribal members ages 18-60
whose mailing addresses were on the Flathead
Reservation. Cooperation by Tribal members
was excellent: 771 Tribal members completed
the Job and Training Needs Survey
questionnaire. The survey responses thoroughly
represent every major Tribal member
demographic group studied. A detailed
discussion of the representativeness of the
survey and of the methods used to collect the
data may be found in Appendix 1. At the time
this report is being written, BBER is awaiting
final Business Owners’ Survey responses. A
summary and analysis of the results of the
Business Owners’ Survey is forthcoming.
Flathead Reservation Economic
Profile The Flathead Reservation is located in the
center of western Montana’s dynamic
economy. The Reservation is bordered on the
south by Montana’s second largest urban trade
center, Missoula County, and on the north by
one of Montana’s fastest growing counties,
Flathead County. The Reservation is located on
a major, transportation arterial--U.S. Highway
93; and is blessed with spectacular natural
resources including Flathead Lake, the Ninepipe
National Wildlife Refuge, the National Bison
Range, and the Mission Mountains.
CSKT is the dominant employer on the Flathead
Reservation, accounting for 35% of all
employment and 55% of the employment in
industries that bring money into the economy
8
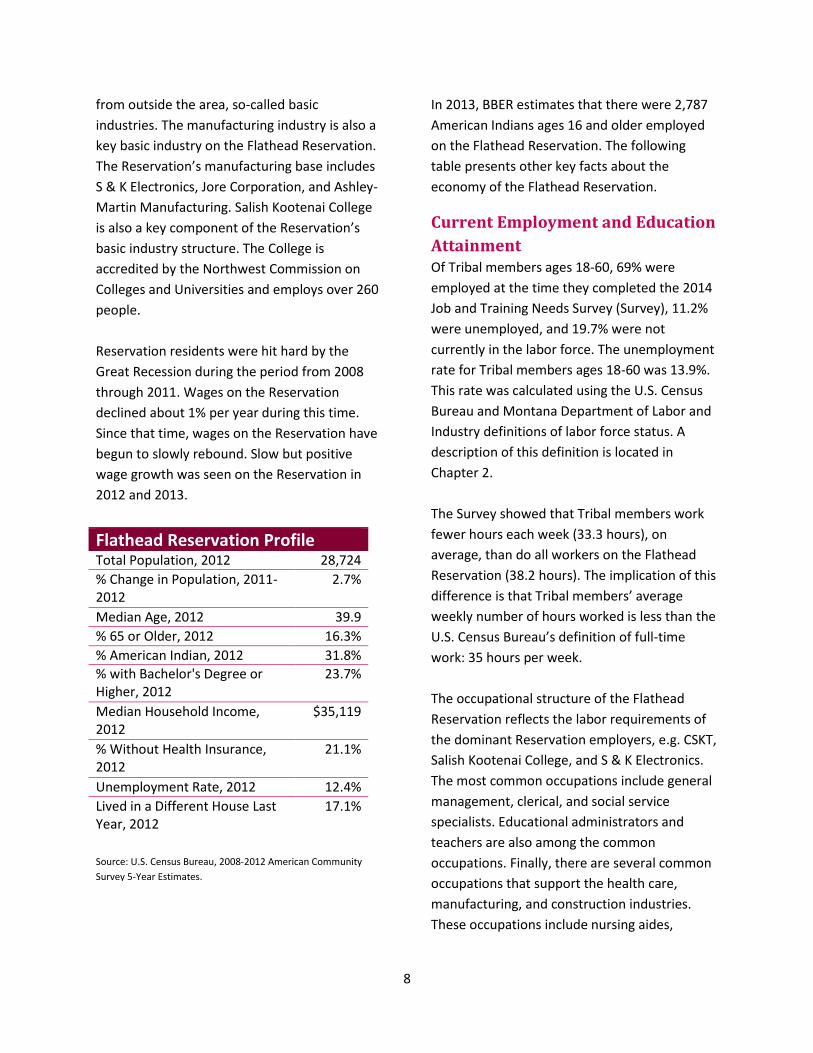
Source: U.S. Census Bureau, 2008-2012 American Community
Survey 5-Year Estimates.
from outside the area, so-called basic
industries. The manufacturing industry is also a
key basic industry on the Flathead Reservation.
The Reservation’s manufacturing base includes
S & K Electronics, Jore Corporation, and Ashley-
Martin Manufacturing. Salish Kootenai College
is also a key component of the Reservation’s
basic industry structure. The College is
accredited by the Northwest Commission on
Colleges and Universities and employs over 260
people.
Reservation residents were hit hard by the
Great Recession during the period from 2008
through 2011. Wages on the Reservation
declined about 1% per year during this time.
Since that time, wages on the Reservation have
begun to slowly rebound. Slow but positive
wage growth was seen on the Reservation in
2012 and 2013.
In 2013, BBER estimates that there were 2,787
American Indians ages 16 and older employed
on the Flathead Reservation. The following
table presents other key facts about the
economy of the Flathead Reservation.
Current Employment and Education
Attainment Of Tribal members ages 18-60, 69% were
employed at the time they completed the 2014
Job and Training Needs Survey (Survey), 11.2%
were unemployed, and 19.7% were not
currently in the labor force. The unemployment
rate for Tribal members ages 18-60 was 13.9%.
This rate was calculated using the U.S. Census
Bureau and Montana Department of Labor and
Industry definitions of labor force status. A
description of this definition is located in
Chapter 2.
The Survey showed that Tribal members work
fewer hours each week (33.3 hours), on
average, than do all workers on the Flathead
Reservation (38.2 hours). The implication of this
difference is that Tribal members’ average
weekly number of hours worked is less than the
U.S. Census Bureau’s definition of full-time
work: 35 hours per week.
The occupational structure of the Flathead
Reservation reflects the labor requirements of
the dominant Reservation employers, e.g. CSKT,
Salish Kootenai College, and S & K Electronics.
The most common occupations include general
management, clerical, and social service
specialists. Educational administrators and
teachers are also among the common
occupations. Finally, there are several common
occupations that support the health care,
manufacturing, and construction industries.
These occupations include nursing aides,
Flathead Reservation Profile Total Population, 2012 28,724
% Change in Population, 2011-2012
2.7%
Median Age, 2012 39.9
% 65 or Older, 2012 16.3%
% American Indian, 2012 31.8%
% with Bachelor's Degree or Higher, 2012
23.7%
Median Household Income, 2012
$35,119
% Without Health Insurance, 2012
21.1%
Unemployment Rate, 2012 12.4%
Lived in a Different House Last Year, 2012
17.1%

9
assemblers and fabricators, and construction
equipment operators.
The Job and Training Needs Survey also
discovered evidence that self-employment may
become an important source of economic
opportunity for Tribal members. Just over one-
third of all Tribal members (34.4%) who
responded to the survey said that they were
very interested in starting a new business.
Regarding education attainment, almost 1 in 10
Tribal members ages 18-60 (9.7%) completed
less than a high school diploma or G.E.D. Just
over 2 in 10 (20.6%) completed a high school
diploma or G.E.D. About 4 in 10 (37.4%)
completed a high school diploma or G.E.D. plus
some additional college or training; while 12.8%
had completed an Associate’s Degree or Job
Corps training. Just under 2 in 10 (19.5%)
completed a Bachelor’s Degree or higher.
Job, Education, or Job Training
Interests More than 3 out of 5 Tribal members (62.5%)
said they are interested in looking for a new
job. Interest in a new job was substantial across
all groups. More unemployed Tribal members
(93.9%) wanted a new job than did employed
Tribal members (58.8%), or those who were not
in the labor force (58.9%).
On average, Tribal members expressed a
willingness to commute 30 miles one-way to
work. A majority of Tribal members (54.5%)
were willing to commute off the Reservation to
work if they could return home each night,
while 45.5% were unwilling to do so.
The top 10 occupations that interested Tribal
members were:
1. Accountants, auditors, budget analysts
2. Teachers
3. Managers, general
4. Supervisors of administrative and
support workers
5. Office and administration workers
6. Registered nurses
7. Secretaries and administrative
assistants
8. Forest, conservation, and logging
workers
9. Computer occupations
10. Construction equipment operators
The largest group of Tribal members (44.1%)
expressed interest in an apprenticeship or on-
the-job training. More than 3 in every 10 Tribal
members expressed interest in some type of
academic training (36.4%) or obtaining a
certification or licensure (34.5%). About 3 in
every 10 Tribal members (28.5%) expressed
interest in seeking some type of vocational
training. About 1 in 10 Tribal members (9.9%)
expressed a desire to obtain an alternative high
school graduation diploma like a GED, or seek
additional education to improve their reading,
math, or English skills (10.3%).
Almost 4 in every 10 Tribal members, ages 18-
60 who answered the survey (39.0%), said they
were very interested in participating in a new
job training program offered by the
Confederated Salish and Kootenai Tribes. An
additional 31.3% said they were somewhat
interested in participating.

10
Barriers to Employment or Job
Training The following summarizes barriers that impede
Tribal members ages 18-60 from getting a new
job, job training, or additional education.
Barrier Percent
No gas money 38.0%
Discrimination 26.2%
No reliable vehicle 25.8%
Poor health 24.5%
Lack of child care 22.9%
Physical/ mental disability 21.8%
Criminal charges/ legal trouble 15.9%
Alcohol or addiction 13.0%
Lack of elder care 5.9%
Some Tribal members also faced technological
barriers to employment or education. Almost 4
in 10 (39.4%) lived in a household with no
working landline telephone. Only about 1 in 10
(11.6%) lived in a household with no working
cellular telephone. More Tribal members, about
16.6%, lived in households where there was no
cellular telephone coverage. Finally, one-third
of Tribal members ages 18-60 lived in
households where there was no working
internet access.
Transportation to work or school was also a
barrier for 20.9% of Tribal members. Almost 1 in
10 (8.2%) had neither a working motor vehicle
nor a valid driver’s license. Another 6.2% had a
valid driver’s license but no working motor
vehicle, while 6.5% had a working motor vehicle
but no valid driver’s license.
Gaps in the Tribal Workforce The Job and Training Needs Survey focused
closely on four groups of Tribal members:
1. Unemployed or not in the work force
2. Near or below the poverty threshold
3. Young adults
4. Women
Among unemployed Tribal members or those
who were not in the labor force, most
previously worked in low-skill and low wage
jobs. The jobs included:
Janitors and Cleaners
Home Health Aides
Wildland Firefighters
Security Guards
Dishwashers
Maids and Housekeeping Cleaners
Gaming Cage Workers
Farmworkers and Laborers
In addition, the unemployed or those no longer
in the labor force were much more likely to
have low levels of education attainment than
were other Tribal members. Almost 2 in 10
unemployed Tribal members (17.3%) and those
not in the labor force (17.6%) completed less
than a high school diploma or G.E.D., compared
with only 1 in 10 of Tribal members overall
(9.7%).
Most Tribal members who lived in a household
below the poverty threshold also worked in
entry-level or lower-skill occupations.
These occupations included:
Janitors
Home Health Aides

11
Landscaping Workers
Cashiers
Dishwashers
Maids.
Tribal members living below the poverty
threshold were significantly more likely to not
complete a high school diploma or G.E.D.
(16.9%) when compared to all Tribal members
(9.7%).
In contrast, many Tribal members living in near-
poverty households already had significant
levels of job training. The higher skill
occupations reported by those who lived in
near-poverty included:
• Accountants and Auditors
• Teachers
• Rehabilitation Counselors
• Community and Social Service
Specialists
The lower skill occupations reported by near-
poverty Tribal members also required
significant training, and included home health
aides, woodworking machine operators, and
truck and tractor operators.
Evaluating the survey data for workforce
achievement gaps is not always appropriate
with young adults, since they are just beginning
their labor force experiences. However, one gap
that appears in the data is particularly
significant. Proportionately more Tribal
members ages 18-34 (15.2%) had not
completed high school or a G.E.D. than had all
Montanans ages 18-34 (11.0%). Similarly, fewer
young adult Tribal members had completed
Bachelor’s Degrees (13.7%) than had all of
Montana’s young adults (20.2%).
Finally, clerical or administrative jobs dominate
the list of the top 10 occupations of female
Tribal members ages 18-60. All of the top ten
occupations include:
1. Secretaries and Administrative
Assistants
2. Accountants and Auditors
3. Home Health Aides
4. Janitors and Cleaners
5. Cashiers
6. Maids and Housekeeping Cleaners
7. Bookkeeping, Accounting, and Auditing
Clerks
8. Office and Administrative Support
Workers, All Other
9. Other Management Occupations
10. Nursing Assistants
Job Training Program
Recommendations The CSKT Sustainable Economic Development
Project Partners/Steering Committee
recommends targeting specific occupations for
future job training programs. These are listed in
detail in Chapter 7. When planning for those
training programs, three recommendations
should be considered:
1. Any new job training program should
provide actual job experience.
2. Accommodations for Tribal members
with disabilities should be a priority in
any new job training program.
3. Expand CSKT’s and Salish Kootenai
College’s efforts to train and assist
Tribal members who want to start a
new business.

12
Chapter 1: Flathead Reservation Economic Profile 2014
Introduction This report presents the findings of the
Confederated Salish and Kootenai Tribes’
Sustainable Economic Development Study: A
Profile of the Flathead Reservation Economy
and Tribal Member Job and Training Needs. The
study consisted of a compilation of data
describing the economy of the Flathead
Reservation. In addition, the study included an
extensive survey of Tribal members’ job and
education skills, needs, barriers to employment,
and workforce gaps. The study also included a
brief survey of Tribal business owners and Tribal
members who would like to start a new
business.
The purpose of this study is to provide the
Confederated Salish and Kootenai Tribes and
economic development partners with baseline
data required to guide future economic
development planning efforts. The study was
funded by a Social and Economic Development
Strategies (SEDS) grant from the U.S.
Department of Health and Human Services
Administration for Native Americans, and is part
of a three year Sustainable Economic
Development Project which began in October
of 2013. The CSKT Economic Development
Office applied for and received the grant and is
directly responsible for this study and
completion of a Sustainable Economic
Development Plan and Job Training Pilot Project
to be completed in 2015 and 2016 respectively.
CSKT contracted with the University of
Montana-Missoula’s Bureau of Business and
Economic Research (BBER) to compile the
economic profile of the Flathead Reservation,
and to conduct the Job and Training Needs and
Business Owners’ surveys, with assistance from
CSKT’s Economic Development Office staff and
Project partners.
The Job and Training Needs Survey was
designed by BBER under the supervision of
CSKT. CSKT’s Economic Development Office
(EDO) undertook an extensive outreach effort
to gain Tribal member input on areas of study
and questionnaire language. In particular,
CSKT’s EDO presented information at a large
number of community meetings during the
study, and obtained substantial and meaningful
input from Tribal Elders and other Tribal
members. CSKT’s EDO also formed a
partnership/steering committee composed of
key Tribal government officials, Tribal business
leaders, Salish Kootenai College, Job Service,
and other state and local officials. This steering
committee guided BBER in each step of the
study design and implementation process.
The primary survey data presented in this
report is summarized from the responses of 771
Tribal members to the Jobs and Training Needs
Survey. The survey was conducted in May-July
2014. Questionnaires were mailed to each
enrolled Tribal member ages 18-60 whose
mailing address was located on the Flathead
Reservation. The responses comprehensively
represent every major Tribal member
demographic group studied. A complete
description of the methods used in this study
can be found in Appendix 1 of this report.

13
2% 5% 3% 4% 3% 2% 4% 3% 4% 3% 4% 3%
9% 10%
14% 16%
57% 55%
0%
25%
50%
75%
100%
Earnings Employment
CS&KT Government
Manufacturing
Salish and KootenaiCollege
State Government
Heavy & Civil EngineeringConstruction
Federal Government
Mining, Quarrying, Oil, &Gas Extraction
Agriculture, Forestry,Fishing, & Hunting
Non-Resident Travel
Sources: Bureau of Business and Economic Research, University of Montana; U.S. Bureau of Labor Statistics, Quarterly Census of Employment and Wages.
Basic Flathead Reservation Industries: Earnings and Employment 2011
Figure 1: Basic Flathead Reservation Industries
Structure of this Report Chapter 1 presents the economic profile of the
Flathead Reservation. Chapters 2-5 display the
results of the Jobs and Training Needs Survey.
Chapter 6 describes the results of the
Entrepreneur (Business Owners’) Survey.
Chapter 7 describes job training program
recommendations based on the results of this
study. Finally, the appendices of this report
document the methods used in this study as
well as copies of the survey questionnaires.
Flathead Reservation Economic
Profile This profile is divided into two sections. The first
is a graphic and tabular snapshot of the current
Flathead Reservation economy. The second is a
more in-depth, narrative description of the
economy.
Growth or decline of any economy depends on
that economy’s ability to bring in money from
outside the economy. Industries that bring
money into the economy from outside the area
and have the potential to grow the economy
are called basic industries. Basic industries
are often considered to be of central
importance to officials and business persons
interested in economic development.
The Tribal Government of the Confederated
Salish and Kootenai Tribes is the Flathead
Reservation’s dominant basic industry (see
Figure 1). The manufacturing industry is also
a key basic industry on the Flathead
Reservation. The Reservation’s
manufacturing base includes S & K
Electronics, Jore Corporation, and Ashley-
Martin Manufacturing.
Salish Kootenai College, located in Pablo,
Montana, is also a key component of the
Flathead Reservation’s basic industry
structure. The College is accredited by the
Northwest Commission on Colleges and
Universities and employs over 260 people.

14
Source: U.S. Census Bureau, 2008-2012 American
Community Survey 5-Year Estimates.
To fully understand the Flathead Reservation
economy it is important to place its basic
industry structure (depicted in Figure 1) in
context by illustrating the Reservation’s entire
industry structure. Figure 2 below shows the
entire industry structure of the Flathead
Reservation by looking at the number of
persons employed in each industry.
Confederated Salish and Kootenai Tribal
Government is still the dominant industry on
the Flathead Reservation, even when looking at
all industries and not just basic industries. CSKT
Government is the primary difference when
comparing the Reservation industry structure to
that of the State of Montana. Local (town or
county) government is included in Figure 2 but
is not included in Figure 1. This is because Tribal
Government brings money into the community
from outside while local governments largely do
not.
Flathead Reservation Profile Total Population, 2012 28,724
% Change in Population, 2011-2012
2.7%
Median Age, 2012 39.9
% 65 or Older, 2012 16.3%
% American Indian, 2012 31.8%
% with Bachelor's Degree or Higher, 2012
23.7%
Median Household Income, 2012 $35,119
% Without Health Insurance, 2012 21.1%
Unemployment Rate, 2012 12.4%
Lived in a Different House Last Year, 2012
17.1%
Table 1: Flathead Reservation Profile
2% 9% 2%
3% 3%
4%
3%
9%
4%
5%
5%
6%
6%
4%
9%
13%
16%
15% 16%
20% 35%
11%
0%
25%
50%
75%
100%
Flathead Reservation Montana
Tribal or Local Gov't
Trade, Transportation, & Utilties
Education & Health Services
Leisure & Hospitality
Manufacturing
Information, Finance & Real estate
Construction
Other Services
Professional & Technical Services
Ag and Mining
Federal and State Gov't
Sources: Bureau of Business and Economic Research, University of Montana; U.S. Bureau of Labor Statistics, Quarterly Census of Employment and Wages.
All Flathead Reservation Industries Compared to Montana: All Employment 2011
Figure 2: All Flathead Reservation Industries

15
Figure 3: % Lake County Wage Growth
-3.0
-2.0
-1.0
0.0
1.0
2.0
3.0
4.0
5.0
6.0
2006 2007 2008 2009 2010 2011 2012 2013 2014 2015 2016 2017 2018 2019 2020
% G
row
th
Year
% Growth in Real (Inflation Adjusted) Lake County Wages: Actual and Forecast
Montana
Lake
Sources: UM Bureau of Business and Economic Research; IHS Economics & Country Risk (formerly HIS Global Insight, Inc.).
It is also vital to understand the employment
status of Tribal members living on the Flathead
Reservation. However, census data includes all
American Indians who claim affiliation with any
tribe, not just CSKT. Table 2 summarizes this
status. In 2013 about 2,787 American Indians
age 16 and older were employed on the
Flathead Reservation. Table 2: Employed American Indian Population
Figure 3 represents the wage experience of all
people living on the Flathead reservation. Lake
County data is used in Figure 3 because wage
data is only collected at the county level, and
because two-thirds of the Reservation is in Lake
County. The data in Figure 3 have been adjusted
for inflation. Reservation residents were hit
hard by the Great Recession during the period
from 2008 through 2011. Wages on the
Reservation declined about 1% per
year during this time. Since that
time, wages on the Reservation have
begun to slowly rebound. It is
important to note that this growth
occurred at a significantly slower
pace when compared to the State of
Montana as a whole.
American Indian Only - Employed Civilian Population
16 Years and Over on the Flathead Reservation
BBER
Estimate
2013
ACS
2012
ACS
2011
ACS
2010
ACS
2009
Male 1,450 1,397 1,329 1,402 1,239
Female 1,337 1,297 1,148 1,161 1,177
Total 2,787 2,694 2,477 2,563 2,416 Sources: UM Bureau of Business and Economic Research and U.S. Census
Bureau American Community Survey 5-Year Estimates

16
Sources: Bureau of Business and Economic Research, University of Montana; Montana Department of Labor and Industry, Region 1, 2012-
2022 Projected Employment. Region 1 includes Flathead, Lake, Lincoln, Mineral, Missoula, and Sanders Counties.
Table 3 lists occupations that will add the most
jobs over the next 10 years. This list is very
important for CSKT economic development
officials and for job training planners.
Table 3: Western Montana Growth Jobs
Western Montana Labor Market: 30+ Annual Openings and Growth of At Least 1% Per Year
Occupation
Annual Growth Rate (%)
Total Annual
Openings
Average Wage (Year)
1. Personal Care, Child Care, Fitness Instructor, Recreation 2.4% 168 $21,460
2. Computer and Mathematical Occupations 2.2% 75 $64,770
3. Nursing, Psychiatric, and Home Health Aides 2.0% 93 $22,180
4. Health Technologists and Technicians 1.9% 138 $30,010
5. Food and Beverage Serving Workers 1.8% 457 $18,100
6. Supervisors of Food Preparation and Serving Workers 1.8% 43 $28,110
7. Woodworkers (cabinet makers or finish carpenters) 1.7% 40 $28,710
8. Financial Specialists 1.6% 76 $54,440
9. Sales Representatives, Wholesale and Manufacturing 1.6% 47 $46,640
10. Information and Record Clerks 1.5% 212 $24,310
11. Health Treating Practitioners (Registered Nurse) 1.5% 189 $58,840
12. Restaurant Hosts and Hostesses, Dishwashers 1.5% 90 $18,150
13. Counselors, Social Workers, and Other 1.5% 87 $38,000
14. Grounds Maintenance Workers 1.5% 55 $30,000
15. Medical Assistant, Dental Assistant, Medical Equipment Preparer, Veterinary Assistant, etc.
1.5% 43 $30,700
16. Construction Trades Workers 1.4% 197 $37,090
17. Financial Clerks 1.4% 167 $31,120
18. Building Cleaning and Pest Control Workers 1.4% 152 $22,610
19. Motor Vehicle Operators 1.4% 133 $39,430
20. Cooks and Food Preparation Workers 1.4% 127 $28,000
21. Secretaries and Administrative Assistants 1.4% 109 $27,710
22. Supervisors of Office and Administrative Support Workers 1.4% 42 $43,300
23. HVAC Mechanic, Machinery Mechanic, Medical Equipment Repair 1.3% 93 $50,180
24. Business Operations Specialists 1.3% 81 $45,420
25. Sales Representatives, Services 1.3% 53 $46,640
26. Security Guards, Ski Patrol, Transportation Screeners, etc. 1.3% 52 $22,690
27. Material Moving Workers 1.2% 89 $40,000
28. Retail Sales Workers 1.1% 515 $21,820
30. Vehicle and Mobile Equipment Mechanics, Installers, and Repair 1.1% 90 $38,520
31. Metal Workers and Plastic Workers 1.0% 33 $30,500
32. Law Enforcement Workers 1.0% 30 $47,380

17
Regional Context of the Flathead
Reservation Economy The Flathead Reservation is a rural area,
bordered on the south by Missoula, Montana’s
second largest urban trade center, and on the
north by Flathead County, one of Montana’s
fastest growing (and now fourth largest)
counties.1 Unlike many Indian reservations, the
Flathead Reservation is not isolated from the
larger state and regional economies. Located in
the center of western Montana’s dynamic
economy, the Reservation contributes to the
region’s development, just as changes in the
regional economy influence the economic
health of the Reservation.
Population Trends Recent U.S. Census Bureau data indicates that
the American Indian population of the
Reservation represents a much greater fraction
of total population than previous data
suggested. With the opening of the Reservation
to non-Tribal settlers in 1910, non-Tribal
population growth outpaced Tribal growth
during much of the 20th century. In the 1970
Census, the American Indian to non-Indian ratio
of population was approximately 1 to 5.
Tribal population growth increased in the last
40 years, most likely due to better data
collection methods according to Tribal officials.
The ratio of American Indians to non-Indians
reported in the preliminary 1990 Census count
was approximately 1 to 3. The 2000 and 2010
Census counts reported American Indians as
1 This paragraph and those that follow in Chapter 1
rely heavily on the work of Dr. Tom Power, Professor Emeritus of Economics at the University of Montana, as published in Chapter 4 of the CSKT Comprehensive Resources Plan.
30% of the total Reservation population in 2000
and 32% in 2010.
According to census data, American Indians
now account for most of the population growth
on the Reservation. From 1990 to 2000, the
Indian population grew by 2,753, a rate of 54%,
while the non-Indian population grew by 2,160
(13%). From 2000 to 2010, the Indian
population rose by 1,255, a 16% growth rate,
while the non-Indian population increased by
932 (5%).
Narrative Description of the
Flathead Reservation Economy On the Reservation, the Confederated Salish
and Kootenai Tribes are the most significant
economic actor. Each year the Tribes spend
tens of millions of dollars locally. The Tribes
own most of the timber, range, and recreation
resources, as well as the lands where irrigation
waters originate. Tribal members own and
operate over one hundred local businesses.
The Tribal organization also operates several
businesses. In addition, it runs schools and
manages the Reservation’s electric utility, and
will soon own and operate Kerr Dam, a major
hydropower generation facility.
The Confederated Salish and Kootenai Tribes
own the majority of the lands within the
Reservation, including the bed and banks of the
south half of Flathead Lake and other water
bodies. The Tribal land base encompasses the
majority of the forest resources and a
significant portion of the agricultural resources
on the Reservation. It therefore provides the
underpinning for the Reservation’s basic
economic activities.
18
The Tribes administer hundreds of thousands of
acres of rangelands and pasture lands. The
Tribes own a smaller portion of the cropland on
the Reservation, however. The Flathead Indian
Irrigation Project (FIIP) serves 179,643 acres on
the Reservation of which 24,895 acres are
either owned by the Tribes or are individually-
owned Indian trust lands (Littleboy, FIIP, 2010).
Because grazing on off-Reservation federal
lands is becoming more restricted and
expensive, the importance of Tribal grazing land
to the local agricultural economy will probably
increase in coming years. Rising bid prices for
the use of Tribal grazing land already indicate
that this is happening.
Tribal land is an important source of timber for
the local forest products industry. Almost half
(46 percent) of all timber harvested in Lake
County came from lands controlled by CSKT
(UM Bureau of Business and Economic
Research, 2010).
Water Water resources on the Flathead Reservation
are extensive. They include both surface water
and ground water. Municipalities and
developments depend on ground water for
domestic use. Most surface water is used to
provide habitat for fisheries as well as irrigation.
The Flathead Indian Irrigation Project manages
the primary surface water delivery system for
agriculture on the Reservation. Originally
designed to promote the economic
development of the Tribes and individual Tribal
members, it now serves many non-Indian farms.
The headwaters, storage facilities and canals lie
on CSKT lands. Other surface water sources for
agriculture are delivered through small ditches
and canals, most of which were developed
before FIIP.
CSKT, the State of Montana, and the United
States have been working for decades to
develop a water rights settlement that will
quantify the water rights of the Confederated
Salish & Kootenai Tribes on and off the Flathead
Reservation and provide for the administration
of water rights on the Reservation. On October
3, 2012, the three governments--CSKT, the
State of Montana, and the United States--
released a draft Water Rights Compact (the
Compact) and a Unitary Administrative and
Management Ordinance (the Ordinance or Law
of Administration) for public review and
comment. After the Montana Legislature
rejected the compact in 2013, the 2015
Montana Legislature must pass the compact or
CSKT will have to file all of their water rights
claims with the Montana Court. The Court will
adjudicate those claims along with all filed
claims.
Kerr Dam CSKT leases the site of Kerr Dam to PPL
Montana. The dam annually produces four
times as much electricity as Mission Valley
Power (the local electricity utility managed by
CSKT) sells on the Reservation. The Tribes are
co-licensee with PPL Montana for the facility,
and have settled on the purchase price to buy
and take over sole operation in the year 2015.
CSKT has filed formal notice with the Federal
Energy Regulatory Commission regarding their
intent to acquire the Kerr Project.
Land Buy-Back CSKT recognizes the overall importance of the
land and its resources. The Flathead Indian
Reservation is one of 150 unique reservations
with fractional land interests. CSKT has

19
identified roughly 3,000 Tribal members who
share ownership of 700 unique tracts on the
Reservation. Nearly 2,000 of those shares in
land-ownership amount to less than a 5%
interest in a tract. Ten to twenty owners can
own interests in a tract that is only 1 acre in
size, or may only own the mineral rights, but
not the surface rights. This fractionated
ownership makes it impossible to manage some
of these tracts. For decades CSKT has been
buying back Reservation lands that were taken
as a result of the Flathead Allotment Act and
forced fee patent policies. CSKT has been paying
fair market value to buy back Tribal homelands,
spending millions. Under the Cobell settlement
agreement, the federal government allocated
roughly $7.4 million to purchase an estimated
38,400 acres worth of fractionated interests on
behalf of CSKT. The first offers in the Cobell
Agreement’s Land Buy-Back Program were
mailed on September 5, 2014, to CSKT Tribal
members with fractional land interests on some
Flathead Indian Reservation tracts.
The Environment as a Tribal
Economic Asset The Tribes have also sought to protect the
Tribal land base by establishing wilderness and
primitive areas and by developing regulations
and resource management plans designed to
conserve Tribal resources. During its
comprehensive planning process, the CSKT
membership set goals that emphasized the
maintenance of a healthy and productive
linkage between the Tribal land base and the
Reservation economy. In an ideal future, the
membership would prefer to see Reservation
lands used in a sustainable manner compatible
with environmental and cultural resource
protection.
There are other kinds of economic benefits as
well as many non-economic benefits that come
from CSKT’s prudent use and management of its
natural resources. A healthy natural
environment is essential if CSKT is to maintain
Tribal culture and spirituality. A clean
environment is also important to the physical
and mental well-being of Tribal members as
well as all Reservation residents.
In economic terms, a high quality natural
environment is an important stimulus to
economic development. By attracting and
holding new businesses, it provides a powerful
force for growth.
For all of these reasons CSKT has invested
considerable effort in protecting and enhancing
the natural environment of the Reservation. To
name only a few examples, CSKT:
sought and obtained a Class I Air
Quality designation for the Reservation,
the most demanding air quality status
under federal law
created and then expanded the Mission
Mountains Tribal Wilderness and the
South Fork and Mill Pocket
Kitqwanukxu’l (Lozeau) Primitive Areas
and have created a buffer zone to
protect the wilderness area
adopted and implemented a Shoreline
Protection Ordinance
adopted and implemented an Aquatic
Lands Conservation Ordinance to
protect wetlands and other aquatic
lands

20
adopted a Fisheries Management Plan
and a Water Quality Management
Ordinance
drafted and adopted the Lower
Flathead River Resource Plan to protect
that area of the Reservation
CSKT carries out interdisciplinary reviews on
natural resource management and
development activities occurring on the
Reservation to insure that the activities cause
minimal environmental damage. CSKT is also
working with the Environmental Protection
Agency regarding enforcement of federal and
Tribal air and water quality, and solid and
hazardous waste regulations on the
Reservation. Protection and enhancement of
the natural landscapes and ecosystems of the
Reservation is one of the Tribes’ highest
priorities.

21
Chapter 2: Tribal Member Employment Status, Occupations, Education and Training Experience This chapter describes the labor force,
education, and training experiences of Tribal
members ages 18-60 who responded to the
survey. Tribal government officials need this
information to evaluate impact of and plan for
future job training programs. The survey results
presented here represent the status of 771
Tribal members as of May-July 2014.
Employment Status For the purposes of this study understanding
the employment status of responding Tribal
members is vital. Almost seven of every ten
survey respondents (69.1%) were employed in
the week prior to completing the survey, while
11.2% were unemployed. The remaining 19.7%
were not in the labor force in the week prior to
completing the survey. Figure 4 illustrates the
employment status of survey respondents.
It is important to note that to be considered not
in the labor force, a respondent had to classify
themselves as all of the following:
not working in the week prior to the
survey
not on layoff from a job
not on vacation or off due to a
temporary illness or maternity leave
not having actively looked
for work for the previous four weeks
This category includes retired
persons, students, those taking care
of children or other family members,
and others who are neither working
nor seeking work. Of the 152
respondents (19.7%) who said that
they were not in the labor force, 57
said that they didn’t work within the
last year. A very similar number (58)
reported that they had not worked
for between 1 and 5 years. Thirty-seven tribal
members responded that they had not worked
for 5 or more years.
Unemployment Rate When considering only those survey
respondents who classified themselves as being
in the labor force, the unemployment rate for
Tribal members ages 18-60 was 13.9%. This rate
Figure 4: Employment Status
69.1%
11.2% 19.7%
0.0%
20.0%
40.0%
60.0%
80.0%
Employed Unemployed Not in labor force
Employment Status of Tribal Members Ages 18-60

22
is somewhat higher than the U.S. Census
Bureau’s 2008-2012 estimate of 12.4% for all
persons ages 16 and older in the labor force and
living on the Flathead Reservation.2 The survey
respondent’s unemployment rate is also higher
than the 10.8% rate for 2011 reported by
Montana Department of Labor and Industry for
all people ages 16 and older in the labor force
that lived on the Flathead Reservation.3
Average Weekly Hours Worked While it is vital to describe the employment
status of responding Tribal members, it is also
very important to know whether or not
employed Tribal members work full-time or
part-time. All other things being equal, more
hours worked results in higher income. Tribal
members who responded to the survey worked
an average of 33.3 hours in a usual week. This
average is significantly lower than the average
of 38.2 hours reported by U.S. Census Bureau
for all workers on who lived on the Flathead
Reservation in 2008-2012.4 The implication of
this difference is that Tribal members’ average
weekly number of hours worked is less than
U.S. Census Bureau’s definition of full-time
work: 35 hours per week.
Employment by Industry The Confederated Salish and Kootenai Tribes is
the dominant employer of Tribal members ages
18-60 who responded to this survey.
2 U.S. Census Bureau, 2008-2012 American
Community Survey 5-Year Estimates. 3 Montana Department of Labor and Industry,
http://www.ourfactsyourfuture.org/admin/uploadedPublications/2687_Flathead_RF08_Web.pdf, as of 2011, revised October 2013. 4 U.S. Census Bureau, 2008-2012 American
Community Survey 5-Year Estimates.
Figure 5 illustrates that nearly 3 in every 5 Tribal
members (57.6%) works for CSKT. Almost a
quarter of Tribal members (23.4%) worked for a
private or non-profit company. Salish Kootenai
College or another school employs 7.2% of
responding Tribal members. A very similar
number (6.8%) are self-employed. A small
proportion (4.0%) work for other government
agencies, or work without pay (1%), often in a
family business like a ranch.
1.0% 4.0% 6.8%
7.2%
23.4%
57.6%
0.0%
25.0%
50.0%
75.0%
100.0% CS&K Tribes
Private ornon-profitcompany
SK College orother school
Self-employed
Other local,state, orfederal gov
Workingwithout pay
Tribal Member Employment by Industry: 2014
Figure 5: Employment by Industry

23
Private Employers by Industry While the Confederated Salish and Kootenai
Tribal Government and Salish Kootenai College
are major employers of Tribal members, it is
also useful to examine in more detail the
private industries that employ Tribal members.
Table 4 lists the top 15 private industries that
employed Tribal members who responded to
the survey. In addition to retail establishments,
the prominent private or non-profit employers
of Tribal members included the health care
service industry, heavy and general
construction, and manufacturing.
Tribal Member Occupations The inventory of occupations of Tribal members
ages 18-60 is quite large and diverse. Table 5
below presents a list of the most common
occupations among responding Tribal members.
Table 4: Private or Non-Profit Employers
Private or Non-Profit Employers
Industry
% Employed Tribal Members
Food and drinking places 3.5%
Health care services 3.3%
Repair and maintenance services 2.3%
Heavy construction 1.7%
Electronic product manufacturing 1.7%
Wood products manufacturing 1.2%
Office admin services 1.2%
Ranching and farming 1.0%
General construction 1.0%
Forestry and logging 0.8%
Building material, garden equipment, supply
0.8%
Food and beverage stores 0.8%
Performing arts, sports and related
0.8%
Gambling, recreation, amusement 0.8%
Crop production 0.6%
Table 5: Occupations
Tribal Member Occupations Ages 18-60 % of All
Tribal Members Occupation
Building Cleaning Workers 4.0%
Nursing and Home Health Aides 2.9%
Secretaries and Administrative Assistants
2.9%
Agricultural Workers 2.9%
Accountants and Auditors 2.0%
Community and Social Service Specialists
1.9%
Grounds Maintenance Workers 1.7%
Cashiers 1.7%
Cooks 1.6%
General Management Occupations 1.3%
Farmers, Ranchers 1.3%
Customer Service Representatives 1.3%
Office and Administrative Support Workers
1.3%
Education Administrators 1.2%
Bookkeeping and Accounting Clerks 1.2%
Cabinetmakers and Bench Carpenters 1.2%
Conservation Scientists and Foresters 1.1%
Dishwashers 1.1%
Construction Equipment Operators 1.1%
Automotive Technicians and Repairers 1.1%
Assemblers and Fabricators 1.1%
Industrial Truck and Tractor Operators 1.1%
Counselors 0.9%
Postsecondary Teachers 0.9%
All Other Teachers 0.9%
Waiters and Waitresses 0.9%
Electronics Assemblers 0.9%

24
The influence of the types of industries present
on the Flathead Reservation is evident in Table
4 above. Confederated Salish and Kootenai
Tribes is the dominant employer on the
Reservation, and the types of occupations
required by CSKT appear prominently in the list
of Tribal member occupations. These
occupations include general management,
clerical, and social service specialists. The
influence of Salish Kootenai College can also be
seen in in the occupational structure of the
Tribal membership. Educational administrators
and postsecondary teachers are among the
common occupations. Finally, it is important to
note the presence of several occupations that
support the health care, manufacturing and
construction industries. These occupations
include nursing aides, assemblers and
fabricators, and construction equipment
operators.
Entrepreneurship As the paragraphs above show, the most
common type of employment
found was that in which
people are employed by
another person or
organization. But the Jobs
and Training Survey also
discovered evidence that
self-employment may
become an important source
of economic opportunity for
Tribal members.
Just over one-third of all Tribal members
(34.4%) who responded to the survey said that
they were very interested in starting a new
business (see Figure 6). Another 28.6% said
that they were somewhat interested in starting
a new business. This broad level of interest in
starting a new business may be an untapped
resource for Tribal economic development.
In addition to finding a large number of Tribal
members who aspire to start a new business,
the Jobs and Training Survey found a small core
of micro-business owners among the Tribal
membership who represent job growth in
action. Micro-business owners, or self-
employed Tribal members, represent 6.8% of all
employed Tribal members. The most common
types of micro-businesses owned by Tribal
members include:
Repair and Maintenance
Animal Production
General Government Support
Specialty Trade Contractor
34.4%
28.6%
8.8% 5.2%
23.0%
0.0%
10.0%
20.0%
30.0%
40.0%
Veryinterested
Somewhatinterested
Neitherinterested
noruninterested
Somewhatuninterested
Not at allinterested
Tribal Members Interested in Starting a New Business
Figure 6: Interest in Starting a New Business

25
8.9% 18.7%
18.6%
30.3%
51.4%
38.0%
21.1% 13.0%
0%
25%
50%
75%
100%
CS&K TribalMembers
All AmericanIndians in MT
CS&K Tribal Member Education Attainment Ages
25+
Bachelors Degree or higher
Some college or Associates Degree
HS Diploma or GED only
Less than HS Diploma or GED
Food Services
Forestry and Logging
Educational Services
Wood Products Manufacturing, and
Performing Arts.
Education Attainment Research consistently shows that education is
one of the most important investments in
human capital that can be made. Table 6
presents a detailed illustration of the education
levels completed by Tribal members ages 18-60
who returned the survey.
In addition to the levels of education attained
as represented in Table 6, about 1 in every 10
(10.1%) Tribal members reported that they
were currently enrolled in school or college.
More than half of these Tribal members were
enrolled in undergraduate college (6.3%);
another 2.0% were seeking a graduate-level
degree. The remaining Tribal members were
seeking a GED or vocational training.
The level of education attainment reported by
Tribal members provides reason for optimism
regarding future Tribal economic prospects.
Figure 7 demonstrates that Confederated Salish
and Kootenai Tribal members who responded
Tribal Member Education Attainment: Ages 18-60
Education Attained % Tribal
Members No schooling completed 2.2%
Grade 1 through 11 5.6%
12th grade – no diploma 1.9%
Regular high school diploma 12.6%
GED or alternative credential 8.1%
Less than 1 year of college or
vocational credit 15.3%
1 or more years college or
vocational/ Job Corps credit, no
degree 22.2%
Job Corps completion 1.4%
Associate’s degree 11.4%
Bachelor’s degree 14.4%
Master’s degree 4.0%
Professional degree beyond a
bachelor’s degree 0.8%
Doctorate degree 0.3%
Table 6: Detailed Education Attainment Figure 7: Comparison of Education Attainment

26
to the survey have attained higher levels of
education than the Montana American Indian
community as a whole.5 In particular
Confederated Salish and Kootenai Tribal
members have earned proportionately more
Bachelor’s Degrees (21.1%) than have all
American Indians in Montana (13.0%). Similarly,
a majority of CSKT members (51.4%) have
attained at least some college or vocational
education, compared with only 30.3% of all
American Indians in Montana.
Professional Licenses and
Certifications Businesses and governments require not only
education to qualify for some jobs, but also
professional licenses and certifications. A
significant proportion of Tribal members
reported that they have earned a broad range
of professional licenses or certifications.
Overall, just over one-third (36.4%) of Tribal
members said they have earned a professional
license or certification. Some of these are
combined with educational degree programs
and some are not. These certifications fall into
55 different categories ranging from National
Institute for Automotive Service exams to
Registered Nurse (R.N.) licenses to
Cardiopulmonary Resuscitation (CPR) or
HAZMAT certification.
Table 7 in the next column presents the most
commonly reported professional licenses or
certifications earned by Tribal members ages
18-60. The categories have been edited, but in
general they represent the original answers, as
opposed to official certification titles or terms.
5 U.S. Census Bureau, 2008-2012 American
Community Survey 5-Year Estimates.
Commercial Drivers’ Licenses (C.D.L.) are the
most common professional certification
reported (6.0%), followed by Certified Nursing
Assistants (C.N.A.) (2.7%), A.C.S.W. social work
licenses (2.1%), Cardiopulmonary Resuscitation
(CPR) certification (2.1%), and teaching
certificates (2.0%).
Table 7: Licenses or Certifications
Tribal Member Licenses or Certifications
License or Certification % Tribal
Members
Commercial Driver’s License 6.0%
Certified Nursing Assistant, C.N.A. 2.7%
ACSW social work, human services 2.1%
CPR 2.1%
Primary or secondary teaching certificate
2.0%
Automotive repair certification (N.I.A.S., A.A.E., A.A.S.)
1.9%
Law enforcement 1.6%
Fire fighter training 1.6%
Computer skill certifications 1.5%
Electrical fields, Joint Apprentice and Training Committee (JATC)
1.5%
Other building trades, contractor licenses
1.1%
Dental hygiene, assistant 0.8%
Registered Nurse, R.N. 0.8%
Welding 0.8%
Native American Studies, all levels 0.7%
Carpentry 0.7%
Forklift operator 0.5%
Housing or building inspection 0.5%
Other medical services 0.5%
Cosmetology, barber 0.4%

27
General Job Skills and Job
Seeking Skills Training Received
Finally, the Jobs and Training Survey asked
Tribal members about specific types of job
seeking skills in which they have been trained;
as well as several general, job-related skills. The
presence of these skills enables Tribal members
to better succeed in finding a job or in
performing that job.
About 4 in every 10 Tribal members (41.2%)
who responded to the survey reported that
they had participated in some type of job-
related safety training. A similar proportion
(39.7%) reported having participated in job-
related technical skill training. A lower, but still
substantial number of Tribal members reported
receiving training in so-called “soft” job-related
skills. These skills include interpersonal skills
(31.4%), organizing (31.1%), and quality
improvement or customer service (27.0%). Only
about 1 in every 10 Tribal members (11.5%) said
that they received specific product sales
training.
Job seeking skills are arguably key to improving
some Tribal members’ economic well-being.
This is probably the case for unemployed Tribal
members and those who are not working and
discouraged about future employment
prospects. Table 9 provides some information
about the inventory of job seeking skills present
among Tribal members ages 18-60.
Around 3 in every 10 Tribal members reported
having received some training on resume
writing (36.4%), interviewing for jobs (30.2%),
or completing job applications (29.3%). Fewer
have received training on job search strategies
(23.8%) or career planning (22.3%). Only 13.2%
reported being trained on where to go to obtain
labor market information, which often includes
information on job openings. This relatively low
proportion of Tribal members may represent a
potential training opportunity for the Tribes.
Table 8: General Job Skills
General Job Skill: Training Received
Job Skill % Tribal
Members
Safety 41.2%
Technical skills 39.7%
Interpersonal skill 31.4%
Organizing 31.1%
Quality improvement 27.0%
Product sales 11.5%
Table 9: Job Seeking Skills
Job Seeking Skill: Training Received
Job Seeking Skill % Tribal
Members
Resume writing 36.4%
Interviewing 30.2%
Applications 29.3%
Job search strategies 23.8%
Career planning 22.3%
Labor market information 13.2%

28
Chapter 3: Tribal Member Job, Education and Training Interests This chapter describes the interests of Tribal
members ages 18-60, who responded to the
survey about future jobs, job-related training,
and education. Tribal government officials,
Salish Kootenai College, and Kicking Horse Job
Corps Center need this information to plan
future job training and education programs. The
survey results presented here represent the
interests and opinions of 771 Tribal members as
of May-July 2014.
New Job Interest More than 3 out of 5 Tribal members (62.5%)
said they are interested in looking for a new
job. Interest in a new job was substantial across
all groups. Figure 8 demonstrates that more
unemployed Tribal members (93.9%) wanted a
new job than did employed Tribal members
(58.8%), or those who were not in the labor
force (58.9%).
Tribal members expressed clear preferences
about the type of work schedule they prefer.
Table 10 illustrates those preferences. A very
large majority of Tribal members said they
prefer full-time work. More than half of Tribal
members who responded to the survey (55.3%)
wanted a new job and wanted to work full-time.
About 1 in 5 (19.0%) wanted a new job but
preferred part-time work.
Tribal members also expressed preferences
about other types of work schedules, including
permanent or temporary work and year-round
or seasonal work. In general, somewhat fewer
Tribal members expressed opinions about these
alternate work schedules. Of those who did,
more Tribal members preferred permanent or
year-round work. However, there is a significant
group of Tribal members who want a new job
and want it to be temporary (8.6%) or want a
new job and want it to be seasonal (11.2%).
Tribal Members' Preferred Type of Work Schedule
Type of work schedule
Wanted a New Job % All %
Full-time 55.3% 78.8%
Part-time 19.0% 22.6%
Permanent 34.6% 46.0%
Temporary 8.6% 9.6%
Year-round 25.9% 33.5%
Seasonal 11.2% 14.1%
Table 10: Preferred Work Schedule
6.1%
41.2% 41.1%
93.9%
58.8% 58.9%
0.0%
25.0%
50.0%
75.0%
100.0%
Unemployed Employed Not in laborforce
Tribal Member Interest in Looking for a New Job
Not interested Interested
Figure 8: Level of New Job Interest
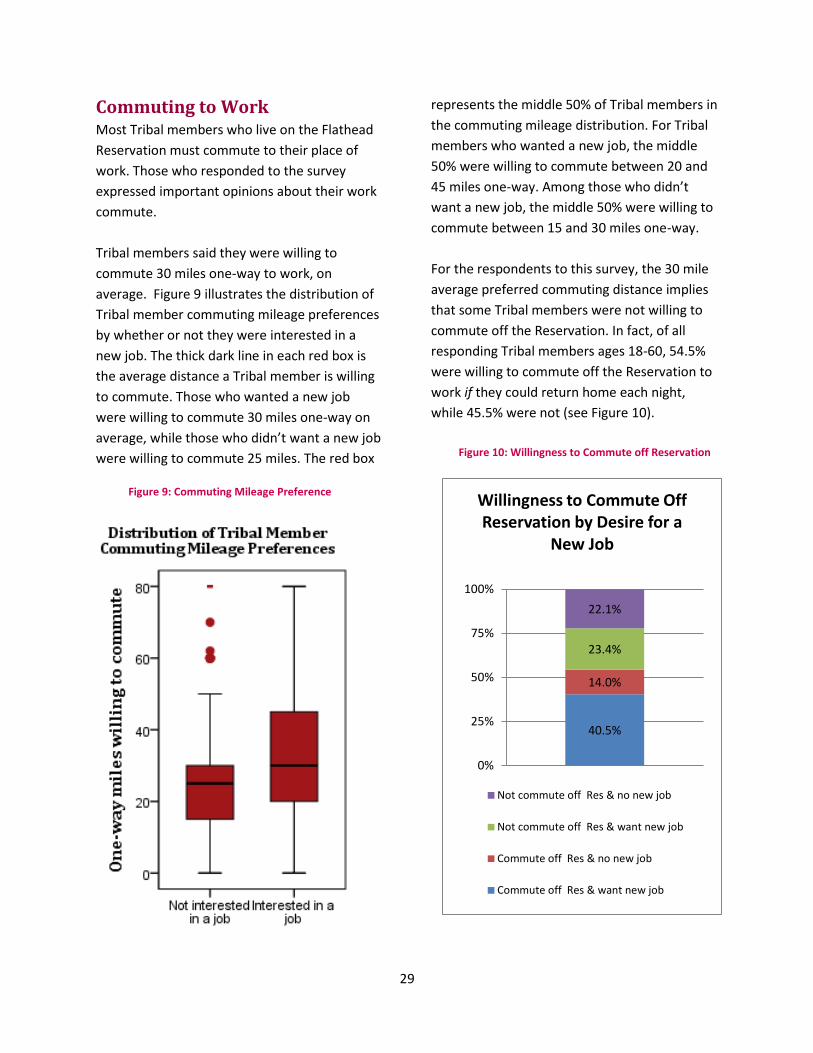
29
40.5%
14.0%
23.4%
22.1%
0%
25%
50%
75%
100%
Willingness to Commute Off Reservation by Desire for a
New Job
Not commute off Res & no new job
Not commute off Res & want new job
Commute off Res & no new job
Commute off Res & want new job
Commuting to Work Most Tribal members who live on the Flathead
Reservation must commute to their place of
work. Those who responded to the survey
expressed important opinions about their work
commute.
Tribal members said they were willing to
commute 30 miles one-way to work, on
average. Figure 9 illustrates the distribution of
Tribal member commuting mileage preferences
by whether or not they were interested in a
new job. The thick dark line in each red box is
the average distance a Tribal member is willing
to commute. Those who wanted a new job
were willing to commute 30 miles one-way on
average, while those who didn’t want a new job
were willing to commute 25 miles. The red box
represents the middle 50% of Tribal members in
the commuting mileage distribution. For Tribal
members who wanted a new job, the middle
50% were willing to commute between 20 and
45 miles one-way. Among those who didn’t
want a new job, the middle 50% were willing to
commute between 15 and 30 miles one-way.
For the respondents to this survey, the 30 mile
average preferred commuting distance implies
that some Tribal members were not willing to
commute off the Reservation. In fact, of all
responding Tribal members ages 18-60, 54.5%
were willing to commute off the Reservation to
work if they could return home each night,
while 45.5% were not (see Figure 10).
Figure 10: Willingness to Commute off Reservation
Figure 9: Commuting Mileage Preference
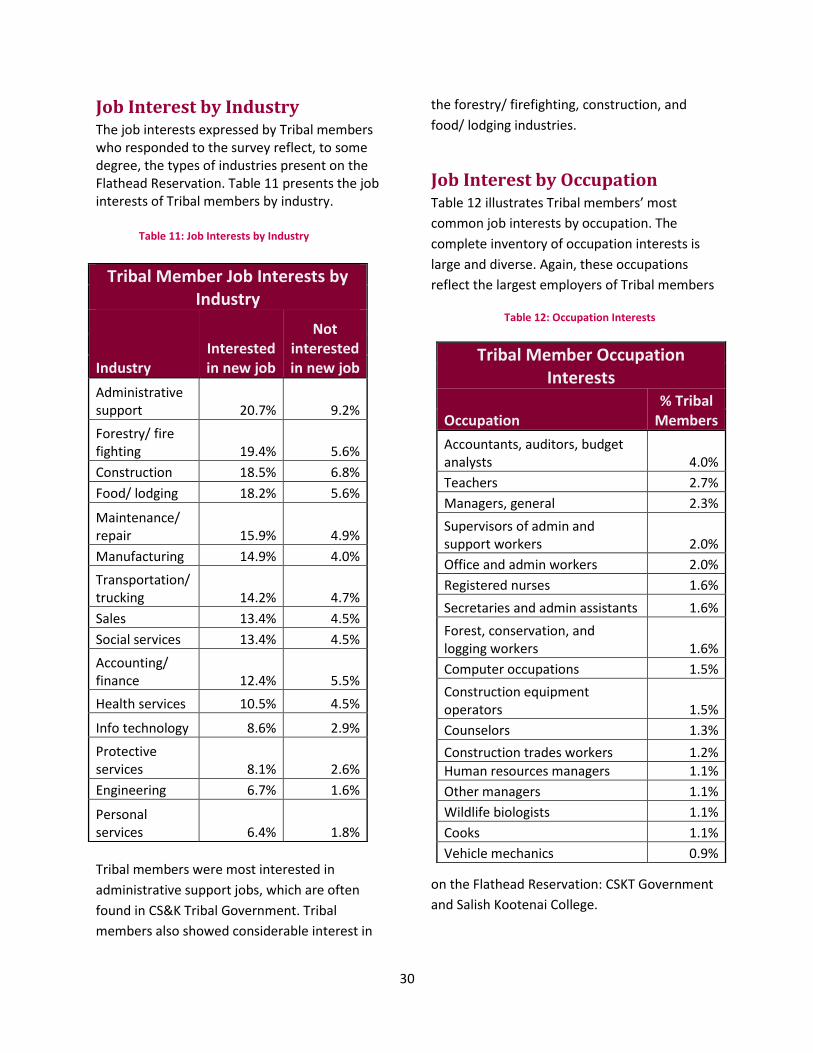
30
Job Interest by Industry The job interests expressed by Tribal members who responded to the survey reflect, to some degree, the types of industries present on the Flathead Reservation. Table 11 presents the job interests of Tribal members by industry.
Tribal members were most interested in
administrative support jobs, which are often
found in CS&K Tribal Government. Tribal
members also showed considerable interest in
the forestry/ firefighting, construction, and
food/ lodging industries.
Job Interest by Occupation Table 12 illustrates Tribal members’ most
common job interests by occupation. The
complete inventory of occupation interests is
large and diverse. Again, these occupations
reflect the largest employers of Tribal members
on the Flathead Reservation: CSKT Government
and Salish Kootenai College.
Table 11: Job Interests by Industry
Tribal Member Job Interests by Industry
Industry Interested in new job
Not interested in new job
Administrative support 20.7% 9.2%
Forestry/ fire fighting 19.4% 5.6%
Construction 18.5% 6.8%
Food/ lodging 18.2% 5.6%
Maintenance/ repair 15.9% 4.9%
Manufacturing 14.9% 4.0%
Transportation/ trucking 14.2% 4.7%
Sales 13.4% 4.5%
Social services 13.4% 4.5%
Accounting/ finance 12.4% 5.5%
Health services 10.5% 4.5%
Info technology 8.6% 2.9%
Protective services 8.1% 2.6%
Engineering 6.7% 1.6%
Personal services 6.4% 1.8%
Table 12: Occupation Interests
Tribal Member Occupation Interests
Occupation % Tribal
Members
Accountants, auditors, budget analysts 4.0%
Teachers 2.7%
Managers, general 2.3%
Supervisors of admin and support workers 2.0%
Office and admin workers 2.0%
Registered nurses 1.6%
Secretaries and admin assistants 1.6%
Forest, conservation, and logging workers 1.6%
Computer occupations 1.5%
Construction equipment operators 1.5%
Counselors 1.3%
Construction trades workers 1.2%
Human resources managers 1.1%
Other managers 1.1%
Wildlife biologists 1.1%
Cooks 1.1%
Vehicle mechanics 0.9%

31
Interest in Employers Other Than
CSKT A very large majority of Tribal members who
answered the survey (83.7%) said that they are
willing to work for an employer other than the
Confederated Salish and Kootenai Tribes. This is
true whether or not the Tribal member is
interested in looking for a new job.
Education and Training Interests The Tribal members who responded to the
survey expressed strong interest in additional,
job-related education or training. Figure 11
highlights this interest.
A majority of Tribal members (55.5%) said they
were very interested in obtaining additional job-
related education or training. An additional 26%
said that they were somewhat interested. Only
10.7% were not at all interested.
Survey respondents described their types of
education or training interest in broad
categories which are summarized in Table 13. A
plurality of Tribal members (44.1%) expressed
interest in an apprenticeship or On-the-Job
training. More than 3 in every 10 Tribal
members expressed interest in some type of
academic training (36.4%) or obtaining a
certification or licensure (34.5%). About 3 in
every 10 Tribal members (28.5%) expressed
interest in seeking some type of vocational
training.
About 1 in 10 Tribal members (9.9%) expressed
a desire to obtain an alternative high school
graduation diploma like a GED, or seek
additional education to improve their reading,
math, or English skills (10.3%).
Table 13: Type of Training Sought
Education or Training Sought by Tribal Members
Type of Education or Training
% Tribal Members
Apprenticeship or On-the-Job training 44.1%
Academic training 36.4%
Certification or licensure 34.5%
Vocational training 28.5%
Reading, math, or English skills 10.3%
GED 9.9%
55.5%
26.0%
6.5% 1.4%
10.7%
0%
25%
50%
75%
100%
% Tribal Members
Level of Interest in Job-Related Education or
Training
Not at all interested
Somewhat uninterested
Neither interested nor uninterested
Somewhat interested
Very interested
Figure 11: Interest in Job-Related Training
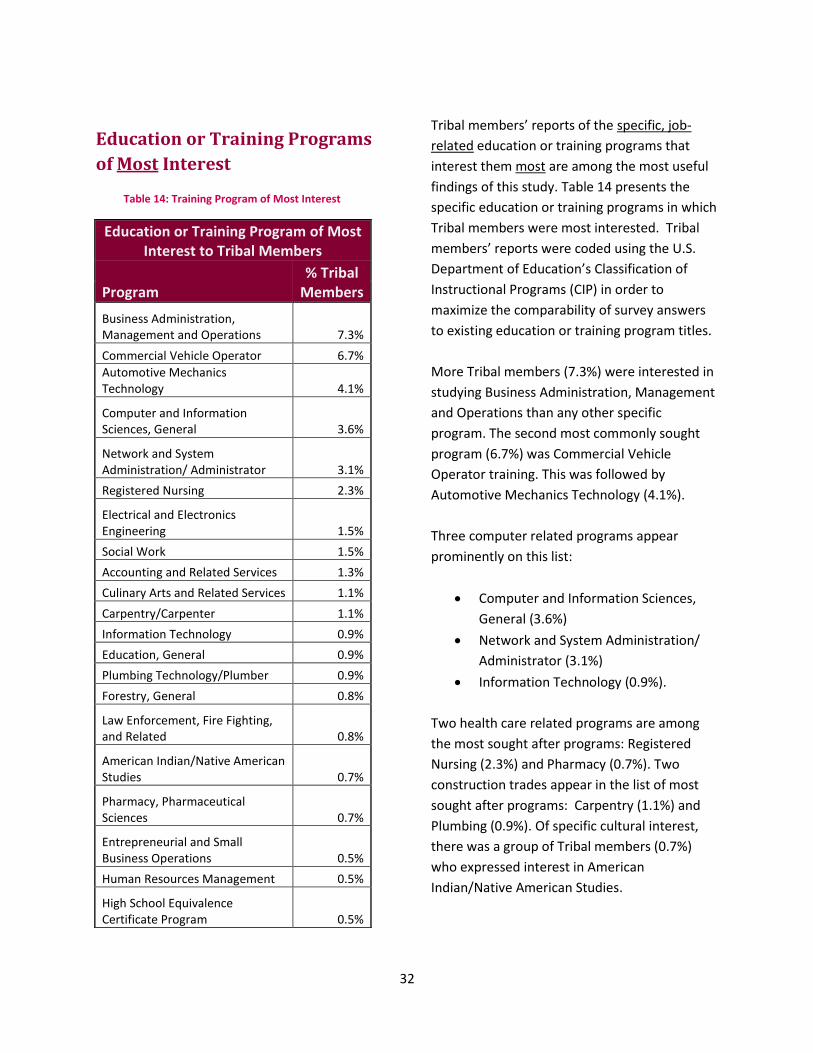
32
Education or Training Programs
of Most Interest
Tribal members’ reports of the specific, job-
related education or training programs that
interest them most are among the most useful
findings of this study. Table 14 presents the
specific education or training programs in which
Tribal members were most interested. Tribal
members’ reports were coded using the U.S.
Department of Education’s Classification of
Instructional Programs (CIP) in order to
maximize the comparability of survey answers
to existing education or training program titles.
More Tribal members (7.3%) were interested in
studying Business Administration, Management
and Operations than any other specific
program. The second most commonly sought
program (6.7%) was Commercial Vehicle
Operator training. This was followed by
Automotive Mechanics Technology (4.1%).
Three computer related programs appear
prominently on this list:
Computer and Information Sciences,
General (3.6%)
Network and System Administration/
Administrator (3.1%)
Information Technology (0.9%).
Two health care related programs are among
the most sought after programs: Registered
Nursing (2.3%) and Pharmacy (0.7%). Two
construction trades appear in the list of most
sought after programs: Carpentry (1.1%) and
Plumbing (0.9%). Of specific cultural interest,
there was a group of Tribal members (0.7%)
who expressed interest in American
Indian/Native American Studies.
Table 14: Training Program of Most Interest
Education or Training Program of Most Interest to Tribal Members
Program % Tribal
Members
Business Administration, Management and Operations 7.3%
Commercial Vehicle Operator 6.7%
Automotive Mechanics Technology 4.1%
Computer and Information Sciences, General 3.6%
Network and System Administration/ Administrator 3.1%
Registered Nursing 2.3%
Electrical and Electronics Engineering 1.5%
Social Work 1.5%
Accounting and Related Services 1.3%
Culinary Arts and Related Services 1.1%
Carpentry/Carpenter 1.1%
Information Technology 0.9%
Education, General 0.9%
Plumbing Technology/Plumber 0.9%
Forestry, General 0.8%
Law Enforcement, Fire Fighting, and Related 0.8%
American Indian/Native American Studies 0.7%
Pharmacy, Pharmaceutical Sciences 0.7%
Entrepreneurial and Small Business Operations 0.5%
Human Resources Management 0.5%
High School Equivalence Certificate Program 0.5%
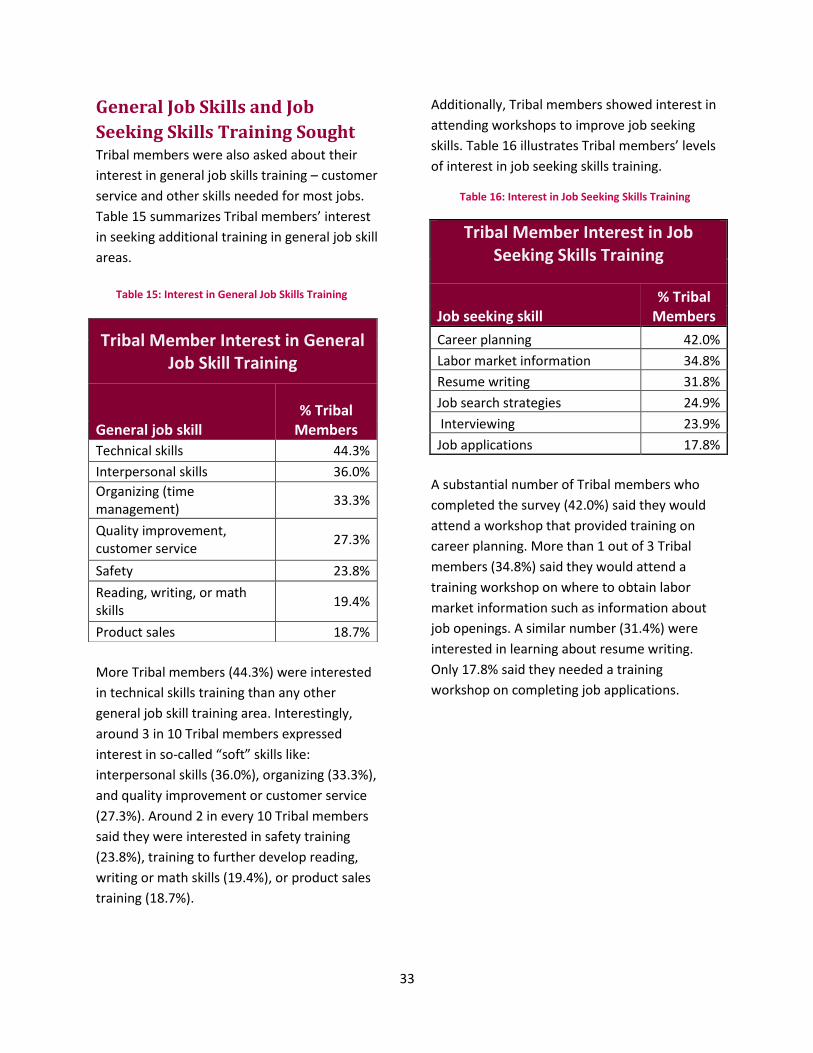
33
General Job Skills and Job
Seeking Skills Training Sought Tribal members were also asked about their
interest in general job skills training – customer
service and other skills needed for most jobs.
Table 15 summarizes Tribal members’ interest
in seeking additional training in general job skill
areas.
More Tribal members (44.3%) were interested
in technical skills training than any other
general job skill training area. Interestingly,
around 3 in 10 Tribal members expressed
interest in so-called “soft” skills like:
interpersonal skills (36.0%), organizing (33.3%),
and quality improvement or customer service
(27.3%). Around 2 in every 10 Tribal members
said they were interested in safety training
(23.8%), training to further develop reading,
writing or math skills (19.4%), or product sales
training (18.7%).
Additionally, Tribal members showed interest in
attending workshops to improve job seeking
skills. Table 16 illustrates Tribal members’ levels
of interest in job seeking skills training.
A substantial number of Tribal members who
completed the survey (42.0%) said they would
attend a workshop that provided training on
career planning. More than 1 out of 3 Tribal
members (34.8%) said they would attend a
training workshop on where to obtain labor
market information such as information about
job openings. A similar number (31.4%) were
interested in learning about resume writing.
Only 17.8% said they needed a training
workshop on completing job applications.
Table 15: Interest in General Job Skills Training
Tribal Member Interest in General Job Skill Training
General job skill % Tribal
Members
Technical skills 44.3%
Interpersonal skills 36.0%
Organizing (time management)
33.3%
Quality improvement, customer service
27.3%
Safety 23.8%
Reading, writing, or math skills
19.4%
Product sales 18.7%
Table 16: Interest in Job Seeking Skills Training
Tribal Member Interest in Job Seeking Skills Training
Job seeking skill % Tribal
Members
Career planning 42.0%
Labor market information 34.8%
Resume writing 31.8%
Job search strategies 24.9%
Interviewing 23.9%
Job applications 17.8%

34
Interest in Job Training Offered
by CSKT Almost 4 in every 10 Tribal members ages 18-60
who answered the survey (39.0%) said they are
very interested in participating in a new job
training program offered by the Confederated
Salish and Kootenai Tribes. Figure 12 illustrates
the distribution of interest among Tribal
members. An additional 31.3% said they are
somewhat interested in participating. Only
17.9% said that they are somewhat
uninterested or not at all interested in
participating.
Finally, to help Tribal government officials and
others make decisions about targeting
resources; Tribal members were asked which
was most important to them personally:
finding a job
obtaining additional job training, or
obtaining additional education (formal
schooling).
More than 2 out of 10 Tribal members (22.7%)
said obtaining additional education was most
important. A similar fraction (19.7%) said that
finding a job was most important, while 18.6%
said that obtaining additional job training was
most important. Nearly 4 in 10 Tribal members
(39%) said none of these options was important
to them or they chose multiple answers to the
question.
Figure 12: Interest in a New CSKT Job Training Program
39.0%
31.3%
11.8% 2.6%
15.3%
0%
25%
50%
75%
100%
% Tribal Members
Level of Interest in a New CSKT Job Training Program
Not at all interested
Somewhat uninterested
Neither interested nor uninterested
Somewhat interested
Very interested
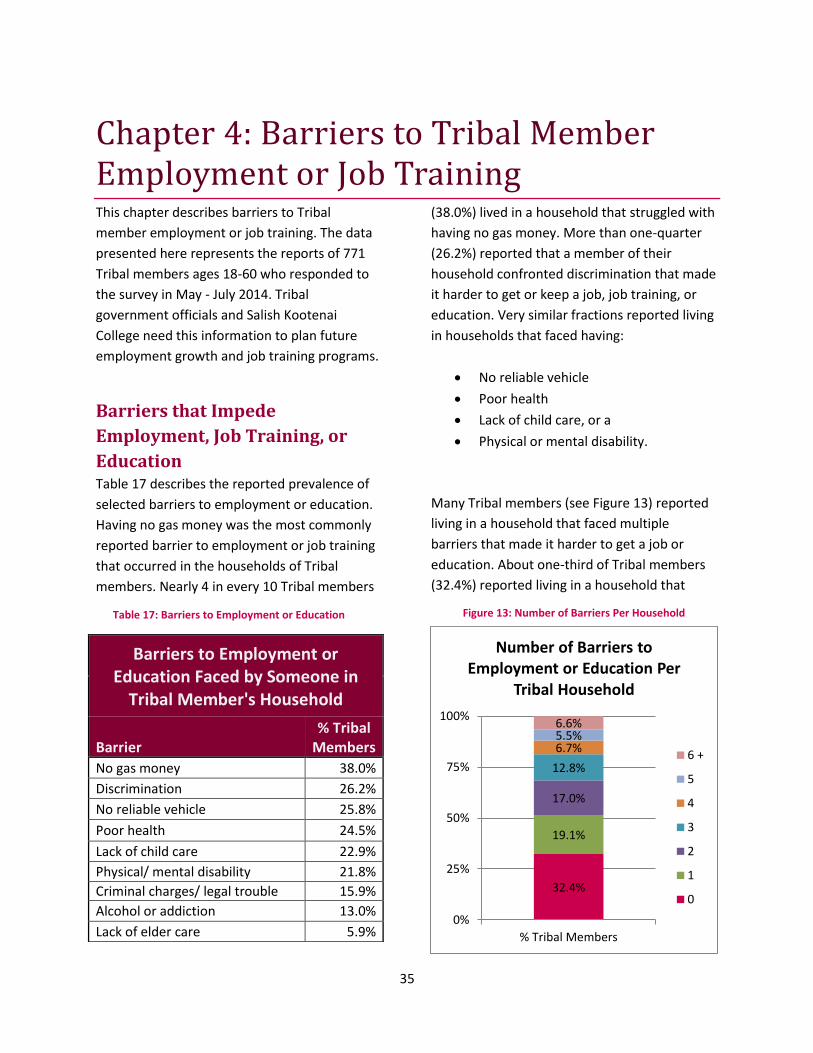
35
32.4%
19.1%
17.0%
12.8%
6.7% 5.5% 6.6%
0%
25%
50%
75%
100%
% Tribal Members
Number of Barriers to Employment or Education Per
Tribal Household
6 +
5
4
3
2
1
0
Figure 13: Number of Barriers Per Household
Chapter 4: Barriers to Tribal Member Employment or Job Training This chapter describes barriers to Tribal
member employment or job training. The data
presented here represents the reports of 771
Tribal members ages 18-60 who responded to
the survey in May - July 2014. Tribal
government officials and Salish Kootenai
College need this information to plan future
employment growth and job training programs.
Barriers that Impede
Employment, Job Training, or
Education Table 17 describes the reported prevalence of
selected barriers to employment or education.
Having no gas money was the most commonly
reported barrier to employment or job training
that occurred in the households of Tribal
members. Nearly 4 in every 10 Tribal members
(38.0%) lived in a household that struggled with
having no gas money. More than one-quarter
(26.2%) reported that a member of their
household confronted discrimination that made
it harder to get or keep a job, job training, or
education. Very similar fractions reported living
in households that faced having:
No reliable vehicle
Poor health
Lack of child care, or a
Physical or mental disability.
Many Tribal members (see Figure 13) reported
living in a household that faced multiple
barriers that made it harder to get a job or
education. About one-third of Tribal members
(32.4%) reported living in a household that
Table 17: Barriers to Employment or Education
Barriers to Employment or Education Faced by Someone in
Tribal Member's Household
Barrier % Tribal
Members
No gas money 38.0%
Discrimination 26.2%
No reliable vehicle 25.8%
Poor health 24.5%
Lack of child care 22.9%
Physical/ mental disability 21.8%
Criminal charges/ legal trouble 15.9%
Alcohol or addiction 13.0%
Lack of elder care 5.9%

36
confronted none of the barriers listed in Table
1, and 19.1% said that their household faced
only one of the barriers. However, almost half
of all Tribal members (48.5%) said that their
household struggled with two or more of the
barriers listed in Table 17.
Tribal members were also asked whether they,
themselves, experienced selected barriers that
are more specifically related to work, job
training, or education. Table 18 lists these
barriers and the proportions of Tribal members
that experienced those barriers.
More than 4 in 10 Tribal members (43.4%) said
that a lack of money for education or training
made it harder for them, personally, to get or
keep a job, job training, or more education.
Around 3 in 10 Tribal members said they faced
a lack of computer skills, lack of education, lack
of job skills training, or lack or work experience.
About 20.2% said they lacked job search
training.
Most Important Barrier to
Employment, Job Training, or
Education The paragraphs above describe the types of
employment, education, or training barriers
faced by Tribal members. This chapter has also
illustrated the number of Tribal members who
struggle with these barriers, often more than
one at a time. It is just as important to
understand which barriers Tribal members said
were most important. Table 19 lists the barriers
that Tribal members said were most important.
Table 18: Specific Barriers
Job Training or Education-Specific Barriers Experienced by Tribal
Member
Training or education specific barrier
% Tribal Members
Lack of money for education or training 43.4%
Lack of computer skills 33.8%
Lack of education 32.9%
Lack of job skill training 30.7%
Lack of work experience 30.1%
Lack of job search training 20.2%
Table 19: Most Important Barrier
Most Important Barrier to a Job, Job Training, or Education
Problem % Tribal
Members
Lack of education 4.9%
Lack of funds or personal finances 4.5%
Discrimination within Tribe, nepotism, favoritism 4.4%
Lack of available jobs 4.3%
Lack of job training 3.7%
Disability, health 3.6%
Lack of experience 3.6%
No reliable vehicle, no reliable transportation 3.3%
Time (for training, education) 3.1%
No gas money 1.9%
Lack of child care 1.6%
Criminal charges, addiction, felony 1.5%
Age discrimination 1.1%
No driver’s license 1.1%
Discrimination, general 0.7%
Interview or resume writing skills 0.7%
Not knowing where to start, lack of information about programs 0.5%
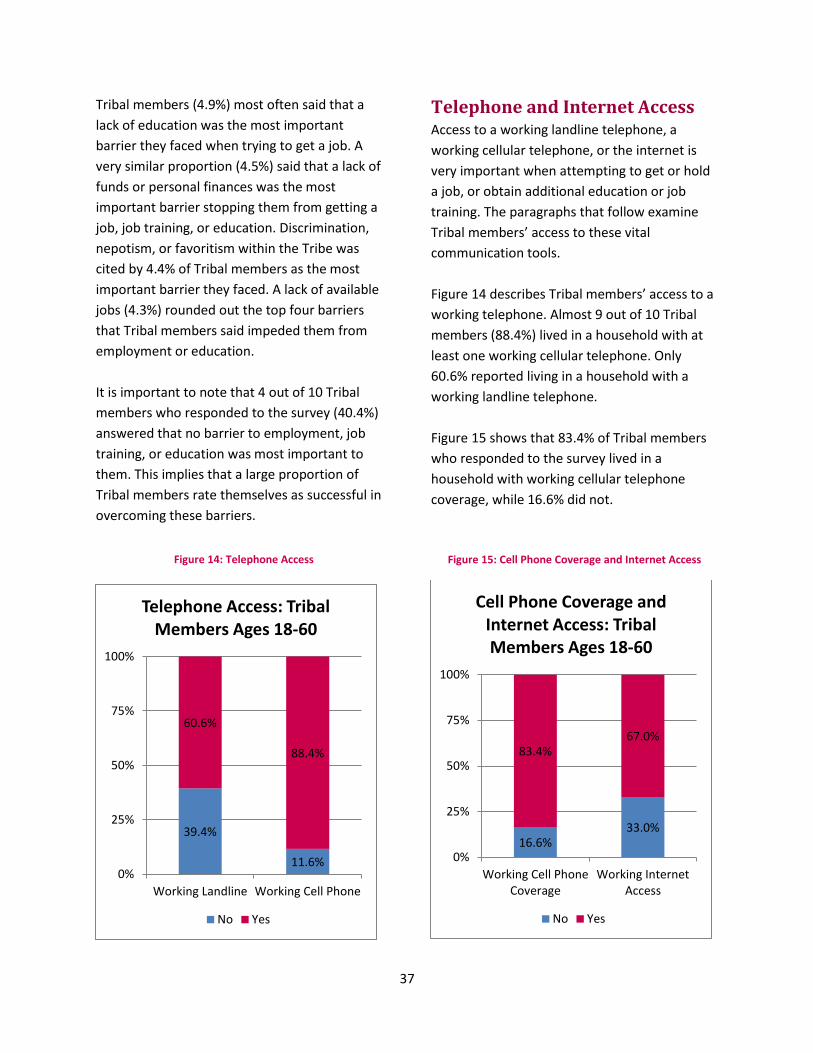
37
39.4%
11.6%
60.6%
88.4%
0%
25%
50%
75%
100%
Working Landline Working Cell Phone
Telephone Access: Tribal Members Ages 18-60
No Yes
Tribal members (4.9%) most often said that a
lack of education was the most important
barrier they faced when trying to get a job. A
very similar proportion (4.5%) said that a lack of
funds or personal finances was the most
important barrier stopping them from getting a
job, job training, or education. Discrimination,
nepotism, or favoritism within the Tribe was
cited by 4.4% of Tribal members as the most
important barrier they faced. A lack of available
jobs (4.3%) rounded out the top four barriers
that Tribal members said impeded them from
employment or education.
It is important to note that 4 out of 10 Tribal
members who responded to the survey (40.4%)
answered that no barrier to employment, job
training, or education was most important to
them. This implies that a large proportion of
Tribal members rate themselves as successful in
overcoming these barriers.
Telephone and Internet Access Access to a working landline telephone, a
working cellular telephone, or the internet is
very important when attempting to get or hold
a job, or obtain additional education or job
training. The paragraphs that follow examine
Tribal members’ access to these vital
communication tools.
Figure 14 describes Tribal members’ access to a
working telephone. Almost 9 out of 10 Tribal
members (88.4%) lived in a household with at
least one working cellular telephone. Only
60.6% reported living in a household with a
working landline telephone.
Figure 15 shows that 83.4% of Tribal members
who responded to the survey lived in a
household with working cellular telephone
coverage, while 16.6% did not.
Figure 15: Cell Phone Coverage and Internet Access
16.6% 33.0%
83.4% 67.0%
0%
25%
50%
75%
100%
Working Cell PhoneCoverage
Working InternetAccess
Cell Phone Coverage and Internet Access: Tribal Members Ages 18-60
No Yes
Figure 14: Telephone Access
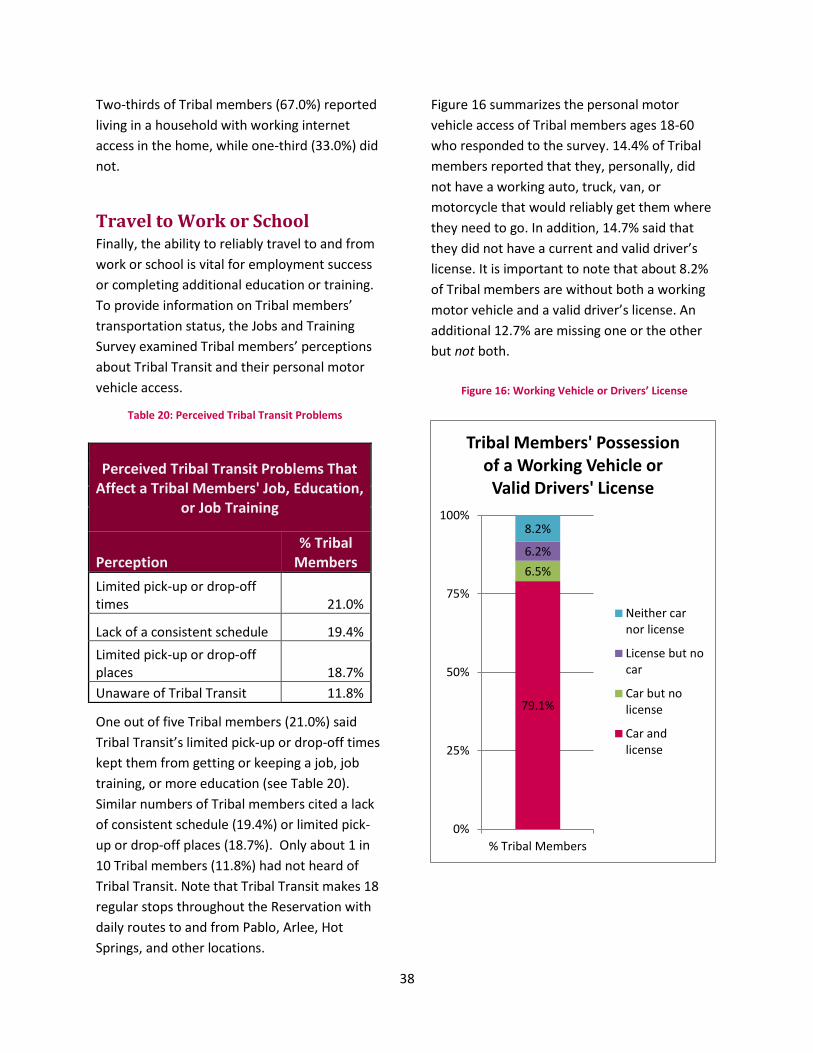
38
Two-thirds of Tribal members (67.0%) reported
living in a household with working internet
access in the home, while one-third (33.0%) did
not.
Travel to Work or School Finally, the ability to reliably travel to and from
work or school is vital for employment success
or completing additional education or training.
To provide information on Tribal members’
transportation status, the Jobs and Training
Survey examined Tribal members’ perceptions
about Tribal Transit and their personal motor
vehicle access.
One out of five Tribal members (21.0%) said
Tribal Transit’s limited pick-up or drop-off times
kept them from getting or keeping a job, job
training, or more education (see Table 20).
Similar numbers of Tribal members cited a lack
of consistent schedule (19.4%) or limited pick-
up or drop-off places (18.7%). Only about 1 in
10 Tribal members (11.8%) had not heard of
Tribal Transit. Note that Tribal Transit makes 18
regular stops throughout the Reservation with
daily routes to and from Pablo, Arlee, Hot
Springs, and other locations.
Figure 16 summarizes the personal motor
vehicle access of Tribal members ages 18-60
who responded to the survey. 14.4% of Tribal
members reported that they, personally, did
not have a working auto, truck, van, or
motorcycle that would reliably get them where
they need to go. In addition, 14.7% said that
they did not have a current and valid driver’s
license. It is important to note that about 8.2%
of Tribal members are without both a working
motor vehicle and a valid driver’s license. An
additional 12.7% are missing one or the other
but not both.
Figure 16: Working Vehicle or Drivers’ License
Table 20: Perceived Tribal Transit Problems
Perceived Tribal Transit Problems That Affect a Tribal Members' Job, Education,
or Job Training
Perception % Tribal
Members
Limited pick-up or drop-off times 21.0%
Lack of a consistent schedule 19.4%
Limited pick-up or drop-off places 18.7%
Unaware of Tribal Transit 11.8% 79.1%
6.5%
6.2%
8.2%
0%
25%
50%
75%
100%
% Tribal Members
Tribal Members' Possession of a Working Vehicle or
Valid Drivers' License
Neither carnor license
License but nocar
Car but nolicense
Car andlicense

39
Chapter 5: Gaps in the Tribal Workforce This chapter focuses on the job and education
experiences and interests of groups of Tribal
members who are underemployed or who
confront other noteworthy challenges in the
labor force. The information presented here is
summarized from the reports of 771 Tribal
members ages 18-60 who responded to the
survey in May - July 2014. Tribal government
officials, Salish Kootenai College, and others
need this information to identify training gaps
in the Tribal workforce and plan future
employment growth and job training programs.
Unemployed or Not in the Labor
Force: Ages 18-60 Perhaps the most obvious gap in the Tribal
workforce ages 18-60 is represented by the
11.2% who were unemployed and the 19.7%
who were not in the labor force. To be
considered unemployed, a survey respondent
had to report that they were:
not working in the week prior to the
survey
not on vacation or off due to a
temporary illness or maternity leave
actively looking for work in the previous
four weeks.
To be considered not in the labor force a
respondent had to classify themselves as all of
the following:
not working in the week prior to the
survey
not on layoff from a job
not on vacation or off due to a
temporary illness or maternity leave
not actively looking for work during the
previous four weeks.
Occupations and Education
Attained Table 21 presents the 10 most commonly
reported previous occupations among
unemployed Tribal members or those who were
not in the labor force. The majority of
occupations listed in Table 1 are low-skill or
entry-level occupations.
Table 21: Occupations of Unemployed Tribal Members
Occupations of Unemployed Tribal Members or Those Not in the Labor Force,
Ages 18-60
Rank Unemployed Not in Labor Force
1 Janitors and Cleaners Assemblers and Fabricators
2 Cabinetmakers and Bench Carpenters Janitors and Cleaners
3 Home Health Aides Dishwashers
4 Firefighters Maids and Housekeeping Cleaners
5 Security Guards Farmers and Ranchers
6 Dishwashers Home Health Aides
7
Maids and Housekeeping Cleaners Cashiers
8
Bookkeeping, Accounting, Auditing Clerks
Secretaries and Administrative Assistants
9 Gaming Cage Workers Farm Workers and Laborers
10 Farmworkers and Laborers
Cabinetmakers and Bench Carpenters

40
Persons with low-skill occupations like those
most common among unemployed Tribal
members may be relatively easy to employ.
However, the nature of these jobs is that they
tend to be temporary, they are often part-time,
and they are most often low wage jobs.
Figure 17 outlines the levels of education
completed by Tribal members who were
unemployed or who were not in the labor force.
The education attainment gaps present are
apparent in this chart.
Unemployed Tribal members (17.3%) or those
who were not in the labor force (17.6%) were
significantly more likely to have earned less
than a high school diploma or G.E.D. than were
all Tribal members (9.7%). On the other end of
the education spectrum, Tribal members as a
whole were much more likely to have earned at
least a Bachelor’s Degree (19.5%) than were the
unemployed (6.2%) or those who were not in
the labor force (11.3%).
Job and Education Interests Nearly all of the unemployed Tribal members
(93.9%) said that they were interested in
looking for a new job. Interestingly, almost 3 in
5 Tribal members who were not in the labor
force (58.9%) also said that they were
interested in looking for a new job.
Nearly 6 in 10 unemployed Tribal members
(59.0%) were very interested in seeking further,
job-related education or training. An additional
30.1% of unemployed Tribal members were
somewhat interested. Fewer Tribal members,
who were not in the labor force (44.8%), said
they were very interested in additional
education or training.
1 in 5 Tribal members
who were not in the
labor force (21.1%)
said they were
somewhat interested
in additional
education or job
training.
Finally, 6 in 10 Tribal
members who were
unemployed (60.2%)
said they were very
interested in
participating in a new
job training program
offered by CSKT. Only
38.1% of those not in
the labor force were
very interested.
17.3% 17.6% 9.7%
27.2% 26.1%
20.6%
37.0% 33.8%
37.4%
12.3% 11.3%
12.8%
6.2% 11.3%
19.5%
0%
25%
50%
75%
100%
Unemployed Not in laborforce
All Tribalmembers
Education Completed by Tribal Members Ages 18-60: Unemployed or Not in Labor Force
Bachelors Degree or higher
Associates Degree or JobCorps completion
HS Diploma or GED andsome college or training
HS Diploma or GED only
Less than HS Diploma orGED
Figure 17: Education Completed by the Unemployed

41
Unemployed Tribal members or those who
were not in the labor force reported they aspire
to occupations that are greater than entry-level
or that require more skill or education. Table 22
presents the most frequently mentioned
occupations that the unemployed or those not
in the labor force said interested them most.
Nearly all of the occupations that interest
unemployed Tribal members or those not in the
labor force require at least a G.E.D. Many
require a Bachelor’s Degree. As the data
presented in Figure 1 and Table 2 indicates,
there is a gap between the level of education
attained by unemployed Tribal members and
the level they need to reach their job goals.
Among unemployed Tribal members or those
who were not in the labor force, reports on the
education or training programs that interest
them most are particularly thought-provoking.
Table 23 presents the specific education or
training programs in which these Tribal
members were most interested.
Table 22: Occupation Interests of the Unemployed
Occupation Interests of Tribal Members: Unemployed or Not in
Labor Force
Rank Unemployed Not in Labor
Force
1 Teachers, all Managers, general
2
Food Preparation and Serving Workers
Accountants and Auditors
3 Financial Clerks Registered Nurses
4
Receptionists and Information Clerks Managers, Other
5 Managers, General Wildlife Biologists
6
Community and Social Service Specialists
Community and Social Service Specialists
7 Registered Nurses
Child, Family, and School Social Workers
8 Cooks Lawyers
9
Forest, Conservation, and Logging Workers Craft Artists
10 Farmers and Ranchers
Writers and Authors
Table 23: Education Interests of the Unemployed
Education or Training Programs of Most Interest: Unemployed or Not
in Labor Force
Rank Unemployed Not in labor
force
1
Automotive Mechanics Technology
Commercial Vehicle Operator
2 Commercial Vehicle Operator
Network and System Administration
3
Electrical and Electronics Engineering Registered Nursing
4
Business Administration, Management and Operations
Business Administration, Management and Operations
5
Computer and Information Sciences, General
Automotive Mechanics Technology
6 Cosmetology, Barber
Computer and Information Sciences
7 Culinary arts and related services
Carpentry/ Carpenter
8 Education, General NA
9 Social Work NA
10 Information Technology NA

42
In many cases there does appear to be logical
consistency between reports of occupation
aspirations and education program choices. For
instance: many unemployed Tribal members
reported aspiring to be a Community and Social
Service Specialist and wanted to study Social
Work. Similarly, a significant number of those
not in the labor force aspired to being a
manager and chose to study business
administration. In other instances consistency
of answers was less clear cut but this does not,
necessarily, indicate a lack of career direction. A
face-to-face conversation is needed to
determine this.
Barriers Finally, any Tribal effort to close the
workforce gaps posed by unemployed
Tribal members or by those not in the
Tribal labor force should address the
barriers these Tribal members confront.
Table 24 presents the barriers to
employment or education that
unemployed Tribal members or those who
were not in the labor force reported were
most important to them. Chapter 4
provides a more comprehensive analysis of
job barriers faced by Tribal members.
Unemployed Tribal members most often
said that a lack of work experience was the
most important barrier they faced when
trying to get a job. Tribal members who
were not in the labor force said that a
disability or their personal health was the
most important barrier they faced.
For the unemployed, a lack of education,
and a lack of job training round out the top
four most important barriers. No reliable
vehicle, a lack of job training, and a lack of work
experience are the other three most important
barriers for those who were not in the labor
force.
For a job training program to be effective
among unemployed Tribal members the
findings of this survey imply that the program
should provide not only training or education
but actual work experience. An effective
training program targeted at those who were
no longer in the labor force will need to address
the requirements of disabled Tribal members or
those with significant health challenges.
Table 24: Most Important Job Barrier to the Unemployed
Most Important Barrier to a Job, Job Training, or Education: Unemployed or Not
in Labor Force
Rank Unemployed Not in labor force
1 Lack of experience Disability, health
2 Lack of available jobs No reliable vehicle, no reliable transportation
3 Lack of education Lack of job training
4 Lack of job training Lack of experience
5 Lack of funds or personal finances Lack of child care
6 No reliable vehicle, no reliable transportation
Criminal charges, addiction, felony
7 Criminal charges, addiction, felony Lack of education
8
Discrimination within Tribes, nepotism, favoritism No driver’s license
9 Gas money Lack of available jobs
10 No driver’s license
Discrimination within Tribes, nepotism, favoritism

43
Tribal Members Near or Below
Poverty A second main workforce gap is the relatively
large proportion of Tribal members who live in
low income households when compared to
Whites. To examine this gap, the paragraphs
that follow describe Tribal members who live in
households that are below the poverty
threshold, and those who live in households
that are just above the threshold. The poverty
threshold is defined using U.S. government
standards for household poverty as of 2013.6
The data presented here use the information
gathered by the income question of the Jobs
and Training Survey. When compared to U.S.
Census Bureau data, the Jobs and Training
Survey income data appears quite reliable. The
Jobs and Training Survey found that the
median, 2013 household income for all
responding Tribal members was $29,000. The
U.S. Census Bureau’s American Community
Survey (ACS) 5-Year estimates for 2008-2012
6U.S. Centers for Medicare and Medicaid Services,
http://www.cms.gov/. A table of thresholds by household size is in Appendix 1.
found a median household income for
American Indians living on the Flathead
Reservation of $28,284. The Job and Training
Survey median income is well within the ACS
margin of error of +/- $3,008.
One way to quantify the income gap of Tribal
members is to compare the proportion of Tribal
members who live under the poverty threshold
to Whites. Figure 18 presents the proportion of
Tribal members who live under the poverty
threshold, and compares this number to that
found in the U.S. Census Bureau’s ACS for
American Indians living on the Flathead
Reservation and Whites living on the
Reservation. Nearly 2 in 5 Tribal members ages
18-60 (36.1%) lived in a household at or below
the poverty threshold according to the Jobs and
Training Survey. In contrast, about 1 in 5 Whites
(20.1%) who lived on the Flathead Reservation
ages 18-64 lived in households at or below the
threshold.
Readers may note that U.S. Census Bureau’s
2008-2012 ACS found a slightly lower
proportion of American Indians living at or
below poverty (30.2%) when compared to
the Jobs and Training Survey finding.
However, this difference is within the ACS
margin of sampling error. Readers should
also keep in mind that the ACS does not
publish the proportions of persons on the
Flathead Reservation who live in near-
poverty households, or within 101%-150%
of the poverty threshold. 20.1% 30.2% 36.1%
79.9% 69.8% 63.9%
0%
25%
50%
75%
100%
2008-2012 ACSWhites on Flathead
Res*
2008-2012 ACS AmIndians on Flathead
Res
2014 TribalMembers*
* Difference significant at 90% confidence level
Tribal Member Poverty: Ages 18-60
Below poverty Above poverty
Figure 18: Tribal Member Poverty

44
Occupations and Education
Attained
Table 25 describes the most common
occupations of Tribal members who live in
households near or below the poverty
threshold. In this report near-poverty means
households at 101%-150% of the poverty
threshold.
Most Tribal members who lived in a household
below the poverty threshold worked in entry-
level or lower-skill occupations.
These occupations included:
Janitors
Home Health Aides
Landscaping Workers
Cashiers
Dishwashers, and
Maids.
Tribal members who lived in near-poverty
households reported working in an
interesting mix of lower-skill and higher skill
occupations. The higher skill occupations
reported by those who lived in near-
poverty included:
Accountants and Auditors
Teachers
Rehabilitation Counselors, and
Community and Social Service
Specialists.
The lower skill occupations reported by
near-poverty Tribal members also required
significant training, and included home
health aides, woodworking machine
operators, and truck and tractor operators.
It is apparent that most Tribal members
who live below the poverty threshold
require additional education or training to
advance beyond their entry level
occupations. However, many Tribal
members living in near-poverty households
already have significant levels of job
training.
Table 25: Occupations of Low-Income Tribal Members
Occupations of Tribal Members Near or Below Poverty: Ages 18-60
Rank 0%-100% of poverty 101%-150% of
poverty
1 Janitors and Cleaners Home Health Aides
2 Home Health Aides
Office and Administrative Support Workers
3
Landscaping and Grounds Keeping Workers
Accountants and Auditors
4 Cashiers
Preschool, Primary, Secondary, and Special Education School Teachers
5 Dishwashers Receptionists and Information Clerks
6 Maids and Housekeeping Cleaners
Secretaries and Administrative Assistants
7 Farmers, Ranchers
Woodworking Machine Setters, Operators, and Tenders
8 Cooks, Institution and Cafeteria
Industrial Truck and Tractor Operators
9 Farmworkers and Laborers
Rehabilitation Counselors
10 Automotive Service Technicians
Community and Social Service Specialists
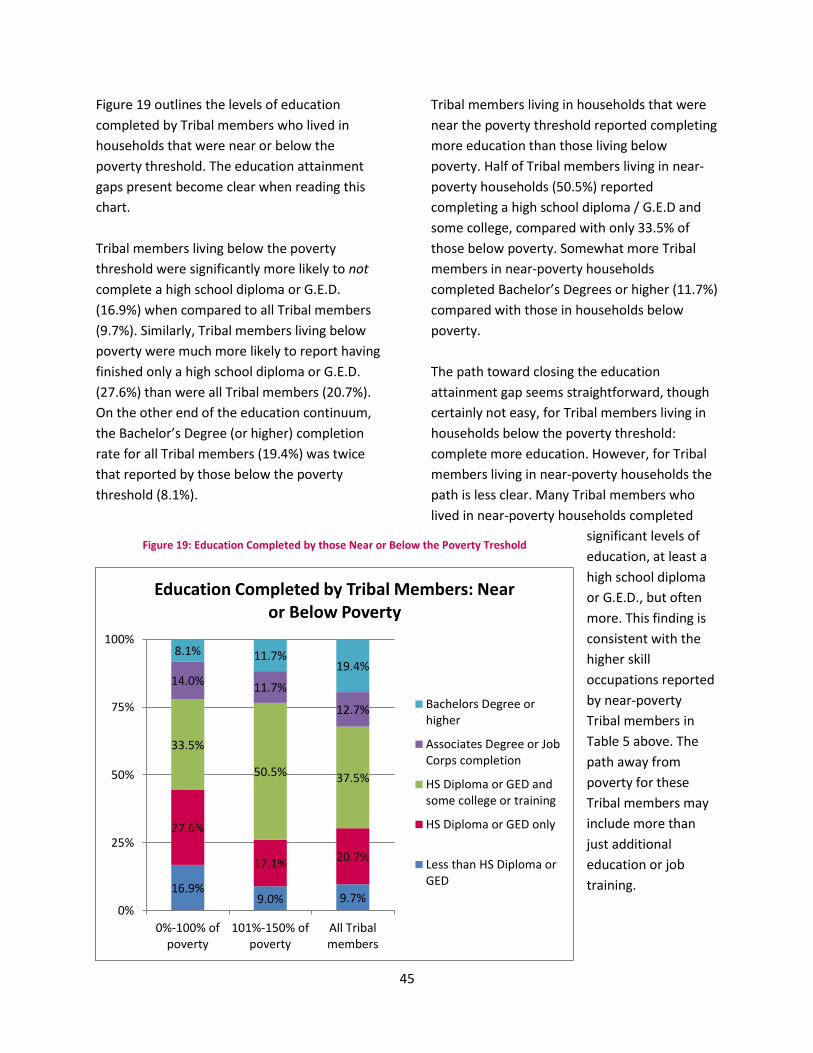
45
Figure 19 outlines the levels of education
completed by Tribal members who lived in
households that were near or below the
poverty threshold. The education attainment
gaps present become clear when reading this
chart.
Tribal members living below the poverty
threshold were significantly more likely to not
complete a high school diploma or G.E.D.
(16.9%) when compared to all Tribal members
(9.7%). Similarly, Tribal members living below
poverty were much more likely to report having
finished only a high school diploma or G.E.D.
(27.6%) than were all Tribal members (20.7%).
On the other end of the education continuum,
the Bachelor’s Degree (or higher) completion
rate for all Tribal members (19.4%) was twice
that reported by those below the poverty
threshold (8.1%).
Tribal members living in households that were
near the poverty threshold reported completing
more education than those living below
poverty. Half of Tribal members living in near-
poverty households (50.5%) reported
completing a high school diploma / G.E.D and
some college, compared with only 33.5% of
those below poverty. Somewhat more Tribal
members in near-poverty households
completed Bachelor’s Degrees or higher (11.7%)
compared with those in households below
poverty.
The path toward closing the education
attainment gap seems straightforward, though
certainly not easy, for Tribal members living in
households below the poverty threshold:
complete more education. However, for Tribal
members living in near-poverty households the
path is less clear. Many Tribal members who
lived in near-poverty households completed
significant levels of
education, at least a
high school diploma
or G.E.D., but often
more. This finding is
consistent with the
higher skill
occupations reported
by near-poverty
Tribal members in
Table 5 above. The
path away from
poverty for these
Tribal members may
include more than
just additional
education or job
training. 16.9% 9.0% 9.7%
27.6%
17.1% 20.7%
33.5%
50.5% 37.5%
14.0% 11.7%
12.7%
8.1% 11.7% 19.4%
0%
25%
50%
75%
100%
0%-100% ofpoverty
101%-150% ofpoverty
All Tribalmembers
Education Completed by Tribal Members: Near or Below Poverty
Bachelors Degree orhigher
Associates Degree or JobCorps completion
HS Diploma or GED andsome college or training
HS Diploma or GED only
Less than HS Diploma orGED
Figure 19: Education Completed by those Near or Below the Poverty Treshold

46
Job and Education Interests Tribal members living in households near or
below poverty reported a significant level of
motivation to get a new job, job training, or
education. Four of five Tribal members living in
below-poverty households (78.3%) expressed
interest in getting a new job. A similar but
slightly lower number of Tribal members living
in near-poverty households (68.1%) said they
wanted to find a new job.
A majority of Tribal members below the poverty
threshold (54.3%) reported being very
interested in additional, job-related education
or training. Even more Tribal members who
lived in near-poverty households (61.1%) were
very interested. An additional 29.3% of Tribal
members living below poverty said they were
somewhat interested in additional education or
training. A slightly lower number of Tribal
members living in near-poverty households
(21.2%) reported that they were somewhat
interested.
Finally, almost half of Tribal members who lived
in households below the poverty threshold
(47.8%) reported that they were very interested
in participating in a new, CSKT job training
program. Almost 3 in 10 Tribal members below
poverty (29.1%) said they were somewhat
interested. More than half of Tribal members
living in near-poverty households (53.5%) were
very interested in participating in a CSKT job
training program. Another 21.9% of those in
near-poverty households were somewhat
interested.
Tribal members who lived in households near or
below poverty wanted to get jobs requiring
greater levels of skill or responsibility. Table 26
lists the most commonly cited new jobs that
most interested these Tribal members.
The jobs reported in Table 26 demonstrate that
there is an education and training gap between
the occupations Tribal members currently have
(Table 25), and occupations to which they
aspire. This is particularly true among Tribal
members who live below the poverty threshold.
Table 26: Occupation Interests of those Below Poverty
Occupation Interests of Tribal Members: Near or Below Poverty
Rank 0%-100% of
poverty 101%-150% of
poverty
1
Office and Administrative Support Workers
Financial Specialists
2 Manager, General Manager, General
3 Financial Specialists
Computer Occupations, All
4
Forest, Conservation, and Logging Workers
Teachers and Instructors, All
5 Registered Nurses
Supervisors of Office and Administrative Support Workers
6 Cooks
Office and Administrative Support Workers
7 Construction Trades Workers Wildlife Biologists
8 Computer Occupations, All
Counselors, Social Workers, and Other
9
Counselors, Social Workers, and Other
Community and Social Service Specialists
10 Teachers and Instructors, All Registered Nurses

47
Table 27 presents the specific education or
training programs in which Tribal members
living in households near or below poverty were
most interested.
More Tribal members who lived in households
near or below the poverty threshold were
interested in a training program to become a
commercial vehicle operator than any other
program. There were several other programs in
which Tribal members in both low-income
groups expressed most interest. These
programs included:
Automotive Mechanics Technology
Network and System Administration
Registered Nursing
Computer and Information Sciences,
General
Business
Administration, Management
and Operations
Social Work
The range of education or job
training programs in which low
income Tribal members were
most interested should provide
CSKT Tribal Government, Salish
Kootenai College, Kicking Horse
Job Corps Center, and others
reason for optimism. Many of
the programs listed in Table 7
are readily available. In
addition, the largest employers
on the Flathead Reservation
(CSKT, Salish Kootenai College,
S & K Electronics) hire people
with these skills.
Table 27: Education Interests of those Near or Below the Poverty Treshold
Education or Training Programs of Most Interest: Tribal Members Near or Below Poverty
Rank 0%-100% of poverty 101%-150% of poverty
1 Commercial Vehicle Operator Commercial Vehicle Operator
2 Automotive Mechanics Technology
Business Administration, Management and Operations
3 Network and System Administration
Computer and Information Sciences, General
4 Registered Nursing Network and System Administration
5 Computer and Information Sciences, General
Automotive Mechanics Technology
6
Business Administration, Management and Operations Social Work
7 Social Work Registered Nursing
8 Forestry, General Information Technology
9 Culinary Arts Law Enforcement, Firefighting, and Related
10 Electrical and Electronics Engineering Carpentry/Carpenter

48
Barriers The barriers that hold low income Tribal
members back as they try to get a job, job
training, or additional education need to be
addressed when planning future job training or
education programs. Table 28 lists the most
important barriers as reported by low income
Tribal members.
A disability or personal health was reported by
low income Tribal members as the most
important barrier that impedes them personally
from getting a job, job training, or additional
education.
Among Tribal members who lived in a
household below the poverty threshold, the
following barriers were also ranked near the
top:
Lack of education
No reliable vehicle, no reliable
transportation
Lack of experience
Discrimination within the Tribes,
nepotism, or favoritism
The top ranked barriers
according to Tribal members
who lived in near-poverty
households included:
Lack of job training
Discrimination within
the Tribes, nepotism, or
favoritism
Lack of funds
Lack of available jobs
An effective training program
targeted at low income Tribal
members should address the
requirements of the disabled
or those with health issues.
It is also important to note that
only 4.4% of all respondents
said that discrimination within
the Tribes, nepotism, or
favoritism was a concern. Tribal Personnel
Ordinance 69C prohibits supervision of an
employee who is a member of the supervisor’s
immediate family. If an applicant applied for a
position where this could be the case, the
applicant would be ineligible for the position
and would not be interviewed.
Table 28: Most Important Job Barrier to those Below the Poverty Threshold
Most Important Barrier to a Job, Job Training, or Education: Tribal Members Near or Below Poverty
Rank 0%-100% of poverty 101%-150% of poverty
1 Disability, health Disability, health
2 Lack of education Lack of job training
3 No reliable vehicle, no reliable transportation
Discrimination within Tribes, nepotism, favoritism
4 Lack of experience Lack of funds or personal finances
5 Discrimination within Tribes, nepotism, favoritism Lack of available jobs
6 Lack of job training Lack of education
7 Lack of funds or personal finances Lack of experience
8 Lack of child care No reliable vehicle, no reliable transportation
9 No gas money Age discrimination
10 Lack of available jobs Criminal charges, addiction, felony

49
Young Adult Tribal Members This section of the report focuses on young
adult Tribal members, those ages 18-34. Much
of CSKT’s potential for achievement in the labor
force resides with its young adults. This is the
reason the following paragraphs describe the
job and education experiences, interests, and
barriers to success of young adults. The data
presented here summarize the reports of 201
young adult Tribal members who completed the
Jobs and Training Survey. Readers should note
that evaluating the survey data for workforce
achievement gaps is not always appropriate
with this group, since they are just beginning
their labor force experiences.
Occupations and Education
Attained Table 29 presents the 10 most frequently
reported occupations among Tribal members
ages 18-34. The complete inventory of
occupations held by young adult Tribal
members is quite diverse; they reported
working in a total of 73 different occupations.
Figure 20 presents the levels of education
completed by Tribal members ages 18-34 and
compares their levels of education to those of
all Montanans ages 18-34.7
Figure 20: Education Completed by Young Adults
An education attainment gap is apparent in
Figure 4. Proportionately more Tribal members
ages 18-34 (15.2%) had not completed high
school or a G.E.D. than had all Montanans ages
18-34 (11.0%). Similarly, fewer young adult
Tribal members had completed Bachelor’s
Degrees (13.7%) than had all of Montana’s
young adults.
7 U.S. Census Bureau 2008-2012 American
Community Survey 5-Year Estimates.
15.2% 11.0%
71.1% 68.8%
13.7% 20.2%
0%
25%
50%
75%
100%
Tribal Members18-34
All Montanans 18-34
Education Completed by Tribal Members: Ages 18-34
Bachelor's degree or higher
HS diploma or GED only, or HS diploma/ GEDand some college or AA degree
Less than high school graduateTable 29: Occupations of Young Adults
Occupations of Tribal Members 18-34
Rank Occupation
1 Financial Specialists
2 Office and Administrative Support Workers
3 Supervisors of Office and Administrative Support Workers
4 Forest, Conservation, and Logging Workers
5 Construction Trades Workers
6 Wildlife Biologists
7 Teachers and Instructors, All
8 Registered Nurses
9 Substance Abuse and Behavioral Disorder Counselors
10 Community and Social Service Specialists

50
Job and Education Interests Young adult Tribal members expressed a high
level of motivation to get a new job, additional
job training, or more education. Nearly three –
quarters of young adult Tribal members (74.1%)
said they were interested in looking for a new
job. Almost two-thirds of Tribal members ages
18-34 (63.7%) said they were very interested in
seeking additional, job-related education or
training. An additional 26.4% were somewhat
interested in additional, job-related education
or training. Finally, almost half of young adult
Tribal members (49.3%) reported that they
were very interested in participating in a new
job training program offered by CSKT. Another
one-third (33.3%) said they were somewhat
interested.
Table 30 lists the future jobs that most
interested young adult Tribal members.
The high degree of consistency between young
adult Tribal members’ current occupations
(Table 9) and their desired future occupations
(Table 10) implies some level of satisfaction
with young adults’ career choices.
Table 31 describes the future education or job
training programs that most interested Tribal
members ages 18-34.
It is important to note interest among some
young adult Tribal members in seeking a High
School Equivalence Certificate Program. This
step is vital for their future employment
prospects.
Table 30: Occupation Interests of Young Adults
Education or Training Program of Interest: Tribal Members 18-34
Rank Program
1 Commercial Vehicle Operator
2 Automotive Mechanics Technology
3 Business Administration, Management and Operations
4 Registered Nursing
5 Network and System Administration
6 Computer and Information Sciences, General
7 Social Work
8 Law Enforcement, Firefighting and Related
9 Carpentry/ Carpenter
10 High School Equivalence Certificate Program
Table 31: Education Interests of Young Adults
Occupation Interests of Tribal Members 18-34
Rank Occupation
1 Financial Specialists
2 Office and Administrative Support Workers
3 Construction Trades Workers
4 Forest, Conservation, and Logging Workers
5 Registered Nurses
6 Supervisors of Office and Administrative Support Workers
7 Secretaries and Administrative Assistants
8 Managers, General
9 Wildlife Biologists
10 Teachers and Instructors, All

51
Barriers The barriers that impede the ability of young
adult Tribal members to get a job, job training,
or education have a particularly high impact
since so much of CSKT’s potential for success in
the labor force is found in this group. Table 32
lists the job or education barriers that Tribal
members ages 18-34 rated as most important
to them personally.
Since young adult Tribal members are just
beginning their labor force experiences, it
makes sense that the two most important
barriers cited by them were lack of job
experience and lack of education. Rounding out
the top 5 ranked barriers was:
No reliable vehicle, no reliable
transportation
Lack of child care
Lack of funds or personal finances
Female Tribal Members The last section of this chapter concentrates on
female Tribal members, ages 18-60. The female-
to-male earnings ratio for full-time, year-round
workers ages 16 and older is 0.767 (+/-0.001) in
the United States.8 This earnings gap is thought,
in part, to be due to differences in the
occupations of men and women and differences
in the education experiences of men and
women. The data examined here summarizes
responses from 412 female Tribal members. As
Figure 21 shows, the proportion of women who
responded to this survey is nearly identical to
that found by U.S. Census Bureau.
Figure 21: % Male and Female
8 Day, J.C. and Downs, B. “Examining the Gender
Earnings Gap: Occupational Differences and the Life Course.” U.S. Census Bureau: March 31, 2007. http://www.census.gov/people/io/files/GenderEarningsGap.pdf
46.5% 47.4%
53.5% 52.6%
0%
25%
50%
75%
100%
Tribal MembersAges 18-60, 2014
Survey
American Indianson Flathead Res
Ages 18-64, 2008-2012 ACS
Sex of Tribal Members Ages 18-60
Male Female
Table 32: Most Important Job Barrier to Young Adults
Most Important Barrier to a Job, Job Training, or Education: Tribal
Members 18-34
Rank Barrier
1 Lack of experience
2 Lack of education
3 No reliable vehicle, no reliable transportation
4 Lack of child care
5 Lack of funds or personal finances
6 Lack of available jobs
7 Discrimination within Tribes, nepotism, favoritism
8 No gas money
9 Criminal charges, addiction, felony
10 Disability, health

52
Occupations and Education
Attained
Table 33 presents the most frequently reported
occupations among female Tribal members.
Table 33: Occupations of Women
Occupations of Female Tribal Members
Rank Occupation
1 Secretaries and Administrative Assistants
2 Accountants and Auditors
3 Home Health Aides
4 Janitors and Cleaners
5 Cashiers
6 Maids and Housekeeping Cleaners
7 Bookkeeping, Accounting, and Auditing Clerks
8 Office and Administrative Support Workers, All Other
9 Other Management Occupations
10 Nursing Assistants
Clerical or administrative jobs dominate the list
of the top 10 occupations of female Tribal
members ages 18-60. All of the remaining
occupations among the top 10 can also be
considered “traditional” female jobs. These jobs
include:
Maids and Housekeeping Cleaners
Janitors and Cleaners
Home Health Aides, and
Nursing Assistants.
Figure 22 presents the levels of education
completed by female Tribal members.
Female Tribal members reported completing
higher levels of education than did males. More
women (22.7%) than men (17.6%) said they
earned a Bachelor’s Degree or more. More men
(11.2%) than women (8.6%) answered that they
had not completed a high school diploma or
G.E.D.
8.6% 11.2%
17.6% 23.3%
36.2%
38.6%
14.9%
9.2%
22.7% 17.6%
0%
25%
50%
75%
100%
Female Male
Education Completed by Sex of Tribal Member
Bachelors Degree or higher
Associates Degree or Job Corps completion
HS Diploma or GED and some college or training
HS Diploma or GED only
Less than HS Diploma or GED
Figure 22: Education Completed by Women

53
Job and Education Interests A significant proportion of female Tribal
members said they were motivated to get a
new job, additional job training, or more
education. Three-fifths of women (61.6%)
reported that they were interested in looking
for a new job. More than half of women (56.4%)
said they were very interested in obtaining
additional, job-related education or training.
Another quarter of women (24.8%) reported
being somewhat interested. Finally, 4 in 10
female Tribal members (40.1%) said they were
very interested in participating in a new, CSKT
job training program. Almost 3 in 10 women
(29.2%) said they were somewhat interested in
a new CSKT job training program.
Table 34 describes prospective jobs that most
interested female Tribal members.
The list of future occupations that most interest
female Tribal members shows that women are
interested in progressing toward management
positions like:
Supervisors of Office and Administrative
Support Workers
Managers, General
Administrative Services Managers
A “non-traditional” job - Forest, Conservation,
and Logging Worker - also appears in the list of
desired future occupations.
Table 35 presents those education or job
training programs that most interested female
Tribal members.
Table 35: Education Interests of Women
Education or Training Program of Interest: Female Tribal Members
Rank Program
1 Business Administration, Management and Operations
2 Network and System Administration
3 Registered Nursing
4 Computer and Information Sciences, General
5 Accounting and Related Services
6 Commercial Vehicle Operator
7 Social Work
8 Culinary Arts
9 Automotive Mechanics Technology
10 Human Resources Management and Services
Table 34: Occupation Interests of Women
Occupation Interests of Female Tribal Members
Rank Occupation
1 Financial Specialists
2 Teachers and Instructors
3 Office and Administrative Support Workers
4 Registered Nurses
5 Secretaries and Administrative Assistants
6 Supervisors of Office and Administrative Support Workers
7 Managers, General
8 Counselors, Social Workers, and Other
9 Forest, Conservation, and Logging Workers
10 Administrative Services Managers
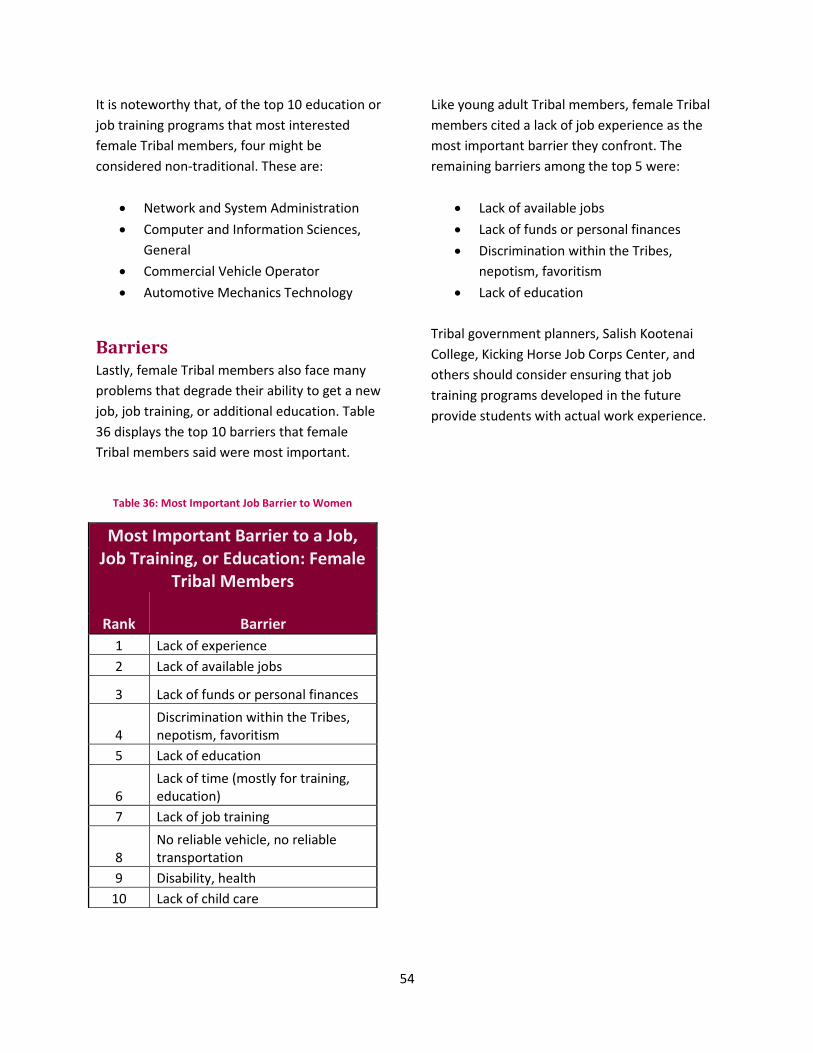
54
It is noteworthy that, of the top 10 education or
job training programs that most interested
female Tribal members, four might be
considered non-traditional. These are:
Network and System Administration
Computer and Information Sciences,
General
Commercial Vehicle Operator
Automotive Mechanics Technology
Barriers Lastly, female Tribal members also face many
problems that degrade their ability to get a new
job, job training, or additional education. Table
36 displays the top 10 barriers that female
Tribal members said were most important.
Like young adult Tribal members, female Tribal
members cited a lack of job experience as the
most important barrier they confront. The
remaining barriers among the top 5 were:
Lack of available jobs
Lack of funds or personal finances
Discrimination within the Tribes,
nepotism, favoritism
Lack of education
Tribal government planners, Salish Kootenai
College, Kicking Horse Job Corps Center, and
others should consider ensuring that job
training programs developed in the future
provide students with actual work experience.
Table 36: Most Important Job Barrier to Women
Most Important Barrier to a Job, Job Training, or Education: Female
Tribal Members
Rank Barrier
1 Lack of experience
2 Lack of available jobs
3 Lack of funds or personal finances
4 Discrimination within the Tribes, nepotism, favoritism
5 Lack of education
6 Lack of time (mostly for training, education)
7 Lack of job training
8 No reliable vehicle, no reliable transportation
9 Disability, health
10 Lack of child care
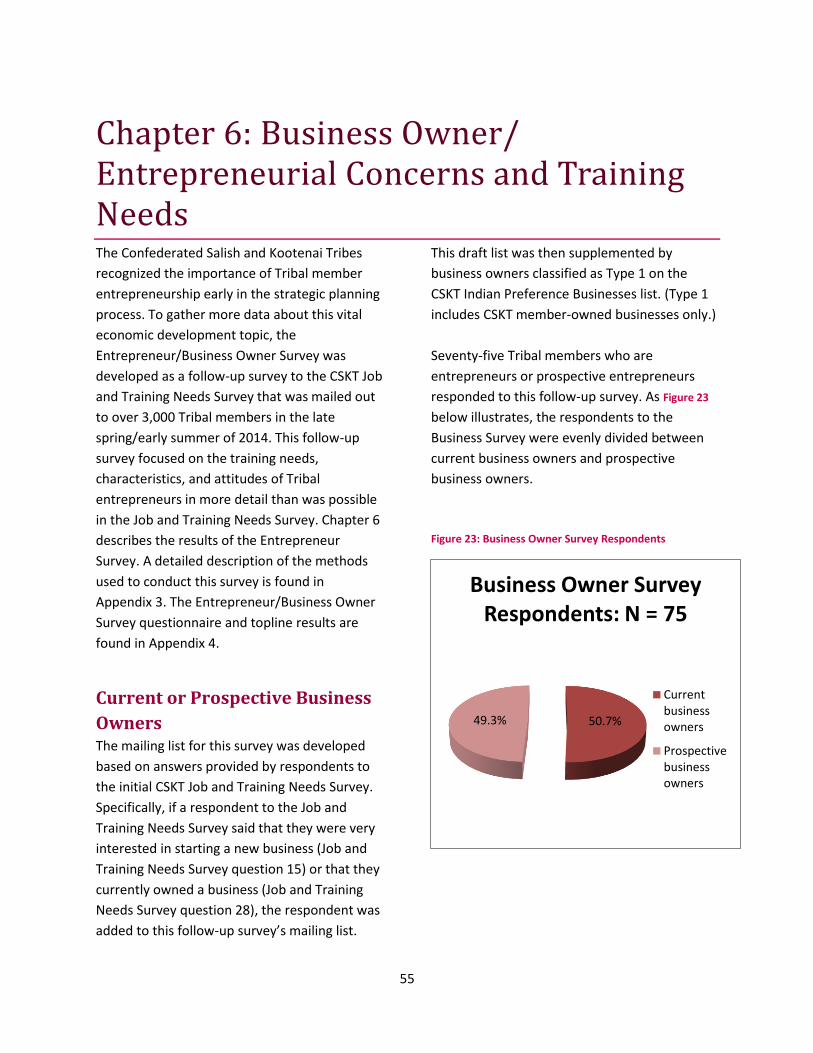
55
Chapter 6: Business Owner/ Entrepreneurial Concerns and Training Needs The Confederated Salish and Kootenai Tribes
recognized the importance of Tribal member
entrepreneurship early in the strategic planning
process. To gather more data about this vital
economic development topic, the
Entrepreneur/Business Owner Survey was
developed as a follow-up survey to the CSKT Job
and Training Needs Survey that was mailed out
to over 3,000 Tribal members in the late
spring/early summer of 2014. This follow-up
survey focused on the training needs,
characteristics, and attitudes of Tribal
entrepreneurs in more detail than was possible
in the Job and Training Needs Survey. Chapter 6
describes the results of the Entrepreneur
Survey. A detailed description of the methods
used to conduct this survey is found in
Appendix 3. The Entrepreneur/Business Owner
Survey questionnaire and topline results are
found in Appendix 4.
Current or Prospective Business
Owners The mailing list for this survey was developed
based on answers provided by respondents to
the initial CSKT Job and Training Needs Survey.
Specifically, if a respondent to the Job and
Training Needs Survey said that they were very
interested in starting a new business (Job and
Training Needs Survey question 15) or that they
currently owned a business (Job and Training
Needs Survey question 28), the respondent was
added to this follow-up survey’s mailing list.
This draft list was then supplemented by
business owners classified as Type 1 on the
CSKT Indian Preference Businesses list. (Type 1
includes CSKT member-owned businesses only.)
Seventy-five Tribal members who are
entrepreneurs or prospective entrepreneurs
responded to this follow-up survey. As Figure 23
below illustrates, the respondents to the
Business Survey were evenly divided between
current business owners and prospective
business owners.
Figure 23: Business Owner Survey Respondents
50.7% 49.3%
Business Owner Survey Respondents: N = 75
Currentbusinessowners
Prospectivebusinessowners
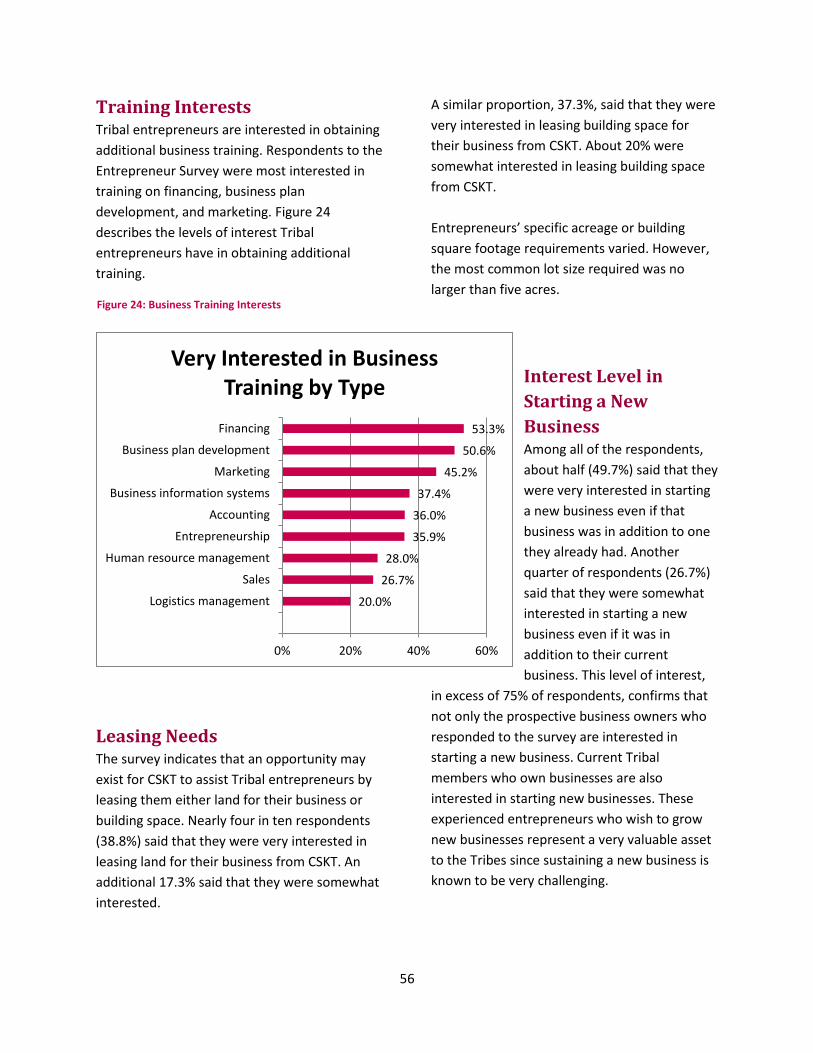
56
20.0%
26.7%
28.0%
35.9%
36.0%
37.4%
45.2%
50.6%
53.3%
0% 20% 40% 60%
Logistics management
Sales
Human resource management
Entrepreneurship
Accounting
Business information systems
Marketing
Business plan development
Financing
Very Interested in Business Training by Type
Training Interests Tribal entrepreneurs are interested in obtaining
additional business training. Respondents to the
Entrepreneur Survey were most interested in
training on financing, business plan
development, and marketing. Figure 24
describes the levels of interest Tribal
entrepreneurs have in obtaining additional
training.
Leasing Needs The survey indicates that an opportunity may
exist for CSKT to assist Tribal entrepreneurs by
leasing them either land for their business or
building space. Nearly four in ten respondents
(38.8%) said that they were very interested in
leasing land for their business from CSKT. An
additional 17.3% said that they were somewhat
interested.
A similar proportion, 37.3%, said that they were
very interested in leasing building space for
their business from CSKT. About 20% were
somewhat interested in leasing building space
from CSKT.
Entrepreneurs’ specific acreage or building
square footage requirements varied. However,
the most common lot size required was no
larger than five acres.
Interest Level in
Starting a New
Business Among all of the respondents,
about half (49.7%) said that they
were very interested in starting
a new business even if that
business was in addition to one
they already had. Another
quarter of respondents (26.7%)
said that they were somewhat
interested in starting a new
business even if it was in
addition to their current
business. This level of interest,
in excess of 75% of respondents, confirms that
not only the prospective business owners who
responded to the survey are interested in
starting a new business. Current Tribal
members who own businesses are also
interested in starting new businesses. These
experienced entrepreneurs who wish to grow
new businesses represent a very valuable asset
to the Tribes since sustaining a new business is
known to be very challenging.
Figure 24: Business Training Interests

57
Most Important Barrier to a New
or Expanding Business The top four responses among all respondents,
when asked to describe the most important
barrier to them for starting a business or
expanding a business, are listed below:
1. Access to capital, money, financing
(44.0%)
2. Time (9.3%)
3. Getting the Tribes to use their business,
Tribal preference, Tribal support (6.7%)
4. Business plan development (5.3%)
It is important to note that access to capital was
the dominant barrier, cited by 44.0% of
respondents. The remaining three barriers were
each mentioned by fewer than one in ten
respondents.
CSKT’s Strengths in Assisting
New or Expanding Businesses About one in ten (9.3%) respondents praised
CSKT’s use of the Indian Preference List or
lauded CSKT’s use of Tribal contractors as
something that CSKT does well to assist
business owners. Other respondents mentioned
Tribal financial support (5.3%) and business
classes offered by the Tribes or Salish Kootenai
College.
One-third of respondents (30.7%) said
specifically that they did not know what CSKT
does well to assist business owners. Since
nearly half of the respondents were aspiring
business owners this lack of knowledge about
Tribal business assistance efforts is
understandable. However, this result does
indicate a continuing need to publicize CSKT
business assistance efforts among Tribal
members.
Possible Improvements in CSKT’s
Efforts to Assist New or
Expanding Businesses The top four responses, among all respondents,
when asked to describe what CSKT should do
better to assist business owners are listed
below:
1. Increase education, training, business
plan development, and grant writing
(24.0%)
2. Provide Tribal entrepreneurs direct
financial assistance (18.7%)
3. Use/ enforce/ strengthen Indian
Preference, train CSKT departments in
existing procurement policies (18.7%)
4. Improve communication to Tribal
members about business opportunities,
who Tribal members should talk to, and
the availability of assistance (4.0%)
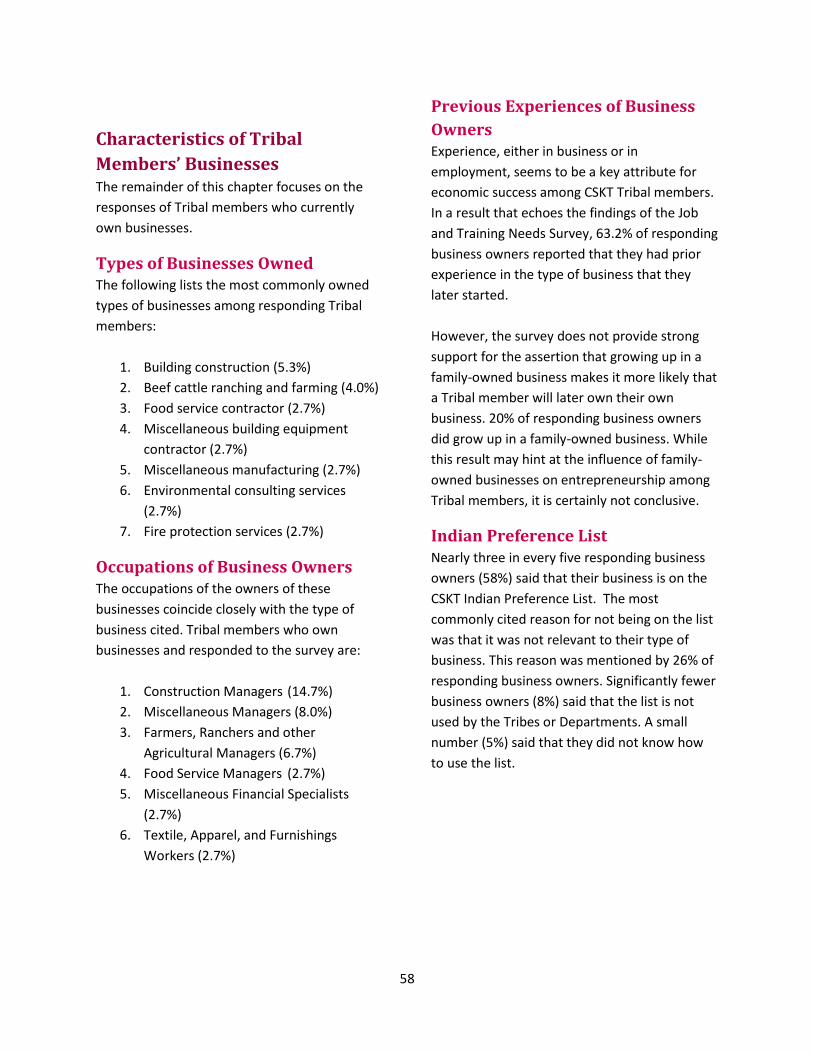
58
Characteristics of Tribal
Members’ Businesses The remainder of this chapter focuses on the
responses of Tribal members who currently
own businesses.
Types of Businesses Owned The following lists the most commonly owned
types of businesses among responding Tribal
members:
1. Building construction (5.3%)
2. Beef cattle ranching and farming (4.0%)
3. Food service contractor (2.7%)
4. Miscellaneous building equipment
contractor (2.7%)
5. Miscellaneous manufacturing (2.7%)
6. Environmental consulting services
(2.7%)
7. Fire protection services (2.7%)
Occupations of Business Owners The occupations of the owners of these
businesses coincide closely with the type of
business cited. Tribal members who own
businesses and responded to the survey are:
1. Construction Managers (14.7%)
2. Miscellaneous Managers (8.0%)
3. Farmers, Ranchers and other
Agricultural Managers (6.7%)
4. Food Service Managers (2.7%)
5. Miscellaneous Financial Specialists
(2.7%)
6. Textile, Apparel, and Furnishings
Workers (2.7%)
Previous Experiences of Business
Owners Experience, either in business or in
employment, seems to be a key attribute for
economic success among CSKT Tribal members.
In a result that echoes the findings of the Job
and Training Needs Survey, 63.2% of responding
business owners reported that they had prior
experience in the type of business that they
later started.
However, the survey does not provide strong
support for the assertion that growing up in a
family-owned business makes it more likely that
a Tribal member will later own their own
business. 20% of responding business owners
did grow up in a family-owned business. While
this result may hint at the influence of family-
owned businesses on entrepreneurship among
Tribal members, it is certainly not conclusive.
Indian Preference List Nearly three in every five responding business
owners (58%) said that their business is on the
CSKT Indian Preference List. The most
commonly cited reason for not being on the list
was that it was not relevant to their type of
business. This reason was mentioned by 26% of
responding business owners. Significantly fewer
business owners (8%) said that the list is not
used by the Tribes or Departments. A small
number (5%) said that they did not know how
to use the list.
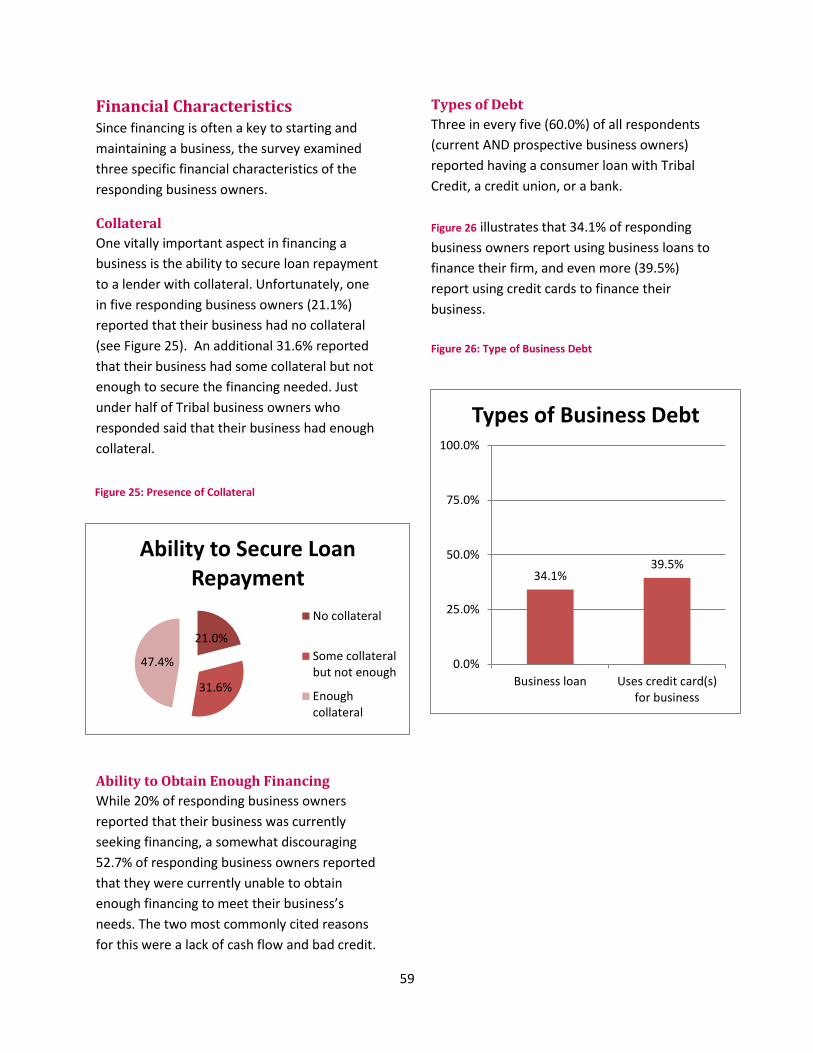
59
21.0%
31.6%
47.4%
Ability to Secure Loan Repayment
No collateral
Some collateralbut not enough
Enoughcollateral
Financial Characteristics Since financing is often a key to starting and
maintaining a business, the survey examined
three specific financial characteristics of the
responding business owners.
Collateral
One vitally important aspect in financing a
business is the ability to secure loan repayment
to a lender with collateral. Unfortunately, one
in five responding business owners (21.1%)
reported that their business had no collateral
(see Figure 25). An additional 31.6% reported
that their business had some collateral but not
enough to secure the financing needed. Just
under half of Tribal business owners who
responded said that their business had enough
collateral.
Ability to Obtain Enough Financing
While 20% of responding business owners
reported that their business was currently
seeking financing, a somewhat discouraging
52.7% of responding business owners reported
that they were currently unable to obtain
enough financing to meet their business’s
needs. The two most commonly cited reasons
for this were a lack of cash flow and bad credit.
Types of Debt
Three in every five (60.0%) of all respondents
(current AND prospective business owners)
reported having a consumer loan with Tribal
Credit, a credit union, or a bank.
Figure 26 illustrates that 34.1% of responding
business owners report using business loans to
finance their firm, and even more (39.5%)
report using credit cards to finance their
business.
Figure 26: Type of Business Debt
34.1% 39.5%
0.0%
25.0%
50.0%
75.0%
100.0%
Business loan Uses credit card(s)for business
Types of Business Debt
Figure 25: Presence of Collateral

60
1%
4%
5%
5%
7%
7%
9%
11%
12%
16%
16%
33%
0% 5% 10% 15% 20% 25% 30% 35%
Lack of food, gas, and living commodities
Not on Indian preference list
Lack of trained work force
Lack of utility or communication infrastructure
Government regulations
Bonding
Lack of qualified workforce
Insurance
Affordable land or building(s)
Bidding against other firms
Preparing competitive proposals
Access to capital
Most Difficult Barriers to Business Development
Most Difficult Barriers to Business
Development Finally, respondents were asked to select the
top three most difficult barriers to the
development of their business. Figure 27
displays their responses. The three most
common responses were:
1. Access to capital (33%)
2. Bidding against other firms (16%)
3. Preparing competitive proposals (16%)
Figure 27: Most Difficult Barriers to Business Development
Taken along with other responses to the
Entrepreneur/Business Owners Survey, the
dominant response to this question implies that
CSKT should focus some business assistance on
problems associated with access to capital.

61
Chapter 7: Job Training Program Recommendations In this chapter, the authors use results from the
Job and Training Needs Survey, the
Entrepreneur (Business Owners’) Survey, and
the Flathead Reservation Economic Profile to
make initial recommendations for
development of a job training program—one of
the goals of the Project. The recommendations
consist of three broad categories:
1. Recommended occupations to target
for job training
2. Recommended job training program
characteristics, and
3. Recommendations focused on business
owners or entrepreneurs.
Please note that when this draft report was
written, the authors were still awaiting
responses to the Entrepreneur Survey.
Recommendations based on the results of this
survey are forthcoming.
Recommended Target
Occupations for Training This section presents occupations that the
Sustainable Economic Development Project
Partners/Steering Committee could target or
prioritize when choosing a job training
program(s) to develop. The occupations were
chosen to give the Steering Committee the
ability to target either all Tribal members or
specific groups, such as young adults. To be
recommended, an occupation had to be:
a job that Tribal members were most
interested in pursuing
have an annual growth rate of at least
1.0% in western Montana
have at least 30 openings per year in
western Montana
pay more than $30,000 per year on
average in Montana
Table 37 presents occupation targets or
possible priorities for the general Tribal
member population ages 18-60.
Table 37: Occupation Targets for All Tribal Members
Target Occupations for All Tribal Members
Occupation
Annual Growth
Rate Annual
Openings
Average Annual Wage
Computer and Mathematical Occupations
2.2% 75 $64,770
Financial Specialists
1.6% 76 $54,440
Health Treating Practitioners (Registered Nurse)
1.5% 189 $58,840
Construction Trades Workers
1.4% 197 $37,090
Motor Vehicle Operators (truck)
1.4% 133 $39,430
Supervisors of Office and Administrative Support Workers
1.4% 42 $43,300
Vehicle and Mobile Equipment Mechanics, Installers, and Repair
1.1% 90 $38,520

62
Table 38 presents occupation targets for
unemployed Tribal members or those who are
no longer in the labor force. This table also
presents occupation targets recommended for
Tribal members living in households below or
near the poverty threshold.
Table 39 displays occupation targets for young
adult or female Tribal members.
Table 38: Occupation Targets for Unemployed or Low-Income Tribal Members
Target Occupations for Unemployed Tribal Members or Those No Longer in
the Labor Force
Occupation
Annual Growth
Rate Annual
Openings
Average Annual Wage
Financial Specialists
1.6% 76 $54,440
Health Treating Practitioners (Registered Nurse)
1.5% 189 $58,840
Counselors, Social Workers, and Other
1.5% 87 $38,000
Financial Clerks 1.4% 167 $31,120
Target Occupations for Tribal Members Near or Below Poverty
Computer and Mathematical Occupations
2.2% 75 $64,770
Financial Specialists
1.6% 76 $54,440
Health Treating Practitioners (Registered Nurse)
1.5% 189 $58,840
Counselors, Social Workers, and Other
1.5% 87 $38,000
Construction Trades Workers
1.4% 197 $37,090
Supervisors of Office and Administrative Support Workers
1.4% 42 $43,300
Table 39: Occupation Targets for Young Adult or Female Tribal Members
Target Occupations for Young Adult Tribal Members Ages 18-34
Occupation
Annual Growth
Rate Annual
Openings
Average Annual Wage
Financial Specialists
1.6% 76 $54,440
Health Treating Practitioners (Registered Nurse)
1.5% 189 $58,840
Construction Trades Workers
1.4% 197 $37,090
Supervisors of Office and Administrative Support Workers
1.4% 42 $43,300
Target Occupations for Female Tribal Members
Financial Specialists
1.6% 76 $54,440
Health Treating Practitioners (Registered Nurse)
1.5% 189 $58,840
Counselors, Social Workers, and Other
1.5% 87 $38,000
Supervisors of Office and Administrative Support Workers
1.4% 42 $43,300

63
The frequently recommended target
occupation-- Financial Specialists, U.S.
Department of Labor Standard Occupation
Code 13-2000--refers to a group of occupations
that includes:
Accountants and Auditors
Appraisers and Assessors of Real Estate
Budget Analysts
Financial Analysts and Advisors
Credit Counselors
Loan Officers, and
Tax Examiners and Preparers
BBER recommends that CSKT consider
expanding current High School Equivalence
Certificate Programs (formerly known as G.E.D.
programs). Expanded participation in and
completion of a High School Equivalence
Certificate program will have a significant
impact across the Tribal member population.
This impact will perhaps be greatest among the
15.2% of Tribal members ages 18-34 who have
not yet completed high school or a High School
Equivalence Certificate Program.
Recommended Job Training
Program Characteristics The Job and Training Needs Survey’s
examination of barriers that impede Tribal
members’ ability to get a job, job training, or
additional education, yielded many important
observations for Tribal Government, Salish
Kootenai College, Kicking Horse Job Corps
Center and others. Three of those observations
are highlighted here:
1. Any new job training program should
provide actual experience that Tribal
members can use on a job application
or resume. Lack of job experience is one
of the leading barriers faced by Tribal
members.
2. Accommodations for Tribal members
with disabilities or health problems
should be a priority in developing any
new job training program. While such
accommodations are required by law,
the survey results demonstrate that
they cannot be overemphasized. Any
new job training program may also
need to inform prospective trainees
that helpful and useful
accommodations are in place.
3. CSKT should take concrete steps where
possible to encourage employers to
create full-time jobs when new jobs are
added. The gap between the average
number of weekly hours worked by
Tribal members (33.3 hours) and all
workers on the Flathead Reservation
(38.2 hours) represents sizable forgone
wages.
Recommendations Focused on
Business Owners or
Entrepreneurs A majority of the recommendations focused on
business owners or entrepreneurs will be
published after the Business Owners’ Survey is
completed. However, one result from the Jobs
and Training Survey is particularly relevant here.
The CSKT Economic Development Office and
Steering Committee recommends further
development of a program to train and assist
Tribal members who want to start a new
business or expand an existing micro-business.

64
More than one-third of Tribal members ages
18-60 said that they are very interested in
starting a new business. This could become an
important source of economic opportunity for
Tribal members

Appendix I: 1
Appendix 1: Job and Training Needs Survey Methodological Summary
Questionnaire Design The Job and Training Needs Survey
questionnaire was developed by the Bureau of
Business and Economic Research (BBER), the
Confederated Salish and Kootenai
Tribes (CSKT), and other Sustainable Economic
Development Project partners. CSKT was the
final approval authority for the questionnaire
and all other mail survey materials.
BBER extensively pre-tested the draft
questionnaire using a two-step process. First,
BBER conducted in-depth cognitive interviews
with six Tribal members. 9 Cognitive interviews
are an intensive, 1-1.5 hour examination of the
cognitive processes respondents use to answer
each question. The interviews employ
retrospective and concurrent “think aloud”
strategies in which respondents are asked to
talk about their answers with a survey specialist
while completing the survey. Some respondents
make errors that are caused by habits of mind
or question wording when reporting attitudes
and behavior. Cognitive interviewing examines
the common thinking habits respondents use
when recalling and reporting attitudes and
behaviors. This gives questionnaire designers
the opportunity to tailor questions to the way
people think.
9 Presser, Stanley, et. al. eds. 2004. Methods for
Testing and Evaluating Questionnaires. New York: John Wiley & Sons. p. 24.
Following revisions based on cognitive interview
results and consultation with CSKT, the
questionnaire was further refined through a
full-scale field test. The field test was
administered to a sample of 100 Tribal
members. The field test verified all survey
systems, including the mail processing, data
capture and data export functions. BBER
reviewed returned field test questionnaires to
determine whether the questionnaire or other
mailing materials needed further modification.
CSKT then approved the final questionnaire
draft.
Survey Administration No sample was drawn for this survey. Rather,
BBER administered the questionnaire by mail to
all adult, enrolled Tribal members ages 18-60
whose mailing addresses were on the Flathead
Reservation as of April 2014. The mailing list
was supplied by CSKT. The survey was
administered from May through July 2014.
BBER printed, assembled, and mailed all printed
correspondence to the Tribal members
surveyed. The content of all correspondence
was pre-approved by CKST.
The first mailing was a pre-survey notification
letter that was signed by the Tribal Chairman.
The primary purpose of the pre-notice letter
was to provide a positive and timely notice that
the recipient would be receiving a request to
help with an important study. It was brief,
personalized, positively worded, and aimed at
building anticipation rather than providing the

Appendix I: 2
details or conditions for participation in the
survey. A secondary purpose of the pre-notice
was to determine how many of the sampled
addresses were undeliverable. Undeliverable
addresses were corrected by BBER if possible,
and a second pre-notice was then mailed.
The survey’s second contact with respondents
was the questionnaire packet. The packet was
mailed first class about one week after the pre-
notice. The packet consisted of a cover letter,
the questionnaire, a return envelope, and a
token of appreciation. The cover letter was one
page in length and was printed on CSKT
letterhead and signed by the Tribal Chairman.
The questionnaire was in booklet format with
an attractive cover. A commemorative postage
stamp was placed on the return envelope. Each
of the potential respondents received a $2.00
bill in the mail packet. This token of
appreciation has been shown in repeated,
rigorous experimental evaluations to increase
survey response rates between 10 and 20
percentage points. For more information on
survey incentives please see Dillman et al
Internet, Mail, and Mixed-Mode Surveys: The
Tailored Design Method, 3rd edition, pages 274-
275 in particular.
This survey’s next correspondence to Tribal
members was a postcard thank you/reminder.
The postcard was mailed one week after the
questionnaire packet was mailed. The primary
purpose of the postcard was to jog the memory
of respondents who had not yet responded. A
secondary purpose was to thank those who had
responded.
BBER followed the thank you/reminder
postcard with a second questionnaire packet
mailing to only those respondents who had not
yet responded. This mailing followed the
postcard by between one and two weeks. The
physical look of this mailing and the content of
the cover letter varied from the previous
correspondence in order to maximize response.
Tribal members completed 771 questionnaires.
BBER documented survey status in a manner
that allowed calculation and reporting of a
response rate. The response rate is:
I / (I+P+NC+R+NI)
Where
I = completed interviews
P = partial interviews
NC = noncontacted but known eligible
R = refused eligible
NI = other non-completed.10
The final response rate for this survey was
26.8%. Table 40 summarizes the data collection
results for each Tribal member included in the
study.
10
The American Association for Public Opinion Research. 2011. Standard Definitions: Final Dispositions of Case Codes and Outcome Rates for Surveys. 7th edition. AAPOR.
Final Survey Outcomes Number Status
3,051 Mailed
771 Completed
11 Refused
10 Non-completion due to disability
143 Bad addresses
16 Non-completion due to respondent being under age
2,100 Not completed
Table 40: Final Survey Outcomes

Appendix I: 3
The 771 survey responses thoroughly represent
the Tribal member demographic groups
studied. The data cited below demonstrate this.
As Figure 28 shows, the proportion of men and
women who responded to this survey is nearly
identical to that found by the U.S. Census
Bureau.
Figure 28: % Male and Female
The Job and Training Needs Survey found that
the median 2013 household income for all
responding Tribal members was $29,000. The
U.S. Census Bureau’s American Community
Survey (ACS) 5-Year estimates for 2008-2012
found a median household income for
American Indians living on the Flathead
Reservation of $28,284. The Job and Training
Needs Survey median income is well within the
ACS margin of error of +/- $3,008. In fact, the
Job and Training Needs Survey median income
is almost identical to the ACS.
The U.S. Census Bureau’s 2008-2012 ACS found
a slightly lower proportion of American Indians
on the Flathead Reservation living at or below
poverty (30.2%) when compared to the Job and
Training Needs Survey (36.1%). However, this
small difference is also within the ACS
estimate’s margin of sampling error.
When this report refers to U.S. Census Bureau
numbers for American Indians on the Flathead
Reservation, that reference includes members
of other tribes as well as others who self-
identify as American Indians. The Job and
Training Needs Survey included only enrolled
Salish, Kootenai, and Pend d’Oreille Tribal
members.
The total number of survey responses from key
groups of Tribal members was very good, and
was more than enough for valid analysis. Table
41 summarizes the number of survey responses
from key groups of Tribal members.
Table 41: Total Survey Responses from Key Groups
Total Response from Key Tribal Member Groups
# Respondents Key Analysis Group
771 All Tribal members Ages 18-60
412 Women
389 Near or below poverty
238 Unemployed or not in the labor force
201 Young adults ages 18-34
46.5% 47.4%
53.5% 52.6%
0%
25%
50%
75%
100%
Tribal MembersAges 18-60, 2014
Survey
American Indianson Flathead Res
Ages 18-64, 2008-2012 ACS
Sex of Tribal Members Ages 18-60
Male Female

Appendix I: 4
Data Set Preparation Following receipt of the survey responses, the
data were coded by BBER survey research
professionals. BBER then selected a random
sample of 10% of the entered cases for manual
verification of coding accuracy. The data
entered were also inspected to insure no
duplicate cases were included and to correct
any coding typos. Appropriate data labels were
added to the data set. Because of the reliability
of the data collected, BBER chose not to
calculate or use post-stratification weights.
Post-stratification weights are used by some
data analysts to adjust their data to better
reflect the population they studied. Again, BBER
did not need to adjust the CSKT survey data
because of the excellent cross-section of the
population that responded to the survey.
Appropriate composite variables and flags were
added to the data set to facilitate the analysis
process.
BBER used the following classification systems
to code specific, open-ended questions. To code
the industry in which a Tribal member worked,
BBER used the North American Industry
Classification System (NAICS) version 2012. This
industry classification system is the standard
used by Federal statistical agencies in classifying
business establishments. It is found at this link:
http://www.census.gov/eos/www/naics/
To code the occupations reported by Tribal
members, BBER used the 2010 Standard
Occupational Classification (SOC) system. The
SOC system is used by Federal statistical
agencies to classify workers into occupational
categories. It is found at this link:
http://www.bls.gov/soc/
To code education or training programs cited by
Tribal members, BBER used the 2010
Classification of Instructional Programs (CIP).
CIP provides a taxonomic scheme that supports
the accurate tracking and reporting of fields of
study and program completions activity. CIP is
maintained by the U.S. Department of
Education's National Center for Education
Statistics (NCES). It is found at this link:
http://nces.ed.gov/ipeds/cipcode/Default.aspx?
y=55
To code the poverty status of Tribal members,
BBER used the 2013 Poverty Guidelines
published by the U.S. Department of Health and
Human Services in the Federal Register on
January 24, 2013. They are found at this link:
http://aspe.hhs.gov/poverty/13poverty.cfm
The poverty guidelines used are also furnished
in Table 42 below.
Table 42: 2013 Poverty Guidelines
Annual Household Income Poverty Guidelines for the 48 Contiguous
States: 2013
Persons in family /household Poverty guideline
1 $11,490
2 15,510
3 19,530
4 23,550
5 27,570
6 31,590
7 35,610
8 39,630
For families/households with more than 8 persons, add $4,020 for each additional person.

Appendix I: 5
Analysis BBER conducted a statistical analysis of the
survey data using statistical analysis computer
software (SPSS version 22, Copyright 2013, IBM
Corporation). BBER analyzed the data collected
using frequencies, cross-tabulations, and
standard measures of central tendency (mean,
median, mode).

Appendix II: 1
Appendix 2: Job and Training Needs Survey Questionnaire and Top-Line Results
Percentages are based on 771 completed surveys. 1. Are you, yourself, interested in looking for a new job, or not? Please answer EVEN IF you are currently employed.
☐Interested 61.1%
☐Not interested 36.6% Missing 2.3%
2. What type(s) of job interests you most? Mark (X) in each box that applies.
☐Full-time 78.5%
☐Part-time 22.6%
☐Permanent 45.7%
☐Temporary 9.4%
☐Year-round 33.4%
☐Seasonal 14.4%
☐None of these/
not applicable to me 8.6% 3. How many miles are you, yourself, willing to commute (one-way) to work?
__________ Miles one way Median = 30 miles one-way
4. Are you willing to work off of the Flathead Reservation if you can commute home each day, or not?
☐Willing to commute off the Reservation 53.3%
☐Not willing to commute off the Reservation 44.3% Missing 2.4%
5. Are you willing to work for an employer OTHER THAN the Confederated Salish and Kootenai Tribes, or not?
☐Willing to work for someone other than CSKT 83.7%
☐Not willing to work for someone other than CSKT 13.0% Missing 3.3%

Appendix II: 2
6. Please indicate the area(s) of your career interests. Mark (X) in each box that applies.
☐None of these/not applicable to me 6.7%
☐Administrative support (clerical, software manager, office manager) 30.1%
☐Maintenance/repair (auto, appliance, equipment, welding) 21.1%
☐Health services (physician, nursing, dentist, technicians, aides) 15.1%
☐Construction (heavy equipment, carpentry, electrician, plumbing, HVAC) 25.3%
☐Transportation/trucking (drivers, dispatch, loaders, logistics) 19.3%
☐Sales (wholesale, retail) 17.9%
☐Accounting/finance (audit, CPA, bookkeeping, banking) 17.8%
☐Engineering (drafting, building, surveying) 8.7%
☐Manufacturing (food, wood products, machine, crafts) 18.9%
☐Forestry/logging/firefighting (working in the woods) 25.0%
☐Food/lodging (hotel, restaurants, bars) 23.8%
☐Information technology (computer hardware, software, repair) 11.5%
☐Protective services (law enforcement, emergency services) 10.8%
☐Social services (family services, youth programs, shelters) 17.8%
☐Personal services (barber shop, beauty salon) 8.2%
☐Other, specify below: 19.7%
_____________________________ _____________________________
_____________________________ 7. What particular kind of work are you, yourself interested in doing? Print in the grey area below. For example: registered nurse, personnel manager, teacher, laborer, working in the woods, accountant, etc.
_____________________________ _____________________________ _____________________________
☐None of these/not applicable to me 8. Which of these, if any, is MOST important to you personally? Mark (X) one box.
☐Finding a job 19.7%
☐Obtaining additional job training 18.6%
☐Obtaining additional education (formal schooling) 22.8%
☐None of these/not applicable to me 23.3% Multiple responses 14.5% Missing 1.1%

Appendix II: 3
9. How interested are you in job-related education or training? Mark (X) ONE box.
☐Very interested 55.0%
☐Somewhat interested 25.7%
☐Neither interested nor uninterested 6.4%
☐Somewhat uninterested 1.3%
☐Not at all interested 10.6% Missing 1.0%
10. If you are at all interested, please indicate below the type(s) of education and training in which you are interested. Mark (X) in each box that applies.
☐GED (High School Equivalency Diploma) 9.9%
☐Reading, math, or English skills 10.3%
☐Vocational training in a craft or trade 28.5%
☐Academic training at a college or business school 36.4%
☐Apprenticeship or On-the-Job training 44.1%
☐Certification or licensure 34.5%
☐Not interested 16.7% 11. What particular kind of education or training are you, yourself MOST interested in? Print in the grey area below. For example: registered nurse program, heavy equipment operator training, computer network administration, automotive repair, or carpentry, plumbing, electrical trades.
_____________________________ _____________________________ _____________________________
☐None of these/not applicable to me 12. Please indicate below if you are interested in job skills training in any of these areas. Mark (X) in each box that applies.
☐Reading, writing, or math skills 19.4%
☐Product sales (marketing, sales training) 18.7%
☐Interpersonal skills (leadership, career dev.) 36.0%
☐Organizing (problem solving, time management) 33.3%
☐Quality improvement (customer service) 27.3%
☐Technical skills (computer skills, trade skills) 44.3%
☐Safety (health or safety training) 23.8%
☐Other, specify ______________________________________ 6.6%
☐None of these/not applicable to me 21.8%

Appendix II: 4
13. What type of job seeking workshop would you attend if it was offered? Mark (X) in each box that applies.
☐Applications - help filling out job applications 17.8%
☐Interviewing - learn tips for job interviews 23.9%
☐Resume writing - learn to write an effective resume 31.8%
☐Job search strategies - effective techniques for finding your next job 24.9%
☐Career planning (outlining future goals in areas of interest) 42.0%
☐Labor market information – finding which businesses are hiring and which are not 34.8%
14. How interested are you, if at all, in participating in a new job training program offered by The Confederated Salish and Kootenai Tribes? Mark (X) ONE box.
☐Very interested 38.1%
☐Somewhat interested 30.6%
☐Neither interested nor uninterested 11.5%
☐Somewhat uninterested 2.5%
☐Not at all interested 15.0% Missing 2.3%
15. How interested are you, if at all, in starting a new business?
☐Very interested 33.9%
☐Somewhat interested 28.1%
☐Neither interested nor uninterested 8.7%
☐Somewhat uninterested 5.1%
☐Not at all interested 22.6% Missing 1.6%
16. LAST WEEK, did you, yourself work for pay at a job or business?
☐Yes 64.7%
☐No – Did not work or retired 34.0% Missing 1.3%
(IF Q16 is No) 17. LAST WEEK, did you, yourself do ANY work for pay, even for as little as one hour?
☐Yes 2.8%
☐No 28.6% Missing or skipped 68.6%
(IF Q16 and 17 both No) 18. LAST WEEK, were you, yourself on layoff from a job?
☐Yes 1.7%
☐No 23.4% Missing or skipped 74.9%

Appendix II: 5
(IF Q16 and 17 both No) 19. LAST WEEK, were you, yourself TEMPORARILY absent from a job or business?
☐Yes, on vacation, temporary illness, maternity leave, other family/personal reasons, bad weather, etc. 1.5%
☐No 23.3% Missing or skipped 75.2%
(IF Q16 and 17 both No) 20. During the LAST 4 WEEKS, were you, yourself ACTIVELY looking for work?
☐Yes 9.6%
☐No 15.9% Missing or skipped 74.5%
(IF Q16 and 17 both No) 21. When did you, yourself last work, even for a few days?
☐Within the past 12 months 11.6%
☐1 to 5 years ago 8.2%
☐Over 5 years ago or never worked 4.4% Missing or skipped 75.8%
22. During the PAST 12 MONTHS in the weeks that you worked, how MANY HOURS did you, yourself usually WORK EACH WEEK?
__________ Usual hours worked each WEEK 33.2 hours = mean hours worked weekly
Enter “0” if you did not work in the last 12 months. 23. Were you, yourself primarily…? Mark (X) ONE box for your primary employment.
☐an employee of a PRIVATE FOR-PROFIT company or business, or of an individual, for wages, salary, or commissions? 19.5%
☐an employee of a PRIVATE NOT-FOR-PROFIT, tax-exempt, or charitable organization? 2.4%
☐an employee of the CONFEDERATED SALISH & KOOTENAI TRIBES? 49.6%
☐an employee of an Educational Institution? 5.6%
☐a local GOVERNMENT employee (city, county, etc.)? 0.9%
☐a state GOVERNMENT employee? 0.8%
☐a Federal GOVERNMENT employee? 2.4%
☐SELF-EMPLOYED in own business, professional practice, or farm? 8.1%
☐working WITHOUT PAY in family business or farm? 2.6%
➔For whom did you work without pay?
_____________________________ Missing 8.1% 24. Print the name of your current or last employer, company, or business, in the grey area below: If
now on active duty in the Armed Forces, mark (X) this box ➔☐ and print the branch of the Armed Forces below.
_____________________________ _____________________________
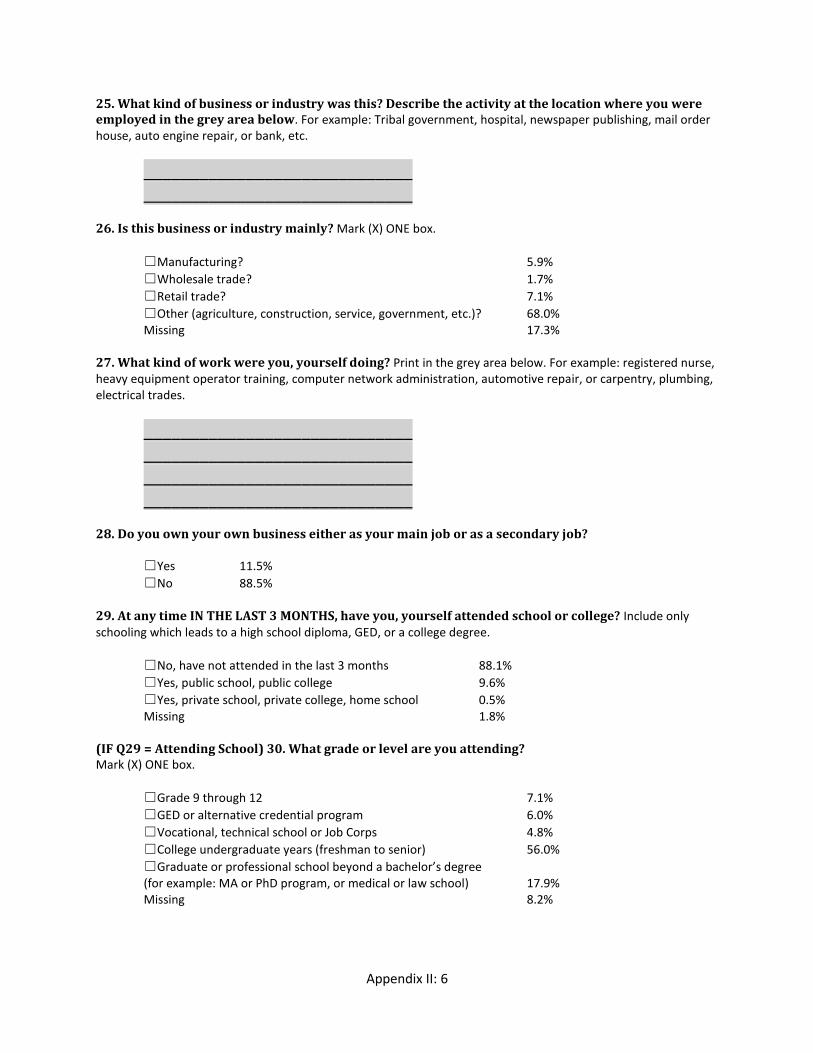
Appendix II: 6
25. What kind of business or industry was this? Describe the activity at the location where you were employed in the grey area below. For example: Tribal government, hospital, newspaper publishing, mail order house, auto engine repair, or bank, etc.
_____________________________ _____________________________
26. Is this business or industry mainly? Mark (X) ONE box.
☐Manufacturing? 5.9%
☐Wholesale trade? 1.7%
☐Retail trade? 7.1%
☐Other (agriculture, construction, service, government, etc.)? 68.0% Missing 17.3%
27. What kind of work were you, yourself doing? Print in the grey area below. For example: registered nurse, heavy equipment operator training, computer network administration, automotive repair, or carpentry, plumbing, electrical trades.
_____________________________ _____________________________ _____________________________ _____________________________ 28. Do you own your own business either as your main job or as a secondary job?
☐Yes 11.5%
☐No 88.5%
29. At any time IN THE LAST 3 MONTHS, have you, yourself attended school or college? Include only schooling which leads to a high school diploma, GED, or a college degree.
☐No, have not attended in the last 3 months 88.1%
☐Yes, public school, public college 9.6%
☐Yes, private school, private college, home school 0.5% Missing 1.8%
(IF Q29 = Attending School) 30. What grade or level are you attending? Mark (X) ONE box.
☐Grade 9 through 12 7.1%
☐GED or alternative credential program 6.0%
☐Vocational, technical school or Job Corps 4.8%
☐College undergraduate years (freshman to senior) 56.0%
☐Graduate or professional school beyond a bachelor’s degree (for example: MA or PhD program, or medical or law school) 17.9% Missing 8.2%

Appendix II: 7
31. What is your main area or subject that you are studying? Print in the grey boxes below.
_____________________________ _____________________________ _____________________________ _____________________________ 32. What is the highest degree or level of school you, yourself have COMPLETED? Mark (X) ONE box. If currently enrolled, mark the previous grade or highest degree received. NO SCHOOLING COMPLETED
☐No schooling completed 2.2% GRADE 1 THROUGH GRADE 12
☐Grade 1 through 11 5.5%
☐12th grade – NO DIPLOMA 1.9% HIGH SCHOOL GRADUATE
☐Regular high school diploma 12.4%
☐GED or alternative credential 7.9%
COLLEGE OR SOME COLLEGE, VOCATIONAL/ TECHNICAL SCHOOL
☐Some college or vocational/ Job Corps credit, but less than 1 year of college or vocational credit 15.1%
☐1 or more years of college or vocational/ Job Corps credit, no degree 21.8%
☐Job Corps completion 1.3%
☐Associate’s degree (for example: AA, AS) 11.2%
☐Bachelor’s degree (for example: BA, BS) 14.1% AFTER BACHELOR’S DEGREE
☐Master’s degree (for example: MA, MS, MEng, MEd, MSW, MBA) 3.9%
☐Professional degree beyond a bachelor’s degree (for example: MD, DDS, DVM, LLB, JD) 0.8%
☐Doctorate degree (for example: PhD, EdD) 0.3% Missing 1.6%
33. What, if any, professional certifications or licenses have you COMPLETED at any time? Please print in the grey boxes below.
_____________________________ _____________________________ _____________________________ _____________________________
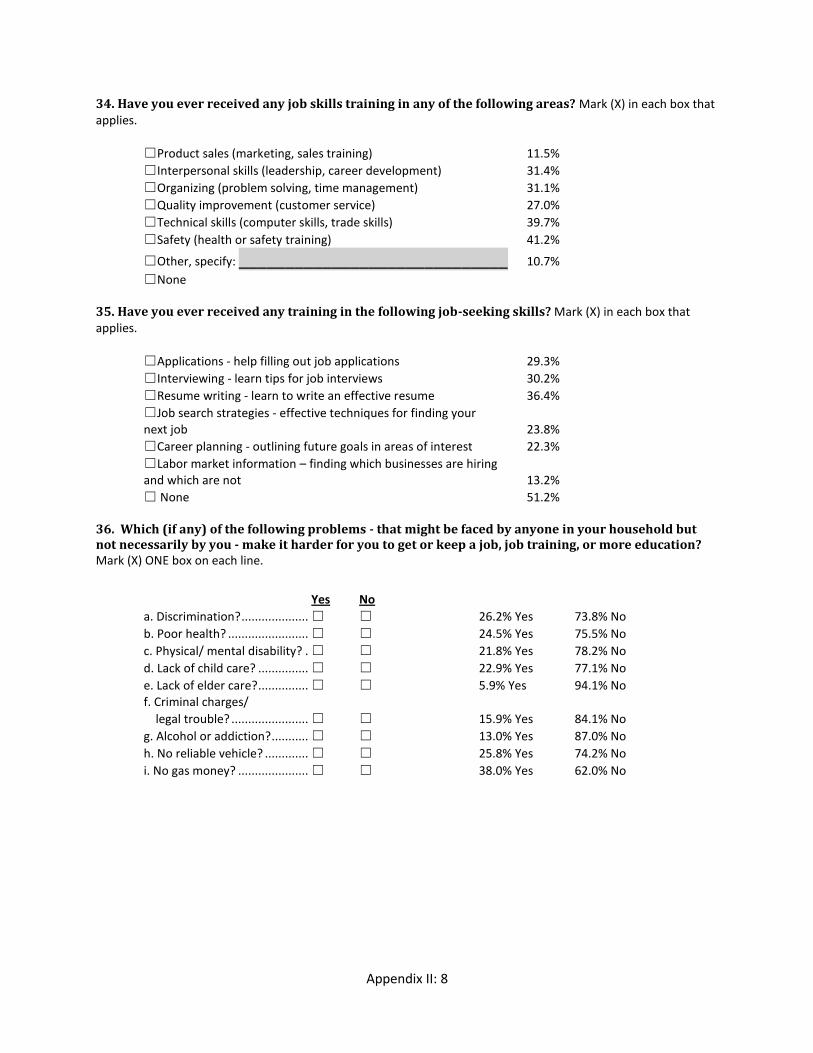
Appendix II: 8
34. Have you ever received any job skills training in any of the following areas? Mark (X) in each box that applies.
☐Product sales (marketing, sales training) 11.5%
☐Interpersonal skills (leadership, career development) 31.4%
☐Organizing (problem solving, time management) 31.1%
☐Quality improvement (customer service) 27.0%
☐Technical skills (computer skills, trade skills) 39.7%
☐Safety (health or safety training) 41.2%
☐Other, specify: _____________________________ 10.7%
☐None 35. Have you ever received any training in the following job-seeking skills? Mark (X) in each box that applies.
☐Applications - help filling out job applications 29.3%
☐Interviewing - learn tips for job interviews 30.2%
☐Resume writing - learn to write an effective resume 36.4%
☐Job search strategies - effective techniques for finding your next job 23.8%
☐Career planning - outlining future goals in areas of interest 22.3%
☐Labor market information – finding which businesses are hiring and which are not 13.2%
☐ None 51.2% 36. Which (if any) of the following problems - that might be faced by anyone in your household but not necessarily by you - make it harder for you to get or keep a job, job training, or more education? Mark (X) ONE box on each line.
Yes No
a. Discrimination? .................... ☐ ☐ 26.2% Yes 73.8% No
b. Poor health? ........................ ☐ ☐ 24.5% Yes 75.5% No
c. Physical/ mental disability? . ☐ ☐ 21.8% Yes 78.2% No
d. Lack of child care? ............... ☐ ☐ 22.9% Yes 77.1% No
e. Lack of elder care? ............... ☐ ☐ 5.9% Yes 94.1% No f. Criminal charges/
legal trouble? ....................... ☐ ☐ 15.9% Yes 84.1% No
g. Alcohol or addiction? ........... ☐ ☐ 13.0% Yes 87.0% No
h. No reliable vehicle? ............. ☐ ☐ 25.8% Yes 74.2% No
i. No gas money? ..................... ☐ ☐ 38.0% Yes 62.0% No

Appendix II: 9
37. Which (if any) of the following job training and education-related problems make it harder for you to get or keep a job, job training, or more education? Mark (X) ONE box on each line. Yes No
a. Lack of education? ............... ☐ ☐ 32.9% Yes 67.1% No
b. Lack of work experience? .... ☐ ☐ 30.1% Yes 69.9% No
c. Lack of job skill training? ...... ☐ ☐ 30.7% Yes 69.3% No
d. Lack of job search training? . ☐ ☐ 20.2% Yes 79.8% No e. Lack of money for
education or training? ......... ☐ ☐ 43.4% Yes 56.6% No
f. Lack of computer skills? ....... ☐ ☐ 33.8% Yes 66.2% No 38. Regarding Tribal Transit on the Flathead Reservation do any of the following keep you, yourself from getting or keeping a job, job training, or more education? Mark (X) ONE box on each line. Yes No
a. Limited pick-up or drop-off times? ..... ☐ ☐ 21.0% Yes 79.0% No
b. Limited pick-up or drop-off places? ... ☐ ☐ 18.7% Yes 81.3% No
c. Lack of a consistent schedule? ........... ☐ ☐ 19.4% Yes 80.6% No
d. Unaware of Tribal Transit? .. .............. ☐ ☐ 11.8% Yes 88.2% No 39. Which (if any) problem is the most important one that you run into when trying to get a job, job training, or education? Print the problem in the grey area below, otherwise mark (X) in the box.
_____________________________ _____________________________ _____________________________ _____________________________
☐None 40. Is there at least one telephone INSIDE your house, apartment, or mobile home that is currently working and is NOT a cell phone?
☐Yes 60.6%
☐No 39.4%
41. Do you or does anyone in your family have a working cell phone at this time? Please include a pre-paid phone only if it currently has minutes available.
☐Yes 88.4%
☐No 11.6% 42. Is there working cell phone coverage at your house, apartment, or mobile home?
☐Yes 83.4%
☐No 16.6%
43. Do you or your family in this residence have internet access through a computer at your house, apartment, or mobile home? Please do not include smart phones or mobile devices.
☐Yes 67.0%
☐No 33.0%

Appendix II: 10
44. Do you personally have a working auto, truck, van, or motorcycle that will reliably get you where you need to go, or not?
☐I have a working motor vehicle 85.0%
☐I do not have a working motor vehicle 14.2% Missing 0.8%
45. Do you, yourself have a current and valid driver’s license, or not?
☐I have a current, valid driver’s license 84.5%
☐I don’t have a current, valid driver’s license 14.5% Missing 1.0%
46. How many people currently live in your house, apartment, or mobile home?
____ Number of people Median = 3 persons
47. How many income earners currently live in this house?
____ Number of income earners Median = 1 person
48. What is your age? Please print the number of years in the grey box below.
____ Years old Median = 46 years old
49. What was your total household income FROM ALL SOURCES in the calendar year 2013? Print income in the grey box below. Please include:
Wages, salary, commissions, bonuses, or tips,
Self-employment income (business or farm),
Interest, dividends, rental income,
Social security or railroad retirement,
Supplemental Security Income,
Any public assistance,
Non-wage or salary Tribal payments,
Retirement or pensions,
Any other source of income regularly received such as Veterans’ payments, unemployment compensation, child support, or alimony.
$ _______________________ 2013 income $29,000 = median household income

Appendix II: 11
50. Of the possible business development priorities for the Confederated Salish and Kootenai Tribes, listed below, which should be the top three priorities? Please mark (X) up to three (3) of the highest priorities. Top Three Priorities(*)
☐Improve transportation infrastructure such as roads, rail, or air 10.4%
☐Improve communication infrastructure such as high speed internet, cell phone coverage 11.8%
☐Improve utility infrastructure such as water
quantity, sewage treatment, waste disposal, access to natural gas, or low cost power 17.2%
☐Develop or support businesses that take advantage of tourism 15.6%
☐Develop or support businesses that utilize natural resource extraction 8.2%
☐Develop or support businesses that are in or in support of the health care industry 16.6%
☐Attract businesses to the Reservation 23.3%*
☐Develop Tribally-owned agriculture businesses 18.4%
☐Develop or support businesses that support the arts, entertainment, or recreation 11.8%
☐Provide financial support to individuals that are starting their own business 24.6%*
☐Provide technical assistance, research, and development support for small businesses 14.7%
☐Develop new energy projects 12.4%
☐Increase the Tribes’ gaming activities / venues 20.9%*
☐Develop or support retail businesses that sell food, clothing, gas, or other consumer products 19.5%
☐Develop a real estate management and development business 4.0%

Appendix III: 1
Appendix 3: Entrepreneur/Business Owner Survey Methodological Summary
The Entrepreneur/Business Owner Survey is a
follow-up survey to the Confederated Salish and
Kootenai Tribes’ (CSKT) Job and Training Needs
Survey that was mailed out to over 3,000 Tribal
members in the late Spring/early summer of
2014.
Questionnaire Design The questionnaire for this survey was designed
to be a self-administered booklet transmitted to
respondents by mail. The questionnaire was
developed by the Bureau of Business and
Economic Research (BBER) and the CSKT
Sustainable Economic Development Project
Partners/Steering Committee, under the
supervision of Ms. Janet Camel of the CSKT
Economic Development Office. CSKT was the
final approval authority for the questionnaire
language.
Survey Administration The mailing list for this survey was developed
based on answers provided by respondents to
the initial CSKT Jobs and Training Survey.
Specifically, if a respondent to the Jobs and
Training Survey said that they were very
interested in starting a new business (Jobs and
Training Survey question 15) or that they
currently owned a business (Jobs and Training
Survey question 28); the respondent was added
to this follow-up survey’s mailing list. This draft
list was then supplemented by business owners
classified as Type 1 on the CSKT Indian
Preference Businesses list. The survey was
administered by BBER from August through
October 2014.
BBER printed, assembled, and mailed all printed
correspondence to the Tribal members
surveyed. The content of all correspondence
was pre-approved by CSKT.
The first mailing was the questionnaire packet.
The packet was mailed first class. The packet
consisted of a cover letter, the questionnaire,
and a return envelope. The cover letter was one
page in length and was printed on CSKT
letterhead and signed by the Tribal Chairman.
The questionnaire was in booklet form with an
attractive cover. A commemorative postage
stamp was placed on the return envelope.
This survey’s next correspondence to Tribal
members was a postcard thank you/reminder.
The postcard was mailed one week after the
questionnaire packet was mailed. The primary
purpose of the postcard was to jog the memory
of respondents who had not yet responded. A
secondary purpose was to thank those who had
responded.
Final Survey Outcomes
Number Status
350 Mailed
75 Completed
1 Bad addresses
274 Not completed

Appendix III: 2
Tribal entrepreneurs completed 75
questionnaires. BBER documented survey status
in a manner that allowed calculation and
reporting of a response rate. The response rate
is:
I / (I+P+NC+R+NI)
Where
I = completed surveys
P = partial surveys
NC = noncontacted but known eligible
R = refused eligible
NI = other non-completed.
The final response rate for this survey was
21.5%.
Data Set Preparation Following receipt of the survey responses, the
data were coded by BBER survey research
professionals. BBER then selected a random
sample of 10% of the entered cases for manual
verification of coding accuracy. The data
entered were also inspected to insure no
duplicate cases were included and to correct
any coding typos. Appropriate data labels were
added to the data set. Appropriate composite
variables and flags were added to the data set
to facilitate the analysis process.
Analysis BBER conducted a statistical analysis of the
survey data using statistical analysis computer
software (SPSS version 22, Copyright 2013, IBM
Corporation). BBER analyzed the data collected
using frequencies, cross-tabulations, and
standard measures of central tendency (mean,
median, mode).

Appendix IV: 1
Appendix 4: Entrepreneur/Business Owner Survey Questionnaire and Top-Line Results
Percentages are based on 75 completed questionnaires.
1. How interested are you, if at all, in receiving training in the following business subject areas?
a. Business plan development training? Mark (X) ONE box.
☐Very interested 50.6%
☐Somewhat interested 24.0%
☐Neither interested nor uninterested 10.7%
☐Somewhat uninterested 2.7%
☐Not at all interested 9.3%
Missing 2.7%
b. Marketing training? Mark (X) ONE box.
☐Very interested 45.2%
☐Somewhat interested 32.0%
☐Neither interested nor uninterested 6.7%
☐Somewhat uninterested 6.7%
☐Not at all interested 6.7%
Missing 2.7%
c. Financing training? Mark (X) ONE box.
☐Very interested 53.3%
☐Somewhat interested 26.7%
☐Neither interested nor uninterested 6.7%
☐Somewhat uninterested 1.3%
☐Not at all interested 9.3%
Missing 2.7%

Appendix IV: 2
d. Entrepreneurship training? Mark (X) ONE box.
☐Very interested 35.9%
☐Somewhat interested 30.7%
☐Neither interested nor uninterested 18.7%
☐Somewhat uninterested 1.3%
☐Not at all interested 10.7%
Missing 2.7%
e. Accounting training? Mark (X) ONE box.
☐Very interested 36.0%
☐Somewhat interested 38.7%
☐Neither interested nor uninterested 9.3%
☐Somewhat uninterested 4.0%
☐Not at all interested 9.3%
Missing 2.7%
f. Human resource management training? Mark (X) ONE box.
☐Very interested 28.0%
☐Somewhat interested 32.0%
☐Neither interested nor uninterested 20.0%
☐Somewhat uninterested 4.0%
☐Not at all interested 13.3%
Missing 2.7%
g. Logistics or supply chain management training? Mark (X) ONE box.
☐Very interested 20.0%
☐Somewhat interested 36.0%
☐Neither interested nor uninterested 17.3%
☐Somewhat uninterested 5.3%
☐Not at all interested 18.7%
Missing 2.7%
h. Business information systems training? Mark (X) ONE box.
☐Very interested 37.4%
☐Somewhat interested 36.0%
☐Neither interested nor uninterested 8.0%
☐Somewhat uninterested 8.0%
☐Not at all interested 9.3%
Missing 1.3%

Appendix IV: 3
i. Sales training? Mark (X) ONE box.
☐Very interested 26.7%
☐Somewhat interested 37.4%
☐Neither interested nor uninterested 13.3%
☐Somewhat uninterested 12.0%
☐Not at all interested 9.3%
Missing 1.3%
2. How interested are you, if at all, in leasing land for your business from Confederated Salish and
Kootenai Tribes? Mark (X) ONE box.
☐Very interested 38.8%
☐Somewhat interested 17.3%
☐Neither interested nor uninterested 12.0%
☐Somewhat uninterested 5.3%
☐Not at all interested 25.3%
Missing 1.3%
3. How interested are you, if at all, in leasing building space for your business from Confederated
Salish and Kootenai Tribes? Mark (X) ONE box.
☐Very interested 37.3%
☐Somewhat interested 20.0%
☐Neither interested nor uninterested 13.3%
☐Somewhat uninterested 4.0%
☐Not at all interested 22.7%
Missing 2.7%
4. If you need land or space, do you know about how much land or building space your business
needs? Please describe how much space or land you need in the space below.
Top three responses:
Both Land and Structures 9.3%
Up to five acres 8.0%
One to two acres 6.7%
5. Do you own your own business either as your main job or as a secondary job?
☐Yes 50.7%
☐No 48.0%
Missing 1.3%

Appendix IV: 4
6. How interested are you, if at all, in starting a new business? This could be in addition to one you
have now or to replace one you have now.
☐Very interested 49.3%
☐Somewhat interested 26.7%
☐Neither interested nor uninterested 6.7%
☐Somewhat uninterested 4.0%
☐Not at all interested 13.3%
7. If you own a business, does your business currently have collateral that you can use to help obtain
financing for your business, or not? Collateral here means a financial, property, or other asset that can be used
to secure repayment of a loan. Mark (X) ONE box.
☐My business currently has no collateral 10.7%
☐My business currently has some collateral but not enough to obtain financing needed 16.0%
☐My business currently has enough collateral to obtain financing needed 24.0%
☐I don’t own a business 49.3%
8. If you own a business, is your business currently seeking additional financing through loans or
investment, or not? Mark (X) ONE box.
☐My business is currently seeking financing 10.7%
☐My business is not currently seeking financing 40.0%
☐I don’t own a business 49.3%
9. If you own a business, would you say that you can currently obtain enough financing to meet your
business’s needs, or that you can’t obtain enough financing currently to meet your business’s needs?
Mark (X) ONE box.
☐I CAN currently obtain enough financing to meet my business’s needs 22.7%
☐I CAN’T currently obtain enough financing to meet my business’s needs 26.7%
☐I don’t own a business 49.3%
Missing 1.3%
9a. What is the main reason for your answer to question 9 above? Please write your answer on
the lines below.
Top three responses:
Can’t make payments, no cash flow 5.3%
Good credit 5.3%
Bad credit 5.3%

Appendix IV: 5
10. Do you, yourself, currently have a bank account, or not?
☐I DO currently have a bank account 96.0%
☐I DON’T currently have a bank account 4.0%
11. Do you, yourself, currently have a consumer loan with Tribal Credit, a credit union, or a bank, or
not?
☐I DO currently have a consumer loan 60.0%
☐I DON’T currently have a consumer loan 38.7%
Missing 1.3%
12. If you own a business, do you or does your business currently have a business loan with Tribal
Credit, a credit union, or a bank, or not?
☐I or my business DO currently have a business loan 17.3%
☐I or my business DON’T currently have a business loan 33.4%
☐I don’t own a business 49.3%
13. If you own a business, do you currently use a credit card(s) for your business or not?
☐I DO currently use a credit card(s) for my business 20.0%
☐I DON’T currently use a credit card(s) for my business 60.0%
Missing 20.0%
14. If you own a business, is your business on the Confederated Salish and Kootenai Tribes Indian
Preference List, or not? Mark (X) ONE box.
☐My business is on the Indian Preference List 29.4%
☐My business is not on the Indian Preference List 21.3%
☐I don’t own a business 49.3%
14a. If your business is not on the Indian Preference List, why is it not on the list? Please write
your answer on the lines below.
Top four responses:
Not relevant to business 13.3%
List is not followed by Tribes or Departments 4.0%
Do not know how to do so 2.7%
Intend to do so 2.7%

Appendix IV: 6
15. If you own a business, what is the name of your main business? Please print the name in the grey
area below:
_____________________________ Not reported to maintain respondent confidentiality.
_____________________________
_____________________________
_____________________________ ☐I don’t own a business
16. If you own a business, what kind of business is this? Please describe the activity in the grey area
below. For example: Retail food store, home building, newspaper publishing, mail order house, auto engine
repair, or bank, etc.
Top seven responses:
Construction of Buildings 5.3%
Beef Cattle Ranching and Farming 4.0%
Food Service Contractors 2.7%
Miscellaneous Building Equipment Contractors 2.7%
Miscellaneous Manufacturing 2.7%
Environmental Consulting Services 2.7%
Fire Protection 2.7%
17. If you own a business, is this business mainly? Mark (X) ONE box.
☐Manufacturing? 5.3%
☐Wholesale trade? 1.3%
☐Retail trade? 13.3%
☐Other (agriculture, construction, service, etc.)? 29.4%
☐I don’t own a business 49.4%
Missing 1.3%
18. If you own a business, what kinds of work do you, yourself do in this business? Print in the grey area
below. For example: registered nurse, heavy equipment operator, computer network administration, automotive
repair, or carpentry, plumbing, electrical trades.
Top six responses:
Construction Managers 14.7%
Miscellaneous Managers 8.0%
Farmers, Ranchers and other Agricultural Managers 6.7%
Food Service Managers 2.7%
Miscellaneous Financial Specialists 2.7%
Textile, Apparel, and Furnishings Workers 2.7%
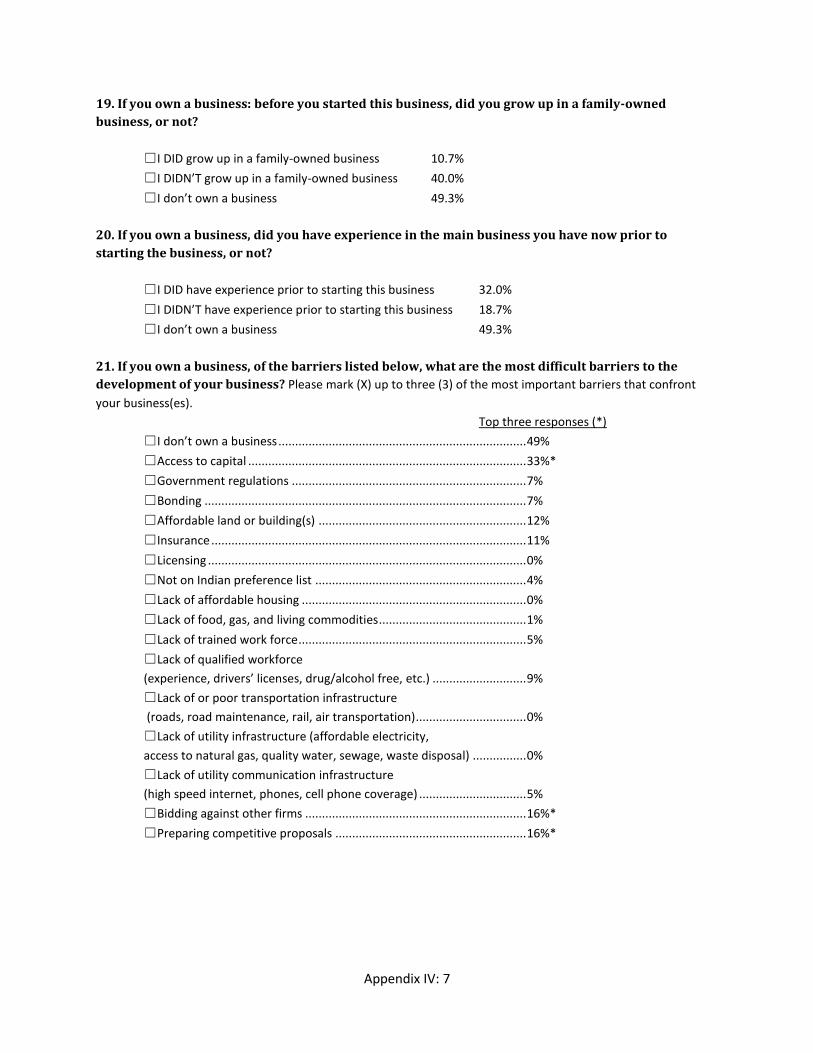
Appendix IV: 7
19. If you own a business: before you started this business, did you grow up in a family-owned
business, or not?
☐I DID grow up in a family-owned business 10.7%
☐I DIDN’T grow up in a family-owned business 40.0%
☐I don’t own a business 49.3%
20. If you own a business, did you have experience in the main business you have now prior to
starting the business, or not?
☐I DID have experience prior to starting this business 32.0%
☐I DIDN’T have experience prior to starting this business 18.7%
☐I don’t own a business 49.3%
21. If you own a business, of the barriers listed below, what are the most difficult barriers to the
development of your business? Please mark (X) up to three (3) of the most important barriers that confront
your business(es).
Top three responses (*)
☐I don’t own a business .......................................................................... 49%
☐Access to capital ................................................................................... 33%*
☐Government regulations ...................................................................... 7%
☐Bonding ................................................................................................ 7%
☐Affordable land or building(s) .............................................................. 12%
☐Insurance .............................................................................................. 11%
☐Licensing ............................................................................................... 0%
☐Not on Indian preference list ............................................................... 4%
☐Lack of affordable housing ................................................................... 0%
☐Lack of food, gas, and living commodities ............................................ 1%
☐Lack of trained work force .................................................................... 5%
☐Lack of qualified workforce
(experience, drivers’ licenses, drug/alcohol free, etc.) ............................ 9%
☐Lack of or poor transportation infrastructure
(roads, road maintenance, rail, air transportation) ................................. 0%
☐Lack of utility infrastructure (affordable electricity,
access to natural gas, quality water, sewage, waste disposal) ................ 0%
☐Lack of utility communication infrastructure
(high speed internet, phones, cell phone coverage) ................................ 5%
☐Bidding against other firms .................................................................. 16%*
☐Preparing competitive proposals ......................................................... 16%*

Appendix IV: 8
22. What is the most important barrier to you starting a new business or expanding a current
business? Please write your answer on the lines below.
Top four responses:
Capital, access to capital, money, financing 44.0%
Time 9.3%
Tribes use business, preference, Tribal support 6.7%
Business plan development 5.3%
23. What do the Confederated Salish and Kootenai Tribes do well to assist business owners? Please
write your answer on the lines below.
Top five responses:
Don’t know what they do to assist 30.7%
Nothing, do not help, not much 13.3%
Indian Preference, using Tribal contractors, Tribes use our business 9.3%
Financial 5.3%
Business classes 4.0%
24. What should the Confederated Salish and Kootenai Tribes do better to assist business owners?
Please write your answer on the lines below.
Top four responses:
Education, training, business plan development, grant application writing 24.0%
Financial 18.7%
Use/enforce/strengthen Indian Preference, train departments in procurement policies 18.7%
Communicate to members opportunities and who to talk to, availability for assistance 4.0%
The Confederated Salish and Kootenai Tribes thank you for your time and effort!
Top Related