


Languages
Pages
Legal


8/3/2019 ComScore Monetizing the Internet April2011
http://slidepdf.com/reader/full/comscore-monetizing-the-internet-april2011 1/48
Monetizing the Internet Through Sales and Advertising
Gian Fulgoni
Executive Chairman and Co-Founder, comScore Inc.

8/3/2019 ComScore Monetizing the Internet April2011
http://slidepdf.com/reader/full/comscore-monetizing-the-internet-april2011 2/48
2 © comScore, Inc. Proprietary and Confidential.
comScore is a Global Market Research Company and Leader inMeasuring the Digital World
NASDAQ SCOR
Founded August 1999
Clients 1,750 worldwide
Employees 1,000+
Headquarters Reston, VA
Global Coverage 170+ countries undermeasurement;43 markets reported
Local Presence 30+ locations in 21 countries
V0910
8/3/2019 ComScore Monetizing the Internet April2011
http://slidepdf.com/reader/full/comscore-monetizing-the-internet-april2011 3/48
3 © comScore, Inc. Proprietary and Confidential.
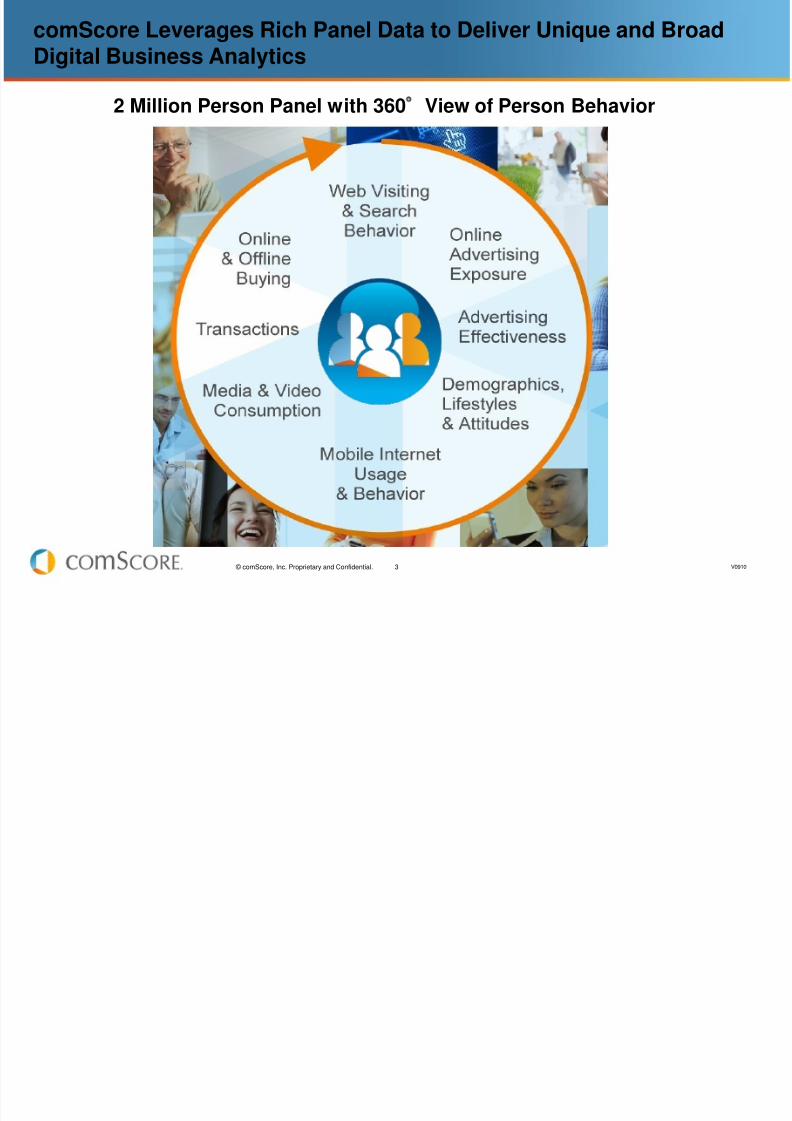
comScore Leverages Rich Panel Data to Deliver Unique and BroadDigital Business Analytics
2 Million Person Panel with 360°View of Person Behavior
V0910

8/3/2019 ComScore Monetizing the Internet April2011
http://slidepdf.com/reader/full/comscore-monetizing-the-internet-april2011 4/48
4 © comScore, Inc. Proprietary and Confidential.
The Internet as a Sales Channel

8/3/2019 ComScore Monetizing the Internet April2011
http://slidepdf.com/reader/full/comscore-monetizing-the-internet-april2011 5/48
5 © comScore, Inc. Proprietary and Confidential.
In 2010, Consumers Spent $228 Billion Online. With the Advantages of Lower Pricesand Convenience, E-commerce Continued to Grow in Importance in Q1 2011 and toRebound from Recession
$42 $53 $67 $82 $102$123 $130 $130
$142
$38
$30$40
$51
$61
$69
$77 $84 $80$85
$22
2002 2003 2004 2005 2006 2007 2008 2009 2010 2011
$72$93
$117$143
Retail
Travel
+29%
+26%
+22%
+19%
+26%
+33%
+26%
+28%
+20%
+24%+24%
+13%
$171
$200
+17%
+20%
+12%
+6%
+9%
+7%
$214
0%
-5%
$209
-2%
U.S. E-commerce Dollar Sales Growth ($ Billions)Source: comScore e-Commerce Measurement
+10%
+6%
+9%
$228
+12%
+9%
Q1

8/3/2019 ComScore Monetizing the Internet April2011
http://slidepdf.com/reader/full/comscore-monetizing-the-internet-april2011 6/48
6 © comScore, Inc. Proprietary and Confidential.
E-commerce continues to gain share of retail spending on an apples-to-apples basis and is approaching 10%
*Note: e-Commerce share is shown as a percent of DOC’s Total
Retail Sales excluding Food Service & Drinking, Food & Bev. Stores,
Motor Vehicles & Parts, Gasoline Stations and Health & PersonalCare Stores.
e-Commerce Share of Corresponding Retail Spending*
Source: comScore for e-Commerce & U.S. Department of Commerce (DOC) for Retail
e - C o m m e r c e S
h a r e
e-Commerce share peaks incolder seasons (Q4 & Q1)
4.3%
3.7%4.0%
4.6%
5.1%
4.3%4.5%
5.3%
5.9%
5.0%5.3%
6.4%
6.7%
5.9%6.3%
7.4% 7.3%
6.5%6.6%
7.6% 7.7%
6.8%6.9%
7.7%8.1%
7.1% 7.1%
8.0%
8.6%
0.0%
1.0%
2.0%
3.0%
4.0%
5.0%
6.0%
7.0%
8.0%
9.0%

8/3/2019 ComScore Monetizing the Internet April2011
http://slidepdf.com/reader/full/comscore-monetizing-the-internet-april2011 7/48
7 © comScore, Inc. Proprietary and Confidential.
Rising gas prices have historically had a negative impact on e-commerce spending growth. Will that re-occur?
-10%
-5%
0%
5%
10%
15%
20%
25%
30%
Y/Y % Change in Retail E-Commerce SpendingSource: comScore E-Commerce Measurement, Jan-07 - Mar-11
$2.96/gallon $4.14/gallon

8/3/2019 ComScore Monetizing the Internet April2011
http://slidepdf.com/reader/full/comscore-monetizing-the-internet-april2011 8/48
8 © comScore, Inc. Proprietary and Confidential.
In the Consumer Electronics category, e-commerce is having aprofound negative impact on offline sales
Some key observations: E-commerce represents 30%+ of all sales of consumer electronics
Spending on the consumer electronics category at retail during theholiday season was down 5%* while online saw growth of 20%**.
Domestic same store sales of Best Buy declined by 5% and totalsales declined by 3% in Q4 2010
Online sales of Best Buy increased by 13% in December
comScore data show Amazon consumer electronics sales up 37%
Source: *NPD & ** comScore
Forecast for Best Buy: Worst Is Yet to Come
Tuesday, March 8, 2011
2010 f hi i bl d 2009 il l N b

8/3/2019 ComScore Monetizing the Internet April2011
http://slidepdf.com/reader/full/comscore-monetizing-the-internet-april2011 9/48
9 © comScore, Inc. Proprietary and Confidential.
2010 free shipping patterns resembled 2009 until late Novemberwhen free shipping surged to 55%. For the remainder of the season,2010 outpaced 2009 by 7-12 percentage points
41% 41%
47%
50%
46%44% 45%
40%44%
41%
44% 45%45%
50%
55%
51% 52%52%
54%
50%
30%
35%
40%
45%
50%
55%
60%
3 1 - O c t
- 1 0
2 - N o v
- 1 0
4 - N o v
- 1 0
6 - N o v
- 1 0
8 - N o v
- 1 0
1 0 - N o v
- 1 0
1 2 - N o v
- 1 0
1 4 - N o v
- 1 0
1 6 - N o v
- 1 0
1 8 - N o v
- 1 0
2 0 - N o v
- 1 0
2 2 - N o v
- 1 0
2 4 - N o v
- 1 0
2 6 - N o v
- 1 0
2 8 - N o v
- 1 0
3 0 - N o v
- 1 0
2 - D e c
- 1 0
4 - D e c
- 1 0
6 - D e c
- 1 0
8 - D e c
- 1 0
1 0 - D e c
- 1 0
1 2 - D e c
- 1 0
1 4 - D e c
- 1 0
1 6 - D e c
- 1 0
1 8 - D e c
- 1 0
2 0 - D e c
- 1 0
2 2 - D e c
- 1 0
2 4 - D e c
- 1 0
2 6 - D e c
- 1 0
2 8 - D e c
- 1 0
3 0 - D e c
- 1 0
1 - J a n
- 1 1
2009 2010
Percentage of e-Commerce Transactions with Free Shipping
Source: comScore e-Commerce Measurement
Average Order Value on free shipping purchases was $110 during holiday
season 2010. For non-free shipping purchases it was $95.
2010 outpaced 2009 by12 percentage points the
final Monday beforeChristmas

8/3/2019 ComScore Monetizing the Internet April2011
http://slidepdf.com/reader/full/comscore-monetizing-the-internet-april2011 10/48
10 © comScore, Inc. Proprietary and Confidential.
Is pricing power shifting to the consumer?
Percent Change March 2011 vs. March 2010
Total Visits VisitorsTotal VisitorsMar-11 (MM)
Social Networking Site Category +21% +10% 204
Retail Site Category -5% +9% 183
Comparison Shopping Site Category +4% +8% 84
Coupon Site Category +35% +30% 38
Twitter +27% +15% 26
Groupon +533% +468% 12
LivingSocial +426% +304% 7
96% of retailers have e- mail marketing programs …Internet Retailer U.S. in-store sales influenced by online consumer research expected to account
for 50% of all retail sales in 2012 … Credit Suisse
Source: comScore Media Metrix, March 2011 vs. March 2010
Total Searches UniqueSearchers No. SearchersMar-11 (MM)
Core Search Engines +22% +0% 216
The Internet provides an ever increasing variety of ways for consumers toobtain information on prices, promotions and product features, contributing
to a frenzy of online activity.
A d th ‟ 31% f f f

8/3/2019 ComScore Monetizing the Internet April2011
http://slidepdf.com/reader/full/comscore-monetizing-the-internet-april2011 11/48
11 © comScore, Inc. Proprietary and Confidential.
And there‟s more: 31% of consumers now own or use some form of
smartphone or Internet-capable digital media device. This issignificantly higher among higher-income consumers
Smartphone Ownership and Usage
Q. Do you own or use a smartphone or digital media device, such as an iPhone, iPad, Droid, Blackberry orsimilar device?
Source: comScore Survey – January 2011
31%
67%
2%
Yes No Not sure
19%
32%
47%
Under $50k
$50k - $99k
$100k+
% who own or use a smartphone
Smartphone Ownership/usage (by income)

8/3/2019 ComScore Monetizing the Internet April2011
http://slidepdf.com/reader/full/comscore-monetizing-the-internet-april2011 12/48
12 © comScore, Inc. Proprietary and Confidential.
72 Million People (31% of 234 Million U.S. Mobile Subscribers) NowUse a Smartphone to Access a Wide Variety of Content
0
10,000
20,000
30,000
40,000
50,000
60,000
70,000
80,000
SocialNetworking
Classifieds OnlineRetail
GeneralReference
Maps ShoppingGuides
RestaurantInfo
Weather AuctionSites
PersonalEmail
U n i q u e U s e r ( 0 0 0 )
Fastest Growing Mobile Site Content Categories by Total Audience (000)Source: comScore MobiLens, 3 mo. avg. ending Dec-2010 versus Dec-2009
Dec-09 Dec-10
+ 55% + 53%
+ 47%
+ 46%
+ 46%
+ 45%
+ 45%
+ 45%
+ 39%
+ 56%
When it Comes to Mobile Content Consumption, Social Networking Ranks as Fastest Growing
Category, Followed by Classifieds and Retail
8/3/2019 ComScore Monetizing the Internet April2011
http://slidepdf.com/reader/full/comscore-monetizing-the-internet-april2011 13/48
13 © comScore, Inc. Proprietary and Confidential.
Building Sales with Online Marketing:
Lessons Learned

8/3/2019 ComScore Monetizing the Internet April2011
http://slidepdf.com/reader/full/comscore-monetizing-the-internet-april2011 14/48
14 © comScore, Inc. Proprietary and Confidential.
2010 U.S. Measured Media Spend
$149 Billion
D i r e
c t
R e s p o
n s e
B r a n d i n g
$91B
$58B
2010 U.S. Online Media Spend$26 Billion
$6B
$20B
Internet is lagging in capturing branding dollars. Online spend in 2010accounted for 34% of all media direct response spend, while online spend forbranding remained unchanged at $6B, or only 6% of all media branding addollars.
61%
39%
6% ofbrandingdollars
34% of direct
responsedollars
Source: Brand.net analysis based on Barclays Capital and DMA
$18Billionin 2009
$6 Billionin 2009

8/3/2019 ComScore Monetizing the Internet April2011
http://slidepdf.com/reader/full/comscore-monetizing-the-internet-april2011 15/48
15 © comScore, Inc. Proprietary and Confidential.
What We‟ve Learned About Online Advertising
The Click is at Best an Incomplete and at Worst a
Misleading Metric
Accurate Delivery of Media Plan is Critical
Creative Remains Extremely Important Digital Ad Campaigns Lift In-Store Sales
In CPG: “Is Online the New Print”
Video Holds the Key to Powerful Online Branding
Campaigns

8/3/2019 ComScore Monetizing the Internet April2011
http://slidepdf.com/reader/full/comscore-monetizing-the-internet-april2011 16/48
16 © comScore, Inc. Proprietary and Confidential.
Clicks are at Best an Incomplete and at Worst a
Misleading Metric

8/3/2019 ComScore Monetizing the Internet April2011
http://slidepdf.com/reader/full/comscore-monetizing-the-internet-april2011 17/48
17 © comScore, Inc. Proprietary and Confidential.
Clickers Represent a Small and Declining Segment of Internet Users
July 2007 March 2009
• There are 50% fewer clickers today (16%) than in July 2007 (32%)
• 8% of all Internet users account for 85% of all clicks
• Optimizing against clicks means ignoring 84 percent of Internet users
Non-Clickers
68%
Clickers32%
Non-Clickers
84%
Clickers16%
Source: comScore, Inc. custom analysis, Total US OnlinePopulation, persons, July 2007 and March 2009 data periods

8/3/2019 ComScore Monetizing the Internet April2011
http://slidepdf.com/reader/full/comscore-monetizing-the-internet-april2011 18/48
18 © comScore, Inc. Proprietary and Confidential.
Global Click Rates on Individual Campaigns are Pitifully Low. In theU.S., Only One in a Thousand Ads in a Campaign are Clicked
Source: DoubleClick DART for Advertisers, a cross section of regions,January – December 2008
0.13%
0.14%
0.14%
0.14%
0.15%
0.16%
0.17%
0.18%
0.18%
0.20%
0.20%
0.21%
0.26%
0.29%
Germany
New Zealand
Spain
Turkey
Austria
Netherlands
Belgium
China
Greece
India
Singapore
Hong Kong
United Arab Emirates
Malaysia
0.07%
0.08%
0.08%
0.08%
0.09%
0.10%
0.10%
0.10%
0.10%
0.11%
0.11%
0.12%
0.12%
0.12%
.
.
.
.
.
Norway
Ireland
Luxembourg
United Kingdom
Finland
Australia
Canada
Sweden
United States
Hungary
Switzerland
Denmark
France
Italy
Worldwide Click-Through Rates*
*Click-through rates across Static Image, Flash, and Rich Media formats

8/3/2019 ComScore Monetizing the Internet April2011
http://slidepdf.com/reader/full/comscore-monetizing-the-internet-april2011 19/48
19 © comScore, Inc. Proprietary and Confidential.
The Meddlesome Click ….Some Agencies Get It
“A click means nothing. A click earns no revenue and creates
no brand equity. Your online advertising has some goal – and it’s surely not to generate clicks. Regardless of whether they
clicked an ad or not, the key is to determine how that ad unit influenced a consumer to think, feel, or do something they wouldn’t have done otherwise.”
John Lowell
SVP Director, Research & Analytics
Starcom
“I spend a lot of time fighting against media metrics that don’t matter”
Kate Sirkin
EVP Global Research
Starcom MediaVest Group

8/3/2019 ComScore Monetizing the Internet April2011
http://slidepdf.com/reader/full/comscore-monetizing-the-internet-april2011 20/48
20 © comScore, Inc. Proprietary and Confidential.
But, Many Agency and Advertisers Still Preoccupied with the Click
Source: Feb 2010 Collective Survey
of 420 Agency and Advertiser Executives
0% 20% 40% 60% 80%
CTR
CPC
CPA
Ability to Drive BrandAwareness
Interaction Rate
Ability to Drive BrandFavorability
64%
61%
48%
35%
33%
25%
What Metrics Do You Use To EvaluateAd Network Performance?
J l Of Ad ti i R h

8/3/2019 ComScore Monetizing the Internet April2011
http://slidepdf.com/reader/full/comscore-monetizing-the-internet-april2011 21/48
21 © comScore, Inc. Proprietary and Confidential.
Journal Of Advertising Research:comScore‟s “Whither the Click?”
Journal of Advertising Research, June 2009
“What We Know About Advertising: 21 Watertight Laws for
Intelligent Advertising Decisions”
comScore‟s “Whither the Click?”
– 200+ comScore studies conducted in the U.S. to assess
behavioral impact of paid search and online display ads.
21
Even with Minimal Clicks,Display Advertising Proven to Lift:
• Site visitation• Trademark search queries• Online and offline sales
Prof. Byron Sharp, Ehrenberg Bass Institute, University of South AustraliaProf. Jerry Wind, The Wharton School

8/3/2019 ComScore Monetizing the Internet April2011
http://slidepdf.com/reader/full/comscore-monetizing-the-internet-april2011 22/48
Despite click rates of only 0 1% comScore research has shown that

8/3/2019 ComScore Monetizing the Internet April2011
http://slidepdf.com/reader/full/comscore-monetizing-the-internet-april2011 23/48
23 © comScore, Inc. Proprietary and Confidential.
$994
$9,905
$1,263
$11,550
Online Offline
Unexposed Exposed
Dollar Sales Lift Among Households
Exposed to Online Advertising
% Lift: 17%
% Lift: 27%
Despite click rates of only 0.1%, comScore research has shown thatdisplay ads can successfully lift retailer sales – both online andoffline
Source: “Whither the Click?” 139 comScore studies in theJune 2009 Journal of Advertising Research
Exposure to display adsdoesn‟t just impact onlinesales – it lifts in-storesales as well
The absolute dollar liftin offline sales is 5x higherthan the lift in e-commercesales
The click is misleadingas a measure of campaigneffectiveness
Conclusions

8/3/2019 ComScore Monetizing the Internet April2011
http://slidepdf.com/reader/full/comscore-monetizing-the-internet-april2011 24/48
24 © comScore, Inc. Proprietary and Confidential.
Accurate Delivery of Media Plan is Critical

8/3/2019 ComScore Monetizing the Internet April2011
http://slidepdf.com/reader/full/comscore-monetizing-the-internet-april2011 25/48
25 © comScore, Inc. Proprietary and Confidential.
Cookie Deletion is a Global Reality … and a Global Challenge
Ad Server Cookies Web Site Cookies
Country
Percent of
computersdeleting
Average # ofcookies per
computerfor samecampaign
Percent of
computersdeleting
Average # ofcookies per
computerfor sameweb site
Australia 37% 5.7 28% 2.7
Brazil 40% 6.6 33% 2.5
U.K. 35% 5.9 27% 2.7
U.S. 35% 5.4 29% 3.5

8/3/2019 ComScore Monetizing the Internet April2011
http://slidepdf.com/reader/full/comscore-monetizing-the-internet-april2011 26/48
26 © comScore, Inc. Proprietary and Confidential.
Because of Multiple Users on a Computer, Cookies Can‟t Always Accurately
Identify who is Using a Computer at any Given Point in Time
Over 64% of home users share a home computer with other usersThe average number of users per machine is 2.1
Percent of Machines Percent of People

8/3/2019 ComScore Monetizing the Internet April2011
http://slidepdf.com/reader/full/comscore-monetizing-the-internet-april2011 27/48
27 © comScore, Inc. Proprietary and Confidential.
Ad frequency needs to be closely monitored:Ad server delivery can be problematic
010
20
30
40
50
60
70
65%
17%
7%11%
Percent of PeopleBy Frequency of Exposure
-
10
20
30
4050
60
21%
14%11%
54%
Percent of ImpressionsBy Frequency of Exposure
1 to 2 3 to 5 6 to 9 10+
1 to 2 3 to 5 6 to 9 10+
C i D li C Mi T t d A di

8/3/2019 ComScore Monetizing the Internet April2011
http://slidepdf.com/reader/full/comscore-monetizing-the-internet-april2011 28/48
28 © comScore, Inc. Proprietary and Confidential.
Campaign Delivery Can Miss Targeted Audiences.Target for this Health & Well Being product was females age 35-54
Male40%
% C o m p o s i t i o n o f E x p o s e d A u d i e n c e
Female60%
40% of exposed consumers outside of planned gender target
14.4%
17.3%
25.3%
22.4%
20.6%
55+
Only 43% of females
exposed to thecampaign met thetargeted age group
Only 25% of all exposed consumers met planned targeting criteria
45-54
35-44
25-34
15-24

8/3/2019 ComScore Monetizing the Internet April2011
http://slidepdf.com/reader/full/comscore-monetizing-the-internet-april2011 29/48
29 © comScore, Inc. Proprietary and Confidential.
comScore‟s „Campaign Essentials‟ Real Time Reporting Dashboard
“How Many, Who, Which, Where?”

8/3/2019 ComScore Monetizing the Internet April2011
http://slidepdf.com/reader/full/comscore-monetizing-the-internet-april2011 30/48
30 © comScore, Inc. Proprietary and Confidential.
Creative is Extremely Important:
Proven Strategic Elements are a Must

8/3/2019 ComScore Monetizing the Internet April2011
http://slidepdf.com/reader/full/comscore-monetizing-the-internet-april2011 31/48
31 © comScore, Inc. Proprietary and Confidential.
The value of creative: In TV and Print, over 50% of the impact ofadvertising is driven by the strength of creative
Ad Quality52%
Media Plan13%
Other35%
*Quality of creative is based on ARS Persuasion Score which measures changes inconsumer preference through a simulated purchase exercise with and withoutexposure to the creative .
comScore ARS Global Validation Summary includes an evaluation of 396 TV ad
campaigns, utilizing sales data from R. L. Polk New Vehicle Registration, IMSHEALTH, IRI InfoScan, Markettrack, Nielsen SCANTRACK or Nielsen Retail Index.
Media Plan = Elements such as GRPs, wearout & continuity/flighting of airing
Ad Quality = Quality of the creative based on ARS Persuasion Score* .
Other = Price, promotion and distribution
% Influence on shifts in brand salesSource: Source: comScore ARS Global Validation Summary
Creative is 4x More
Impactful in
Influencing SalesThan
The Media Plan
Numbers represent the percent variance in sales shifts explained by the corresponding factors.

8/3/2019 ComScore Monetizing the Internet April2011
http://slidepdf.com/reader/full/comscore-monetizing-the-internet-april2011 32/48
32 © comScore, Inc. Proprietary and Confidential.
Digital Campaigns Lift In-Store Sales for CPG:
• Is “Online the New Print?”
Sh t T Offli Lift i CPG B d S l F O li Ad ti i

8/3/2019 ComScore Monetizing the Internet April2011
http://slidepdf.com/reader/full/comscore-monetizing-the-internet-april2011 33/48
33 © comScore, Inc. Proprietary and Confidential.
Short Term Offline Lift in CPG Brand Sales From Online AdvertisingMatches Longer Term TV Impact: Is Online the New Print?
TV (BehaviorScan) Internet (comScore)
+8%+9%
BehaviorScan tests conducted over one year periodcomScore studies over three months*
*Assumes 40% HH Internet Reach Against Target
Hypothesis 1: More precise targeting on the Internet allows more impressions to bedelivered against target audience in a given period of time
Hypothesis 2: Online ads include more messages about price and promotion than TV ads,which tend to be mainly focused on branding
Not Surprisingly, Purchase-Based Targeting Has Been Shown To Drive

8/3/2019 ComScore Monetizing the Internet April2011
http://slidepdf.com/reader/full/comscore-monetizing-the-internet-april2011 34/48
34 © comScore, Inc. Proprietary and Confidential.
Offline Sales Lift in 3-Months from Online Advertising for CPG Brands
p g y, g gEven Higher Lifts In In-store Sales Than Non-Behaviorally TargetedCampaigns
*Source: comScore Offline Sales Lift Norms, 2011**Source: comScore Audience Advantage, which leverages sophisticated predictivetargeting algorithms that are created using anonymous panel and census data sources;targeting was deployed on the Microsoft Network sites
Note: Retail sales is measured by linking the comScore panel of 1 million U.S. Internetusers to their retailer loyalty card data from dunnhumby, which provides a measure of thepanelist‟s in-store buying activity.
9%
22%
38%
40% Internet Reach
Against InternetPopulation*
100% Internet Reach
Against InternetPopulation*
Purchase-Based
Targeting**

8/3/2019 ComScore Monetizing the Internet April2011
http://slidepdf.com/reader/full/comscore-monetizing-the-internet-april2011 35/48
35 © comScore, Inc. Proprietary and Confidential.
Purchase-Based Targeting Shows Great Promise
Four large CPG brands used this solution to achieve significant results in
both sales and unit lift as well as overall return on their media spend.Campaign #1:
-Food & grocery
-Sales return on each
media dollar spent: $4.20*
ROI: 110%**
Campaign #2:
-Cleaning product
-Sales return on each
media dollar spent: $3.91*
ROI : 95%**
Sales/HH
+80.6%lift
Units/HH
+88.6%lift
Campaign #3:
-Food & grocery
-Sales return on each
media dollar spent: $5.77*
ROI: 190%**
Sales/HH
+54.8%lift
Units/HH
+65.3%lift
Sales/HH
+51.6%lift
Units/HH
+49.3%lift
90-99%, statistical significant lift
Campaign #4:
-Candy Company
-Sales return on each
media dollar spent: $1.72*
ROI: 85%**
Sales/HH
+39%lift
Units/HH
+28%lift
Source: comScore Audience Advantage, which leverages sophisticated predictivetargeting algorithms that are created using anonymous panel and census data sources;targeting was deployed on the Microsoft Network sites
*Each campaign spent $300K in total media value
** Assumes a 50% marginal profit contribution

8/3/2019 ComScore Monetizing the Internet April2011
http://slidepdf.com/reader/full/comscore-monetizing-the-internet-april2011 36/48
36 © comScore, Inc. Proprietary and Confidential.
1Cases drawn from comScore ARS test databases and balanced by category (n=100 for digital display ads, n=3,681 for Television Ads)
Proven Strategic Branding Drivers are Used at a Much Lower Rate in Digital Ads
Proven Branding ElementDigital Display Ads1
(Rich Media, Banners,Rectangles)
Television Ads1
Brand Differentiating Key Message 17% 31%
New Product/New Feature Information 19% 44%
Product Convenience (explicit & stated) 0% 9%
Competitive Comparison 10% 24%
Superiority Claim 13% 26%
Percent of Ads Containing Element
B t C i S l A M Lik l Wh St t i D i A

8/3/2019 ComScore Monetizing the Internet April2011
http://slidepdf.com/reader/full/comscore-monetizing-the-internet-april2011 37/48
37 © comScore, Inc. Proprietary and Confidential.
Elementspresent
…But, Campaign Sales Are More Likely When Strategic Drivers Are
Used in Digital
Source: comScore blinded case studiesSeptember 2010
-20.6
0.0 6.07.3
21.8
31.1 32.0 33.4
48.0 48.4
75.0 75.980.0
-25
0
25
50
75
100
Percent Lift in Sales (Exposed vs. Control)
Elements notpresent

8/3/2019 ComScore Monetizing the Internet April2011
http://slidepdf.com/reader/full/comscore-monetizing-the-internet-april2011 38/48
38 © comScore, Inc. Proprietary and Confidential.
But Price / Promotion Used Much More Frequently
ElementDigital Display Ads1
(Rich Media, Banners, )Television Ads1
Brand Differentiating Key Message 17% 31%
New Product/New Feature Information 19% 44%
Product Convenience (explicit & stated) 0% 9%
Competitive Comparison 10% 24%
Superiority Claim 13% 26%
Price Reductions / Coupons / Samples 44% 8%
Percent of Ads Containing Element
1Cases drawn from comScore ARS test databases and balanced bycategory (n=100 for digital display ads, n=3,681 for Television Ads)
Inclusion of promotion / price incentives in online ads

8/3/2019 ComScore Monetizing the Internet April2011
http://slidepdf.com/reader/full/comscore-monetizing-the-internet-april2011 39/48
39 © comScore, Inc. Proprietary and Confidential.
Inclusion of promotion / price incentives in online adshelps lift offline sales
Source: comScore blinded case studiesSeptember 2010
26.8%28.4%
39.5%
48.9%
0.0%
20.0%
40.0%
60.0%
No Value Information Coupon Only Free Sample Explicit Value Claim
Percent Lift in Sales (Exposed vs. Control)

8/3/2019 ComScore Monetizing the Internet April2011
http://slidepdf.com/reader/full/comscore-monetizing-the-internet-april2011 40/48
40 © comScore, Inc. Proprietary and Confidential.
Video Holds the Key to Capturing Branding Dollars
Online Viewing of Video in February 2011 Reached 83% of Online

8/3/2019 ComScore Monetizing the Internet April2011
http://slidepdf.com/reader/full/comscore-monetizing-the-internet-april2011 41/48
41 © comScore, Inc. Proprietary and Confidential.
Online Viewing of Video in February 2011 Reached 83% of OnlineUsers
NUMBER OF VIEWERS 173 Million
% OF INTERNET AUDIENCE 83%
VIDEOS VIEWED 31 Billion
VIDEOS PER PERSON 179
VIEWING TIME PER PERSON 13.5 hrs
Source: comScore Video Metrix, February 2011
88 millionAmericanswill watchan online
video today!

8/3/2019 ComScore Monetizing the Internet April2011
http://slidepdf.com/reader/full/comscore-monetizing-the-internet-april2011 42/48
42 © comScore, Inc. Proprietary and Confidential.
Rapid Growth in Long-form TV Programming Online Over Past Year
Yearly growth in videos viewed on long-form TV programming sites
Source: comScore Video Metrix, February 2011 vs. February 2010
105%
Videos per Viewer
71%increase increase
Videos Viewed
Driven by Rapid Growth Time Spent Viewing Online Video is Now

8/3/2019 ComScore Monetizing the Internet April2011
http://slidepdf.com/reader/full/comscore-monetizing-the-internet-april2011 43/48
43 © comScore, Inc. Proprietary and Confidential.
Driven by Rapid Growth, Time Spent Viewing Online Video is NowEquivalent to 8% of TV Viewing
Source: Nielsen for TV. comScore for Online Video
TV Viewing Online Video
36
3
Hours Watched Per Viewer
Per Week
+4% vs. YA
+15% vs. YA
Online Advertising Growing at 15% Y/Y and Almost Equal to Cable TV. VideoAdvertising Growing at 30% and now Accounts For 5% of All Online Ad

8/3/2019 ComScore Monetizing the Internet April2011
http://slidepdf.com/reader/full/comscore-monetizing-the-internet-april2011 44/48
44 © comScore, Inc. Proprietary and Confidential.
Advertising Growing at 30% and now Accounts For 5% of All Online AdSpending … But, Equivalent to Only 1.5% of All TV Ad Dollars
Source: TV data from CAB Analysis of Nielsen, KantarOnline data from IAB / PWC, eMarketer, Jack Myers
Total TV Cable TV Total Online Online Video
$90
$27.5 $26.0
$1.4
Total Ad Spend ($Billions) in 2010 & % Change vs. YA
25% to UGC75% to Traditional Media
+10%
+10%+15%
+30%
Brands Trying to Reach their Target with TV Alone Hit A

8/3/2019 ComScore Monetizing the Internet April2011
http://slidepdf.com/reader/full/comscore-monetizing-the-internet-april2011 45/48
45 © comScore, Inc. Proprietary and Confidential.
Brands Trying to Reach their Target with TV Alone Hit APlateau of Diminishing Returns
85.1 87.9
67.874.1
0
10
20
30
40
50
60
70
80
90
100
0 2,500 5,000 7,500 10,000 12,500 15,000Cost ($000)
Total Reach
Effective Reach
Total Reach and Effective Reach for a TVCampaign as a Function of Cost
Typically 30%+ of Target Audience is not Effectively reached
Adding Branding Advertising With Online Video Builds

8/3/2019 ComScore Monetizing the Internet April2011
http://slidepdf.com/reader/full/comscore-monetizing-the-internet-april2011 46/48
46 © comScore, Inc. Proprietary and Confidential.
Adding Branding Advertising With Online Video BuildsReach with Identical Investment
Media Plan GRPs Cost Total ReachEffective
Reach
TV Only 1,000 $10,000 85.1% 67.8%
TV + Internet Combination
TV (90%) 900 $9,000 83.7% 65.8%
Online (10%) 500 $1,000 63.8% 44.0%
TV + Online 1,400 $10,000 90.2% 83.7%TV Only vs.90% TV + 10% Online
400 0 5.1% 15.9%
Impact of a 90/10 Budget Allocation

8/3/2019 ComScore Monetizing the Internet April2011
http://slidepdf.com/reader/full/comscore-monetizing-the-internet-april2011 47/48
47 © comScore, Inc. Proprietary and Confidential.
What We‟ve Learned
E-commerce is growing strongly and gaining share of consumers‟
wallets
– Has pricing power moved to the consumer?
Online advertising is effective, both as a direct response and
branding strategy – The click is at best an incomplete and at worst a misleading metric
– Accurate delivery of media plan is critical
– Digital ad campaigns lift in-store sales
– Creative remains extremely important – For CPG: “Is Display Advertising the New Print?”
– Video holds the key to more powerful online branding campaigns
47

8/3/2019 ComScore Monetizing the Internet April2011
http://slidepdf.com/reader/full/comscore-monetizing-the-internet-april2011 48/48
Thank You!