


Languages
Pages
Legal


Computer Science 246Advanced Computer
ArchitectureSpring 2008
Harvard University
Instructor: Prof. David [email protected]

2
Why worry about power dissipation?
Environment
Thermal issues: affect cooling, packaging, reliability, timing
Batterylife
3
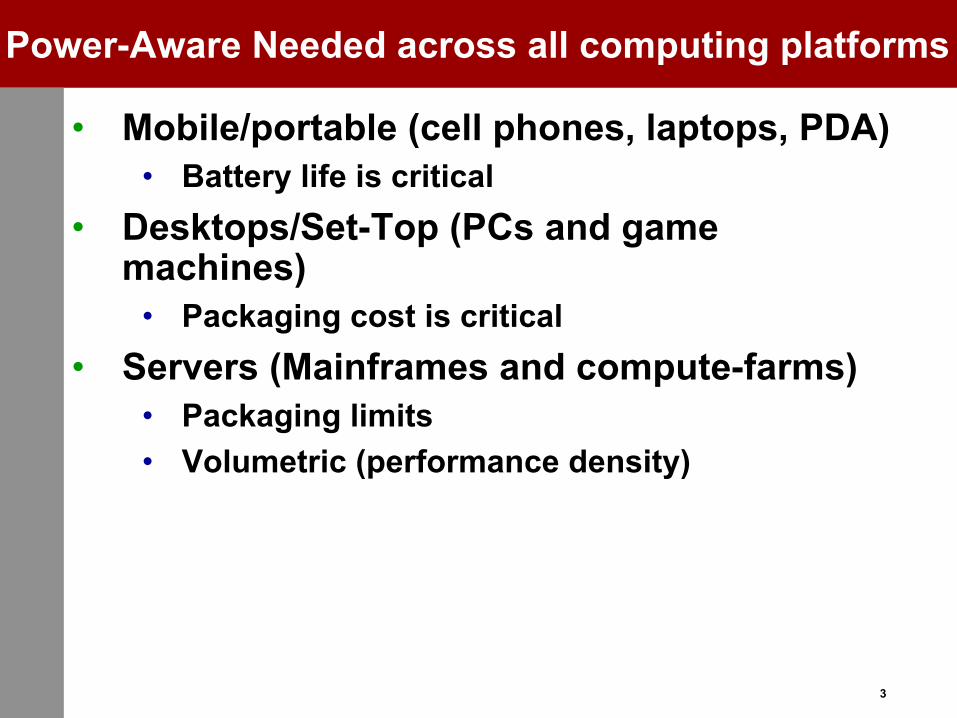
Power-Aware Needed across all computing platforms
• Mobile/portable (cell phones, laptops, PDA)• Battery life is critical
• Desktops/Set-Top (PCs and game machines)
• Packaging cost is critical• Servers (Mainframes and compute-farms)
• Packaging limits• Volumetric (performance density)

4
Modeling + Design• First Component (Modeling/Measurement):
• Come up with a way to:–Diagnose where power is going in your
system–Quantify potential savings
• Second Component (Design)• Try out lots of ideas
• This class will focus on both of these at many levels of the computing hierarchy

5
How CMOS Transistors Work

6
MOS Transistors are Switches

7
Static CMOS
8
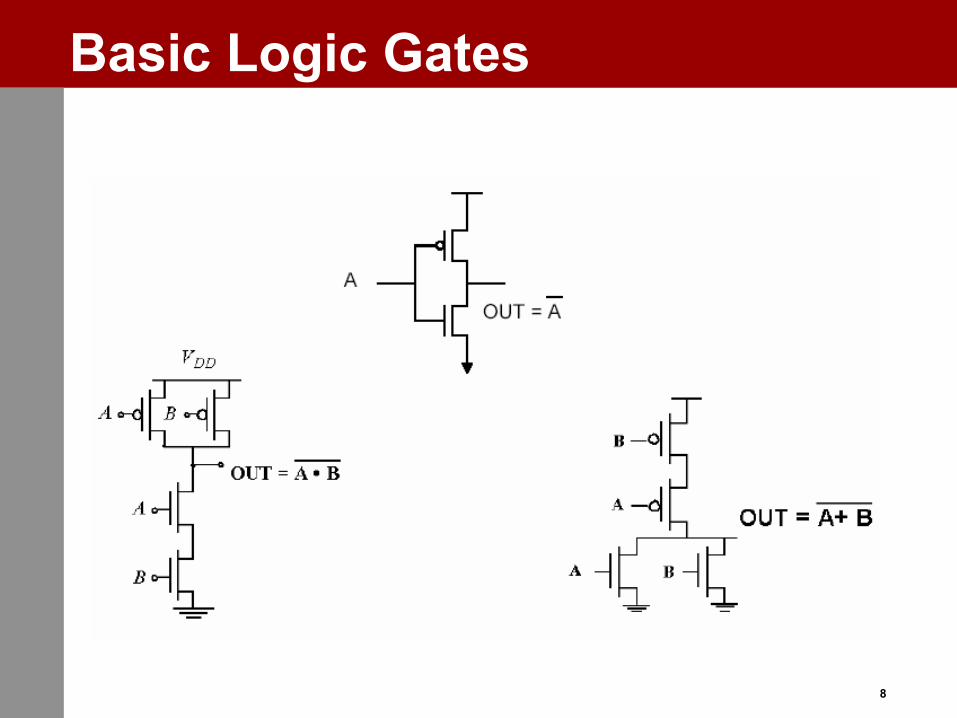
Basic Logic Gates

9
CMOS Water Analogy
Electron: water moleculeCharge: weight of waterVoltage: heightCurrent: flow rateCapacitance: container cross-section
(Think of power-plants that store energy by pumping water into towers)

10
Liquid Inverter• Capacitance at input
• Gates of NMOS, PMOS• Metal interconnect
• Capacitance at output• Fanout (# connections) to
other gates• “Diffusion” capacitance of tx• Metal Interconnect
NMOS conducts when water level is above switching threshold
PMOS conducts belowNo conduction after container
full

11
Inverter Signal Propagation (1)

12
Inverter Signal Propagation (2)

13
Delay and Energy Definitions• Propagation Delay
• Time to fill output container to 50%• Time to charge output capacitor to 50%
• Switching Energy• Weight * height of water moved• Charge * voltage of charge transferred

14
Delay and Power Observations• Load capacitance increases delay
• High fanout (gates attached to output)• Interconnection
• Higher current can increase speed• Increasing transistor width raises currents but
also raises capacitance• Energy per switching event independent of
current• Depends on amount of charge moved, not rate

15
Feedback-based Latch
• Pros:• Holds data as long as power applied• Actively drives output: (can be fast)
• Con: Fairly big (5 transistors)• Can be used for latches or SRAM cells

16
Charge-based Latch
• Pros:• Small: 1 transistor, 1 capacitor (may be gate of tx)
• Con:• Charge “leaks” off capacitor (~1ms)• Reads can be destructive (must read follow by write)
• Can be used for latches or DRAM cells

17
Power: The Basics• Dynamic power vs. Static power
• Dynamic: “switching” power• Static: “leakage” power• Dynamic power dominates, but static power increasing in
importance• Trends in each
• Static power: steady, per-cycle energy cost• Dynamic power: capacitive and short-circuit• Capacitive power: charging/discharging at
transitions from 0 1 and 1 0• Short-circuit power: power due to brief short-circuit
current during transitions.• Most research focuses on capacitive, but recent
work on others

18
Dynamic (Capacitive) Power Dissipation
• Data dependent – a function of switchingactivity
VOUT
CL
I
VIN

19
Capacitive Power dissipation
Power ~ ½ CV2Af
Capacitance:Function of wire length, transistor size
Supply Voltage:Has been dropping with successive fabgenerations
Clock frequency:Increasing…Activity factor:
How often, on average, do wires switch?

20
Lowering Dynamic Power• Reducing Vdd has a quadratic effect
• Has a negative (~linear) effect on performance however
• Lowering CL• May improve performance as well• Keep transistors small (keeps intrinsic
capacitance (gate and diffusion) small)• Reduce switching activity
• A function of signal transition stats and clock rate
• Clock Gating idle units• Impacted by logic and architecture decisions

21
Short-Circuit Power Dissipation
• Short-Circuit Current caused by finite-slope input signals
• Direct Current Path between VDD and GND when both NMOS and PMOS transistors are conducting
VOUT
CL
ISC
VIN

22
Short-Circuit Power Dissipation
• Power determined by• Duration and slope of input signal, tsc
• Ipeak determined by transistor sizes, process technology, CL
• Short circuit power can be minimized• Try to match rise/fall times of input and output
signals• Have not seen many architectural solutions here• Good news: relatively, PowerSC is shrinking
PowerSC ~ tscVIpeak

23
Leakage Currents
• Subthreshold currents grow exponentially with increases in temperature, decreases in threshold voltage
• But threshold voltage scaling is key to circuit performance!• Gate leakage primarily dependent on gate oxide thickness,
biases• Both type of leakage heavily dependent on stacking and input
pattern• More on leakage later in the semester
Igate
VOUT
CLISub
VIN TkaVq
DSub a
T
ekI ⋅⋅⋅−
⋅=

24
Gate vs. Subthreshold Leakage Trends
From Mukhopadhyay, et al. TVLSI ‘03

25
Lowering Static Power• Design-time Decisions
• Use fewer, smaller transistors -- stack when possible to minimize contacts with Vdd/Gnd
• Multithreshold process technology (multiple oxides too!)
– Use “high-Vt” slow transistors whenever possible
• Dynamic Techniques• Reverse-Body Bias (dynamically adjust threshold)
– Low-leakage sleep mode (maintain state), e.g. XScale
• Vdd-gating (Cut voltage/gnd connection to circuits)– Near zero-leakage sleep mode– Lose state, overheads to enable/disable
26
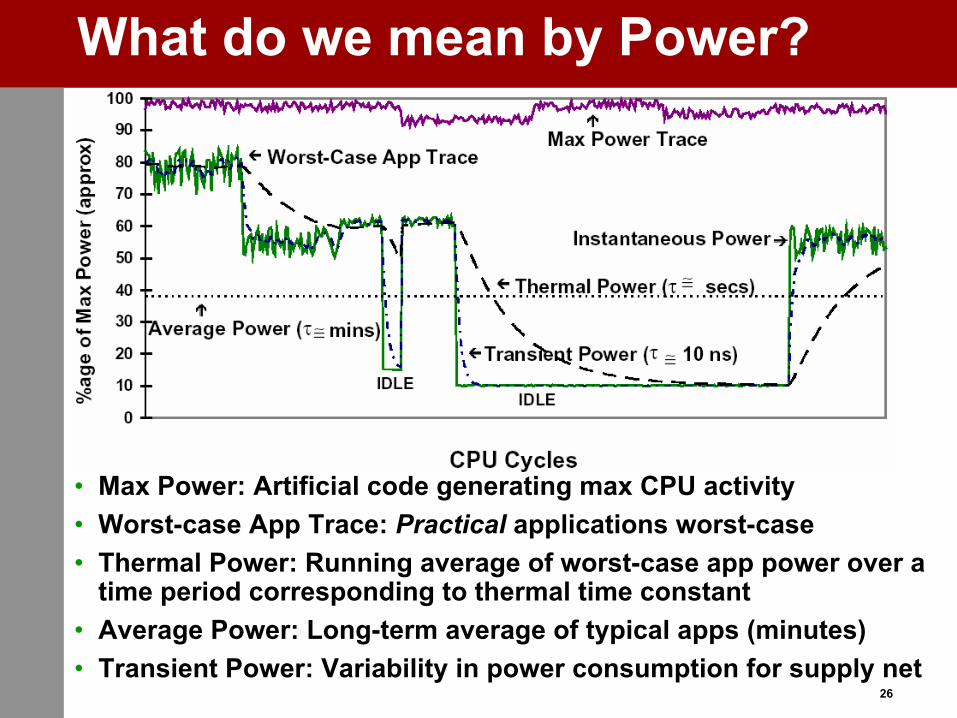
What do we mean by Power?
• Max Power: Artificial code generating max CPU activity• Worst-case App Trace: Practical applications worst-case• Thermal Power: Running average of worst-case app power over a
time period corresponding to thermal time constant• Average Power: Long-term average of typical apps (minutes)• Transient Power: Variability in power consumption for supply net

27
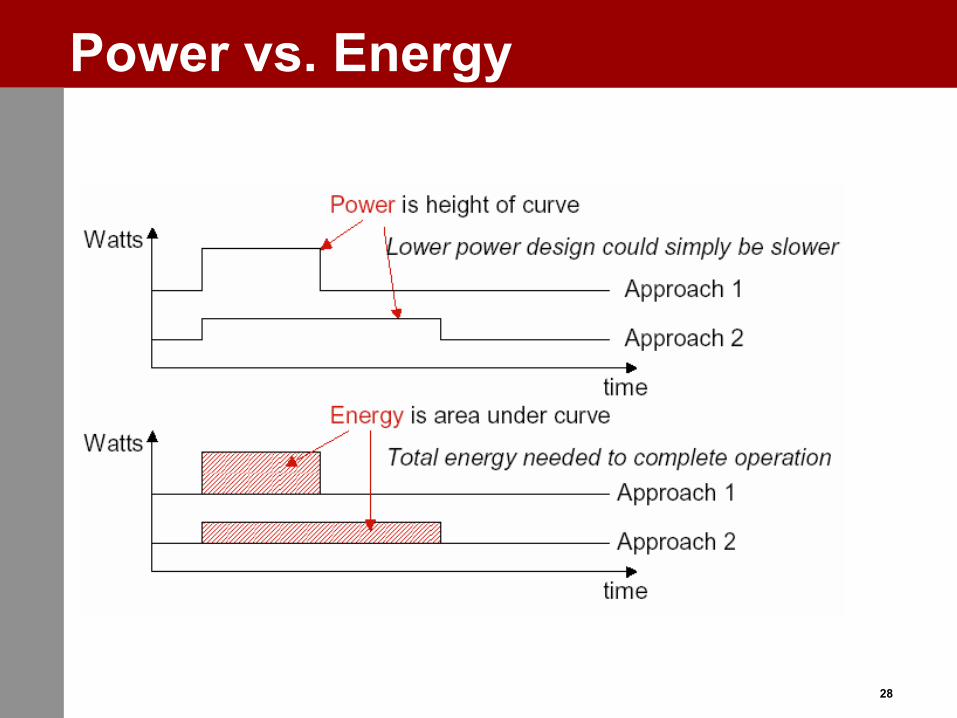
Power vs. Energy• Power consumption in Watts
• Determines battery life in hours• Sets packaging limits
• Energy efficiency in joules• Rate at which energy is consumed over time• Energy = power * delay (joules = watts *
seconds)• Lower energy number means less power to
perform a computation at same frequency
28
Power vs. Energy

29
Power vs. Energy• Power-delay Product (PDP) = Pavg * t
• PDP is the average energy consumed per switching event
• Energy-delay Product (EDP) = PDP * t• Takes into account that one can trade
increased delay for lower energy/operation• Energy-delay2 Product (EDDP) = EDP * t
• Why do we need so many formulas?!!?• We want a voltage-invariant efficiency
metric! Why?• Power ~ ½ CV2Af, Performance ~ f (and V)

30
E vs. EDP vs. ED2P• Power ~ CV2f ~ V3 (fixed microarch/design)• Performance ~ f ~ V (fixed
microarch/design)• (For the nominal voltage range, f varies
approx. linearly with V)
• Comparing processors that can only use freq/voltage scaling as the primary method of power control:
• (perf)3 / power, or MIPS3 / W or SPEC3 /W is a fair metric to compare energy efficiencies.
• This is an ED2 P metric. We could also use: (CPI)3 * W for a given application

31
E vs. EDP vs. ED2P• Currently have a processor design:
• 80W, 1 BIPS, 1.5V, 1GHz• Want to reduce power, willing to lose some
performance• Cache Optimization:
– IPC decreases by 10%, reduces power by 20% => Final Processor: 900 MIPS, 64W
–Relative E = MIPS/W (higher is better) = 14/12.5 = 1.125x
• Energy is better, but is this a “better”processor?
32
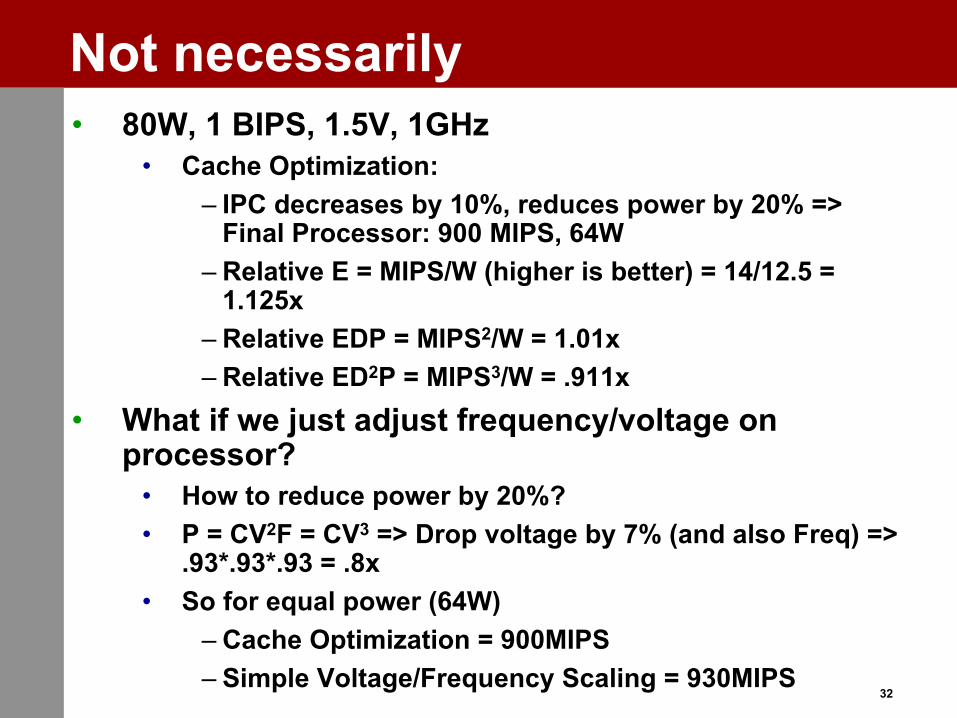
Not necessarily• 80W, 1 BIPS, 1.5V, 1GHz
• Cache Optimization:– IPC decreases by 10%, reduces power by 20% =>
Final Processor: 900 MIPS, 64W– Relative E = MIPS/W (higher is better) = 14/12.5 =
1.125x– Relative EDP = MIPS2/W = 1.01x– Relative ED2P = MIPS3/W = .911x
• What if we just adjust frequency/voltage on processor?
• How to reduce power by 20%?• P = CV2F = CV3 => Drop voltage by 7% (and also Freq) =>
.93*.93*.93 = .8x• So for equal power (64W)
– Cache Optimization = 900MIPS– Simple Voltage/Frequency Scaling = 930MIPS

33
Analysis Abstraction Levels
Abstraction Analysis Analysis Analysis Analysis EnergyLevel Capacity Accuracy Speed Resources Savings
Most Worst Fastest Least MostApplicationBehavioralArchitectural (RTL)Logic (Gate)Transistor (Circuit)
Least Best Slowest Most Least
34
Power/Performance abstractions• Low-level:
• Hspice• PowerMill
• Medium-Level: • RTL Models
• Architecture-level:• PennState SimplePower• Intel Tempest• Princeton Wattch• IBM PowerTimer• Umich/Colorado PowerAnalyzer

35
Low-level models: Hspice• Extracted netlists from circuit/layout
descriptions• Diffusion, gate, and wiring capacitance is
modeled• Analog simulation performed
• Detailed device models used• Large systems of equations are solved• Can estimate dynamic and leakage power
dissipation within a few percent• Slow, only practical for 10-100K transistors
• PowerMill (Synopsys) is similar but about 10x faster

36
Medium-level models: RTL• Logic simulation obtains switching events
for every signal• Structural VHDL or verilog with zero or unit-
delay timing models• Capacitance estimates performed
• Device Capacitance–Gate sizing estimates performed, similar to
synthesis• Wiring Capacitance
–Wire load estimates performed, similar to placement and routing
• Switching event and capacitance estimates provide dynamic power estimates

37
Architecture level models• Two major classes:
• Cycle/Event-Based: Arch. Level power models interfaced with cycle-driven performance simulation
• Instruction-Based: Measurement/Characterization based on instruction usage and interactions
• Components of Arch. Level power model• Could be based on ckt schematic
measurements/extrapolationOr…• Capacitance modelsBoth may need to consider…• Circuit design styles• Clock gating styles & Unit usage statistics• Signal transition statistics

38
Paper Readings• Background Material (available on website)
• Power-Aware Microarchitecture: Design and Modeling Challenges for Next-Generation Microprocessors,” IEEE MICRO.
• “Power: A First-Class Architectural Design Constraint,” IEEE Computer.
Top Related