


Languages
Pages
Legal


Components of the climate system, interactions, and changes
(Source: IPCC AR4 WG1 Ch.1, FAQ 1.2, Figure 1)

Veronika Eyring, ESA CCI project integration meeting, March 2011
Atmospheric reanalysis: ERA-Interim
ECMWF forecasts: 1980 – 2010
Changes in skill are due to:
• improvements in modellingand data assimilation
• evolution of the observing system• atmospheric predictability
ERA-Interim: 1979 – 2010• uses a 2006 forecast system• ERA-40 used a 2001 system
• re-forecasts more uniform quality• improvements in modelling and data assimilation outweigh improvements in the observing system
CCI project integration meeting Reanalysis

PCMDI
Modelers, PCMDI, JPL/NASA, CommunityWho does what?
Produce Simulations &
Projections(HUGE job;
focus on model development – not analysis or observations)
Model output archived in a
uniform fashion to facilitate access and
analysis. (Far from trivial – see
below)
0 2 4 6 8 10 12 14 16 18 20 22 24 26
pre-industrial control
present-day control
climate of the 20th Century (20C3M)
committed climate change
SRES A2
720 ppm stabilization (SRES A1B)
550 ppm stabilization (SRES B1)
1%/year CO2 increase (to doubling)
1%/year CO2 increase (to quadrupling)
slab ocean control
2xCO2 equilibrium
AMIP
Number of Models
Sophisticated development
and application of model
diagnostics for evaluation
(Observations needed here,
but which ones?)
Identify and deliver/archive observations in form useful for model analysis
(Requires model, obs and
IT expertise)
Develop global observations relevant to
climate change research (Focus
on hardware, retrievals, delivery)
PCMDINASA
& JPLModelin
g
Centers
Weak
Link
Enormous Model Output/Complexity To quantify and reduce uncertainty, this chain has to work.
Wal
ise
r e
t al.
200
9,
Clim
atic
Ch
ang
e,
Su
bm
itte
d.

PCMDINASA Recommended Datasets for CMIP5
Match up of available NASA
datasets to PCMDI
priority list
4
Model Dataset Time Period
Comments
Atm Temperature (200,850hPa)
AIRS (≥ 300 hPa) MLS ( < 300 hPa)
9/02 – 8/04 -
AIRS +MLS needed to cover all pressure levels
Zonal and meridional wind (200,850 hPa)
No obvious match Reanalysis is the best product
Specific humidity (200, 850 hPa)
AIRS (≥ 300 hPa) MLS ( < 300 hPa)
9/02 – 8/04 -
AIRS +MLS needed to cover all pressure levels
Sea level pressure No obvious match Reanalysis is probably the best product match
Surface (10m) zonal and meridional wind
QuikSCAT CCMP
1999 – 2009 7/87 – 12/09
Oceans only. No land products. CCMP is a multi-sensor variational analysis product
Ocean surface zonal and meridional wind stress
QuikSCAT CCMP
1999 – 2009 7/87 – 12/09
Oceans only. No land products. CCMP is a multi-sensor variational analysis product
Sea surface temperature AMSR-E 6/02 - SST science team recommends multiple products
TOA reflected shortwave radiation and OLR
CERES 3/00 -
TOA longwave and shortwave TOA clear-sky fluxes
CERES 3/00 -
Total precipitation TRMM GPCP
1997 - 2/79 – 4/08
GPCP is an analysis product
Cloud cover MODIS 2/00 -
Precipitable water SSM/I 7/87 -
Sea surface height TOPEX/JASON series
10/92 - Project scientist recommends converting the AVISO product
Sea ice NSIDC microwave product would be best. More investigation is needed.

Evaluation Datasets
Aerosols Carbon Cycle Chemistry Clouds Precipitation Radiation Surface Fluxes
EMEP 11 GLODAP 8 MIPAS 12 ISCCP-D 9 GPCP 4 ERBE 13 NCEP-NCAR 6
IMPROVE 11 NOAA ESRL GMD 4 UARS 8 MODIS 7 CMAP 3 CERES 11 Southampton climatology 5
EANET 9 TRANSCOM 4 HALOE 4 CALIPSO 6 NCEP-NCAR 1 ISCCP-FD 4 SMD94 4
AERONET 9 4 TOMS 3 MISR 3 GPCC 1 PARASOL 3 ISCCP-FD 4
GAW 4 EUROFLUX 3 MOZAIC 3 PARASOL 3 CRU 1 GEBA 2 ERBE 2
SKYNET 4 AMERIFLUX 3 SCIAMACHY 3 TOGA-COARE 3 HOAPS 1 BSRN 2 GEBA 2
AEROCE 3 NCEP/DOE AMIP-II 2 ODIN 3 AMMA 3 TRMM 1 MODIS 2 CMAP 2
MISR 3 ISLSCP 2 ILAS 3 SIRTA 3 NCEP/DOE AMIP-II 1 1 ERA-40 2
MODIS 3 2 MOPITT 2 BOMEX 3 ERA-Interim 1 NCEP-NCAR 1 HOAPS 2
3 CARBOOCEAN 2 SHADOZ 2 ARM 3 AMMA 1 1 OAFLUX 2
CASTNET 2 2 Logan 2 2 ISCCP-D 1 BSRN 2
U of Miami 1 2 TES 2 ERBE 1 SIRTA 1 GPCP 1
POLDER 1 MODIS 2 TRMM 2 NOAA Interpolated OLR 1 TOGA-COARE 1 MODIS 1
CALIPSO 1 1 ERA-40 2 AIRS 1 ARM 1
SEAREX 1 1 UKMO analysis 2 TES 1
VGPM 1 NIWA 1 SCIAMACHY 1
EMDI 1 WOUDC 1
1 NOAA ESRL GMD 1
IGBP 1 EMEP 1
GEOLAND 1 CASTNET 1
1 IMPROVE 1
1 NDEP 1
1 EANET 1
AVHRR/NOAA 1 AIRS 1
GPCP 1
Fluxnet
SMD94 (da Silva)
Takahashi DB
Amsterdam Island & Cape Grim
NOAA Interpolated OLR
Zinke et al. CloudSat
Olson et al.
SeaWifs
ClimPP
Norby et al.
Sabine et al.,2004
Carr et al. 2006
Kettle et al. 1999
Veronika Eyring, ESA CCI project integration meeting, March 2011
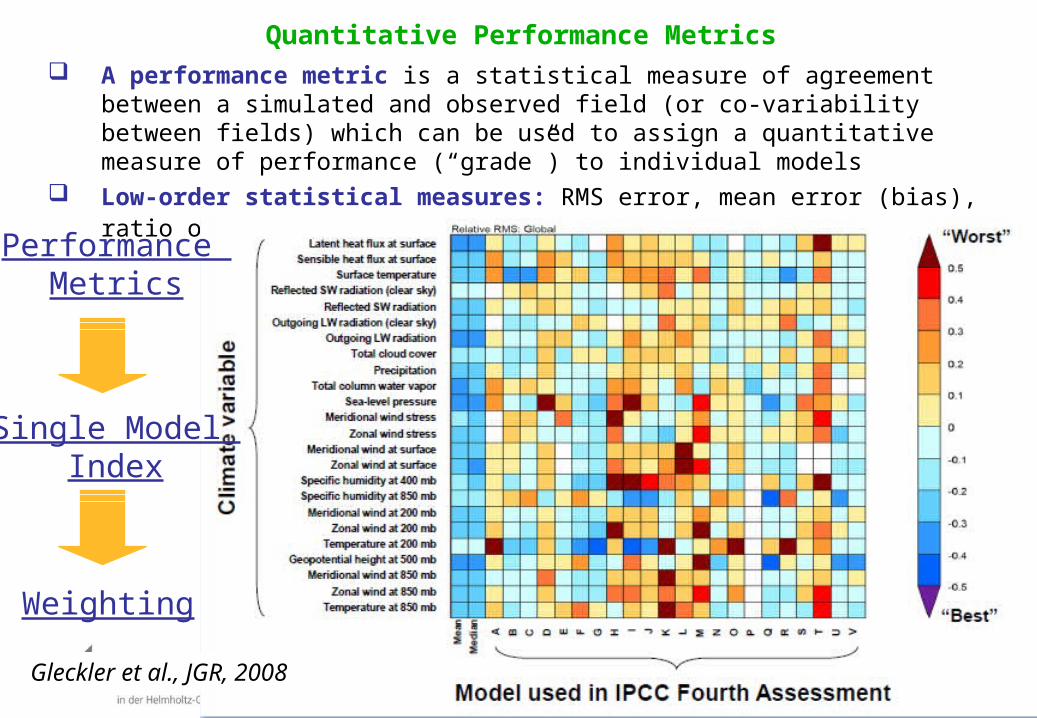
A performance metric is a statistical measure of agreement between a simulated and observed field (or co-variability between fields) which can be used to assign a quantitative measure of performance (“grade”) to individual models
Low-order statistical measures: RMS error, mean error (bias), ratio of , correlation for each variable
Quantitative Performance Metrics
Gleckler et al., JGR, 2008
Performance Metrics
Single Model Index
Weighting

Meeting Aims
• Check ECV project URDs are consistent with the needs of Climate Research Groups and GCOS requirements, including source traceability
• Allow ECV teams to explain how their projects address the integrated perspective for consistency between the ECVs to avoid gaps
• Start review of product specifications but define what is in it.
• Discuss how to deal with uncertainties in products
• Finalise the ECV projects data needs for ECMWF reanalysis data
• Start a discussion on ECV data set validation
• Maintain oversight of the position within the international framework in which CMUG/CCI is operating

Actions
• All ECVs who want ERA-Interim data to reply to David• Ensure consistent use of level 1B data CCI+CMUG• Interpolation should be co-ordinated within and
between projects (CDO tool) CCI• Discussion on trial datasets and code to write
datasets in correct format. Data Standards WG• Continue interaction with JPL NASA CMIP5 project,
NASA Measures?, EUMETSAT and GCOS All• More presentations on use of satellite data in climate
models in next coloc meetings. CMUG• Identify potential comparisons CCI+CMUG• Need for ‘Golden Year’? (e.g. aerosol vs FIRE) CMUG
to complete table

Uncertainty from Coloc 1
• precision: a measurement which has a small random uncertainty is said to have high precision
• accuracy: a measurement which has a small systematic uncertainty is said to have high accuracy

Related Activities
1. GCOS, GSICS (Jan/Feb 2011)2. EUMETSAT CAF/CMSAF and SCOPE-CM3. NOAA-NASA initiatives (e.g. JPL CMIP5)4. WCRP Observation and Assimilation Panel (Apr 11)5. Reanalyses (ERACLIM, JRA-55, EURO4M) 6. Coupled Model Intercomparison Project and
follow-on activities (Exeter, June 11)7. Inputs to IPCC AR-5/6 (interaction with authors)8. EU IS-ENES, METAFOR, …9. EU GMES (MACC, MyOcean, Climate, ….)

Outputs from meeting
• Meeting report of actions agreed by ECV projectsAction: CMUG
• Scientific report describing strategic position of the CCI, in the international arena Action: CMUG+CCI
• Updates to URDs, DARDs based on discussions here and CMUG review (D2.1) and release of PSDsAction: CCI
• Review terminology for error characteristics CMUG+CCI
• Slides from this meeting on CMUG web site Action: CMUG
Top Related