


Languages
Pages
Legal

arX
iv:h
ep-e
x/04
0902
8 v3
8
Nov
200
5
Comparisons and Combinations of Reactor and Long-Baseline
Neutrino Oscillation Measurements
K. B. M. Mahn∗ and M. H. Shaevitz†
Department of Physics, Columbia University, New York, NY 10027
(Dated: November 8, 2005)
Abstract
We investigate how the data from various future neutrino oscillation experiments will constrain
the physics parameters for a three active neutrino mixing model. The investigations properly ac-
count for the degeneracies and ambiguities associated with the phenomenology as well as estimates
of experimental measurement errors. Combinations of various reactor measurements with the ex-
pected J-PARC (T2K) and NuMI offaxis (Nova) data, both with and without the increased flux
associated with proton driver upgrades, are considered. The studies show how combinations of
reactor and offaxis data can resolve degeneracies (e.g. the θ23 degeneracy) and give more precise
information on the oscillation parameters. A primary purpose of this investigation is to establish
the parameter space regions where CP violation can be discovered and where the mass hierarchy
can be determined. We find that, even with augmented flux from proton drivers, such measure-
ments demand that sin2 2θ13 to be fairly large and in the range where it is measurable by reactor
experiments.
PACS numbers: 14.60.Pq, 14.60.St, 12.15.Ff
∗Electronic address: [email protected]†Electronic address: [email protected]
1
The worldwide program to understand neutrino oscillations and determine the mixing
parameters, CP violating effects, and mass hierarchy will require a broad combination of
measurements. Progress in the past associated with solving the solar and atmospheric neu-
trino puzzles took a full suite of experiments to isolate and understand the phenomenology.
Each additional measurement helped define the direction of future studies. One would expect
a similar chain for the current goals where the program grows as information is obtained.
This study attempts to see how various present proposals for next generation experiments
(including two detector reactor and accelerator based long-baseline experiments) compare
to and complement each other. A particular emphasis is on combining experiments to give
improved physics parameter determination. As in the past, the best constraints on the
phenomenology come from combining data from different processes and setups.
I. PROCEDURE FOR THIS STUDY
For a three active neutrino scenario, neutrino oscillations are described by six physics
parameters: θ13, θ12, θ23, ∆m2
12, ∆m2
23, and the CP violation phase, δ. In addition, a full
description requires knowing the hierarchy of mass state 3 relative to 1 and 2, i.e. the sign
of ∆m2
23. (See Ref.[1, 2] for a description of three neutrino oscillation phenomenology and
current results of global fits.)
The oscillation probability up to second order for reactor and long-baseline measurements
is given by [1]
Preactor ≃ sin2 2θ13 sin2 ∆31 + α2 ∆2
31cos4 θ13 sin2 2θ12, (1)
Plong−baseline ≃ sin2 2θ13 sin2 θ23 sin2 ∆
∓ α sin 2θ13 sin δCP cos θ13 sin 2θ12 sin 2θ23 sin3 ∆
+ α sin 2θ13 cos δCP cos θ13 sin 2θ12 sin 2θ23 cos ∆ sin2 ∆
+ α2 cos2 θ23 sin2 2θ12 sin2 ∆ (2)
with α ≡ ∆m2
21/∆m2
23and ∆ ≡ ∆m2
31L/(4Eν).
In the investigations shown here, the full formulae for the oscillation probability have
been used as incorporated in a computer program developed by S. Parke [3]. The higher
2

order corrections for the reactor probability are quite small for the distances on the scale of
the reactor experiments considered here, and so, approximately, a measurement of Preactor
directly constrains the mixing parameter θ13. On the other hand, the full expression for the
long-baseline probability introduces many degeneracies and correlations between the physics
parameters θ23 and δCP , plus the mass hierarchy through matter effects even before experi-
mental uncertainties are taken into account [1, 4]. Therefore, a measurement of Plong−baseline
corresponds to sizable regions in the physics parameter space.
Of the six parameters, we assumed for this study that θ12, θ23, ∆m2
12, and ∆m2
23are known
to the precision expected from either the current program (Super-K, Minos and CNGS) or
the future program (Nova and T2K), as shown in Table I. This leaves for determination
θ13, δ, and the mass hierarchy, which are the subject of this study.
The technique we will use for this study is as follows. We generate data according
to the experimental expectations with the underlying physics assumptions and assumed
parameters. We then explore the parameter space for one of the measurement parameters
in terms of ∆χ2 values. For a given set of parameters, a χ2 value is found by comparing the
prediction with these parameters to the orginally generated data. The difference between
this χ2 value and the one calculated with the original parameters is the ∆χ2 value. In
each case, we will explore the change due to the variation of only one parameter. However,
estimating a correct sensitivity depends on the choices of all six of the parameters described
above. We handle these inherent ambiguities by choosing the most conservative (lowest)
∆χ2 value for the parameter being tested by marginalizing over all the other parameters.
For example, if we are studying θ13, for each value of θ13 studied, the other parameters
δCP , ∆m2
23(including sign) and θ23 are allowed to vary within the allowed ranges. This
sometimes results in discontinuities, where one hierarchy becomes worse than the other in
a certain region. The best choices are determined by minimizing the ∆χ2 value using the
Minuit[5] program.
The other experimental inputs for the study are given in Table II and are derived from
estimates of the measurement sensitivities. For these sensitivities, we have taken the values
from the given experiment’s estimates without further study. Three types of two detector
reactor experiments are considered corresponding to a small (Double-CHOOZ, [6]), medium
(Braidwood [7], Daya Bay [8]), or large (MiniBooNE size) detector reactor νe measurements.
The sensitivities for the reactor experiments are scaled from the sin2 2θ13 90% C.L. limits
3

Parameter Value Current Uncertainty (1σ) Future Uncertainty (1 σ)
sin2 2θ23 1.0 0.1 (Super-K) 0.01 (T2K)
∆m2
23(eV2) 2.5 × 10⁻³ 0.55 × 10⁻³ (Super-K) 0.1 × 10⁻³ (T2K)
θ12(deg) 32.31 2.55 (global solar fit) –
∆m2
12(eV2) 7.9 × 10⁻⁵ 0.55 × 10⁻⁵ (global solar fit) –
TABLE I: Current and future uncertainty estimates on oscillation parameters from Super-
Kamiokande [9], T2K [10], and a global solar fit by Kamland [11]. The studies here use the
above values except the central value of sin2 2θ23 is assumed to be 0.95 (see text).
at ∆m2
23= 2.5 × 10⁻³ eV2 for a null oscillation scenario. In terms of integrated luminosity
defined as detector mass [tons] × thermal reactor power [GW]× running time [years], the
three options correspond to 300, 3000, and 20,000 ton·GW·yrs for the small, medium, and
large reactor scenarios. The assumed 90% C.L. limits on sin2 2θ13 for the three scenarios
are then given by 0.03, 0.01, and 0.005, for small, medium, and large detector reactor
experiments, respectively.
Two offaxis long-baseline experiments are considered, J-PARC to Super-K[10] (T2K) and
the NuMI offaxis proposal[12] (Nova). For these experiments, the uncertainties are scaled
from the expected number of events given in the Nova Proposal for 10km offaxis [13] and
a talk by Nakaya given at NOON 2003 [14]. The given uncertainties include statistical
errors associated with the background and signal for a 5 year data run but do not include
any systematic uncertainty. In the studies presented here, results are given for various
data running periods with the nominal beam rates corresponding to Table II. In addition,
some results are given for upgraded beams with five times the flux as would be appropriate
for the T2K Phase II experiment or the Nova experiment with a new proton driver. We
consider the different cases of running only with neutrinos, or with neutrino and antineutrino
running with the number of years of neutrino and antineutrino running specified for each
plot. The uncertainty on the θ23 parameter can have a significant effect on the long-baseline
measurements since the quantity that is constrained as given in Table I is sin2 2θ23, and the
parameter that modulates the long-baseline oscillation probability is sin2 θ23. This can lead
to a 60% uncertainty in the oscillation probability for sin2 2θ23 = 0.95.
For the studies presented in this report, the uncertainties due to the variations of θ23,
4
Basis of Osc. Prob. and σ for sin2 2θ13 =
Experiment Estimate 0.02 0.05 0.10
Reactor (Eν = 3.6 MeV) sin2 2θLimit13
Small 1.05 km 0.03@90%CL 0.013 ± 0.012 0.033 ± 0.012 0.064 ± 0.012
Medium 1.8 km 0.01@90%CL 0.022 ± 0.006 0.052 ± 0.006 0.102 ± 0.006
Large 1.8 km 0.005@90%CL 0.022 ± 0.003 0.052 ± 0.003 0.102 ± 0.003
T2K (Eν = 650 MeV) Number of events in 5 yrs:
〈L〉 = 295 km
ν 105.0 signal / 17.8 bkgnd 0.010 ± 0.003 0.023 ± 0.004 0.044 ± 0.006
ν 30.8 signal / 10.2 bkgnd 0.009 ± 0.007 0.020 ± 0.008 0.038 ± 0.010
Nova (Eν = 2.1 GeV) Number of events in 5 yrs:
〈L〉 = 810 km
ν 227.4 signal / 39.0 bkgnd 0.010 ± 0.002 0.024 ± 0.003 0.045 ± 0.004
ν 109.0 signal / 18.5 bkgnd 0.008 ± 0.003 0.017 ± 0.005 0.032 ± 0.006
TABLE II: Estimates of the experimental uncertainties for future oscillation experiments. The
last three columns indicate the oscillation probability and respective error for three different values
of sin2 2θ13. For the long-baseline experiments, the number of events and sensitivity is given for
5 years of neutrino mode and 5 years of antineutrino mode separately. The given uncertainties
include statistical errors associated with the background and signal for a 5 year data run, but
do not include systematic uncertainty. ∆m223
= 2.5 × 10⁻³eV2 for all estimates and additionally,
sin2 2θ13 = 0.1, δCP = 0 for the long baseline experiment’s event rates.
∆m2
23, and the mass hierarchy are included. In the ν data, there is a 5% to 10% contamina-
tion of ν induced events in the sample. For the studies presented here, we use 5% for Nova,
and 10% for T2K, as estimated by the experiment. To summarize, the following list gives
the parameters used for the various fit results and the values and typical uncertainties for
the parameters that are varied:
• ∆m2
23( ≈ ∆m2
13) = 2.5× 10⁻³ eV2 and allowed to vary within its future expected un-
certainty (typical σ = 0.1×10⁻³ eV2). We include the hierarchy ambiguity associated
with ∆m2
23being < 0 or > 0.
5
• sin2 2θ23 = 0.95 and allowed to vary within its future expected uncertainty (typical
σ = 0.01). We include the ambiguity associated with θ23 being < 45◦ or > 45◦.
• ∆m2
12held fixed at 7.9 × 10⁻⁵ eV2.
• θ12 held fixed at 32.31◦.
• δCP allowed to vary between 0◦ to 360◦.
• sin2 2θ13 allowed to vary between 0.0 and 0.3.
II. 90% C.L. ALLOWED RANGE OF θ13
The θ13 mixing angle is as yet undetermined in the current neutrino oscillation phe-
nomenology. It is known to be smaller than the other mixing angles. The size of θ13 is an
important ingredient in constraining models of neutrino masses and mixing, such as attempts
to relate the quark and lepton mixings. The size of this mixing angle also has important
implications for long-baseline νe appearance measurements because it scales the size of the
oscillation probability.
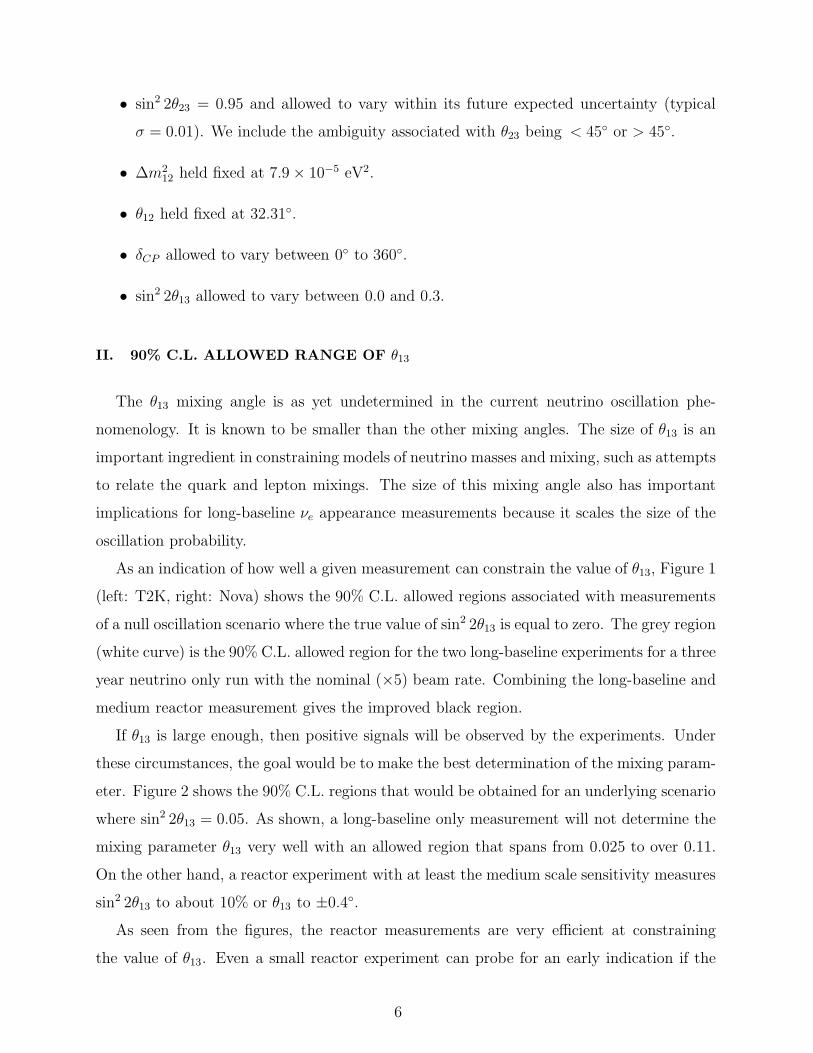
As an indication of how well a given measurement can constrain the value of θ13, Figure 1
(left: T2K, right: Nova) shows the 90% C.L. allowed regions associated with measurements
of a null oscillation scenario where the true value of sin2 2θ13 is equal to zero. The grey region
(white curve) is the 90% C.L. allowed region for the two long-baseline experiments for a three
year neutrino only run with the nominal (×5) beam rate. Combining the long-baseline and
medium reactor measurement gives the improved black region.
If θ13 is large enough, then positive signals will be observed by the experiments. Under
these circumstances, the goal would be to make the best determination of the mixing param-
eter. Figure 2 shows the 90% C.L. regions that would be obtained for an underlying scenario
where sin2 2θ13 = 0.05. As shown, a long-baseline only measurement will not determine the
mixing parameter θ13 very well with an allowed region that spans from 0.025 to over 0.11.
On the other hand, a reactor experiment with at least the medium scale sensitivity measures
sin2 2θ13 to about 10% or θ13 to ±0.4◦.
As seen from the figures, the reactor measurements are very efficient at constraining
the value of θ13. Even a small reactor experiment can probe for an early indication if the
6
FIG. 1: 90% C.L. upper limit regions for various oscillation measurements for an underlying null
oscillation scenario where sin2 2θ13 = 0 (sin2 2θ23 = 0.95 ± 0.01, ∆m2 = 2.5 ± 0.1 × 10⁻³ eV2 and
δCP = 0◦). The left (right) plot is for the T2K (Nova) long-baseline experiment. The grey region
is the 90% C.L. allowed region for the long-baseline experiments for a three year neutrino only
run with nominal beam rate. The white region is the 90% C.L. allowed region for a three year,
neutrino only run at 5× the nominal beam rate. The black region gives the combination of three
year long-baseline runs with a medium reactor measurement. The vertical dashed line indicates
the 90% CL upper limit for a medium reactor experiment alone.
value is sizable. The large reactor experiment has sensitivity comparable to planned long-
baseline experiments and the medium scale experiment can measure values in the range
for sin2 2θ13 > 0.02 at the 10% to 30% level. As will be seen in later plots, studies of CP
violation and matter effects over the next decade are only possible if sin2 2θ13 is significantly
larger than about 0.01. A small or medium scale reactor experiment can establish if these
studies will be possible and, if they are, add additional information for the determining the
mixing parameters.
7

FIG. 2: 90% C.L. regions for underlying oscillation parameters of sin2 2θ13 = 0.05, sin2 2θ23 =
0.95±0.01, ∆m2 = 2.5±0.1×10⁻³ eV2 and δCP = 0◦. The grey regions are for the T2K (left plot)
or Nova (right plot) experiments for three years of neutrino running. The black regions are the
90% C.L. allowed regions for a combined medium reactor plus long-baseline analysis. The dashed
lines indicate how the combined measurement would degrade with the small reactor sensitivity.
III. RESOLUTION OF THE θ23 DEGENERACY
The mixing angle θ23 is an important parameter in developing an understanding of the
mixing matrix and for proceeding with a determination of θ13. In many theoretical models,
θ23 is not expected to be 45◦ and the difference from this value, both in sign and magnitude,
may lead to a deeper understanding of the mixing.
Information on the value of θ23 has been obtained from νµ disappearance measurements
in the atmospheric ∆m2 region, such as the Super-K and K2K experiments. These experi-
ments restrict the allowed region of sin2 2θ23. Unfortunately, a single value of sin2 2θ23 = a
corresponds to two possible solutions for θ23,1
2sin−1 (
√a) or π
2− 1
2sin−1 (
√a). The current
Super-K measurement of sin2 2θ23 = 1.00 ± 0.1 corresponds to values of θ23 = 45◦ ± 9◦.
For the determination of θ13 using a long-baseline νµ → νe appearance measurement, this
8
ambiguity presents a problem since the oscillation probability is proportional to sin2 θ23, as
shown in Equation 1. The present Super-K measurement would correspond to a change in
the T2K or Nova oscillation probability of about 57%, for a change in θ23 from 36◦ to 54◦.
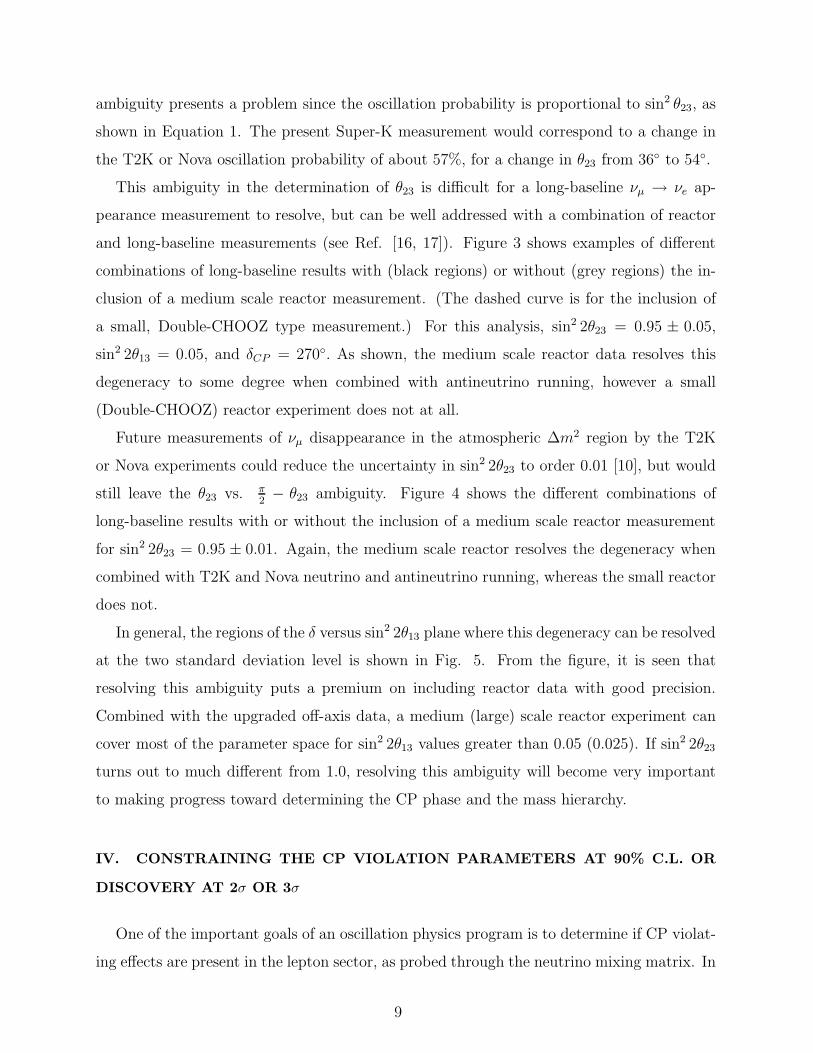
This ambiguity in the determination of θ23 is difficult for a long-baseline νµ → νe ap-
pearance measurement to resolve, but can be well addressed with a combination of reactor
and long-baseline measurements (see Ref. [16, 17]). Figure 3 shows examples of different
combinations of long-baseline results with (black regions) or without (grey regions) the in-
clusion of a medium scale reactor measurement. (The dashed curve is for the inclusion of
a small, Double-CHOOZ type measurement.) For this analysis, sin2 2θ23 = 0.95 ± 0.05,
sin2 2θ13 = 0.05, and δCP = 270◦. As shown, the medium scale reactor data resolves this
degeneracy to some degree when combined with antineutrino running, however a small
(Double-CHOOZ) reactor experiment does not at all.
Future measurements of νµ disappearance in the atmospheric ∆m2 region by the T2K
or Nova experiments could reduce the uncertainty in sin2 2θ23 to order 0.01 [10], but would
still leave the θ23 vs. π2− θ23 ambiguity. Figure 4 shows the different combinations of
long-baseline results with or without the inclusion of a medium scale reactor measurement
for sin2 2θ23 = 0.95 ± 0.01. Again, the medium scale reactor resolves the degeneracy when
combined with T2K and Nova neutrino and antineutrino running, whereas the small reactor
does not.
In general, the regions of the δ versus sin2 2θ13 plane where this degeneracy can be resolved
at the two standard deviation level is shown in Fig. 5. From the figure, it is seen that
resolving this ambiguity puts a premium on including reactor data with good precision.
Combined with the upgraded off-axis data, a medium (large) scale reactor experiment can
cover most of the parameter space for sin2 2θ13 values greater than 0.05 (0.025). If sin2 2θ23
turns out to much different from 1.0, resolving this ambiguity will become very important
to making progress toward determining the CP phase and the mass hierarchy.
IV. CONSTRAINING THE CP VIOLATION PARAMETERS AT 90% C.L. OR
DISCOVERY AT 2σ OR 3σ
One of the important goals of an oscillation physics program is to determine if CP violat-
ing effects are present in the lepton sector, as probed through the neutrino mixing matrix. In
9
FIG. 3: 90% C.L. allowed regions for simulated data with underlying oscillation parameters of
sin2 2θ13 = 0.05, θ23 = 38.54◦, ∆m2 = 2.5 ± 0.1 × 10⁻³ eV2 and δCP = 270◦. The analysis
includes the restriction that sin2 2θ23 = 0.95 ± 0.05. The grey regions are for various long-baseline
combinations of the T2K and Nova experiments for three year running periods. The black regions
are the 90% C.L. allowed regions for a combined medium reactor plus long-baseline analysis. The
dashed lines indicate a combined analysis with a small reactor measurement.
10
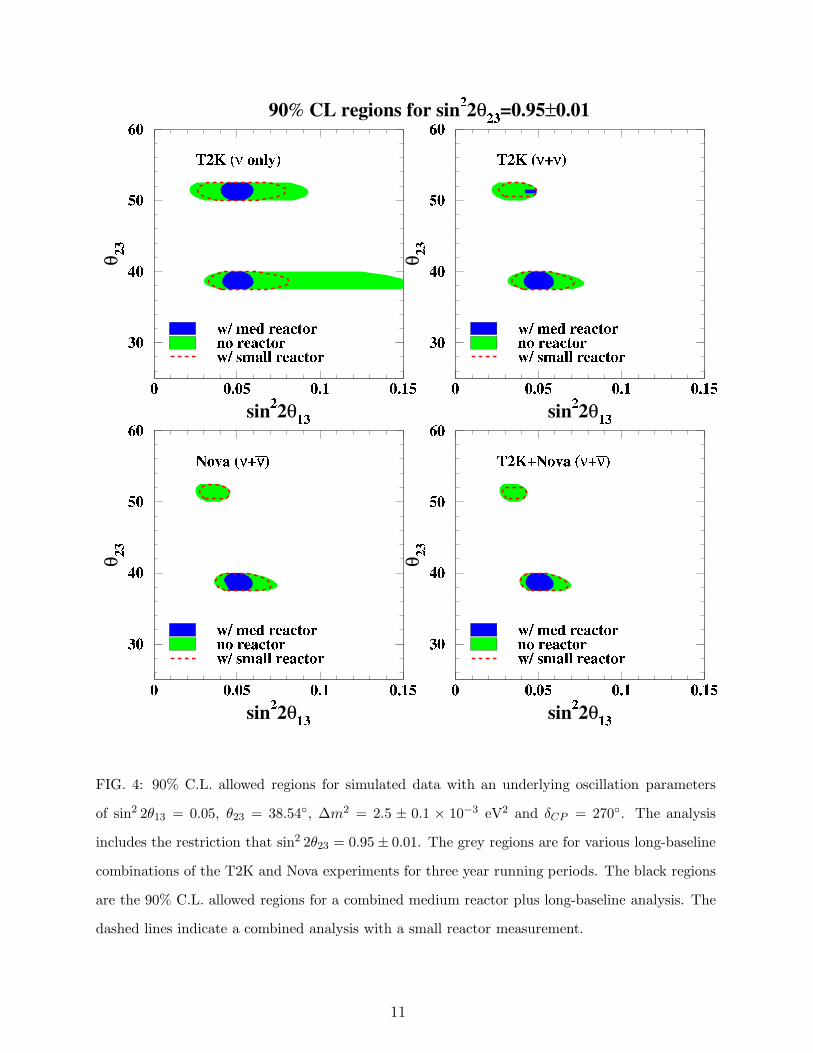
FIG. 4: 90% C.L. allowed regions for simulated data with an underlying oscillation parameters
of sin2 2θ13 = 0.05, θ23 = 38.54◦, ∆m2 = 2.5 ± 0.1 × 10⁻³ eV2 and δCP = 270◦. The analysis
includes the restriction that sin2 2θ23 = 0.95 ± 0.01. The grey regions are for various long-baseline
combinations of the T2K and Nova experiments for three year running periods. The black regions
are the 90% C.L. allowed regions for a combined medium reactor plus long-baseline analysis. The
dashed lines indicate a combined analysis with a small reactor measurement.
11
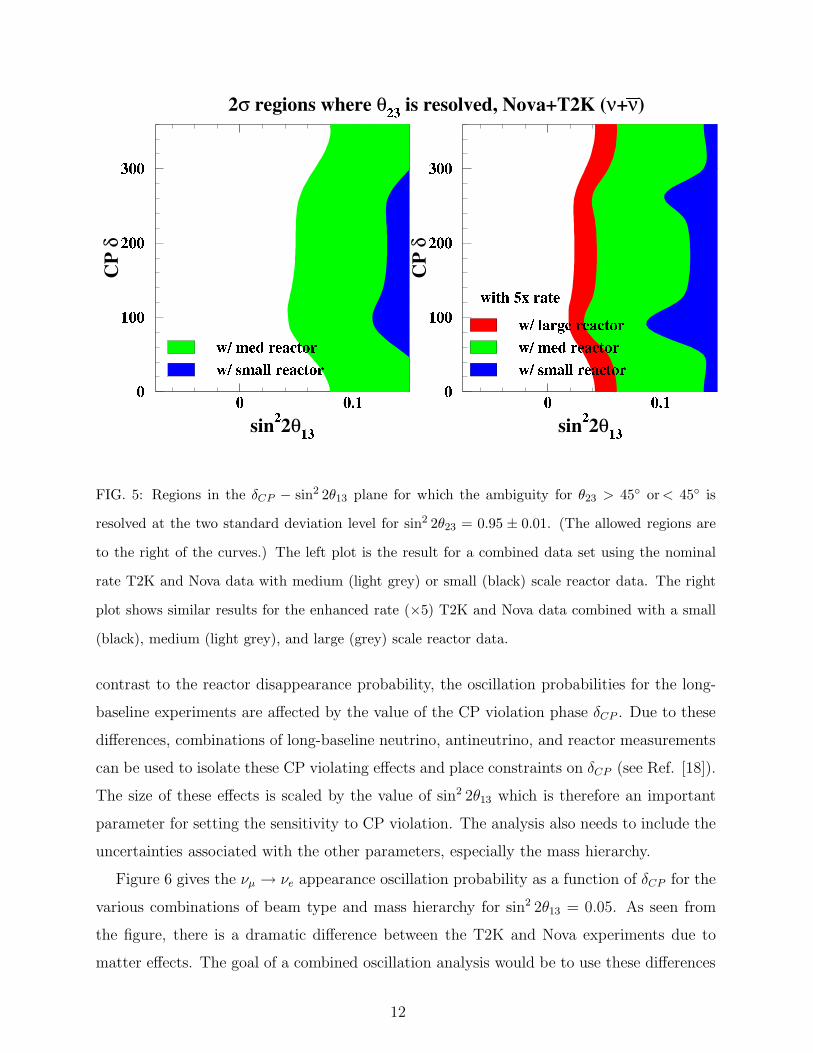
FIG. 5: Regions in the δCP − sin2 2θ13 plane for which the ambiguity for θ23 > 45◦ or < 45◦ is
resolved at the two standard deviation level for sin2 2θ23 = 0.95 ± 0.01. (The allowed regions are
to the right of the curves.) The left plot is the result for a combined data set using the nominal
rate T2K and Nova data with medium (light grey) or small (black) scale reactor data. The right
plot shows similar results for the enhanced rate (×5) T2K and Nova data combined with a small
(black), medium (light grey), and large (grey) scale reactor data.
contrast to the reactor disappearance probability, the oscillation probabilities for the long-
baseline experiments are affected by the value of the CP violation phase δCP . Due to these
differences, combinations of long-baseline neutrino, antineutrino, and reactor measurements
can be used to isolate these CP violating effects and place constraints on δCP (see Ref. [18]).
The size of these effects is scaled by the value of sin2 2θ13 which is therefore an important
parameter for setting the sensitivity to CP violation. The analysis also needs to include the
uncertainties associated with the other parameters, especially the mass hierarchy.
Figure 6 gives the νµ → νe appearance oscillation probability as a function of δCP for the
various combinations of beam type and mass hierarchy for sin2 2θ13 = 0.05. As seen from
the figure, there is a dramatic difference between the T2K and Nova experiments due to
matter effects. The goal of a combined oscillation analysis would be to use these differences
12

FIG. 6: Oscillation probability for νµ → νe appearance vs. δCP for the T2K (top) and Nova
(bottom) experimental setups with ∆m2 = 2.5 × 10⁻³ eV2, sin2 2θ13 = 0.05 and sin2 2θ23 = 0.95.
The four curves correspond to pure neutrino (solid: normal hierarchy, dashed: inverted hierarchy)
or antineutrino (black circle: normal hierarchy, white circle: inverted hierarchy) beams.
in the oscillation probabilities to constrain the CP violation phase and the mass hierarchy.
For these analyses, reactor measurements provide an unambiguous constraint on the value
of sin2 2θ13.
From Figure 6, it can also be seen that a measurement of the appearance probability for
13
neutrino running alone could give information on δCP if the value of sin2 2θ13 was known with
sufficient accuracy from a reactor oscillation measurement. For high values of sin2 2θ13 near
the current limit, Figure 7 shows how δCP can be constrained with neutrino only running
for Nova, T2K, and the combination of the two with and without a medium reactor. For
the true value of δCP = 90◦, T2K and the reactor narrows down the allowed range in δCP .
Figure 8 shows how the combinations of various measurements, including antineutrino
measurements, can be used to constrain the allowed CP violation phase. The results are
for a scenario with sin2 2θ13 = 0.05 and the optimum phase point δCP = 270◦ (where the
difference between the neutrino and antineutrino oscillation probability is the largest for the
normal hierarchy). In the upper left plot, a T2K ν–only (3 years) measurement is displayed
first without any reactor measurement (grey region), then combined with a medium scale
reactor measurement (black region). The dashed curve outlines the region using a small
(Double-CHOOZ type) reactor result. The upper right plot then shows what happens when
both neutrinos (3 years) and antineutrinos (3 years) are used with and without the reactor
measurement. Finally, the lower left plot shows the combination of T2K and Nova with
and without the reactor result. The medium reactor measurement, in all cases, significantly
reduces the uncertainty on θ13.
As a measure of how well the CP phase can be constrained in general, Figure 9 gives the
discovery regions in the δCP −sin2 2θ13 plane for which a null CP violation solution (δCP = 0
or π) is ruled out by at least three standard deviations. The black regions use long-baseline
data only and the grey regions include data from a medium scale reactor experiment. Plot
a) is for Nova only, b) is for T2K only and c) includes data from both T2K and Nova. (The
results for nominal beam rates are not shown since they do not provide any restrictions
at the three standard deviation level.) From the plots, it is seen that the combination of
T2K and Nova with increased intensity can start to probe the CP violation phase space if
sin2 2θ13 & 0.02. (The narrow region in the lower range of δ is due to the ambiguity between
normal and inverted hierarchies.) The reactor measurements show how viable a CP violation
measurement will be with the various combinations of the long-baseline setups.
14
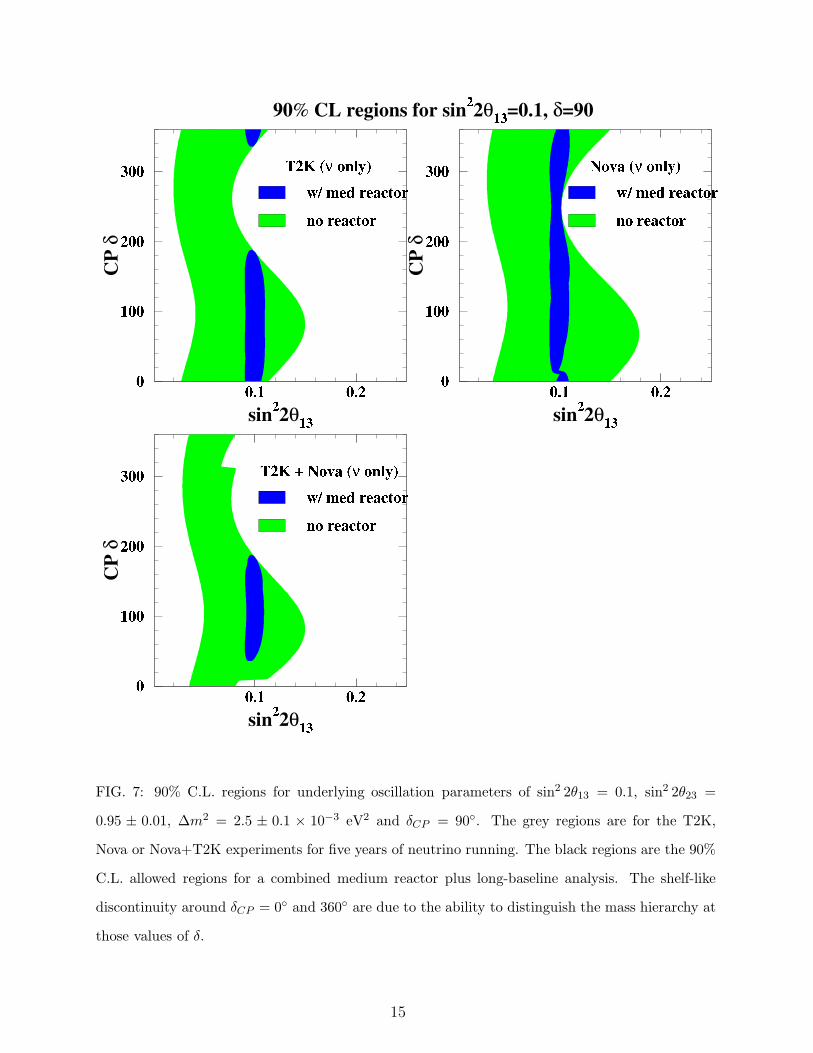
FIG. 7: 90% C.L. regions for underlying oscillation parameters of sin2 2θ13 = 0.1, sin2 2θ23 =
0.95 ± 0.01, ∆m2 = 2.5 ± 0.1 × 10⁻³ eV2 and δCP = 90◦. The grey regions are for the T2K,
Nova or Nova+T2K experiments for five years of neutrino running. The black regions are the 90%
C.L. allowed regions for a combined medium reactor plus long-baseline analysis. The shelf-like
discontinuity around δCP = 0◦ and 360◦ are due to the ability to distinguish the mass hierarchy at
those values of δ.
15
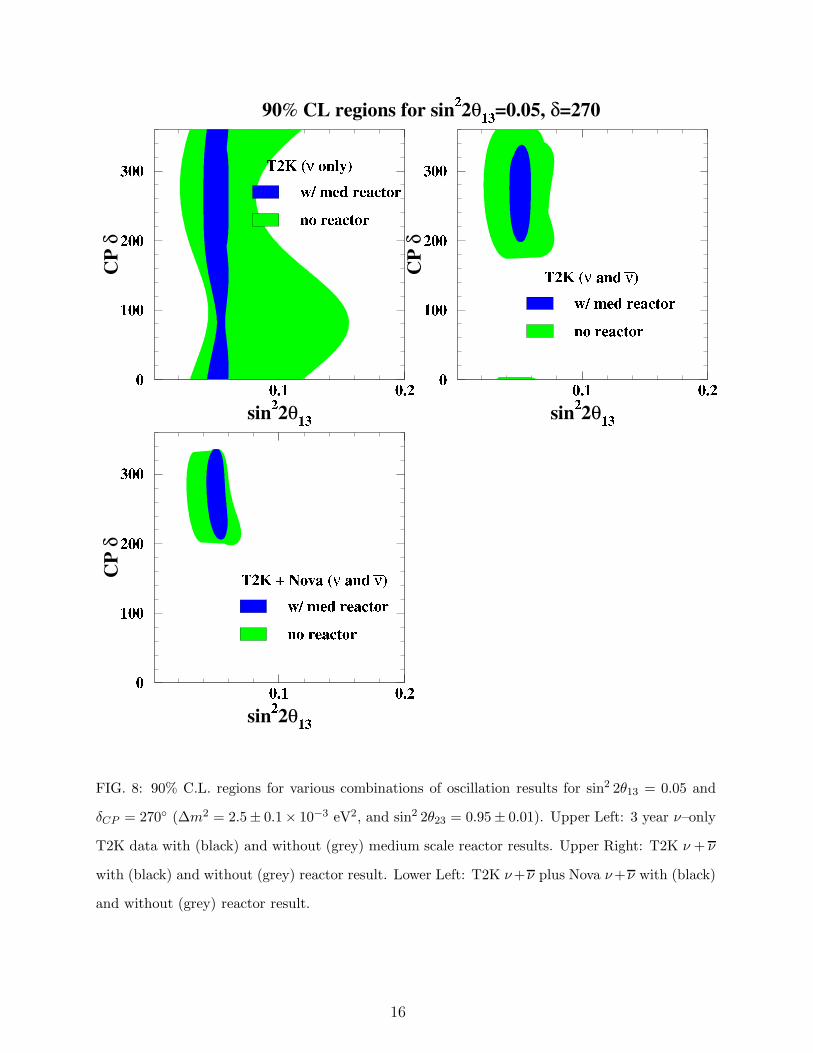
FIG. 8: 90% C.L. regions for various combinations of oscillation results for sin2 2θ13 = 0.05 and
δCP = 270◦ (∆m2 = 2.5± 0.1× 10⁻³ eV2, and sin2 2θ23 = 0.95± 0.01). Upper Left: 3 year ν–only
T2K data with (black) and without (grey) medium scale reactor results. Upper Right: T2K ν + ν
with (black) and without (grey) reactor result. Lower Left: T2K ν+ν plus Nova ν+ν with (black)
and without (grey) reactor result.
16

FIG. 9: Discovery regions in the δCP − sin2 2θ13 plane for which a null CP (δCP =0,π) violation
solution is ruled out by at least three standard deviations. The black regions use long-baseline
data only and the grey regions include data from a medium scale reactor experiment. a) Nova (×5
rate with Proton Driver) ν(3yr) + ν(3yr) data; b) T2K (×5 rate) ν(3yr) + ν(3yr) ; c) T2K (×5
rate) ν(3yr) + ν(3yr) + Nova (×5 rate) ν(3yr) + ν(3yr) data. (Nova, T2K and Nova plus T2K
with nominal rates is not shown since those combination is not capable of making a CP violation
discovery at the three standard deviation level.) The vertical dashed line indicates the 90% CL
upper limit for a medium reactor experiment alone.
17
V. DETERMINING THE MASS HIERARCHY
For constraining the mass hierarchy, one needs to compare measurements in a region
where the oscillation probability changes significantly for a normal versus inverted mass
spectrum (see Figure 6). These type of changes can be induced by matter effects as the
neutrinos or antineutrinos propagate through material. The Nova experiment is particularly
important here due to the long distance the neutrinos travel through the matter of the earth.
An accurate determination of the hierarchy is possible by combining the results from
long-baseline neutrino and antineutrino data. Here again, the ambiguity with respect to
the value of δCP limits the determination to regions in the sin2 2θ13 − δCP plane. Figure 10
shows the regions for which the mass hierarchy is resolved by two standard deviations. The
black regions use long-baseline data only and the grey regions add data from a medium scale
reactor experiment.
These plots show that the mass hierarchy can be determined for limited regions with
sin2 2θ13 > 0.05 at the nominal beam rates. With the enhanced (×5) rates, the combination
of T2K plus Nova covers most of the δCP range for sin2 2θ13 > 0.03. Note that in the upper
right plot the black and grey regions lie on top of each other, that is, a reactor doesn’t
contribute for a short joint run of Nova and T2K but does for a longer one.
VI. OTHER STUDIES
It may be possible in the future to use a very large detector at a site with multiple reactors
to push the sin2 2θ13 sensitivity down even beyond the “large reactor” scenario to the level
of 0.003 at 90% C.L. Combining such a reactor measurement with enhanced long-baseline
results improves coverage minimally for a CP measurement and hierarchy determination as
compared to a medium reactor, as seen in Figure 11.
Figures 12 and 13 show sin δCP vs sin2 2θ13 for future T2K and Nova upgrades. For
this study, we consider a Hyper-K upgrade data sample to be equivalent to 150 years (×20
fiducial mass for 15 years) of T2K running and a Nova Phase II with a proton driver to be
equivalent to 50 years (×5 increased beam rate or detector volume for 10 years) of normal
Nova running. These plots, inspired by an earlier paper of Mena and Parke’s [15], show
clearly the regions of degeneracy.
18

FIG. 10: Regions in the δCP − sin2 2θ13 plane for which the mass hierarchy is resolved by two
standard deviations. The grey regions use long-baseline data only and the black regions add data
from a medium scale reactor experiment. a) Nova ν(3yr) + ν(3yr) data; b) Nova plus T2K with
ν(3yr) + ν(3yr) data; c) Nova (×5 beam rate) with ν(3yr) + ν(3yr) data; d) T2K (×5 beam rate)
ν(3yr) + ν(3yr) + Nova (×5 beam rate) ν(3yr) + ν(3yr) data. The vertical dashed line indicates
the 90% CL upper limit for a medium reactor experiment alone.
19

FIG. 11: Regions in the δCP −sin2 2θ13 plane where null CP violation is ruled out by three standard
deviations (left plot) and where the mass hierarchy is resolved by two standard deviations (right
plot) for a very large (VL) reactor, with sensitivity of sin2 2θ13 > 0.003 at 90% C.L. Both plots
are for Nova and T2K (×5 beam rate) with ν(3yr) + ν(3yr) data. The grey region indicates
a measurement including the medium sized reactor, and the black region includes the very large
reactor. The vertical dashed line indicates the 90% CL upper limit for a medium reactor experiment
alone.
Ambiguities associated with the mass hierarchy produce multiple solutions and ambigui-
ties associated with θ23 give extended regions along the θ13 direction. If θ23 = 45 degrees, the
combination of T2K and Nova correctly determines the mass hierarchy, as shown in Figure
12, and gives only one allowed parameter region. On the other hand, with θ23 non maximal
(θ23 = 38.54◦), Figure 13 shows two allowed regions due to the θ23 ambiguity that can only
be resolved with the addition of a reactor measurement.
20
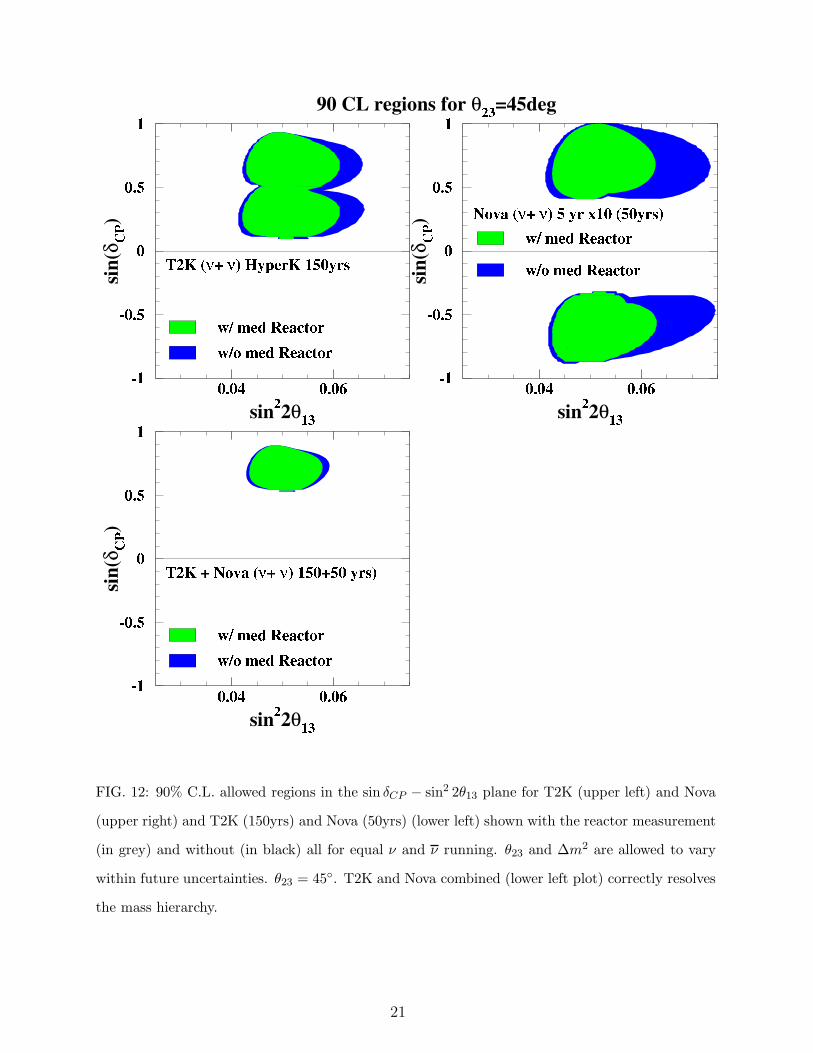
FIG. 12: 90% C.L. allowed regions in the sin δCP − sin2 2θ13 plane for T2K (upper left) and Nova
(upper right) and T2K (150yrs) and Nova (50yrs) (lower left) shown with the reactor measurement
(in grey) and without (in black) all for equal ν and ν running. θ23 and ∆m2 are allowed to vary
within future uncertainties. θ23 = 45◦. T2K and Nova combined (lower left plot) correctly resolves
the mass hierarchy.
21
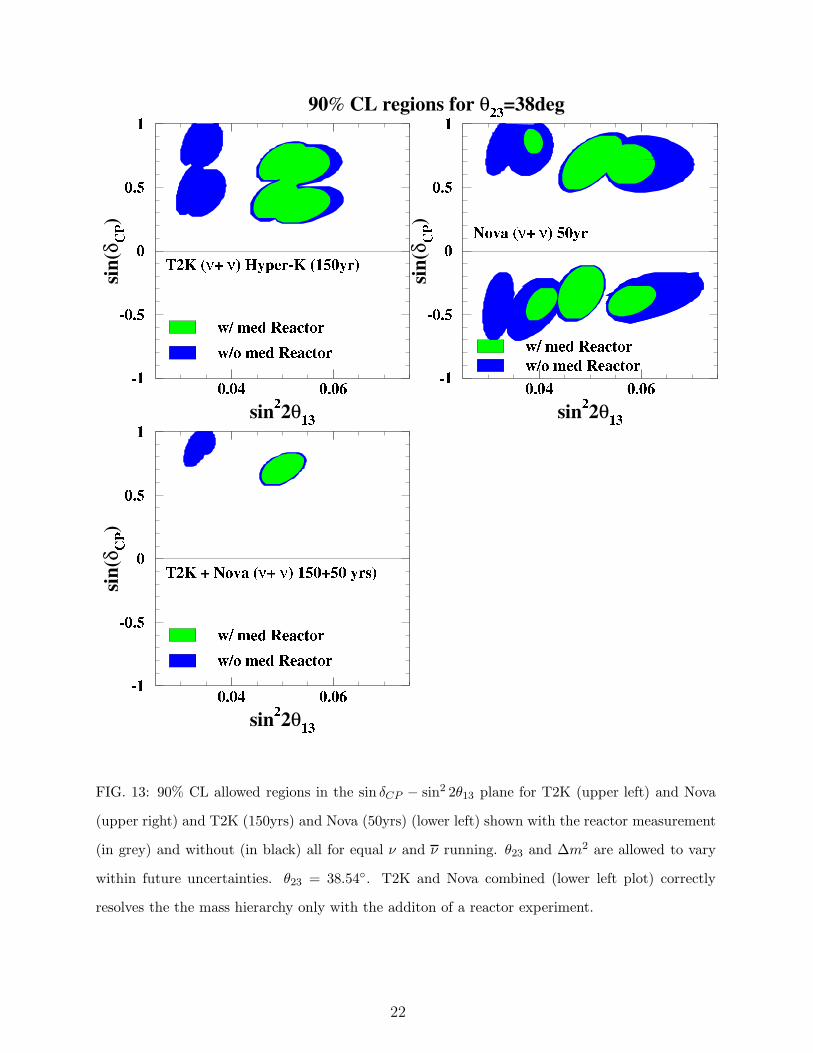
FIG. 13: 90% CL allowed regions in the sin δCP − sin2 2θ13 plane for T2K (upper left) and Nova
(upper right) and T2K (150yrs) and Nova (50yrs) (lower left) shown with the reactor measurement
(in grey) and without (in black) all for equal ν and ν running. θ23 and ∆m2 are allowed to vary
within future uncertainties. θ23 = 38.54◦. T2K and Nova combined (lower left plot) correctly
resolves the the mass hierarchy only with the additon of a reactor experiment.
22

VII. CONCLUSIONS
Over the next decade, many experiments are planned to address neutrino oscillations
and make improved measurements of the relevant parameters of neutrino mixing. As in the
past, combining the results from different types of experiments with different setups will be
necessary to map out the underlying physics. In the studies described here, we have tried
to investigate the sensitivity using the suite of currently planned or proposed experiments.
The complementarity of a program with several long-baseline accelerator experiments and
several reactor measurements is clear and, if parameters are favorable, will lead to significant
progress in the understanding of neutrino mixing and masses.
As part of this program, reactor measurements hold the promise of constraining or mea-
suring the θ13 mixing parameter and helping to resolve the ambiguity in determining the
θ23 mixing parameter. The sizes of these parameters are important inputs for models of
lepton mass and mixing that span the range from GUTs trying to relate the CKM and
MNS matrix to extra dimension models that have neutrinos propagating in the bulk. The
smallness of θ13 relative to the other angles may give a hint as to what the underlying theory
may be. Besides leading to a better understanding of neutrino mixing, these angles, θ13 and
θ23, are two of the twenty-six parameters of the standard model and, as such, are worthy of
high precision measurement independently of other considerations. For θ13, a two detector
reactor experiment unambiguously measures the size of this angle with significantly better
precision than any other proposed experimental technique. In addition, reactor data may
be key for resolving the θ23 degeneracy.
Looking towards probing CP violation and the mass hierarchy in the neutrino sector,
the field will need several high-rate, long-baseline experiments. Here, the size of θ13 will be
important for interpreting the results and for planning a viable future neutrino oscillation
program. In addition to setting the scale for future studies, a reactor result when combined
with long-baseline measurements may also give early constraints on CP violation and early
indications of the mass hierarchy. In the longer term, a combination of long-baseline ex-
periments such as T2K and Nova will start to give some information about these effects if
sin2 2θ13 > 0.05 and, with some upgrades and enhanced beam rates, will give good coverage
if sin2 2θ13 > 0.03. If θ13 turns out to be smaller than these values, one will need other
strategies for getting to the physics. Thus, an unambiguous determination θ13 from, for
23

example, a medium scale reactor experiment, is an important ingredient in planning the
strategy for this program, as well as accessing the phenomenology of neutrino mixing.
[1] P. Huber, M. Lindner, M. Rolinec, T. Schwetz and W. Winter, “Prospects of accelerator and
reactor neutrino oscillation experiments for the coming ten years,” Phys. Rev. D 70, 073014
(2004) [arXiv:hep-ph/0403068].
[2] V. D. Barger, S. Geer, R. Raja, and K. Whisnant, Phys. Rev. D63, 113011 (2001), [arXiv:hep-
ph/0012017].
[3] The Fortran program for the oscillation probability, which includes all effects in a three neu-
trino mixing model, was provided by S. Parke (Fermilab), [email protected].
[4] H. Minakata, H. Sugiyama, O. Yasuda, K. Inoue, and F. Suekane, Phys. Rev. D68, 033017
(2003), [arXiv:hep-ph/0211111].
[5] F. James and M. Roos, Comput. Phys. Commun. 10, 343 (1975).
[6] F. Ardellier et al., “Letter of intent for Double-CHOOZ: A search for the mixing angle
theta(13),” [arXiv:hep-ex/0405032].
[7] E. Abouzaid et al. (Braidwood Collaboration) Braidwood Project Descrip-
tion, URL http://braidwood.uchicago.edu/project_web.ps. Also see URL
http://braidwood.uchicago.edu/
[8] Daya Bay Neutrino Experiment, URL http://bes.ihep.ac.cn/dayawane/.
[9] Y. Ashie et al. [Super-Kamiokande Collaboration], “Evidence for an oscillatory signature in
atmospheric neutrino oscillation,” Phys. Rev. Lett. 93, 101801 (2004) [arXiv:hep-ex/0404034].
[10] T2K Letter of Intent (January 2003), URL http://neutrino.kek.jp/jhfnu.
[11] T. Araki et al. [KamLAND Collaboration], “Measurement of neutrino oscillation with Kam-
LAND: Evidence of spectral distortion,” Phys. Rev. Lett. 94, 081801 (2005) [arXiv:hep-
ex/0406035].
[12] I. Ambats et al. (NOvA) (2004), FERMILAB-PROPOSAL-0929, URL
http://www-off-axis.fnal.gov/.
[13] Revised Nova Proposal, March 21, 2005 version, URL
http://www-nova.fnal.gov/NOvA_Proposal/Revised_NOvA_Proposal.html.
[14] T. Nakaya, “CP violation in JHF(nu) (Phase II),” Prepared for 4th Workshop on Neutrino
24
Oscillations and their Origin (NOON2003), Kanazawa, Japan, 10-14 Feb 2003 (World Sci-
entific Publishing, 2004 ed. Suzuki, Y, Nakahata, M., Itow, Y., Shiozawa, M., and Obayashi,
Y.; ISBN 9812384294)
[15] O. Mena and S. J. Parke, Phys. Rev. D 70, 093011 (2004) [arXiv:hep-ph/0408070].
[16] H. Minakata, H. Sugiyama, O. Yasuda, K. Inoue, and F. Suekane, Phys. Rev. D68, 033017
(2003), [arXiv:hep-ph/0211111].
[17] H. Minakata, M. Sonoyama and H. Sugiyama, “Determination of theta(23) in long-baseline
neutrino oscillation experiments with three-flavor mixing effects,” Phys. Rev. D 70, 113012
(2004) [arXiv:hep-ph/0406073].
[18] H. Minakata and H. Sugiyama, Phys. Lett. B580, 216 (2004), [arXiv:hep-ph/0309323].
25
Top Related