


Languages
Pages
Legal

Universal Journal of Educational Research 5(9): 1435-1446, 2017 http://www.hrpub.org DOI: 10.13189/ujer.2017.050901
Comparison of Objective and Subjective Methods on Determination of Differential Item Functioning
Melek Gülşah Şahin
Department of Educational Sciences, Faculty of Education, Gazi University, Turkey
Copyright©2017 by authors, all rights reserved. Authors agree that this article remains permanently open access under the terms of the Creative Commons Attribution License 4.0 International License
Abstract Research objective is comparing the objective methods often used in literature for determination of differential item functioning (DIF) and the subjective method based on the opinions of the experts which are not used so often in literature. Mantel-Haenszel (MH), Logistic Regression (LR) and SIBTEST are chosen as objective methods. While the data of an extensive examination in Turkey applied for objective methods, the data that are obtained from Expert Opinions Form used to evaluate the items of the same examination. The data obtained from 5077 female and 5271 male students are used for the objective methods, and 23 experts’ opinions are used for subjective method. The concordance between the objective and subjective methods is calculated by using the compatibility rate and Cohen’s kappa coefficient in the research. While the highest concordance related to the existence of DIF is obtained between MH and SIBTEST methods (.90; κ=0,79) and the lowest concordance is between LR and SIBTEST methods (.75; κ=0,50) in objective methods, When the concordance of the objective method with the subjective methods is examined, at least moderate concordance (.75; κ=0,47) is obtained in the decision. When items which have DIF is examined according to DIF level, three items indicate low level of DIF and one item indicates moderate or high level of DIF for both methods. In addition, in subjective method, a decision study is made on the number of the experts presenting opinion within the generalizability theory and the acceptable reliability value is reached with 13 experts’ opinions.
Keywords Differential Item Functioning, Mantel Haenszel, Logistic Regression, SIBTEST, Expert Opinions, Objective Methods, Subjective Method
1. IntroductionThe three property desired in measurement tools used in
education are validity, reliability and practicableness.
Because the results of measurement will be used for various purposes such as selection, placement, approval and licensing, providing these properties is very important. Validity, one of these properties, expresses whether the measurement tool measures the desired differential or not, and if it does, to what extend it can measure purified from other differentials [38]. One of the proofs related to the validity of the measurement tool is also being purified from test and item bias. Biased items will affect the validity, and thus the reliability of the test. A test shows biasness at the rate of its items’ biasness, and the test will become unbiased by finding and removing the biased items. Therefore, emphasizing on items instead of the test itself is necessary for the studies on biasness [14].
Item biasness is the differences on the possibility of giving the correct answer to the item between the sub-groups having the equal level of ability that take the test because of the conditions for applying the test or some characteristics of it. [30,44,8,62]. Based on its definition, the matter is, a biased item provides advantages to a group formed by individuals having different characteristics apart from the characteristic to be measured, and provides disadvantages to the other group. In other words, biasness is defined as the systematic error or invalidity for a specific group. At this point it is matter that the systematic on the test scores create failure on the test results of the members of a specific group [8]. Usually the differences between racial and ethnic groups and differences between the genders are studied on biasness studies. The effects such as social class, age, religion, place of residence by which the sub-groups are defined can be viewed [8].
In a study of determination of item biasness, Differential Item Functioning (DIF) needs to be determined firstly. DIF is based on statistical analysis of item responses which reveal the systematic differences of the responses to the test item between groups depending on the personal characteristics of the group members. In other words, the hypothesis is that the groups are different. If there are differences in the item performance of the members of the groups at the end of DIF analysis, it is suspected that the items DIF shows are biased [25]. On the second stage, the expert opinions can be
1436 Comparison of Objective and Subjective Methods on Determination of Differential Item Functioning
consulted and as a result of answers obtained from experts' opinions, it can be concluded whether items are biased or not since the existence of DIF can arise from item biasness, as well as from real differences between the sub-groups [8, 61]. Shortly, DIF analysis is one of the stages for viewing item biasness [11].
The methods for determining DIF can be viewed under various titles. One of these classifications is the methods based on Classical Test Theory (CTT) and Item Response Theory (IRT). Converted Item Index, Mantel-Haenszel (MH), Logistic Regression (LR), Standardization Method, ANOVA and chi square are among the methods that are based on CTT. Likelihood Ratio Test, Lord’s chi square and Raju’s field measures are among IRT based methods [30,8]. Another classification is the classification made according to score and implicit variable observed by Potenza and Dorans [43]. Accordingly, when observed score is matching criteria, Logistic regression is parametric, and Mantel Haenszel and Standardization Methods are non-parametric methods. When implicit variable is matching criteria, Log-linear IRT-LR and Lord’s chi square are parametric and Simultaneous Bias Test (SIBTEST) is non-parametric methods.
When the literature is considered, it is seen that different methods are compared in the search of DIF conducted according to various items[38,21,31,60,16,58,45,24,11,3,34,2].
Hidalgo and Lopez-pina [31] compared MH and LR methods by simulation study. The numbers of the items that show DIF are obtained more in MH method when compared with LR method. Zheng, Gierl and Cui [60] have compared MH, LR and SIBTEST methods for the determination of DIF with regard to gender in real data. It was determined that the methods used for the determination of the items revealing DIF suggested concordance at least at the moderate level in different subtests. Doğan and Öğretmen [14] compared the chi square, MH and LR techniques for the determination of DIF with regard to gender in data obtained from a national exam. The highest number of the items suggesting DIF was obtained by MH method. In marked chi square and LR methods, no item suggesting DIF was found. In his study, Yıldırım [58] compared the results obtained from MH, Likelihood Ratio Test (LRT) and Classified Factor Resolution (CFR) methods in real and simulated data. It was indicated that LRT method gave more correct results comparing to the other methods in the case of that the compared groups had different or equal arithmetic mean. Gök, Kelecioğlu and Doğan [24] compared MH and LR methods in two sub-tests of a national exam for the determination of DIF according to gender and school type. It was stated that MH and LR methods suggested concordance in low level according to the research results. Atalay, Gök, Kelecioğlu and Arsan [3] compared MH, LR, IRT-Likelihood Ratio (IRT-LR) and SIBTEST methods, which are among DIF determination methods, by simulation study. In the research, it seemed that DIF determination rate by LR method was found low, and DIF determination rate by
IRT- LR method was found high as a result of the research. Also, it was indicated that MH, SIBTEST and (IRT-LR) methods for the determination of single formed DIF, and LR, SIBTEST and IRT-LR methods for the determination of non-single formed gave the most compatible results. Arıkan Akın [2] compared the results obtained from IRT-LR, Ordinal Logistic Regression (OLR) and Poly-SIBTEST methods for the determination of DIF according to gender using the data obtained from the mathematics sub-test of an international exam. It was stated that the number of the items suggesting DIF was similar in those three methods, but DIF levels were different.
In this research, Mantel-Haenszel and Logistic regression from the techniques based on score matching criteria observed according to the gender variable, and SIBTEST from the techniques based on implicit variable matching criteria are used. While the usage of MH and LR methods provides convenience in use and interpretations, SIBTEST provides less failure on estimates due to its property of independence from the group [34]. These methods will be explained below shortly.
Mantel Haenszel (MH); it is a DIF determination technique based on chi square statistic [1]. In this method, individuals are grouped as focus and reference groups and individuals in each group are classified according to their talents or abilities (mostly 4 or 5 classes) [41]. In this method, the matching criteria are the total test score. The numbers of correct and wrong answers of both groups are tabulated for the individuals having the same total score. By using this table, MS statistics can be calculated as an estimator of probability ratio. In this way, performance probability ratio of both groups, which are equalized according to their total scores, can be compared. If it is αMH>1, DIF can be interpreted in favour of the reference group in the item, if it is αMH <1, it can be interpreted in favour of the focus group, and if it is αMH =1 it can be interpreted as DIF is absent. Also, for the purpose of making the interpretation of αMH statistics easier, the delta coefficient is obtained by making logarithmic conversion. When logarithmic conversion is made, the following interpretations can be made; if ΔMH>0, DIF is in favor of focus group in the item; if ΔMH<0, DIF is in favor of reference group, if ΔMH=0, DIF is absent (Holland and Thayer, 1986). For the determination of DIF level, the absolute magnitude of MH can be viewed. If |ΔMH|<1, DIF is treated as A (low) level; If 1≤| ΔMH|<1.5, DIF is treated as B (moderate) level; If |ΔMH|≥1, 5, DIF is treated as C (high) level [61,17, 8].
In Logistic Regression Method (LR), group belonging and the total test score is taken as independent variables, and the item scores are taken as dependent variables. This method is developed by Swaminathan and Rogers (1990) as an alternative to DIF determination methods that are based on Mantel-Haenszel and CTT.
Determination of both the uniform and non-uniform DIF is possible with LR method. In this method, the variables are added to the model hierarchically. The followings are included in the analysis; total scores in Model-1, group
Universal Journal of Educational Research 5(9): 1435-1446, 2017 1437
variable in Model 2; and interaction of total scores and group variables in Model-3. A significant chi square value obtained from Model-2 indicates the existence of DIF. The ΔR2 = R3
2 –R1
2 value related to the difference of the standardized regression coefficients (R2) obtained from Model-1 and Model-3 is calculated in order to determine the level of biasness. In literature, there are different cut-off values. According to Zumbo and Thomas (1998); if ΔR2< 0, 013, a DIF on level A; if 0, 013≤ ΔR2<0, 026, a DIF on level B, and if ΔR2 ≥0, 026, a DIF on Level C can be stated [61]. However Bakan Kalaycıoğlu and Kelecioğlu [4] indicated that, because ΔR2 is effected from sample size and there is no consensus in literature, the levels of DIF could be said as follows; if ΔR2<0, 010, a DIF on level A; if 0, 010≤ΔR2<0, 020, a DIF on level B, if ΔR2 ≥ 0, 020, a DIF on level C.
Nonparametric modeling based on IRT is used in SIBTEST [43]. In this method, items are separated into two sub-tests. While the items that include DIF are included in the first test, other items are included in the second test. The ability levels of the individuals are determined according to the test scores obtained from the items that do not include DIF. It can be determined whether the items include DIF or not by making a comparison of the items for the groups formed according to test scores obtained from the items which do not include DIF [9]. In this method, the β values are calculated to determine the size of their effects. The DIF levels are as follows; if β<0, 059, DIF is on level A, if 0, 059 ≤ β<0, 088, DIF is on level B, if β≥ 0, 088, DIF is on level C [46].
In this research, review of the test items by the experts regarding the presence of DIF also exists. In this step were taken opinion from all of experts who were blind to the results from statistical analyses. They judge that items may have DIF based on only item content. There are researches determining DIF by expert opinion (judgmental method) that is independent from statistical process [42, 18, 28,19,57,15, 16] and in most of these studies generally expert opinion was compared with statistical DIF methods. Some of these
researchers were summarized below. Plake [42] compared studied statistical and subjective DIF methods. It was studied DIF depends on the gender and race in this study. The results showed low agreement between statistical and subjective procedure. Engelhard, Hansche ve Rutledge [18] studied DIF depends on race and examine the agreement between judgmental and empirical indices of DIF. In their results judgmental procedures showed low agreement with empirical procedures. Hambleton and Jones [28] compared statistical (objective) and judgmental (subjective) DIF methods. They studied DIF depends on the different cultural groups (native American and anglo American). In their result consistency of item classification between empirical and judgmental methods was found .73 and Kappa was found .28. It was stated that based on their results, judgmental process can be effective in identifying test items that may be DIF. Ercikan [19] examined differences in meaning between English and French version of TIMSS mathematics and science items by judgmental reviews. Experts were asked how much of the items that have DIF is due to adaptation problem. Yıldırım ve Berberoğlu [57] compared statistical and judgmental DIF methods. They studied DIF depends on the different language groups in PISA 2003 data set. Close agreement was found between judgmental and statistical methods. Dogan, Yurtçu ve Yavuz [15] searched the consistency between statistical DIF results and experts predictions for different tests, DIF types, DIF levels and gender. It was stated that experts' prediction power was low for uniform and non-uniform DIF.
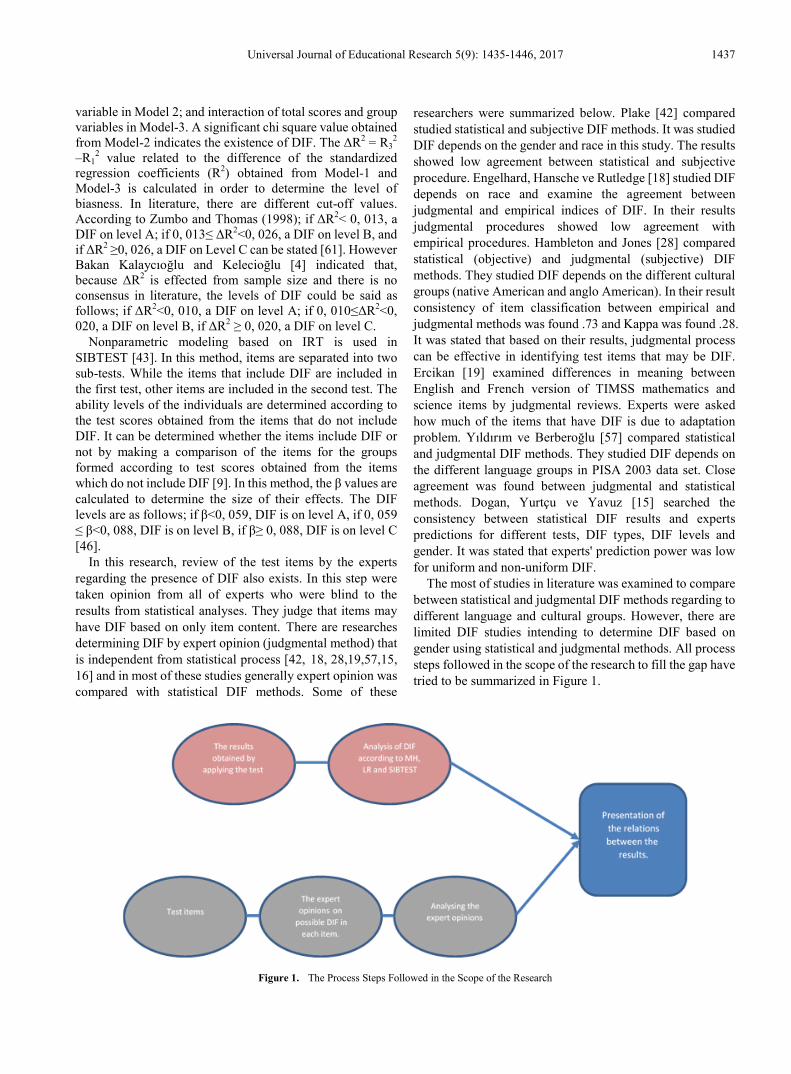
The most of studies in literature was examined to compare between statistical and judgmental DIF methods regarding to different language and cultural groups. However, there are limited DIF studies intending to determine DIF based on gender using statistical and judgmental methods. All process steps followed in the scope of the research to fill the gap have tried to be summarized in Figure 1.
Figure 1. The Process Steps Followed in the Scope of the Research
1438 Comparison of Objective and Subjective Methods on Determination of Differential Item Functioning
When Figure 1 is observed, it is seen that the research is made with two independent different ways. In the first one, it is tried to be determined whether DIF exists according to the methods of MH, LR and SIBTEST by using the data of mathematics sub-test of an extensive exam applied in Turkey. In the second one, the expert opinions regarding to the existence of DIF in test items are taken. Because the experimental methods used for determination of DIF used by Ross and Okabe [45] are called as objective methods, and the expert opinions are called subjective method, they will be called as objective and subjective methods on the following chapters. Also the interaction in and between the methods will be tired to be explained.
The problems of the research are determined: What is the concordance between objective and subjective methods on the decision related to DIF depending on the gender? By starting from this point, the sub-problems of the research are determined as follows. 1 Do the items indicate DIF depending on the gender
according to objective and subjective methods? 2 What is the concordance between objective and
subjective methods on the decision related to DIF? 3 What must be the minimum number of experts that
give their opinion on the existence of DIF?
1.1. Purpose and Importance of the Research
In this research, analysis with the objective methods which are often used in the literature for the determination of differential item functioning with regard to gender on the items that constitute the test, and the subjective method based on experts opinions are performed, and it is aimed to reveal the relation between the methods. An appreciable number of both national and international researches is seen in the literature performed to determine DIF based on objective methods. However, researches determining DIF by subjective method and being based on only the contents of the test items less than other studies. Therefore, this research will be one of the few studies [15, 16] intending to determine DIF depending on the gender using subjective method that all items in large-scale exams in Turkey are examined by experts.
Existence of DIF in achievement tests threats the validity of the test and the accuracy of the decisions that will be taken at the end of the tests. In the methods that are used in the literature frequently, tests are applied to individuals and analysis is performed according to achieved test results. Especially in the situations that pretest cannot be applied (for example KPSS (Public Personel Selection Examination), YDS (Foreign Language Exam), YGS (The Transition to Higher Education Examination) etc.), necessary changes and corrections can be done by the ability of determining whether the items provide advantages to any groups or not. The determination of the consistency of the results obtained by the examination of the experts with the objective methods gives information about the
usability of subjective method for the determination of DIF. In addition, suggestion for the number of the experts whose opinions can be received about the determination of DIF constitutes an important aspect of the research as no study can be found in the literature giving this suggestion.
2. Method In this research, the state of indicating DIF for the items
included in the mathematics sub-test of an extensive exam is investigated according to objective and subjective methods. This is a descriptive research because the determination of the existing situation is aimed [7].
2.1. Study Group
For the determination of DIF according to Mantel-Haenszel, Logistic Regression and SIBTEST among the objective methods, data of 524618 students who took a group a test booklet of the mathematics sub-test of a large scale achievement test applied to the 8th grade students by the Ministry of National Education in Turkey. 49 % of the students are female (n=257394) and 51% are (n=267309) male. Within the scope of the study, for the purpose of preserving the gender distribution in the population, 2% of the female and male students are selected randomly and studied with the data of 5077 female and 5271 male students. In literature, it is indicated that at least 200 individual s’ data for small samples and at least 600 individuals’ data for small and large samples are proper for the determination of DIF [49]. When considering that the largest data to be studied is the data of maximum 7000 people for each group in SIBTEST program [37] that is used in analysis, the size of the sample used in the research is determined.
In the subjective method, the opinions of 23 experts who graduated from mathematics teaching and had education in the field of assessment and evaluation in education are taken. A close attention has been paid for the experts for having post graduate degree with regard to having knowledge about DIF and biasness. In addition, 22% (n=5) of the experts have studied on DIF at MA or PhD level.18% (n=4) of the experts are continuing to their doctorate education, and 13% (n=3) of them have had their PhD. 78% (n=18) of the experts are female and 22% (n=5) male. Also 74% (n=17) of the experts have an experience on teaching in state or private educational institutions. 61 % of the experts having teaching experience have an experience between 0-2 years (n=14) and 17% (n=4) have an experience of 3 years and over.
2.2. Data Collection Tool
For the data analysis based on objective methods, the data of the mathematics sub-test that consists of 20 items of a large scale achievement test (2012 Placement Test) applied
Universal Journal of Educational Research 5(9): 1435-1446, 2017 1439
by Ministry of National Education in Turkey are used. Expert Opinion Form used for expert opinion by Ross and Okabe [45] and developed by the researcher by making little changes on the grading key is used for the subjective method. In this form, evaluation of each item in the achievement test by the experts in accordance with the criteria included in Table 1 is asked.
In addition, 3 assessment and evaluation experts are consulted for the expert opinion form. Experts have expressed opinion about that the related criteria are understandable and can be used. Information on DIF is presented by gathering with the experts before the evaluation of the existence of DIF, and a discussion is made on sample mathematics questions of which DIF study has been done before in relation with the probable sources of DIF with the group. It is passed on to the evaluation once there are no questions by the experts. The experts are asked to evaluate each item with the consideration of that DIF may arise from the real differences between groups, the properties of the items and biasness, and also to state the possible reasons for the items expressed to indicate DIF.
2.3. Analysis of Data
Analysis is performed based on Mantel Haenszel, Logistic Regression and SIBTEST methods which are determined as objective methods for the determination of
DIF. On DIF analysis the following are used; EZDIF software for the analysis based on MH method [54], syntax related to binary scored items written for SPSS for the analysis based on LR [62] and for SIBTEST analysis SIBTEST Software [48] which has the identical name.
Before analyzing the data, the descriptive statistics in Table 2 are obtained to be informed about the distribution of all groups and sub-groups. Wrong and blank answers are encoded as 0 and correct answers as 1.
When the data in the Table 2 is reviewed, it can be said that the mean, the standard deviation, skewness and kurtosis values of the sub sample are close to each other and all group values. In addition, when the average test difficulty is reviewed, it is seen that the test has the same difficulty level for both groups. It is seen that the test reliability coefficients are close to each other for both groups and they are adequate. From these points of views, it can be said that the distribution of the female and male students in the sample groups are similar to each other and sub-groups are equal to each other.
Since SIBTEST analysis is used in the research, it is examined whether the item response theory provides the hypotheses of unidimensionality and local independence. A confirmatory factor analysis is made for the unidimensionality hypothesis and goodness of fit indexes presented in Table 3.
Table 1. Criteria The Experts Used for the Evaluation of the Items
0 The female and male students that stand at same ability/success level have the same advantages to answer the item.
1 Female students may have a low level of advantage (A level) among the female and male students having the same level of ability/success to answer the item.
2 Female students may have a moderate or high level of advantage (B or C level) among the female and male students having the same level of ability/success to answer the item.
3 Male students may have a low level of advantage (A level) among the female and male students having the same level of ability/success to answer the item.
4 Male students may have a moderate or high level of advantage (B or C level) among the female and male students having the same level of ability/success to answer the item.
Table 2. Descriptive Statistics Obtained with Regard to Gender
Variables Total Female Male N 10216 5077 5271
Arithmetic mean 6.13 6. 06 6.19 Standard Deviation 4.82 4.76 4. 87
Variance 23.23 22.66 23.78 Skewness 1.22 1. 27 1. 20 Kurtosis 0.689 0.798 0. 626
Minimum 0 0 0 Maximum 20 20 20
Average Test Difficulty 0.31 0.31 0.31 Test reliability (KR-20) 0.869 0.865 0.871
Table 3. Single Factorial Confirmatory Factor Analysis Model Data Goodness of Fıt Indexes
Indexes Female Male GFI .95 .95
AGFI .94 .94 CFI .97 .97 NFI .97 .97
S-RMR .036 .035 RMSEA .051 .052
1440 Comparison of Objective and Subjective Methods on Determination of Differential Item Functioning
The grater than, and equal value to 0.90 of the GFI, AGFI, CFI, NFI values indicates good fitness, and greater than and equal to 0.95 indicates perfect fit. Also, the equal to and smaller than 0.05 values of S-RMR and RMSEA values indicate perfect fit [33, 51, 12]. When the values in Table 2 are reviewed in terms of indicated criteria, it is seen that the model data fitness is achieved and the test is single dimensional for both groups. Also, when the uni-dimensionality hypothesis is ensured, it is deemed that the local independence is ensured too [37, 29].
DIF analysis of the items is performed according to Mantel Haenszel, Logistic Regression, and SIBTEST methods, which are objective methods and dealt in the scope of the research, after fulfillment of the hypothesis. P-value on 95% significance level has taken into consideration after the examination of the results obtained from these methods in the research, and DIF levels of the items having significant values are determined. In this research, the advantageous group has not been taken into consideration. Three different indicators can be used to examine the concordance of different DIF methods with each other. These methods are the correlations of the effect sizes obtained from the methods, concordance percentages and relative concordance percentages [60]. The concordance between the objective and subjective methods is calculated by using the compatibility rate in the research. Values are obtained by proportioning the number of the items that are determined to have the same properties by both compared methods to the total number of the items [39].The following formula is used for the calculation of the compatibility rate in this study.
Compatibility rate = ((The number of items that do not indicate shared DIF + The number of items that indicate
shared DIF / Total number of items)).
Compatibility rate is often used to compare different methods but it doesn’t eliminate chance expect. Thus Cohen’s kappa (κ) coefficient was also computed [10].
Frequency and percentage distribution of the expert s’ opinions regarding to each decision made within the scope of the subjective method on the determination of DIF. A classification with regard to the DIF condition of the items included in the test based on the decision of at least 51% of the raters on each item is performed.
Finally, the most proper number of experts for the determination of DIF is tried to be determined by a decision study within the framework of generalizability theory in the research. For this purpose EduG software is used.
3. Results and Discussion In this chapter, the findings and interpretations regarding
to each sub-problem of this research are presented below.
3.1. Sub-Problem 1: Do the Items Indicate DIF According to Objective and Subjective Methods Regarding to Gender?
1.a. Do the Items Indicate DIF According to Objective Methods Regarding to Gender?
Within the scope of the research, mathematics sub-test data belong to 5571 male and 5077 female students are analyzed according to MH, LR, and SIBTEST methods separately. The results in terms of whether the items indicate DIF in regard to gender according to each method is shown in Table 4.
Table 4. DIF Analysis Results Obtained from Objective Methods According to Gender Variable
Item No MH LR SIBTEST Item No MH LR SIBTEST
Item 1 0.840 0.322 0.804 Item 11 0.003* 0.009* 0.003*
Item 2 0.000* 0.000* 0.000* Item 12 0.033* 0.043* 0.046*
Item 3 0.020* 0.054 0.012* Item 13 0.341 0.358 0.308
Item 4 0.000* 0.00* 0.000* Item 14 0.566 0.503 0.670
Item 5 0.132 0.141 0.192 Item 15 0.806 0.001* 0.868
Item 6 0.719 0.61 0.238 Item 16 0.143 0.237 0.213
Item 7 0.810 0.097 0.474 Item 17 0.595 0.004* 0.978
Item 8 0.013* 0.033* 0.006* Item 18 0.794 0.568 0.628
Item 9 0.011* 0.031* 0.105 Item 19 0.000* 0.00* 0.000*
Item 10 0.313 0.00* 0.134 Item 20 0.308 0.579 0.211
*p<0.05
Universal Journal of Educational Research 5(9): 1435-1446, 2017 1441
When the Table 4 is examined, eight items in the sub-mathematics test that consist 20 items show DIF with regard to gender according to Mantel Haenszel results. According to this method, about 8/20 (40%) items exist which show DIF. 10 items show DIF according to Logistic regression Results. DIF is present in 10/20 (50%) of the items in this method. According to SIBTEST results, DIF is found in seven items in terms of gender. It is seen that DIF is present in about 7/20 (35%) of the items in SIBTEST method. In Table 5, the concordance of the objective methods with each other is seen.
Table 5. Compatibility Rates and Cohen’s Kappa Coefficient of Objective Methods
Mantel-Haenszel Logistic Regression SIBTEST
Mantel-Haenszel 1
Logistic Regression 0.80 (κ=0.60) 1
SIBTEST 0.90 (κ=0.79) 0.75 (κ=0.50) 1
When the Table 5 is examined, it is seen that compatibility rate and Kappa Coefficient of MH and LR methods are 0.80 (80%) and 0.60 respectively; and compatibility rate and Kappa Coefficient of MH and SIBTEST are 0.90 (90%) and 0.79 respectively. It can be said that the results of MH method is more compatible with SIBTEST. The compatibility rate and Kappa Coefficient of LR method with SIBTEST are 0.75 (75%) and 0.50 respectively. It is determined that the lowest compatibility is between these two methods.
Items that are marked as having DIF according to at least two of the methods are dealt as the items with DIF. According to objective methods, it is resulted that eight items (2nd, 3rd, 4th, 8th, 9th, 11th, 12nd ,19th items) in the test indicate DIF. There are 8/20 (40%) items indicating DIF according to objective methods. Also, when DIF levels of the items indicating DIF are examined, it is determined that total two items (4th item (|ΔMH|= 1,38; ΔR2 = 0.017; |β|= 0.078) and 19th item (|ΔMH|= 1,37; |β|= 0.058) items) indicate DIF at B level and six items (2nd, 3rd, 8th, 9th, 11th and 12th items) at A level.
1.b. Do the Items Indicate DIF with Regard to Gender According to Subjective Method?
For this sub-problem, an opinion is obtained for the existence of DIF by combining 1st, 2nd, 3rd and 4th evaluations in the expert opinion form, and in the 0 numbered evaluation the opinion is evaluated as DIF does not exist. One facet crossed item x rater random design (i x r) is used within the scope of Generalizability theory regarding to fitness of the opinions of the experts’ about the existence of DIF. In this context, the calculated G coefficient is obtained as 0.81. G coefficient is interpreted as Cronbach’s alpha used often in CTT [38; 41] and with this obtained result, it is determined that the experts has made compatible and consistent scoring with each other.
In Table 6, the frequency (n) and percentage (%) distribution of the probable DIF evaluations depending on 23 experts’ opinion for each item is seen.
In subjective method, when the percentage of the expert opinions is taken into consideration, the classification level with the 51% and above participation rate is taken as a base for the decision process of the related item. According to subjective method, it is seen that the majority gives the opinion that seven items (3rd, 4th , 5th , 6th , 9th , 11th , 12th ) indicate DIF. There are items that indicate DIF are approximately 7/20 (% 35). Also, when the opinions of the experts that there is negligible (A level) and moderate or high (B or C level) level of DIF in the items stated as indicating DIF in Table 6 are examined, it is seen that the majority of the experts state five items (3rd, 5th, 6th, 11th and 12th items) may indicate low level of DIF, and 2 items (4th (n=8 experts) and 9th (n=10 experts) items) may indicate moderate or high level of DIF.
3.2. Sub-Problem 2: What is the Compliance Rate between the Objective and Subjective Methods in the Decision Concerning DIF?
The classification of the items in terms of indicating DIF according to at least two objective methods (MH, LR and Sıbtest) and subjective method are presented in Table 7.
Table 6. Distribution of Experts’ Opinions With Regard to Existence of DIF
Item No DIF exists (n-%)
DIF does not exist (n-%) Item No DIF exists
(n-%) DIF does not exist
(n-%) Item 1 8 (%39) 15 (%61) Item 11 16 (%70) 7(%30)
Item 2 7(%30) 16 (%70) Item 12 13(%57) 10(%43)
Item 3 20(%87) 3 (%13) Item 13 7(%30) 16 (%70)
Item 4 13(%57) 9(%43) Item 14 11(%48) 12(%52)
Item 5 13(%57) 10(%43) Item 15 8(%35) 15(%65)
Item 6 12(%52) 10(%48) Item 16 11(%48) 12(%52)
Item 7 9 (%39) 14 (%61) Item 17 11(%48) 12(%52)
Item 8 4 (%17) 19 (%83) Item 18 11(%48) 12(%52)
Item 9 14 (%61) 9 (%39) Item 19 6 (%26) 17 (%74)
Item 10 3(%13) 19(%87) Item 20 2(%9) 21(%91)
1442 Comparison of Objective and Subjective Methods on Determination of Differential Item Functioning
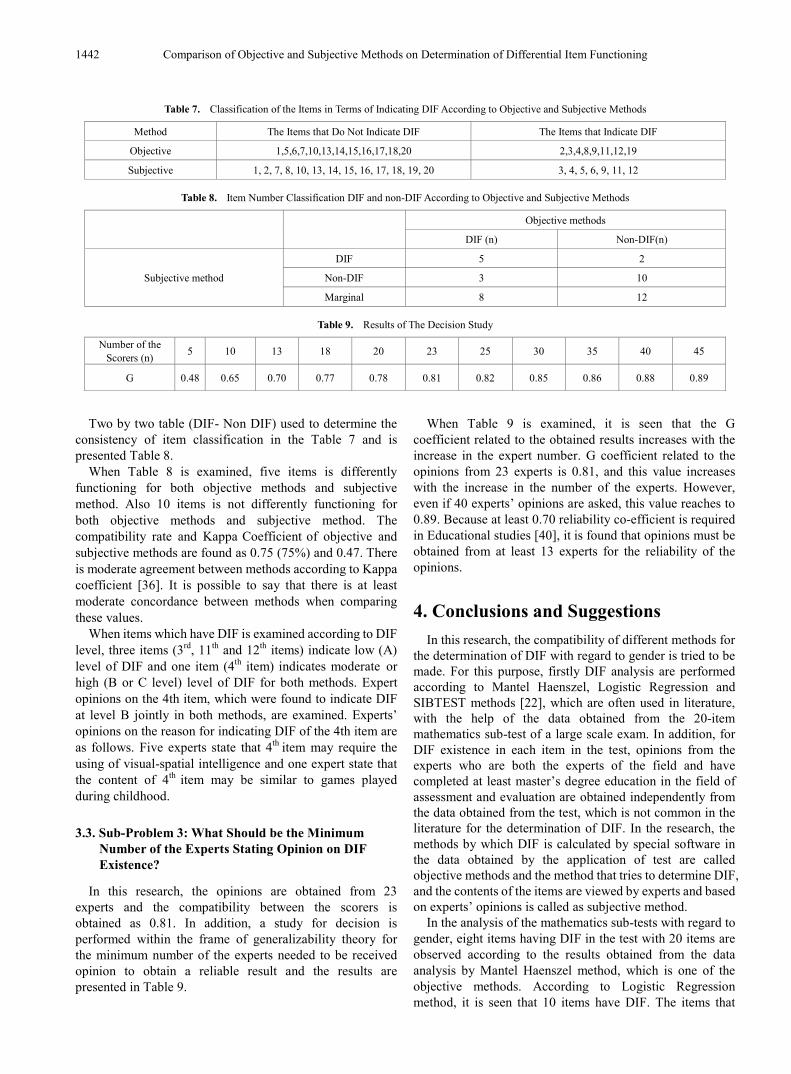
Table 7. Classification of the Items in Terms of Indicating DIF According to Objective and Subjective Methods
Method The Items that Do Not Indicate DIF The Items that Indicate DIF
Objective 1,5,6,7,10,13,14,15,16,17,18,20 2,3,4,8,9,11,12,19
Subjective 1, 2, 7, 8, 10, 13, 14, 15, 16, 17, 18, 19, 20 3, 4, 5, 6, 9, 11, 12
Table 8. Item Number Classification DIF and non-DIF According to Objective and Subjective Methods
Objective methods
DIF (n) Non-DIF(n)
Subjective method
DIF 5 2
Non-DIF 3 10
Marginal 8 12
Table 9. Results of The Decision Study
Number of the Scorers (n) 5 10 13 18 20 23 25 30 35 40 45
G 0.48 0.65 0.70 0.77 0.78 0.81 0.82 0.85 0.86 0.88 0.89
Two by two table (DIF- Non DIF) used to determine the consistency of item classification in the Table 7 and is presented Table 8.
When Table 8 is examined, five items is differently functioning for both objective methods and subjective method. Also 10 items is not differently functioning for both objective methods and subjective method. The compatibility rate and Kappa Coefficient of objective and subjective methods are found as 0.75 (75%) and 0.47. There is moderate agreement between methods according to Kappa coefficient [36]. It is possible to say that there is at least moderate concordance between methods when comparing these values.
When items which have DIF is examined according to DIF level, three items (3rd, 11th and 12th items) indicate low (A) level of DIF and one item (4th item) indicates moderate or high (B or C level) level of DIF for both methods. Expert opinions on the 4th item, which were found to indicate DIF at level B jointly in both methods, are examined. Experts’ opinions on the reason for indicating DIF of the 4th item are as follows. Five experts state that 4th item may require the using of visual-spatial intelligence and one expert state that the content of 4th item may be similar to games played during childhood.
3.3. Sub-Problem 3: What Should be the Minimum Number of the Experts Stating Opinion on DIF Existence?
In this research, the opinions are obtained from 23 experts and the compatibility between the scorers is obtained as 0.81. In addition, a study for decision is performed within the frame of generalizability theory for the minimum number of the experts needed to be received opinion to obtain a reliable result and the results are presented in Table 9.
When Table 9 is examined, it is seen that the G coefficient related to the obtained results increases with the increase in the expert number. G coefficient related to the opinions from 23 experts is 0.81, and this value increases with the increase in the number of the experts. However, even if 40 experts’ opinions are asked, this value reaches to 0.89. Because at least 0.70 reliability co-efficient is required in Educational studies [40], it is found that opinions must be obtained from at least 13 experts for the reliability of the opinions.
4. Conclusions and Suggestions In this research, the compatibility of different methods for
the determination of DIF with regard to gender is tried to be made. For this purpose, firstly DIF analysis are performed according to Mantel Haenszel, Logistic Regression and SIBTEST methods [22], which are often used in literature, with the help of the data obtained from the 20-item mathematics sub-test of a large scale exam. In addition, for DIF existence in each item in the test, opinions from the experts who are both the experts of the field and have completed at least master’s degree education in the field of assessment and evaluation are obtained independently from the data obtained from the test, which is not common in the literature for the determination of DIF. In the research, the methods by which DIF is calculated by special software in the data obtained by the application of test are called objective methods and the method that tries to determine DIF, and the contents of the items are viewed by experts and based on experts’ opinions is called as subjective method.
In the analysis of the mathematics sub-tests with regard to gender, eight items having DIF in the test with 20 items are observed according to the results obtained from the data analysis by Mantel Haenszel method, which is one of the objective methods. According to Logistic Regression method, it is seen that 10 items have DIF. The items that
Universal Journal of Educational Research 5(9): 1435-1446, 2017 1443
show DIF according to MH and LR methods show similarity to each other and seven of them are common. A high compatibility is obtained when comparing LR method with MH method with regard to determined items. While these results show similarities with the studies of Bekçi [6], Doğan and Öğretmen [14], Demir [13] and Yıldırım [56] they do not show consistency with the studies of Gierl, Khalig and Boughton [22], Yurdugül [59], Gök, Kelecioğlu and Doğan [24]. In this study the item indicating less DIF in MH method when compared with LR method is determined [22, 31, 55, 50]. It is found that MH method gives more precise results than LR method in the literature [14, 5, 24, 11]
When the results obtained from mathematics sub-test according to SIBTEST methods are examined, DIF is observed in seven items. While these seven items are common when the results obtained from SIBTEST method compared with the results obtained from MH method, six items are common when it compared with LR method. Compatibility rates and kappa coefficient between the objective methods used in the research for decision making on DIF existence. The highest concordance is found between MH and SIBTEST methods as 90% (κ=0.79). This condition results from that there are more common items that show DIF obtained by both methods. The lowest concordance (75%; κ=0.50) is found between LR and SIBTEST.
When the literature is viewed, a high agreement is obtained between SIBTEST and MH methods in the researches of Zheng, Gierl, and Cui [60] and Fidalgo, Ferrerez and Muniz [20] as it is in this research. However, more items that show DIF are determined by SIBTEST in comparison with MH method as being different from those researches. Gierl, Jodain, and Ackerman [21] made simulation studies for all three methods and stated that SIBTEST is more powerful than the other two methods. Narayanan and Swaminathan [38] obtained a little bit greater 1st type error rate in MH method comparing to SIBTEST method in their studies they compared MH and SIBTEST methods. And Atalay Kabasakal et.al [3] has indicated in their studies that the probability of indicating a DIF in items that do not have DIF is lower on SIBTEST method rather than MH and LR methods. For this reason, the situation of that the number of items that have DIF obtained with SIBTEST method is lower than number of items obtained with other methods can be explained. The reason of gathering the lowest compatibility between SIBTEST and LR can be explained with that the methods have different 1st type error rate.
When the literature is reviewed, there are limited researches that take expert opinions (subjective method) about the items regarding to existence of DIF that depends on gender independent on statistical DIF process. According to Hambleton [26] getting the experts’ opinions independent of the statistical process are an important step to ensure the reliability and validity of the tests in DIF studies. In this research, important results are obtained about determining DIF on the genders with expert reviews before applying test
to increase the validity and reliability. Expert opinions’ concordance with objective methods most frequently used in the literature are examined. For this aim the compatibility rates and Cohen’s Kappa coefficient between subjective method and objective method are calculated. Compatibility rate and Kappa coefficient are found 0.75 and 0.47 respectively. It is possible to say that there is at least moderate concordance between methods when comparing these values. It is an important result of the research that the 0.47 and over concordance was obtained between subjective and objective methods. Similar to the results of this study, there are also studies in which moderate agreement is obtained [27, 56]. There are studies which have different result from this study in the literature state that subjective and objective methods have low agreement to DIF determination [41,17,26]). In addition, when DIF levels are taken into consideration, one of the two items determined as indicating DIF at medium or high level (B or C level) based on objective methods are determined by also subjective method. It is an important result to determine the half of the items, which is medium or high level of DIF and can adversely affect the validity of the tests, by the subjective method.
As another considerable output, a decision study is made in generalizability theory for the determination of the relation between the number of experts that give opinion on subjective method and reliability. In this study, it is found that 0.70 reliability value is obtained with 13 experts. In this research, the opinions are taken especially from the experts who are both experts on the field and have at least master’s degree in assessment and evaluation. The decision to reach at least 13 experts with similar features can be suggested to the researchers who will conduct similar researches because of the low cost and the ability of being able to obtain reliable results.
Especially in the cases that pre-test cannot be made, the items having the probability of indicating DIF can be determined by the subjective method, and in the second stage the expert opinions related to these items’ biasness, the reasons if they are bias or what group they can be advantageous for can be determined. The correction suggestions about the related items can be received. In this way, the measures can be taken to increase the validity of the test by possible corrections and changes before the final application.
Comparison of DIF determination techniques with each other regarding to gender is the subject of this research. Different independent variables such as school type, economic condition, etc. can be used in other researches. In addition, DIF determination methods most frequently used in the literature are used. Different DIF determination methods (converted item difficulty, field indexes approaches, χ2 of Lord, etc.) can be used. In this research, the data obtained from mathematics sub-test is used. Different sub-tests and the results obtained from different numbers of questions can also be compared.
1444 Comparison of Objective and Subjective Methods on Determination of Differential Item Functioning
REFERENCES [1] Agresti, A. (1984). Analysis of ordinal categorical data.
Newyork: John Wiley &Sons.
[2] Arıkan Akın, Ç. (2015). Değişen madde fonksiyonu belirlemede MTK-olabilirlik oranı, ordinal lojistik regresyon ve poly-SIBTEST yöntemlerinin karşılaştırılması. [Comparison of Likelihood Ratio Test (LRT), Poly-Sıbtest and Logistic Regression in differential item functioning (DIF) detection procedure]. e-International Journal of Educational Research. 6(1), 1-16.
[3] Atalay, K., Gök, B., Kelecioğlu, H., & Arsan, N. (2012). Değişen madde fonksiyonunun belirlenmesinde kullanılan farklı yöntemlerin karşılaştırılması. Bir simülasyon çalışması. [Comparing different differential item functioning methods: A simulation study]. Hacettepe University Journal of Education, 42: 270-281
[4] Bakan Kalaycıoğlu, D., & Kelecioğlu, H. (2011). Öğrenci seçme sınavı’nın madde yanlılığı açısından incelenmesi.[Item bias analysis of the university entrance examination] Education and Science, 36, 3-13.
[5] Bakan Kalaycıoğlu, D., & Berberoğlu, G. (2010). Differantial item functioning analysis of the science and mathematics items in the university entrance examinations in Turkey. Journal of Psychoeducational Assessment, 20, 1-12.
[6] Bekçi, B. (2007). Orta öğretim kurumları öğrenci seçme ve yerleştirme sınavının değişen madde fonksiyonlarının cinsiyete ve okul türüne göre incelenmesi.[Examining differential item functions of the elemantary school student selection and placement examination according to gender and school type] Unpublished master’s dissertation, Hacettepe University, Ankara.
[7] Büyüköztürk, Ş., Kılıç Çakmak. E., Akgün, E. Ö., Karadeniz, Ş., & Demirel, F. (2013). Bilimsel araştırma yöntemleri.[Scientific research methods] Ankara: Pegem Academy.
[8] Camilli, G., & Shepard, L. A. (1994). Methods for identifying biased test items. Hollywood: Sage Publications.
[9] Clauser, B. E., & Mazor, K. M. (1998). Using statistical procedures to identify differential item functioning test items. Educational Measurement Issues and Practice. 17, 31-44.
[10] Cohen, J. (1960). A coefficient of agreement for nominal scales. Educational and Psychological Measurement. 20;37
[11] Çepni, Z. (2011). Değişen madde fonksiyonlarının SIBTEST, mantel haenszel, lojistik regresyon ve madde tepki kuramı yöntemleriyle incelenmesi. [Differential item functioning analysis using SIBTEST, Mantel Haenszel, logistic regression and item response theory methods] Unpublished doctoral dissertation, Hacettepe University, Ankara.
[12] Çokluk, Ö., Şekercioğlu, G., & Büyüköztürk, Ş. (2010). Sosyal bilimler için çok değişkenli istatistik: SPSS ve LISREL uygulamaları. Ankara: Pegem Academy.
[13] Demir, S., & Köse, İ.A. (2014). Mantel haenszel, SIBTEST ve lojistik regresyon yöntemleri ile değişen madde fonksiyonu
analizi.[ An Analysis of the differential item function through Mantel-Haenszel, SIBTEST and Logistic regression methods]. International Journal of Human Sciences. 11(1), 700-714.
[14] Doğan, N., & Öğretmen, T. (2008). Değişen madde fonksiyonunu belirlemede mantel haenszel, ki-kare ve lojistik regresyon tekniklerinin karşılaştırılması. [The comparison of Mantel-Haenszel, Chi-Square and Logistic regression techniques for identifying differential item functioning] Education and Science, 33(148), 100-112.
[15] Doğan, N., Yurtçu, M., & Yavuz, S. (2015) Expert’s Prediction powers at differential item functioning levels of math and Turkish test items. Paper presented ICEFIC 2015, 13-15 May
[16] Doğan, N., Hambleton, R.,K., Yavuz, S., & Yurtçu, M. (2015). Fen ve sosyal bilgiler alanında uzman ve istatistiksel tekniklerle kestirilen değişen madde fonksiyonlarının karşılaştırılması. [Comparing Judgmental Predictions and Statistical Estimations for Differential Item Functioning] Paper presented 8. World Conference on Educational Science
[17] Dorans, N. J., & Holland, P. W. (1993). Dif detection and description: Mantel haenszel and standardization. (In Holland, P. W. and Wainer, H. (eds.), 35-66. New Jersey: USA.
[18] Engelhard, G., Jr., Hansche, L., & Rutledge, K. E.(1990).Accuracy of bias review judges in identifying differential item functioning. Applied Measurement in Education, 3, 347-360.
[19] Ercikan, K. (2002). Disentangling sources of differential item functioning in multilanguage assessments, International Journal of Testing, 2:3-4, 199-215
[20] Fidalgo, A.M., Ferreres, D., & Muniz, J, (2004). Liberal and conservative differantial item functioning detection using mantel- haenszel procedure. Applied Measurement in Education. 6(4), 269-279.
[21] Gierl, M. J., Jodain, M., & Ackerman, T. (2000). Performance of mantel-haenszel, simultaneous item bias test and logistic regresssion when the proportion of dif items large. Paper presented at the Annual Meeting of the American Educational Research Association, New Orleans, Louisiana, USA.
[22] Gierl, M., Khaliq, S. N., & Boughton. K. (1999). Gender differential item functioning in mathematics and science: Prevalence and policy implications. Paper presented at the Annual Meeting of the Canadian Society for the Study of Education, Canada.
[23] Gierl, M,J., Rogers, W.T. ve Klinger, D. (1999). Using statistical and judgmental reviews to identify and interpret translation DIF. Paper presented at the Annual Meeting of the National Council on Measurement in Education, Montreal, Quebec, Canada.
[24] Gök, B., Kelecioğlu, H., & Doğan, N. (2010). Değişen madde fonksiyonunu belirlemede mantel haenszel ve lojistik regresyon tekniklerinin karşılaştırılması. [The Comparison of Mantel-Haenszel and Logistic regression techniques in determining the differential item functioning ] Eğitim ve Bilim, 35(156), 3-16.
[25] Haladyna, M.T. (2004). Developing and validating multiple choice test items. London: Lawrence Erlbaum.
[26] Hambleton, R. K. (2006). Good practices for identifying differential item functioning. Medical Care. 44 (11). Measurement in a Multi-Ethnic Society. pp: 182-188
Universal Journal of Educational Research 5(9): 1435-1446, 2017 1445
[27] Hambleton , R.K., Clause, B. E., Mazor, K.M., & Jones, R.W. (1993). Advances in the detection of differentially functioning test items. Laboratory of Psychometric and Evaluative Research Report No:237. Amherst, MA.
[28] Hambleton , R.K., & Jones, R.W. (1992). Comparison of emprical and judgmental methods for detecting differential item functioning. Paper presented at the Annual Meeting of the National Council on Measurement in Education, San Francisco, USA.
[29] Hambleton, R. K., & Swaminathan, H. (1985). Item response theory: principles and applications. Boston: Kluwer-Nijhoff Publishing.
[30] Hambleton, R. K., Swaminathan, H., & Rogers, H. J. (1991). Fundamentals of item response theory. London: Sage Publication.
[31] Hidalgo, M. D., & Lopez-Pina, J. A. (2004). Differential item functioning detection and effect size: Comparison between logistic regression and mantel-haenszel procedures. Educational and Psychological Measurement, 64(6), 903-915.
[32] Holland, P.W., & Thayer, D.T. (1986) Differential item performance and the mantel haenszel procedure (Technical Report No: 86-69). Princeton, N.J: Educational Testing Service.
[33] Jöroskop, K., & Sörbom, D. (1996). Lisrel 8: Structural equation modelling with the SIMPLIS command language. Chicago, IL: Scientific Software International Inc.
[34] Kan, A., Sünbül, Ö., & Ömür, S. (2013). 6.-8. Sınıf seviye belirleme sınavları alt testlerinin çeşitli yöntemlere göre değişen madde fonksiyonlarının incelenmesi. [Investigating differential item functioning in 6-8 grade level determination examination subtest with various methods] Mersin University Journal of the Faculty Education, 9(2), 207-222.
[35] Kelecioğlu, H., Karabay, B., & Karabay, E. (2014). Seviye belirleme sınavı’nın madde yanlılığı açısından incelenmesi. [Investigating of placement test in terms of item biasness] Elementary Education Online, 13(3), 934-953.
[36] Landis, J. R., & Koch, G. G. (1977). The measurement of observer agreement for categorical data. biometrics, 159-174.
[37] Lord, F. M. (1980). Applications of item response theory to practical testing problems. Hillsdale, New Jersy: Lawrence Erlbaum.
[38] Narayanan, P., & Swaminathan, H. (1994). Performance of the mantel-haenszel and simultaneous item bias procedures for detecting differential item functioning. Applied Psychological Measurement,18(4), 315-328.
[39] Neuendorf, K. A. (2002). The content analysis guidebook. Sage Publications.
[40] Nunnally, J. C. (1978). Psychometric theory (2nd ed.). New York: McGraw-Hill.
[41] Osterlind, S., & Everson.H. (2009). Differential item functioning. Londra: Sage Publications.
[42] Plake, B. S. (1980). A comparison of a statistical and subjective procedure to ascertain item validity: One step in the test validation process. Educational and Psychological Measurement 40, 397-404.
[43] Potenza, T. M., & Dorans, J. N. (1995). Dif assessment for polytomously scored items: A framework for classification and evaluation. Applied Psychological Measurement, 19(1), 23-37.
[44] Raju, N. S., Drasgow, F., & Slinde, J. A. (1993). “An empirical comparison of the area methods, Lord's chi-square test, and the mantel-haenszel technique for assessing differential item functioning.” Educational and Psychological Measurement. 53, pp.301-314
[45] Ross, S. J., & Okabe, J. (2006). “The subjective and objective interface of bias detection on language tests.” International Journal of Testing. 6(3), 229-253.
[46] Roussos, L., & Stout, W. (1996). A multidimensionality-based Dif analysis paradigm. Applied Psychological Measurement. 20, 355-371.
[47] Schumacker R. E., & Lomax, R. G. (2004) .A beginner’s guide to structural equation modelling. New York: Taylor & Francis Group
[48] Stout, W. (2005). SIBTEST software. Institute for measurement assessment system corporations.
[49] Sudweeks, R. R., Reeve, S., & Bradshaw, W. S. (2005). A comparison of generalizability theory and many facet measurement in an analysis of college sophomore writing. Assessing Writing, 9, 239-261.
[50] Şenferah, S. (2015). 2010 Seviye belirleme matematik alt testi için değişen madde fonksiyonlarının ve madde yanlılığının incelenmesi. [An Investigation of differential item functioning and item bias for the mathematics subtest of level determination test in 2010]. Unpublished master’s dissertation, Gazi University, Ankara.
[51] Şimşek Ö. F. (2007). Yapısal eşitlik modellemesine giriş, temel ilkeler ve lisrel uygulamaları. Ankara: Ekinoks.
[52] Taşdelen, G., Kelecioğlu, H., & Güler, N. (2010). Nedelsky ve Angoff standart belirleme yöntemleri ile elde edilen kesme puanlarının genellenebilirlik kuramı ile karşılaştırılması.[A comparison of Angoff and Nedelsky cutting score procedures using generalizability theory] Journal of measurement and Evaluation in Education and Psychology, 1(1), 22-28.
[53] Turgut, M. F. (1992). Eğitimde Ölçme ve Değerlendirme. Ankara: Saydam
[54] Waller, N.G. (1998). EZDIF: Detection of uniform and nonuniform differantial item functioning with mantel haenszel and logistic regresyon procedures. Applied Psychological Measurement, 22. 391.
[55] Wiberg, M. (2009). Differantial item functioning in mastery tests: A comparison of three methods using real data. International Journal of Testing, 9(1), 41-59.
[56] Yıldırım, H. (2015). 2012 Seviye belirleme sınavı matematik alt testinin madde yanlılığı açısından incelenmesi. [An Investigation of item bias of mathematics subtest in 2012 year level determination exam]Unpublished master’s dissertation, Gazi University, Ankara.
[57] Yıldırım, H., & Berberoğlu, G. (2009). Judgmental and statistical DIF analyses of the PISA-2003 mathematics literacy items. International Journal of Testing, 9 (2): 108-121.
1446 Comparison of Objective and Subjective Methods on Determination of Differential Item Functioning
[58] Yıldırım, S. (2008). Farklı işleyen maddelerin belirlenmesinde sınırlandırılmış faktör çözümlenmesinin olabilirlik-oranı ve mantel-haenszel yöntemleriyle karşılaştırılması.[Comparison if restricted-factor analysis with likelihood-ratio and Mantel-Haenszel methods in DIF analyses].Hacettepe University Journal of Education, 34: 297-307.
[59] Yurdugül, H. (2003). Ortaöğretim kurumları seçme ve yerleştirme sınavının madde yanlılığı açısından incelenmesi. [The investigation of the student selection and placement examination for secondary education in terms of item bias]. Unpublished doctoral dissertation, Hacettepe University.
[60] Zheng, Y., Gierl, M. J., & Cui, Y. (2007). Using real data to compare dif detection and effect size masures among mantel-haenszel, SIBTEST and logistic regression procedures.
[61] Zieky, M. (1993). Practical questions in the use of dif statistics in test development. In P. Holland & H.Wainer (Eds), differential item functioning (pp.337-347). Hilsdale, NJ: Lawrence Erlbaum.
[62] Zumbo, B. D. (1999). A handbook on the theory and methods of differential item functioning (DIF): Logistic regression modeling as a unitary framework for binary and likert-type (ordinal) item scores. Ottawa, ON: Directorate of Human Resources Research and Evaluation, Department of National Defense.
Top Related