


Languages
Pages
Legal


41
International Journal of Innovation and Economics Development, vol. 3, issue 4, pp. 41-52, October 2017
International Journal of Innovation and Economic Development
ISSN 1849-7020 (Print)
ISSN 1849-7551 (Online)
URL: http://dx.doi.org/10.18775/ijied.1849-7551-7020.2015.34.2004
DOI: 10.18775/ijied.1849-7551-7020.2015.34.2004
Volume 3
Issue 4 October, 2017 Pages 41-52
Comparative Analysis of Competition Power in
High Technology and Low Technology
Intensive Manufactures
1Metin Yildirim, 2Ferda Nakipoğlu Özsoy 3Asst. Prof. Aslı Özpolat, ⁴Dr. Filiz Çayirağasi
1 Asst. Prof, Faculty of Economics & Administrative Sciences/Economics, University of
Necmettin Erbakan, Turkey 2 Asst. Prof, Faculty of Economics & Administrative Sciences/Economics, University of
Gaziantep, Turkey 3,4 Oguzeli Vocational School of Higher Education, University of Gaziantep, Turkey
Abstract: An increase in competition power provides more profitability by affecting the
amount of production and export. By the increase in technology, innovation and R&D
investments in recent ages in the world, high technology industries became even more
important for competitive power. In this study, two analyses covering the data from 1995
to 2015 have been considered. In the first analysis, the competitiveness of the high-tech
and low-tech sectors has been compared by using RCA index for selected countries. In the
second analysis, the relationship between competition power and growth, total factor
productivity and R&D expenditures have been analyzed by using GMM.
Keywords: Competitive power, High technology-intensive manufactures, Low technology-
intensive manufactures, RCA, GMM, Total factor productivity, Research and development
expenditure
1. Introduction
There are two sources of economic growth: the first is the increase in the stock of production
factors, and the other is the technological development. Although production factors such as
labour and capital are increasing, technology is also advancing rapidly. Data for industrial
production are categorised into four levels of technological development: high technology and
low technology. Two technology groups are identified at the bottom of R&D intensity of
economic activities such as R&D expenditure on value added (Jaegers et.al, 2013).
High technology includes the most advanced technology available and the latest technology.
High-tech products not only new but also previously unconsidered products—offer
technological solutions to customers’ problems (Atmer and Thagesson, 2005:31). High-tech
commodities are extremely diverse regarding their qualities and usability. Grouped by
technological complexity at varying degrees, high-tech commodity companies need to utilise
other basic skills and key competencies when designing, manufacturing and selling. They also
cater to varied customers according to their purchasing and use conditions. The markets for
high-tech products are the most dynamic emerging markets in the world, and their growth is
mainly based on the development of information and technology (Wiechoczek, 2016:80-81).
The high-tech category comprises the production of chemicals, general and specific aim
machines, motor devices, computing machines, pharmacological products and electronic
equipment (Liu and Daly, 2011:17).
Metin Yildirim, Ferda Nakipoğlu Özsoy, Aslı Özpolat, Filiz Çayirağasi
Comparative Analysis of Competition Power in High Technology and Low Technology Intensive
Manufactures
42
Low-tech, traditional companies, are at the heart of the established system, which can be
invested in through well-recognized market channels. Low-tech companies incur fewer costs
for R&D, but their fixed costs are higher than those in the high technology sector because
although their product features require a minimum level of technology development, they
require more expensive raw materials compared to those of the high-tech sector (Atmer and
Thagesson, 2005:32). Low technology category contains production of leather and related
products, food, rubber, plastic, wearing apparel, wooden, sheet and sheet product, furniture,
printing and recording, refined petroleum, beverages, tobacco textiles coke and coke (Liu and
Daly, 2011:17).
In the literature, many studies have shown that the biggest increase in real income per capita
in industrialized countries is due to technological improvement. Know-how in technologically
condensed activities is more important for economic growth. It is, therefore, each country
should specialise in exports of high-tech goods.
High-tech exports contain all products with high investigation and development condensed,
like medical products, computing machines, software, scholarly materials, electronic and other
electrical equipment and components (Gani, 2009:31). Expertness in these high-tech goods
is used to catch technology consistency of exports (Srholec, 2005:1). High-tech industries are
major sources of employment growth, profit, and innovation in both products and processes
(Kask and Sieber, 2002:16). Connolly (2003) emphasised the significance of imports in the
transmission of technology. It is notably greater for developing countries than for advanced
countries because third world countries are not very integrated with advanced nations.
Furthermore, high-tech imports from advanced countries have a favourable impact on interior
innovation and imitation. In addition, it has caused an increase in GDP growth by higher quality
monetary fund goods are used in interior production. Gani (2009) has noted that to provide a
strong witness of the favorable impact of high-tech exports on per capita growth in countries
with higher degrees of technological progress.
The advance of the industry sector raises productivity, and the growth of the manufacturing
industry can be possible only through export, which is why Kaldor (1968) considered the
manufacturing industry to be growth’s engine. Kaldor’s Growth Laws are four laws relating to
the causation of economic growth. First, an increase in the growth rate in the manufacturing
sector brings about an increase in the growth rate in GDP. Second, the increased growth rate
in manufacturing output causes an increase in the growth rate in labour productivity in the
manufacturing sector, which causes increasing returns to scale. Third, demand in the
agricultural sector determines the growth of manufacturing output in the early steps of
development and exports in the later steps. Fourth, the increased growth rate in exports and
output causes economic growth in the long term (Blecker, 2009, pp. 4–5).
According to Lucas (1988), countries can be grouped into two categories. The first group of
countries produces high-tech goods, whereas the second group of countries focuses on low-
tech goods. Lucas emphasized that the ratio between the human capital rate and
substitutability rate of high-tech goods is statistically significant and higher than that of low-
tech goods. The effect of the export of high-tech goods on growth will be more significant than
the effect of the export of low-tech goods. Therefore, Lucas claimed that countries should
specialize in exporting high-tech goods.
Chakrabarti (1991) emphasized that technology is a keystone in competitiveness.
Technological development and growth play crucial roles in determining the competitiveness
of the world marketplace. Cuaresma and Wörz (2005) are tested the effect of exports with
distinct technologic context on economic growth for 45 developed and developing countries
over the period 1981 to 1997. According to the result of the study, high-tech exports show
the better performance than domestic sectors because of productivity differential for only

Metin Yildirim, Ferda Nakipoğlu Özsoy, Aslı Özpolat, Filiz Çayirağasi
Comparative Analysis of Competition Power in High Technology and Low Technology Intensive
Manufactures
43
developing countries. The effect of exports has a significant difference on growth based on the
technology consistency. Advantages of high-tech exports exceed the advantages of low-tech
exports.
Cuneo and Mairesse (1984) examined the relationship between productivity and R&D for 182
firms between 1972 and 1977. The result of the study showed that the elasticity of R&D-
performing firms is twice that of other firms. Griliches and Mairesse (1984) supported the
results found by Cuneo and Mairesse. Harhoff’s (1998) and Tsai and Wang’s (2004) studies
showed that the R&D elasticities of high-tech firms differ from those of other firms by analyzing
different countries’ firms within different periods. According to the results of the studies, the
R&D elasticity of the high-tech sector is highest. As regards to the result of Verspagen’s (1995)
study of 15 manufacturing sectors in nine OECD countries, R&D has a positive and important
impact on productivity in high-tech industries. Kafourous (2005) found similar results for UK
manufacturing sectors. An R&D investment has a positive effect on high-tech sectors but no
impact on low-tech sectors.
Because of the reasons above, the dynamic relationship between Competition Power, Total
Factor Productivity, Growth, and Research and Development R&D expenditure has been
analyzed in this study. In this scope, two models were used to compare differences between
low-tech- and high-tech- intensive sectors. The models have been estimated using yearly data
from 1995 to 2015 for 16 selected countries. To compare the differences between and the
impact of the variables, the analysis has been constituted into two stages. At the first stage
of the analysis, the competition power was calculated by us according to the revealed
comparative advantage (RCA) method. At the second stage of the analysis, we used the
generalised method of moments (GMM). In the models, competition powers, which we
calculated according to the RCA method, are the dependent variables. The other variables are
GDP, R&D expenditure, and total factor productivity (TFP).
2. Data and Empirical Analysis The data included in the study cover the 1995–2015 annual series of the selected 15 OECD
(Turkey, India, Korea, Japan, China, Germany, Belgium, Poland, Hungary, France, Austria,
UK, Israel, Finland and Canada) countries. The relationship between high-tech export
competitiveness and low-tech export competitiveness, growth rate, and productivity has been
tested through the GMM. Within this scope, two different models have been created. Whereas
the dependent variable in the first model is the high-technology exports’ competitive power
index, the second model is the low-technology exports’ Competitive Power Index. In both
models, the independent variables have been determined as National Income (GDP in 2005
U.S. dollars), R&D Expenditures, and TFP. We calculated the competition power indices, which
are dependent variables, according to the RCA method. We derived the GDP and R&D from
the World Bank and the TFP, which is used as a productivity indicator, from the Conference
Board Total Economy Database. We used logarithmic variables in the study. Model 1 is
expressed as:
(1)
HRCA: High Technology Competition Power Index
GDP: Gross Domestic Product
TFP: Total Factor Productivity
RD: Research and Development Expenditure
Model 2 is as follows:
(2)
LRCA: Low Technology Competition Power Index
GDP: Gross Domestic Product
TFP: Total Factor Productivity
RD: Research and Development Expenditure

Metin Yildirim, Ferda Nakipoğlu Özsoy, Aslı Özpolat, Filiz Çayirağasi
Comparative Analysis of Competition Power in High Technology and Low Technology Intensive
Manufactures
44
We used two steps to analyse the relationship between competition power, growth rate, R&D
expenditure, and TFP. For the first step, we calculated the RCA index according to Bela-
Balassa. With this index, during the second step of the analysis, the relationship between the
competition powers of high-technology- and low-technology-intensive sectors and GDP, TFP,
and R&D was analysed using the generalised method of moments.
2.1 RCA Analysis
The RCA approach was developed and used by Balassa (1965). In this approach, countries are
examined to determine the relative export performance of certain products. Developed by
Balassa, this index is formulated as follows:
RCAij= (Xij/Xit)/(Xwj/Xwt) (3)
Where Xij determines the exports goods j of country i, Xit is total exports of country i, Xwj is
goods j exports of other countries, and Xwt determines the total exports of other countries. If
the value of the index is more than one, it means that the country has a superiority in the
field; if it is small, it means that the country lacks competitiveness in the production of that
good. However, if the value of the index is less than one, the country has less competitiveness
in the production of that product than others in the field. An index value of more than one
means that the country has the advantage of the area covered, and
RCA < 1 ⇒ the competitiveness of the country in j good has a comparative disadvantage;
RCA > 1 ⇒ competitiveness of the country in j good has comparative advantage;
RCA= 0 ⇒ country does not have j good exports.
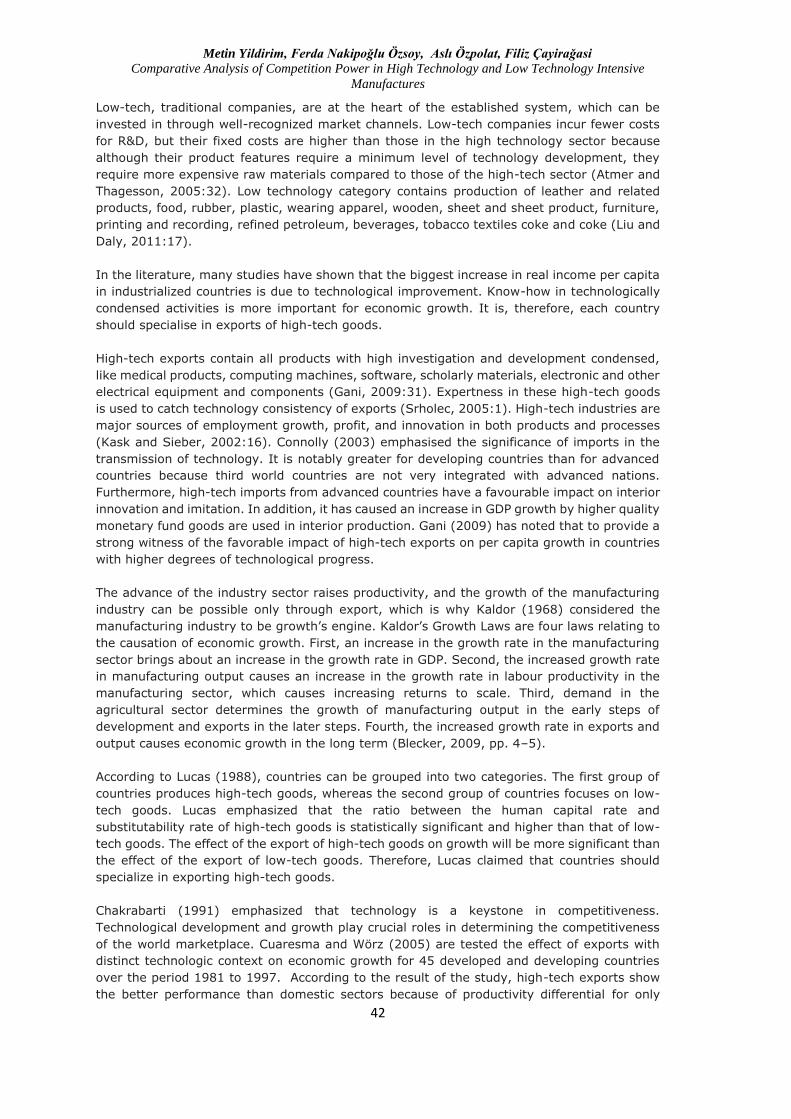
Figure 1 shows the high-tech competition power (HRCA) and low-tech competition power
(LRCA) indices for the countries selected between 1995 and 2015.
Figure 1: Competition Power Index for Selected Countries
0
1
2
3
19
95
19
97
19
99
20
01
20
03
20
05
20
07
20
09
20
11
20
13
20
15
Turkey
HRCA LRACA
0
1
2
19
95
19
97
19
99
20
01
20
03
20
05
20
07
20
09
20
11
20
13
20
15
India
HRCA LRACA
0
2
4
Korea
HRCA LRACA
0
2
Japan
HRCA LRACA
0
2
China
HRCA LRCA
0
2
Germany
HRCA LRCA

Metin Yildirim, Ferda Nakipoğlu Özsoy, Aslı Özpolat, Filiz Çayirağasi
Comparative Analysis of Competition Power in High Technology and Low Technology Intensive
Manufactures
45
The countries that hold the most important advantages in high-tech sectors are Japan, Korea,
China, and Germany. These countries have a comparative advantage over other countries in
both high- and low-technology sectors. Although Turkey and India, which are developing
countries, concentrate on low technology, Korea seems to have a significant advantage against
Turkey and India in both sectors. Although the export power of Japan declined over time in
both areas, the powers of China, Germany, India, and Korea increased relative to all the
countries evaluated. In Turkey, the competition power of high technology increased at a low
rate over the period, whereas the competitiveness of the country's low-technology exports has
increased, except the last two years. According to this result, Korea and Japan have more
competition power in high-tech sectors than Turkey and India do. Among the countries, Turkey
has the least competition power. Turkey's RCA index was 0.22 in 1995; in 2015, its RCA index
was 0.38. Therefore, Turkey has no comparative advantage in the high-tech sector. However,
in Germany and Japan, the RCA indexes were as follows, respectively: in 1995, 0.935 and
1.36 and 2015, 0.955 and 0.932. Even though each country's RCA index decreased in 2015,
some countries still had comparative advantages against the other countries.
Table 1 also shows the results of the competition index of the other selected countries
included in the analysis. Poland, Austria, and Finland have competitive advantages in low-
technology-intensive sectors, whereas Israel and the United Kingdom have high
competitiveness in high-technology-intensive sectors; Belgium, France, and Hungary have
significant advantages in both sectors. As the level of human capital and technology of the
firms has increased, the firms' competitiveness powers have also increased. The Israeli
economy is based on the production of high-tech equipment, agriculture, industry, diamond
processing, and tourism; Israel is a major player in the high-tech industry. For this reason,
Israel's high-tech industry is a major growth engine. The United Kingdom is considered high
tech in relation to other countries. The heart of the high-tech zone, known as "Silicon Fen,"
is in the United Kingdom, which is why the United Kingdom has an important advantage in
high-tech sectors.
Table 1: Result of RCA Index for Countries
Poland
Year Lrca Hrca
1995 2.250844448 0.403374808
1996 2.330123237 0.434572109
1997 1.862278607 0.467317777
1998 2.200165914 0.425432452
1999 2.194431963 0.382292041
2000 2.251564624 0.416603447
2001 2.489939035 0.410535259
2002 2.444693078 0.419876708
2003 2.264793265 0.430107643
2004 2.070259276 0.413076422
2005 1.844000485 0.433577041
2006 1.767419566 0.489146548
2007 1.729177632 0.53667222
2008 1.662185737 0.642722398
2009 1.512219603 0.67626436
2010 1.458598312 0.733965458
2011 1.669798406 0.696803851
2012 1.703397856 0.70792466
2013 1.795145061 0.708326583

Metin Yildirim, Ferda Nakipoğlu Özsoy, Aslı Özpolat, Filiz Çayirağasi
Comparative Analysis of Competition Power in High Technology and Low Technology Intensive
Manufactures
46
2014 1.708670067 0.712417328
2015 1.638105019 0.680439838
Hungary
Year Lrca Hrca
1995 1.021420682 0.642965825
1996 1.137607535 0.565277791
1997 0.801962043 0.864734121
1998 0.749890503 0.888821473
1999 0.760476708 0.940189117
2000 0.757222422 1.077176923
2001 0.757195349 0.997454011
2002 0.70367339 1.045874773
2003 0.676975087 1.128112141
2004 0.67520022 1.261439949
2005 0.658748883 1.206308154
2006 0.656990817 1.185276205
2007 0.616572706 1.172467278
2008 0.620599038 1.2694737
2009 0.542620833 1.317282096
2010 0.57334939 1.341514748
2011 0.634068084 1.315312323
2012 0.683854618 1.178801542
2013 0.756762724 1.105508551
2014 0.736774431 0.974481958
2015 0.696859861 0.867695151
France
Year Lrca Hrca
1995 1.071126925 1.047172472
1996 1.111028652 1.124724217
1997 1.065445759 1.074780195
1998 1.031658316 1.057673483
1999 1.067304369 1.052098314
2000 1.167190711 1.109935119
2001 1.131749479 1.113137289
2002 1.112366754 1.075378347
2003 1.139888454 1.056295317
2004 1.045147139 1.060815321
2005 1.08837461 1.095909367
2006 1.10405806 1.131578212
2007 1.111521778 1.136880002
2008 1.059632698 1.227132873
2009 1.051136083 1.227794654
2010 1.05523464 1.28138081
2011 0.986209435 1.329856686
2012 1.009075279 1.374841146
2013 1.045198612 1.389279384
2014 0.996141326 1.351849755
2015 1.133366316 1.428608329
Austria

Metin Yildirim, Ferda Nakipoğlu Özsoy, Aslı Özpolat, Filiz Çayirağasi
Comparative Analysis of Competition Power in High Technology and Low Technology Intensive
Manufactures
47
Year Lrca Hrca
1995 1.734643493 0.547156715
1996 1.68873337 0.548737718
1997 1.660657639 0.608019213
1998 1.792896715 0.58896959
1999 1.761062361 0.584214398
2000 1.707435372 0.598993776
2001 1.673206028 0.605648224
2002 1.645760201 0.635449421
2003 1.75727681 0.654677833
2004 1.630562462 0.663133129
2005 1.687766865 0.627404848
2006 1.701254712 0.645004273
2007 1.756770635 0.674418464
2008 1.776987207 0.704286811
2009 1.776045271 0.720239035
2010 1.803764662 0.729091061
2011 1.879978901 0.754687196
2012 1.945980386 0.785139464
2013 2.055410148 0.817002615
2014 2.048318542 0.804251199
2015 1.948489476 0.736182996
UK Year Lrca Hrca 1995 0.860963355 1.396870297 1996 0.865232957 1.38493557 1997 0.860102475 1.334624034 1998 0.791125389 1.336494631 1999 0.787647567 1.302096875 2000 0.743549235 1.179183328 2001 0.743689598 1.247395631 2002 0.723637375 1.251113148 2003 0.772051187 1.180282272 2004 0.796150841 1.125689939 2005 0.80099943 1.201062754 2006 0.739455506 1.380022564 2007 0.834015917 1.085239738 2008 0.777237255 1.098516079 2009 0.736407994 1.024267921 2010 0.702356408 1.092592883 2011 0.640265927 1.02707827 2012 0.671307933 1.067524085 2013 0.662311696 0.898411995 2014 0.734668912 1.09563909 2015 0.651235827 1.121043751 Israel Year Lrca Hrca 1995 0.443223545 1.272787716

Metin Yildirim, Ferda Nakipoğlu Özsoy, Aslı Özpolat, Filiz Çayirağasi
Comparative Analysis of Competition Power in High Technology and Low Technology Intensive
Manufactures
48
1996 0.503480477 1.335449993 1997 0.518557312 1.38531785 1998 0.508697648 1.397415717 1999 0.482125361 1.36626767 2000 0.505981939 1.045594052 2001 0.505665301 1.061192136 2002 0.422561531 0.971485718 2003 0.405471213 1.034012203 2004 0.387042157 1.024854429 2005 0.445736058 0.972472728 2006 0.498893726 1.046834673 2007 0.4258455 0.897668675 2008 0.512520014 1.636094294 2009 0.443768182 1.801373487 2010 0.435758691 1.704484766 2011 0.437007534 1.754540525 2012 0.420618371 1.77294172 2013 0.404577884 1.812899683 2014 0.451043627 1.690696262 2015 0.433963272 1.664566934 Finland Year Lrca Hrca 1995 1.499966725 0.739713642 1996 1.67853967 0.789186482 1997 1.361785299 0.857017905 1998 1.328077543 0.917730236 1999 1.336050363 0.956541742 2000 1.352121547 1.052850612 2001 1.569067863 0.97488358 2002 1.492698158 0.983165189 2003 1.677675306 0.980077993 2004 1.614392404 0.926280214 2005 1.447673873 1.066962892 2006 1.626341395 0.948036861 2007 1.641563984 0.934197433 2008 1.435029339 1.002518604 2009 1.315674648 0.77523809 2010 1.764980578 0.764125999 2011 1.659364284 0.74223262 2012 1.560188283 0.718710448 2013 1.610847885 0.66188151 2014 1.436423004 0.598323853 2015 1.408025577 0.520392364 Canada Year Lrca Hrca 1995 0.566743835 0.5585329 1996 0.624579455 0.561906513 1997 0.619560768 0.552447796

Metin Yildirim, Ferda Nakipoğlu Özsoy, Aslı Özpolat, Filiz Çayirağasi
Comparative Analysis of Competition Power in High Technology and Low Technology Intensive
Manufactures
49
1998 0.663238567 0.543034293 1999 0.656410946 0.51166225 2000 0.614608713 0.574692034 2001 0.586707185 0.534719139 2002 0.626107354 0.49687346 2003 0.572941386 0.504482426 2004 0.551604345 0.504642774 2005 0.548503973 0.526219125 2006 0.55360959 0.548218658 2007 0.526199291 0.594221731 2008 0.525611155 0.599766688 2009 0.503609608 0.630269436 2010 0.510802664 0.574725106 2011 0.472021828 0.591987006 2012 0.514554257 0.560489458 2013 0.500996933 0.550422556 2014 0.494765303 0.530140015 2015 0.521867079 0.556812569 Belgium Year Lrca Hrca 1995 1.051218922 0.792435493 1996 1.018590245 0.812730353 1997 1.040229507 0.835940696 1998 1.038532963 0.842898757 1999 1.055998816 0.880376453 2000 1.121916331 0.908028161 2001 1.041662488 0.948458457 2002 0.976663714 1.080634886 2003 0.976484599 1.125653238 2004 1.026233683 1.12966232 2005 1.0724858 1.175573823 2006 1.118845083 1.166531693 2007 1.156301462 1.227027406 2008 1.138862175 1.270958871 2009 1.007883675 1.3181679 2010 1.01495363 1.304634266 2011 1.057924659 1.297872858 2012 1.016295179 1.303254975 2013 0.991533481 1.279903828 2014 1.018760751 1.250573071 2015 1.009703638 1.213333761
2.2 GMM Analysis
In the second phase of the study, the generated models will be analysed by the GMM. The
OLS estimator and the GLS estimator sometimes produce deviations in estimates of dynamic
panel data sets; for this reason, Arrellano and Bond (1991) developed a more effective
method: the GMM. In this method, dynamic panel data analyses use the past period value of
the dependent variable as the instrumental variable, taking the differences of the variables in
the first order (Baltagi, 2001:130-131).

Metin Yildirim, Ferda Nakipoğlu Özsoy, Aslı Özpolat, Filiz Çayirağasi
Comparative Analysis of Competition Power in High Technology and Low Technology Intensive
Manufactures
50
Arrellano and Bond’s (1991) GMM is either one staged or two staged. In the one-stage model,
the error is not serially correlated and has homoscedastic features. Descriptive variables are
not correlated. The one-stage model is expressed as follows: 1
' ' 1 '
1 1 1
1 ' 1 '
1
( ) ( ( ) ) ( )
( ) ( ( ) ) ( )
N
N
y W W I G W W y
x y W W I G W W y
(4)
If the error term is heteroscedastic, a two-stage GMM estimator is more appropriate than the
one-stage. In the first step of the two-stage estimation, the error terms are assumed to be
homoscedastic to time with independent and explanatory variables. The two-stage GMM is
formulated as follows: 1
' ' ' 1
2 1 1 1( ) ( ( ) ( )N Ny W V W y y W V W y
(5)
This GMM estimator does not require knowledge of the first stage; in other words, its and
distributions. GMM analysis is popular because it does not produce problems of autocorrelation
and heteroscedasticity. The analysis results obtained within the scope of the study are given
in Table 2.
Table 2: Results of Analysis
Variables Model 1 Model 2
TFP 0.00310** 0.00658**
RD 0.0427*** 0.01902
GDP 0.0056*** 0.0044**
J-statistics 12.94046 11.28504
J-statistisc Prob. 0.373383 0.504661
*,**,*** are refer that probability respectively; %10, %5, %1
After obtaining and evaluating the results, we tested the validity of instrumental variables for
all models. According to this testing’s results, J-statistics implies that the instrumental
variables are significant and the null hypothesis is accepted.
According to the results in Model 1, there is a positive and significant relationship between the
competitiveness, productivity, growth rate, and R&D expenditures of the sectors with
advanced technology. Considering the statistically meaningful results, a 1% increase in TFP
increases competitive power by 0.003%. Similarly, a 1% increase in R&D and growth create
a 0.04% increase in competition power.
Considering the statistical results of Model 2, there is a positive and significant relationship
between the competitiveness, growth, and productivity of low-tech-intensive sectors, but
there is no significant relationship between R&D expenditures and competitiveness.
Accordingly, a 1% increase in TFP brings a 0.006% increase in competition power and an
increase of 1% in growth leads to a 0.004% increase in competition power. The level of
significance of the variables in Model 1 shows that the relation between high-tech competition
power, growth, productivity, and R&D expenditure is higher than those of the low-tech sectors.
Additionally, growth, productivity, and R&D expenditures impact high-tech competition power
more significantly than low-tech competition power. The results of our R&D expenditure
analysis are consistent with the results of the studies of Kafourous (2005), Verspagen (1995),
Harhoff (1998), and Tsai and Wang (2004).

Metin Yildirim, Ferda Nakipoğlu Özsoy, Aslı Özpolat, Filiz Çayirağasi
Comparative Analysis of Competition Power in High Technology and Low Technology Intensive
Manufactures
51
3. Conclusion The purpose of this paper is to investigate the relationship between competition power, GDP
Growth Rate, R&D Expenditure and productivity on low-tech and high tech manufacturing in
the OECD countries.
From the analysis, this research concludes findings as below:
1. The data included in the study cover the 1995–2015 annual series of the selected 15 OECD
(Turkey, India, Korea, Japan, China, Germany, Belgium, Poland, Hungary, France, Austria,
UK, Israeli Finland and Canada) countries.
2. The relationship between high-tech export competitiveness and low-tech export
competitiveness, growth rate, and productivity has been tested through the GMM.
3. We calculated the competition power indices, which are dependent variables, according to
the RCA method.
4. According to RCA index data calculated of the low-tech- and high-tech-intensive
competitiveness of the countries, a competitiveness advantage in the low-technology sector is
in Poland, Austria, and Finland, whereas Israel and the United Kingdom have high competitive
advantages among the high-tech-intensive sectors. Also, Belgium, France, and Hungary have
significant advantages in both sectors.
5. In the second phase of the study, we conducted a GMM analysis. Two different models have
been created. Whereas the dependent variable in the first model is the high-technology
exports’ competitive power index, the second model is the low-technology exports’ competitive
power index. In both models, the independent variables have been determined as GDP in 2005
U.S. dollars, R&D expenditures, and TFP.
6. According to the results obtained, the effects of growth, productivity, and R&D expenditures
on a high-tech competition power are positive and significant.
High-tech commodities are various regarding their qualities and usability; high-tech products add great value when compared to other products. These companies, which can be grouped by technological complexity, need to use other basic skills and key competencies when designing, manufacturing and selling their products. High-technology production is directly related to education, research, and innovation; creates positive externality; and increases productivity and human capital quality. Also, their high-tech companies' growth is mainly based on the development of information and technology. Moreover, emphasising these products in the field of exports will also cause countries to have a comparative advantage in the foreign market. Although the relationship between growth, productivity, and low-tech competition power is
positive and meaningful, the relationship between these factors and R&D expenditures is not
significant. Low-tech-intensive sectors are based on established technology. Low-tech
companies incur fewer costs for research and development, but their fixed costs are higher
than those in the high-technology-intensive sectors because product features require the
minimum level of technology development, unlike the high-tech sector.
References
Abdul Ahad Riki, Mahendra Putra Kurnia, Erna Susanti, “Tinjauan Hukum terhadap
Pelaksanaan PerlindunganHukum Terhadap Tenaga Kerja Harian Lepas (Studi pada CV.
Dwijaya Bhakti Rayon Kabupaten Penajam Paser Utara), Jurnal Beraja Niti, ISSN 2337-
4608, volume 3 Nomor 2(2014).
Agusmidah, 2011, Dilematika Hukum Ketenagakerjaan, Tinjauan Politik Hukum, Jakarta:
PT. Sofmedia.
Christina NM Tobing, “Rekonstruksi Perjanjian Kerja Harian Lepas dalam Hukum
Ketenagakerjaan Berbasis Keadilan”, Disertasi, Fakultas Hukum Universitas Islam Sultan
Agung (Unisula), Semarang, 2016 hlm. 2016.

Metin Yildirim, Ferda Nakipoğlu Özsoy, Aslı Özpolat, Filiz Çayirağasi
Comparative Analysis of Competition Power in High Technology and Low Technology Intensive
Manufactures
52
Gerry Silaban dan Salomo Perangin-angin, 2008, Hak dan Atau Kewajiban Tenaga Kerja
dan Pengusaha/Pengurus yang Ditetapkan Dalam Peraturan Perundangan Keselamatan dan
Kesahatan Kerja, Medan: USU Press.
http://hukum.studentjournal.ub.ac.id/index.php/hukum/article/viewFile/504/4/493
http://ojs.unud.ac.id/index.php/kerthasemaya/article/download/21911/14540
Imam soepomo,1974, Hukum Perburuhan Bidang Hubungan Kerja, Cet. II, Djembatan,
Jakarta.
Materi Pelatihan Hakim Pengadilan Hubungan Industrial, Kurikulum untuk Hakim
Pengadilan Hubungan Industrial, Mahkamah Agung RI dan ILO, Mega Mendung-Bogor,
Maret 2013,
Persen Pekerja Sawit Berstatus Buruh Lepas, dalam:
https://www.jurnalasia.com/bisnis/agribisnis/70-persen-pekerja-sawit-berstatus-buruh-
lepas/
Susi Hadiyati dan Adi Cilik Pierewan, http://www.e-jurnal .com /2016/02/strategi-
bertahan-hidup-buruh-harian.html
Schclarek, A. (2004). Debt and economic growth in developing and industrial countries.
Lund University Department of Economics Working Paper, 2005, 34.
Stephen N. 2014, Ghana's debt distress threatens economic livelihoods of itscitizens.
http://www.ghanaweb.com/GhanaHomePage/features/columnist.
Top Related