


Languages
Pages
Legal


COMPANY UPDATEPT ENSEVAL PUTERA MEGATRADING TBK
Ended June 30, 2018 (Unaudited)
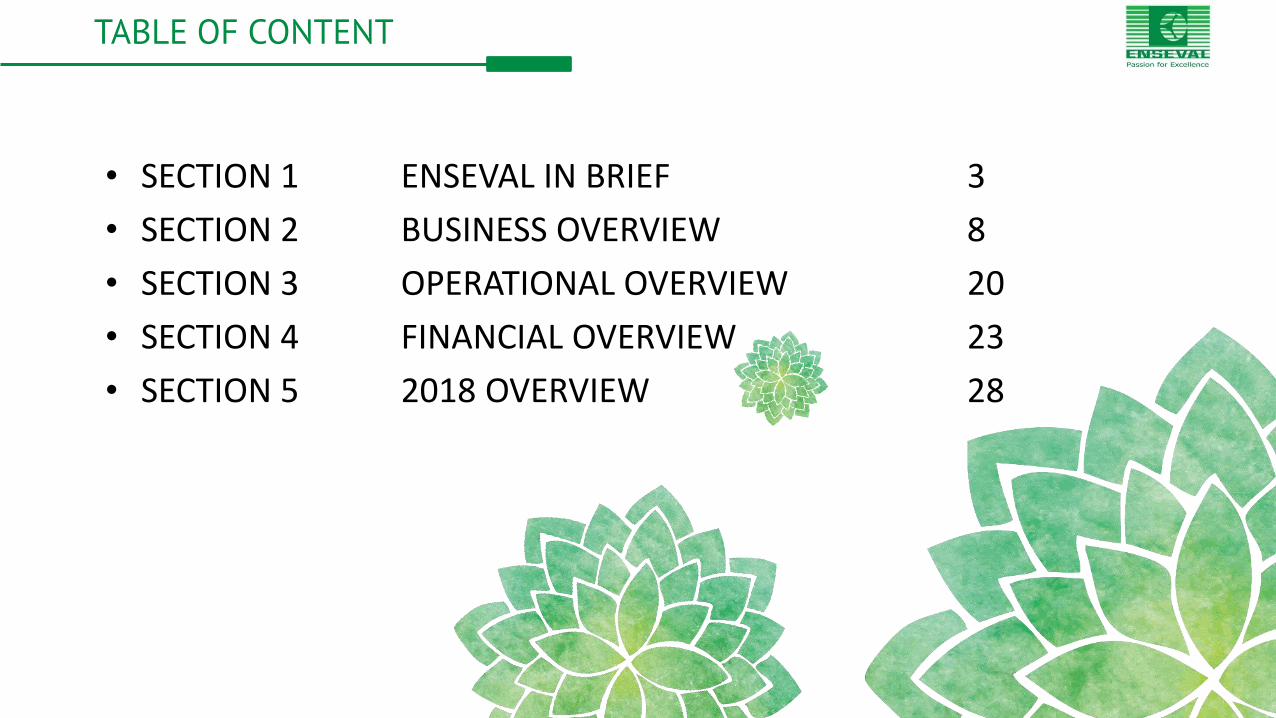
• SECTION 1 ENSEVAL IN BRIEF 3
• SECTION 2 BUSINESS OVERVIEW 8
• SECTION 3 OPERATIONAL OVERVIEW 20
• SECTION 4 FINANCIAL OVERVIEW 23
• SECTION 5 2018 OVERVIEW 28
TABLE OF CONTENT

SECTION 1
ENSEVAL IN BRIEF
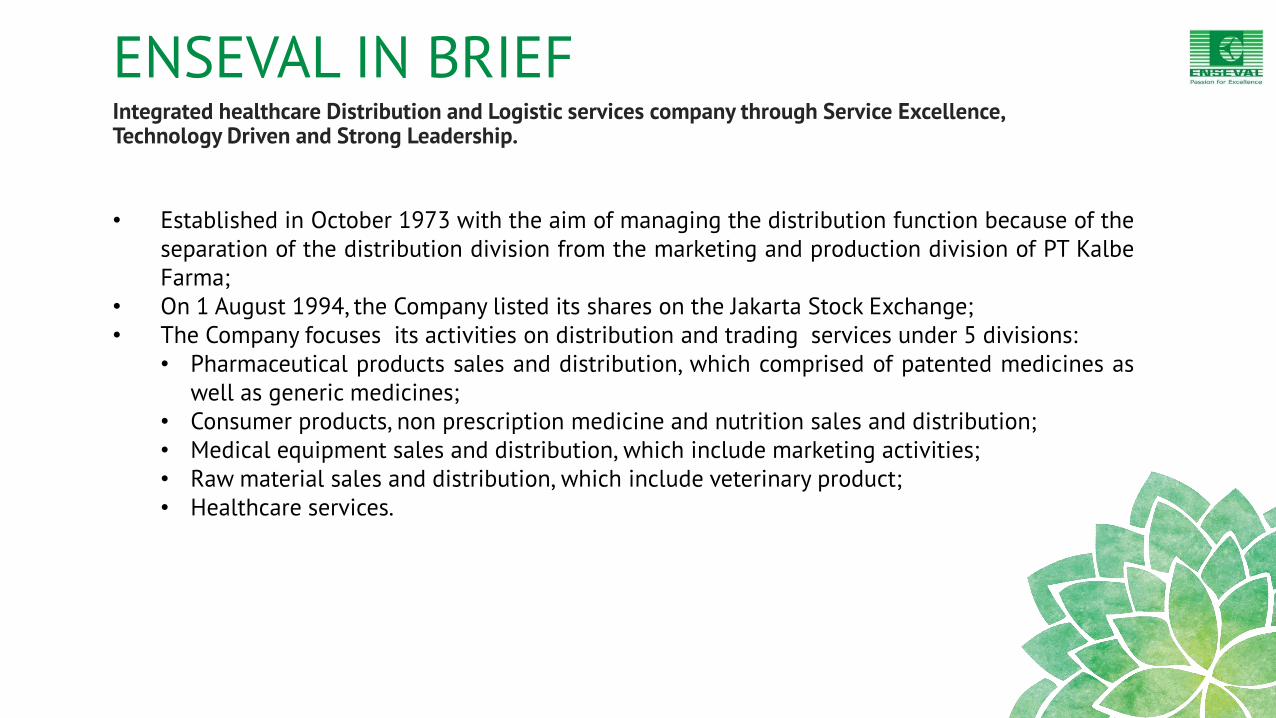
• Established in October 1973 with the aim of managing the distribution function because of theseparation of the distribution division from the marketing and production division of PT KalbeFarma;
• On 1 August 1994, the Company listed its shares on the Jakarta Stock Exchange;• The Company focuses its activities on distribution and trading services under 5 divisions:
• Pharmaceutical products sales and distribution, which comprised of patented medicines aswell as generic medicines;
• Consumer products, non prescription medicine and nutrition sales and distribution;• Medical equipment sales and distribution, which include marketing activities;• Raw material sales and distribution, which include veterinary product;• Healthcare services.
ENSEVAL IN BRIEFIntegrated healthcare Distribution and Logistic services company through Service Excellence, Technology Driven and Strong Leadership.
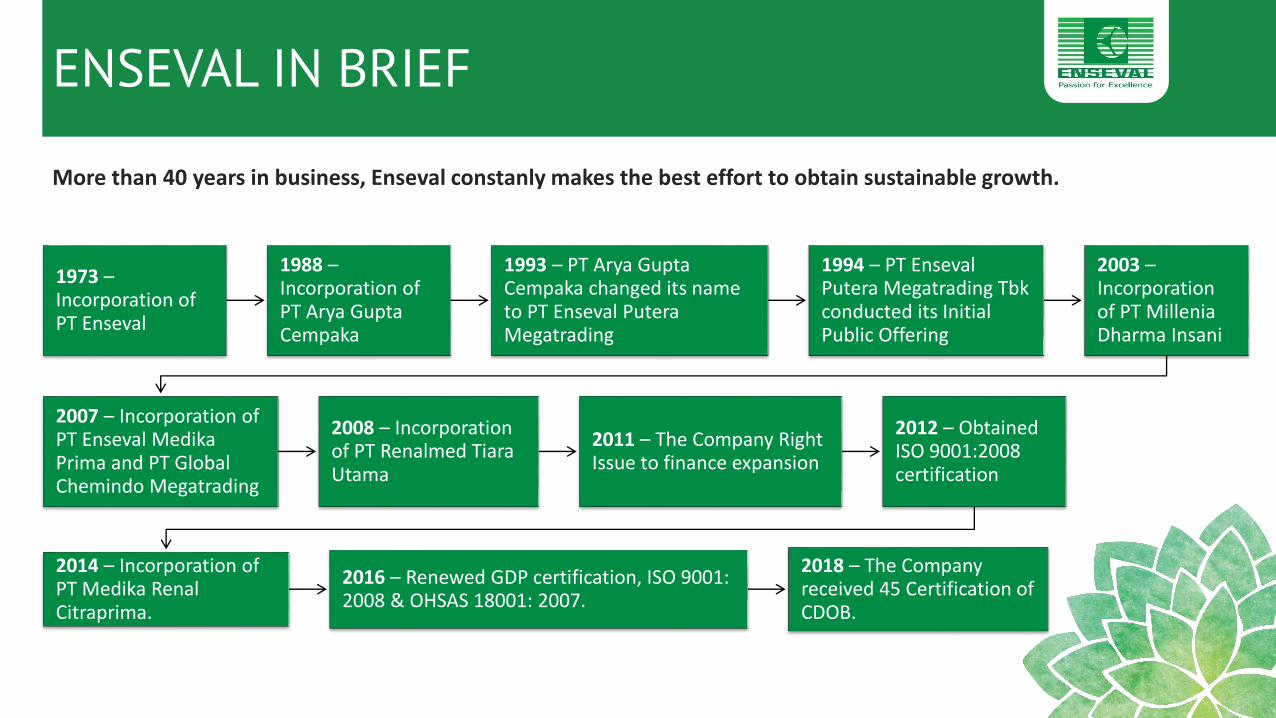
1973 –Incorporation of PT Enseval
1988 –Incorporation of PT Arya Gupta Cempaka
1993 – PT Arya Gupta Cempaka changed its name to PT Enseval PuteraMegatrading
1994 – PT EnsevalPutera Megatrading Tbkconducted its Initial Public Offering
2003 –Incorporation of PT MilleniaDharma Insani
2007 – Incorporation of PT Enseval MedikaPrima and PT Global Chemindo Megatrading
2008 – Incorporation of PT Renalmed Tiara Utama
2011 – The Company Right Issue to finance expansion
2012 – Obtained ISO 9001:2008 certification
2014 – Incorporation of PT Medika Renal Citraprima.
2016 – Renewed GDP certification, ISO 9001: 2008 & OHSAS 18001: 2007.
2018 – The Company received 45 Certification of CDOB.
ENSEVAL IN BRIEF
More than 40 years in business, Enseval constanly makes the best effort to obtain sustainable growth.
ENSEVAL IN BRIEF
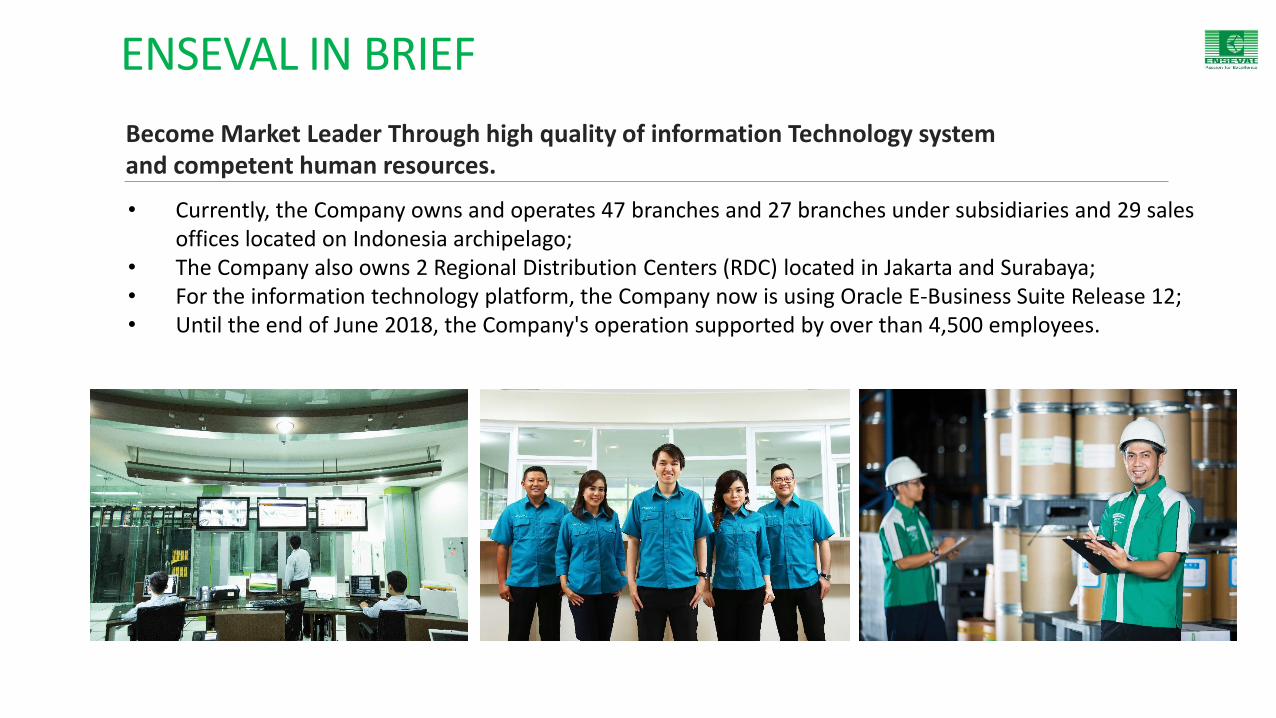
• Currently, the Company owns and operates 47 branches and 27 branches under subsidiaries and 29 salesoffices located on Indonesia archipelago;
• The Company also owns 2 Regional Distribution Centers (RDC) located in Jakarta and Surabaya;• For the information technology platform, the Company now is using Oracle E-Business Suite Release 12;• Until the end of June 2018, the Company's operation supported by over than 4,500 employees.
Become Market Leader Through high quality of information Technology systemand competent human resources.
6

AWARDS UNTIL JUNE 2018
7
2018 OVERVIEW
• INFOBANK - 100 Fastest Growing Company Awards.
• INDONESIAN HUMAN CAPITAL STUDY.
• FRONTIER - The Best Building and Managing Corporate Image.– PHARMACEUTICAL DISTRIBUTOR.
– MEDICAL EQUIPMENT DISTRIBUTOR.
• ORACLE - EXA Trend-Setter Award.
• FROST & SULLIVAN - Indonesia Pharmaceutical Distributor of the year.
• Department of Animal Husbandry in East Java province - the best distributor of veterinary drug.
• HERMINA HOSPITAL GROUP - The Best Pharmaceutical Distributor.
• BETHESDA HOSPITAL YOGYAKARTA - The Best Pharmaceutical Distributor.
• NIVEA - The Best Weighted Distributor.
• Rekor Bisnis Indonesia - Pharmaceutical Distributor with the Most Outlet Coverage.
• The Most Powerful Distribution Performance– EXTRA JOSS
– KOMIX
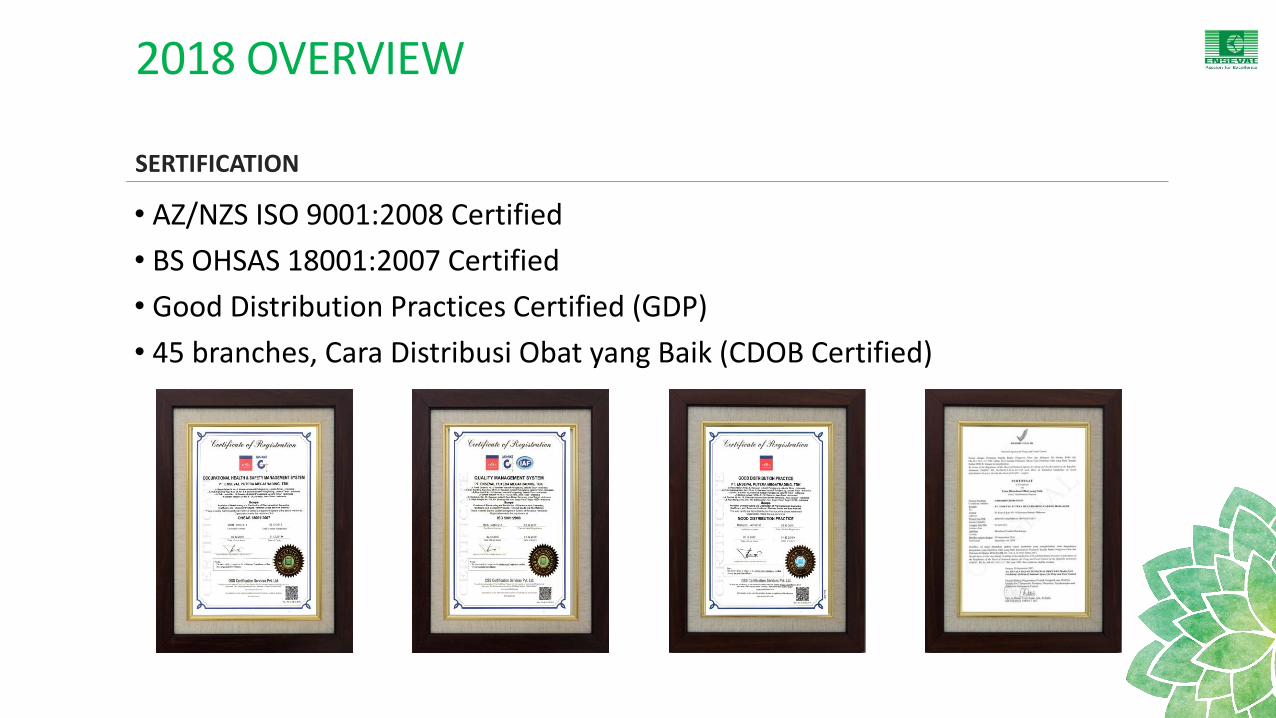
• AZ/NZS ISO 9001:2008 Certified
• BS OHSAS 18001:2007 Certified
• Good Distribution Practices Certified (GDP)
• 45 branches, Cara Distribusi Obat yang Baik (CDOB Certified)
SERTIFICATION
2018 OVERVIEW
8

SECTION 2
BUSINESSOVERVIEW

*Description of net sales per products as describe below :
BUSINESS OVERVIEW
NET SALES PER PRODUCTS UNTIL JUNE 30, 2018
Products Portfolio Net Sales (Rp)Contribution to
Total Net Sales (%)
Consumer Products 4.438.635.237.132 43,98%
Prescription Medicine 2.745.554.757.041 27,20%
Non Prescription Medicine 1.646.953.899.496 16,32%
Raw Materials for Sale 730.747.826.565 7,24%
Medical Equipment 511.789.216.928 5,07%
Veterinary Products 16.044.207.425 0,16%
Health Care Services 2.782.016.270 0,03%
Total : 10.092.507.160.857 100,00%
10

BUSINESS OVERVIEW
DESCRIPTION OF NET SALES PER PRODUCTS AND THE CONTRIBUTION
43,98%27,20%
16,32%
7,24%
5,07% 0,16% 0,03%Consumer Products
Prescription Medicine
Non Prescription Medicine
Raw Materials for Sale
Medical Equipment
Veterinary Products
Health Care Services
Net SalesJune 2018
Rp10.092,51 billion
11

*Growth of net sales per products as describe below :
BUSINESS OVERVIEW
THE COMPANY'S NET SALES CAN STILL GROW WELL
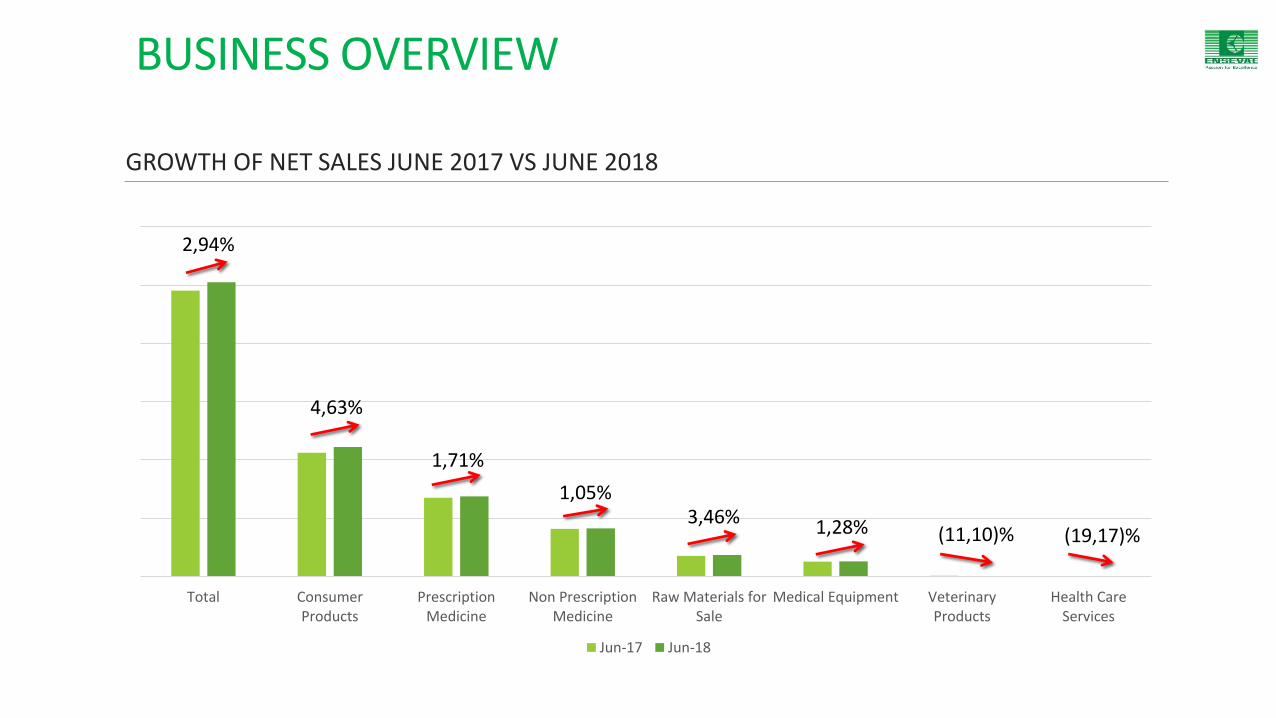
Products Portfolio Net Sales June 2018 (Rp) Net Sales June 2017 (Rp) Growth %
Consumer Products 4.438.635.237.132 4.242.258.622.964 4,63%
Prescription Medicine 2.745.554.757.041 2.699.455.555.877 1,71%
Non Prescription Medicine 1.646.953.899.496 1.629.766.898.649 1,05%
Raw Materials for Sale 730.747.826.565 706.288.183.435 3,46%
Medical Equipment 511.789.216.928 505.340.101.619 1,28%
Veterinary Products 16.044.207.425 17.862.124.165 (10,18)%
Health Care Services 2.782.016.270 3.454.806.713 (19,47)%
Total : 10.092.507.160.857 9.804.426.293.422 2,94%
12
Total ConsumerProducts
PrescriptionMedicine
Non PrescriptionMedicine
Raw Materials forSale
Medical Equipment VeterinaryProducts
Health CareServices
Jun-17 Jun-18
BUSINESS OVERVIEW
GROWTH OF NET SALES JUNE 2017 VS JUNE 2018
2,94%
13
4,63%
1,71%
1,05%3,46% 1,28% (11,10)% (19,17)%

BUSINESS OVERVIEW
THE COMPANY’S PRINCIPALS
14
NON PRESCRIPTION
PRESCRIPTION
CONSUMER | HEALTH | BEAUTY
BUSINESS OVERVIEW
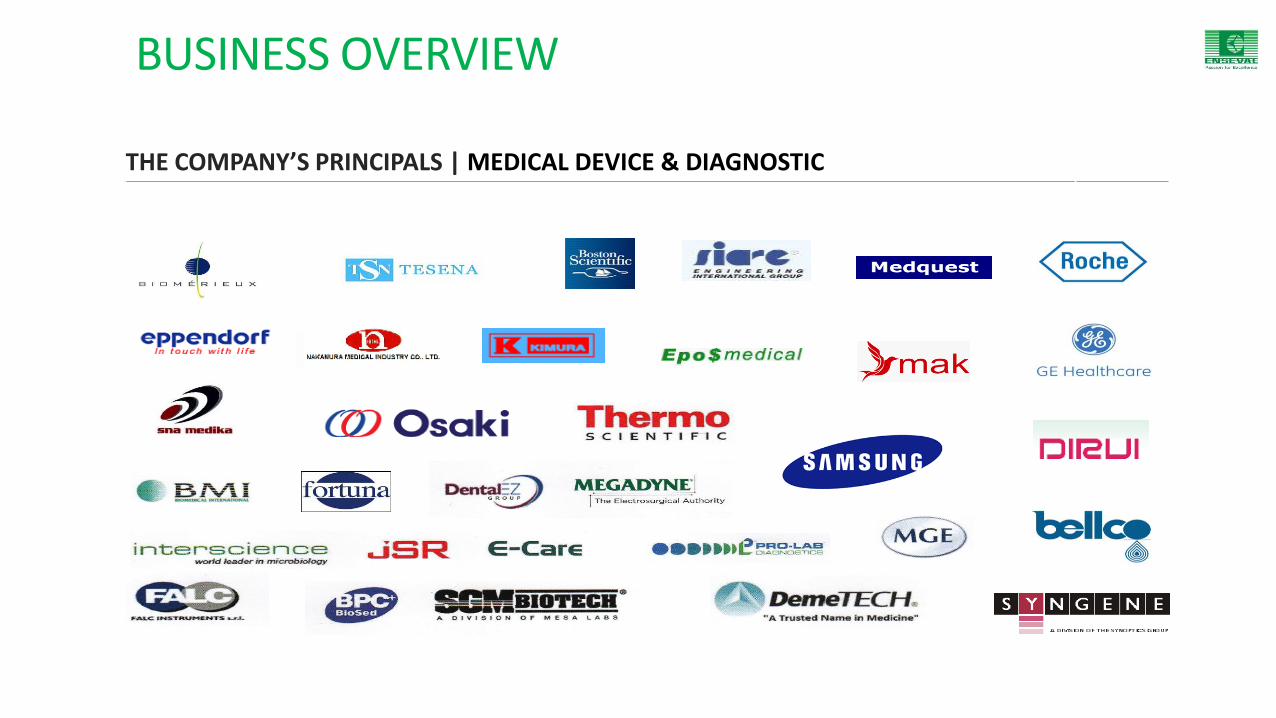
THE COMPANY’S PRINCIPALS | MEDICAL DEVICE & DIAGNOSTIC
15

BUSINESS OVERVIEW
THE COMPANY’S PRINCIPALS | RAW MATERIALS
16
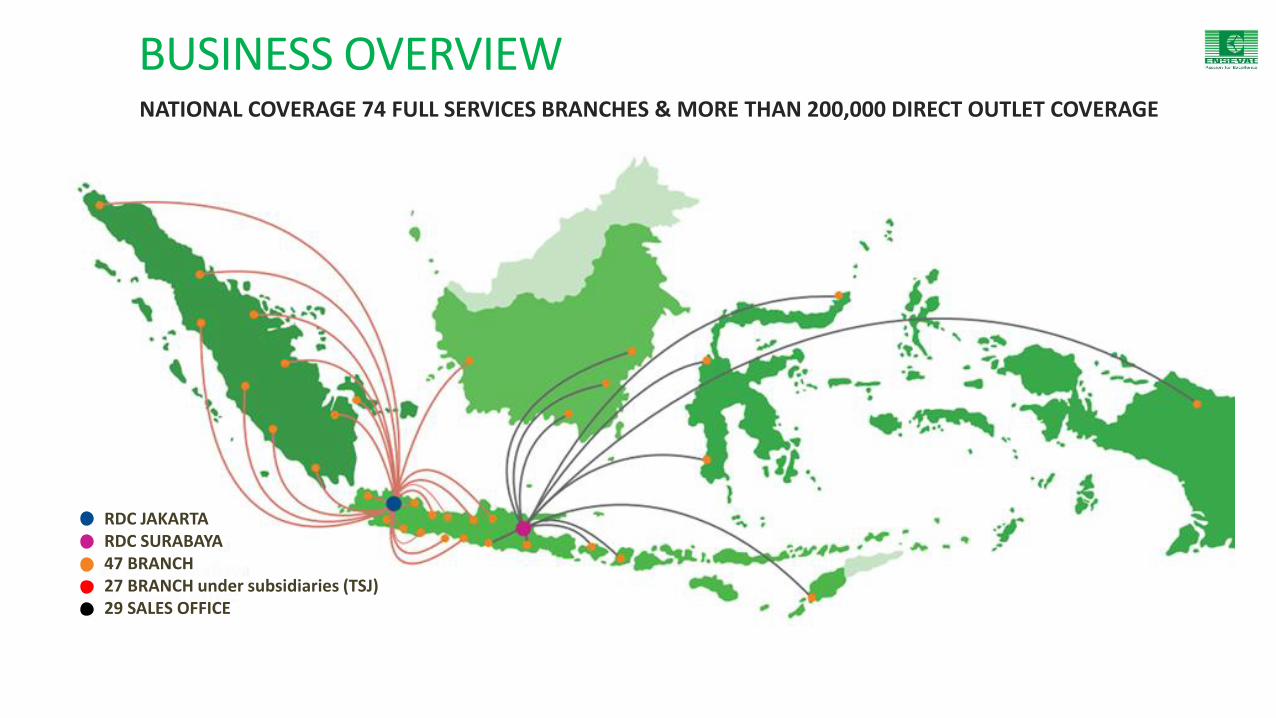
RDC JAKARTARDC SURABAYA47 BRANCH27 BRANCH under subsidiaries (TSJ)29 SALES OFFICE
BUSINESS OVERVIEWNATIONAL COVERAGE 74 FULL SERVICES BRANCHES & MORE THAN 200,000 DIRECT OUTLET COVERAGE
17

Type of outlet coveraged by the company’s distribution Covers all trade channels in the market :
BUSINESS OVERVIEW
MORE THAN 200,000 DIRECT OUTLET COVERAGE
General / Traditional
Trade Channel
• Wholesalers
• Retailers
• Provision Stores
• Convenience Stores
• Food & Beverage
• Store - Fruit Shops
• Cosmetic Stores
• etc
Modern
Trade Channel
• Hypermarkets
• Supermarkets
• Mini Markets
• Departement Stores
• etc
Pharmaceutical
Trade Channel
• Pharmacies
• Drugstores
• Hospitals
• Labs – Clinics
• Institutions
• etc
18

BUSINESS OVERVIEW
THE COMPANY’S MODERN TRADE ACCOUNT
19

BUSINESS OVERVIEW
200,000+ DIRECT OUTLET COVERAGE
Pharmacy; 11.571
Hospital; 1.614
Drugstore; 4.485
Wholesaler; 2.260
Hypermarket, 178
Supermarket; 1.179
Minimarket; 3.115
Provision Store; 162.000
F&B Stores; 15.000
Cosmetics; 1.750
Others; 9.800
Covers all trade channels in the market:
- General / Traditional Trade Channel: Wholesalers, Retailers, Provision Stores, Convenience Stores, Food & Beverage Stores, Fruit Shops, Cosmetics Stores, etc
- Modern Trade Channel: Hypermarkets, Supermarkets, Mini Markets, Department Stores, etc
- Ethical Trade Channel: Pharmacies, Drugstores, Hospitals, Labs - Clinics, Institutions, etc
20

SECTION 3
OPERATIONAL OVERVIEW

OPERATIONAL OVERVIEW
Mobile application (Tablet Computer & PDA)
- Supervisor: Team Performance Analysis.
- Salesman & Deliveryman: Faster Order Taking & Faster Information Process.
Global Information System (GIS)
- Application for more in depth sales and territory mapping.
Supported by Enseval Customer Care (ECC) – HOTLINE 1500095
In Branches Order Management, Complaint Handling, Basic Product Information.
Customers also can reach Enseval office via Phone, Fax & Email for easy customer ordering.
IT INFRASTRUCTURE

OPERATIONAL OVERVIEW
Centralized IT system using Oracle E-Business Solutions• Integrated & Real Time system
Use the best world-class ERP system by Oracle Complete Oracle E-Business SuiteOracle Warehouse Management System (WMS)Advance Supply Chain Planning (ASCP) and Oracle Demantra
Tablet Computer & PDA system E-Mobile ®2,300+ PDA used by Supervisors, Salesmen, Deliverymen, & Collectors Menu: Distribution Plan, Distribution Achievement, Overdue, etc
Provide data security for antivirus by Trend Micro and Sonic Wall
IT INFRASTRUCTURE
OPERATIONAL OVERVIEW
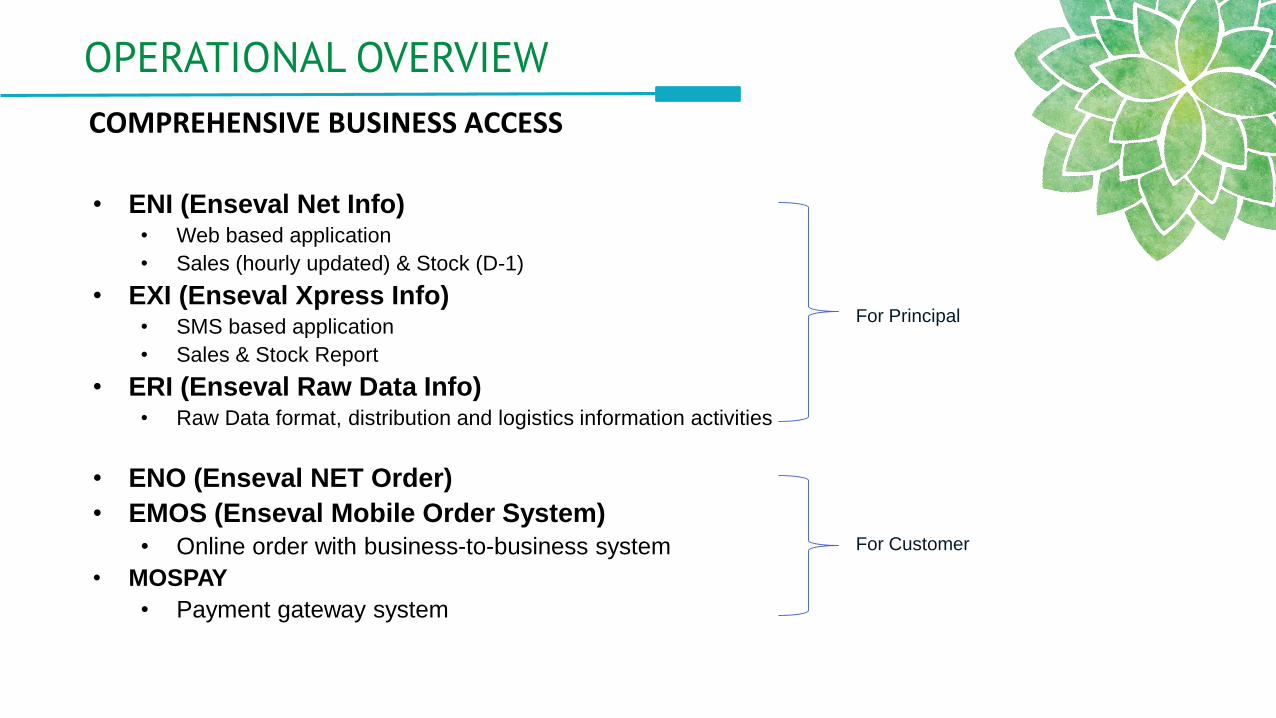
• ENI (Enseval Net Info) • Web based application
• Sales (hourly updated) & Stock (D-1)
• EXI (Enseval Xpress Info)• SMS based application
• Sales & Stock Report
• ERI (Enseval Raw Data Info)• Raw Data format, distribution and logistics information activities
• ENO (Enseval NET Order)
• EMOS (Enseval Mobile Order System)
• Online order with business-to-business system
• MOSPAY
• Payment gateway system
For Principal
For Customer
COMPREHENSIVE BUSINESS ACCESS


SECTION 4
FINANCIAL OVERVIEW
FINANCIAL OVERVIEW
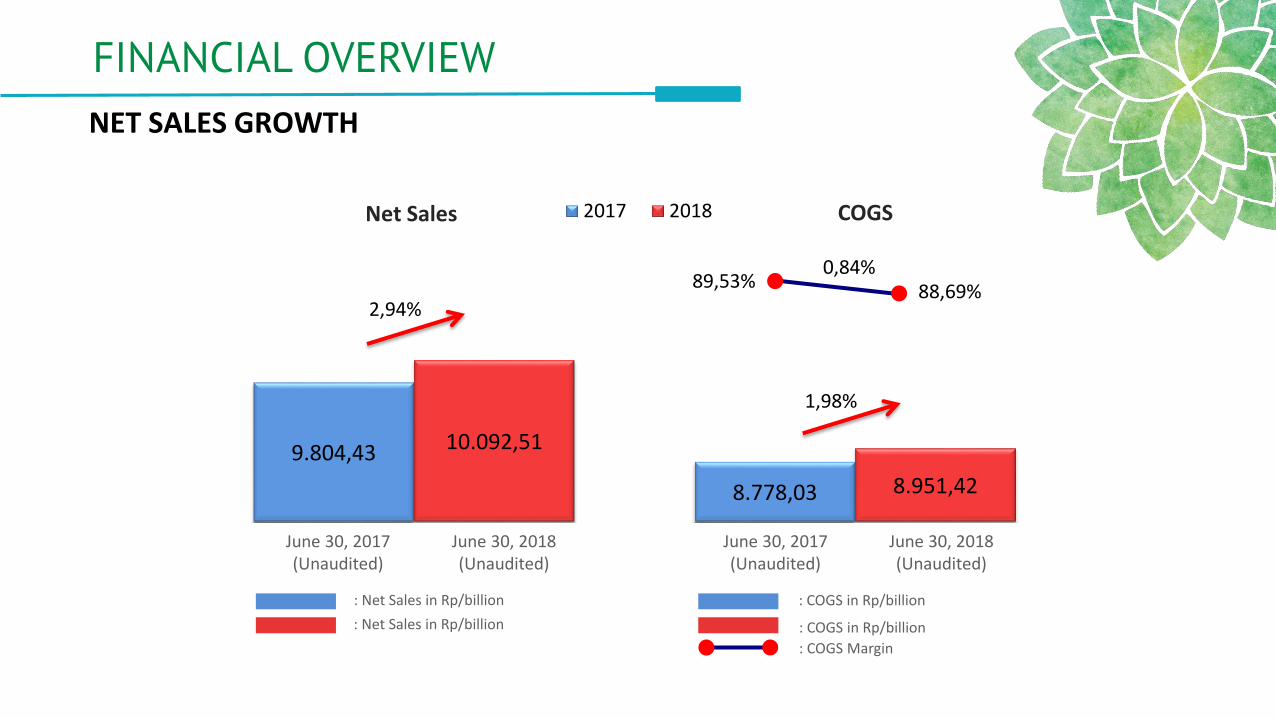
NET SALES GROWTH
9.804,43
8.778,03
10.092,51
8.951,42
2017 2018
89,53% 88,69%0,84%
2,94%
1,98%
: Net Sales in Rp/billion : COGS in Rp/billion
: Net Sales in Rp/billion : COGS in Rp/billion
: COGS Margin
Net Sales COGS
June 30, 2017 (Unaudited)
June 30, 2018 (Unaudited)
June 30, 2017 (Unaudited)
June 30, 2018 (Unaudited)
FINANCIAL OVERVIEW
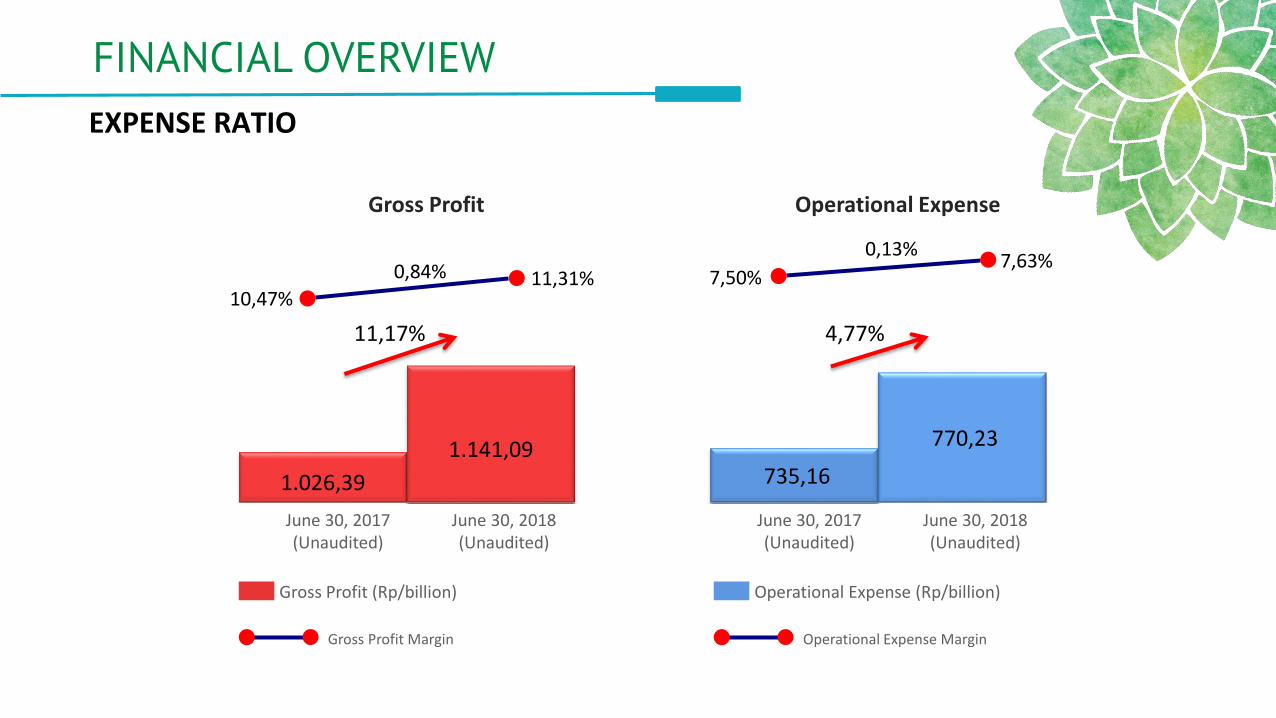
EXPENSE RATIO
1.026,39
1.141,09 735,16
770,23
11,17%
June 30, 2017 (Unaudited)
June 30, 2018 (Unaudited)
Gross Profit
Gross Profit Margin
Gross Profit (Rp/billion)
10,47%11,31%0,84%
4,77%
June 30, 2017 (Unaudited)
June 30, 2018 (Unaudited)
Operational Expense
Operational Expense Margin
Operational Expense (Rp/billion)
7,50%7,63%
0,13%

FINANCIAL OVERVIEW
PROFIT GROWTH (June 2017 VS June 2018)
291,23 322,09 244,13370,85 382,60
284,39
27,34% 18,79%16,49%
Operating Profit Margin Income Before Tax Expense Margin
Income For The Period Margin
June 30, 2017 (Unaudited)
June 30, 2018 (Unaudited)
June 30, 2017 (Unaudited)
June 30, 2018 (Unaudited)
June 30, 2017 (Unaudited)
June 30, 2018 (Unaudited)
2,97%3,67%0,70%
Operating Profit(Rp/billion)
Income Before Tax Expense (Rp/billion)
Operating Profit Income BeforeIncome Tax Expense
Income For The Period
3,29%3,79%0,51%
2,49%2,82%
0,33%

FINANCIAL OVERVIEW
FINANCIAL POSITION (Dec 2017 VS June 2018)
7.425,80
2.295,03
5.130,77
7.405,70
2.003,76
5.401,94
0,27%
12,69%
5,29%
Dec 31, 2017 (Audited)
June 30, 2018 (Unaudited)
Total Assets (Rp/billion) Total Liabilities (Rp/billion)
Dec 31, 2017 (Audited)
June 30, 2018 (Unaudited)
Dec 31, 2017 (Audited)
June 30, 2018 (Unaudited)


WAREHOUSE MANAGEMENT SYSTEM
- Oracle-based WMS
- Manage stock from
inbound-outbound, by location, SKU, Batch Number, Expiry Date.
- Bar-coding system with mobile bar-code reader to eliminate duplication & increase accurate operation.
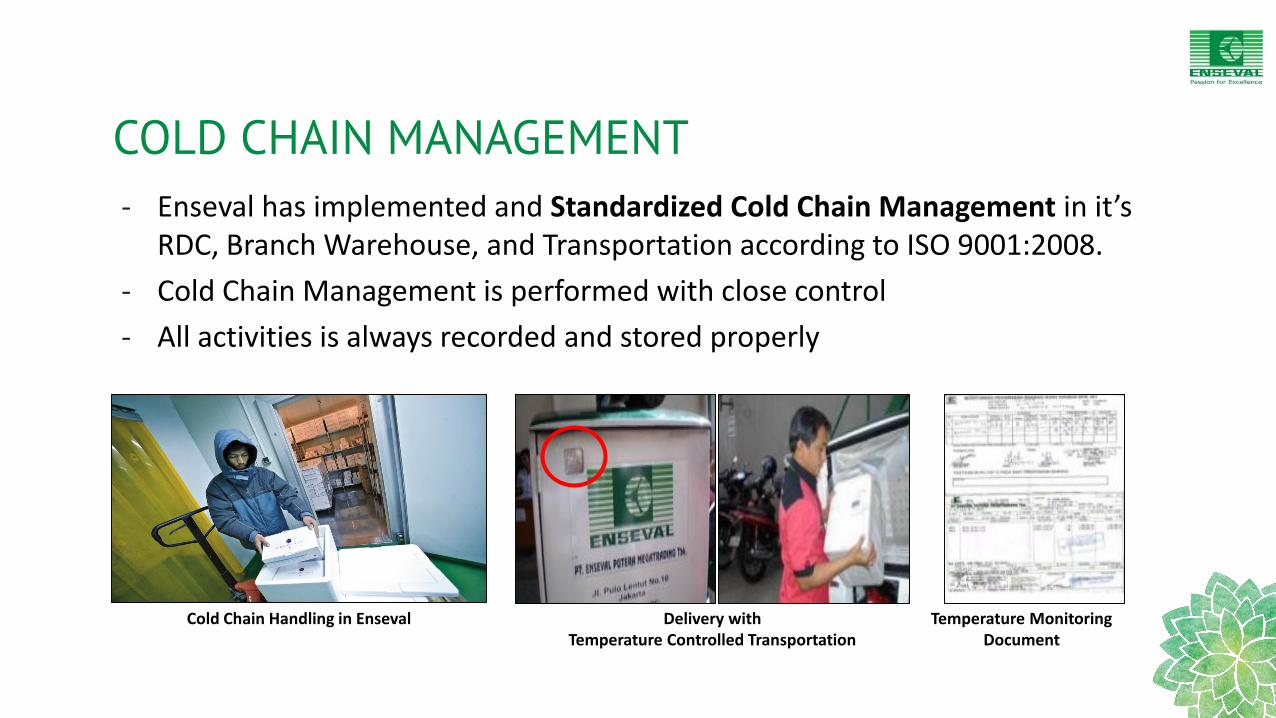
COLD CHAIN MANAGEMENT
- Enseval has implemented and Standardized Cold Chain Management in it’s RDC, Branch Warehouse, and Transportation according to ISO 9001:2008.
- Cold Chain Management is performed with close control
- All activities is always recorded and stored properly
Cold Chain Handling in Enseval Delivery with Temperature Controlled Transportation
Temperature MonitoringDocument
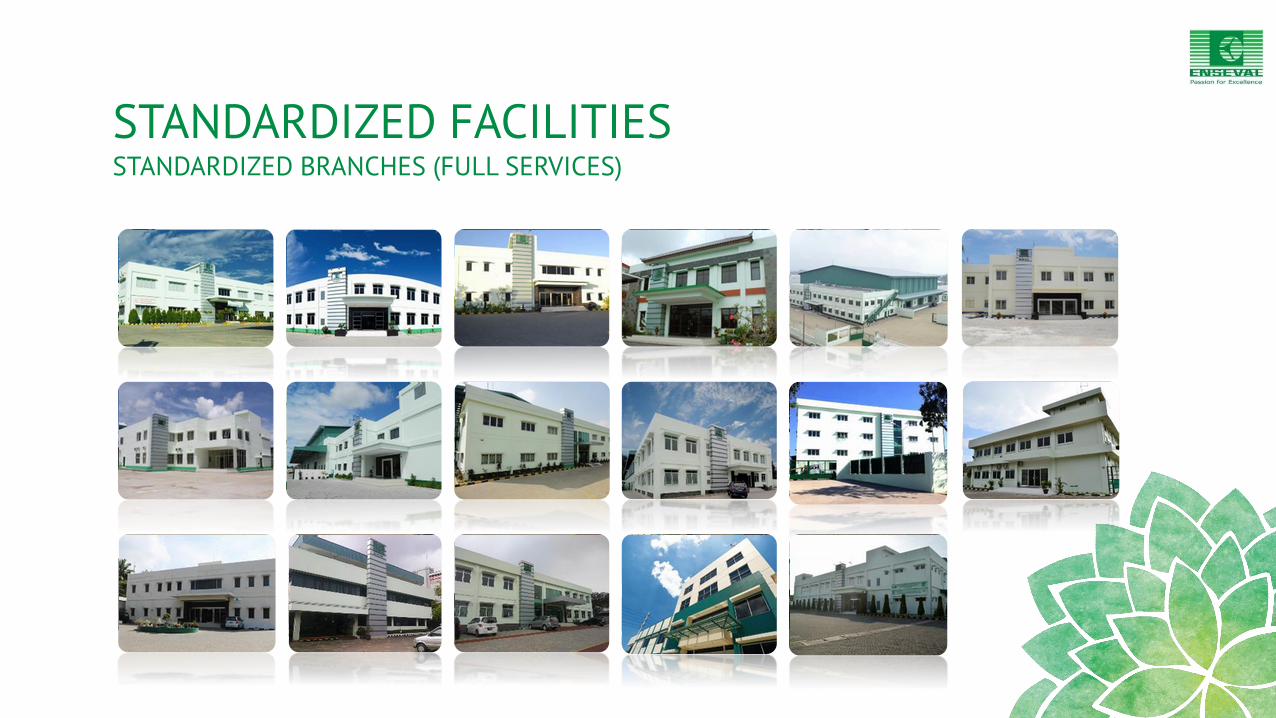
STANDARDIZED FACILITIESSTANDARDIZED BRANCHES (FULL SERVICES)
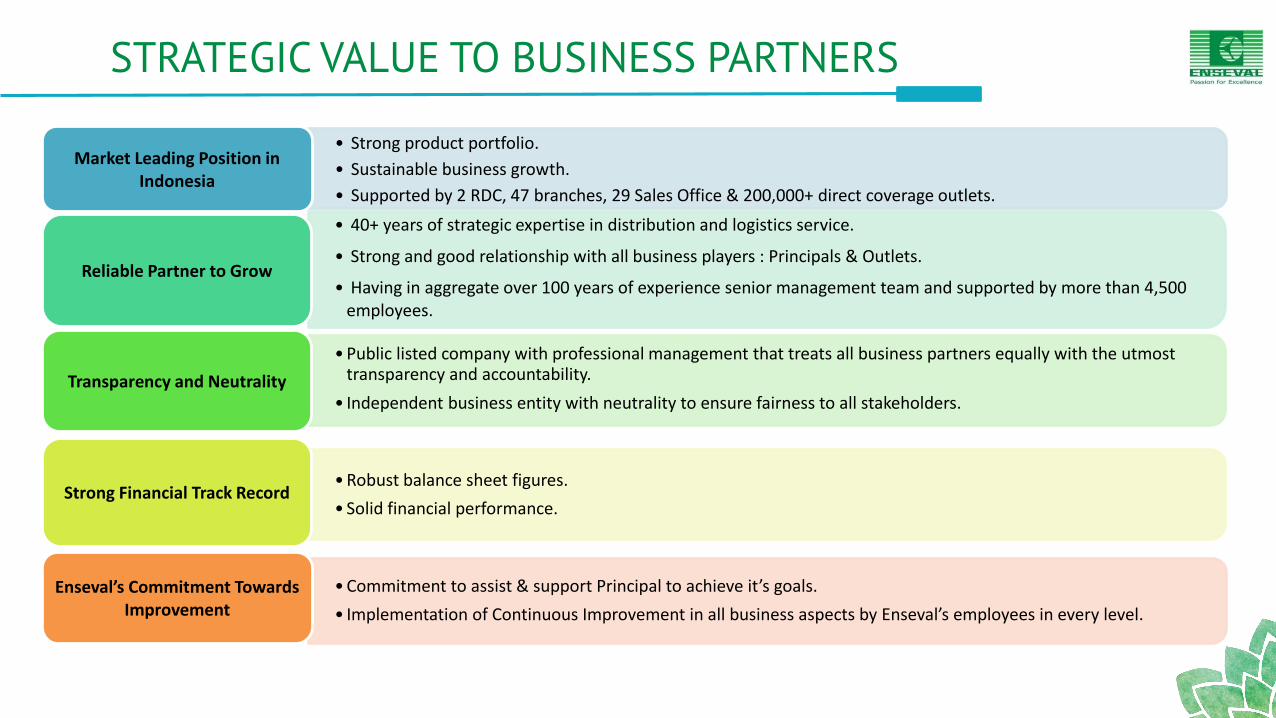
STRATEGIC VALUE TO BUSINESS PARTNERS
• Strong product portfolio.
• Sustainable business growth.
• Supported by 2 RDC, 47 branches, 29 Sales Office & 200,000+ direct coverage outlets.
Market Leading Position in Indonesia
• 40+ years of strategic expertise in distribution and logistics service.
• Strong and good relationship with all business players : Principals & Outlets.
• Having in aggregate over 100 years of experience senior management team and supported by more than 4,500 employees.
Reliable Partner to Grow
• Public listed company with professional management that treats all business partners equally with the utmost transparency and accountability.
• Independent business entity with neutrality to ensure fairness to all stakeholders.Transparency and Neutrality
• Robust balance sheet figures.
• Solid financial performance.Strong Financial Track Record
• Commitment to assist & support Principal to achieve it’s goals.
• Implementation of Continuous Improvement in all business aspects by Enseval’s employees in every level.
Enseval’s Commitment Towards Improvement

THANK YOUFor Further Information:
Corporate SecretaryPT Enseval Putera Megatrading Tbk.Enseval BuildingKawasan Industri PulogadungJalan Pulolentut No. 10Jakarta 13920 – IndonesiaPhone : 62-21-46822422 Fax : 62-21-4609039Website : www.enseval.comEmail : [email protected]

FORWARD LOOKING STATEMENTThis presentation has been prepared for informational purposes only by PT Enseval Putera Megatrading Tbk. ("Enseval" or the "Company")
This presentation has been prepared solely for use in connection with the release 0f 30 June 2018 (unaudited) results of the Company. The information contained in this presentationhas not been independently verified. No representation, warranty or undertaking, express or implied, is made as to, and no reliance should be placed on, the fairness, accuracy,completeness or correctness of the information or the opinions contained herein. None of the Company or any of their respective affiliates, and their respective commissioners,directors and employees, advisors or representative shall have any liability whatsoever (in negligence or otherwise) for any loss however arising from any use of this presentation orits contents or otherwise arising in connection with the presentation. Any decision to purchase or subscribe for securities of the Company should not be made on the basis of theinformation contained in this presentation.
The presentation is not an offer of securities for sale in the United States. Securities may not be offered or sold in the United States absent registration or an exemption fromregistration.
This presentation and its contents are confidential unless they are become generally avaiable as public information in accordance with prevailing laws regulations (other than as aresult of a disclosure by you) and must not be distributed, published or reproduced (in whole or in part) or disclosed by receipents to any other person. This presentation does notconstitute a recommendation regarding the securities of the Company.
This presentation, including the information and opinions contained herein, is provided as the date of this presentation and is subject to change without notice, including change as aresult of the issuance of 30 June 2018 unaudited results of the Company.
This presentation includes "forward-looking statements". These statements contain the words "anticipate", "believe", "intend", "estimate", "expect" and words of similiar meaning.All statements other than statements of historical facts included in this presentation, including, without limitation, those regarding the Company's financial position, business strategy,plans and objectives of management for future operations (including development plans, objectives relating to the Company's products and services and anticipated productlaunches) are forward-looking statements. Such forward-looking statements are based on numerous assumptions regarding the Company's present and future business strategies andthe environment in which of the Company will operate in the future. These forward-looking statements speak only ast the date of this presentation. The Company expressly disclaimsany obligation or reflection of any change in the Company's expectations with regard thereto, or any change in events, conditions or circumtances on which any statements is based.
Market data and certain industry forecast used in this presentation were obtained from market research, publicity avaiable information and industry publications which have not beenindependently verified, and no presentation is made as to the accuracy of such information.
Top Related