


Languages
Pages
Legal


50 Crop Breeding and Applied Biotechnology 11: 50-58, 2011
JAN Menezes Júnior et al.
Crop Breeding and Applied Biotechnology 11: 50-58, 2011
Brazilian Society of Plant Breeding. Printed in Brazil
Received 20 May 2010
Accepted 16 November 2010
Common bean breeding to improve red grain lines
José Ângelo Nogueira de Menezes Júnior1*, José Eustáquio de Souza Carneiro1, Vanessa Maria Pereira e Silva2, Lêlisângela Carvalhoda Silva3, Luiz Alexandre Peternelli4 and Pedro Crescêncio Souza Carneiro2
ABSTRACT - The purpose of this study was to evaluate the performance potential of red bean lines, derived from populations ofthe first cycle of recurrent selection in the common bean breeding program of the Federal University of Viçosa, Minas Gerais. In theF3:5, F3:6 and F3:7 generations, 243 families from 18 segregating populations were evaluated. These families were conducted by thebulk-within-families method and from the best, 154 lines were obtained and evaluated in the dry season of 2006 (F7: 9) and of 2007(F7: 10), Coimbra - MG. The estimates of genetic and phenotypic parameters revealed variability among families. The method bulkwithin F3-derived families proved useful for bean breeding. The most promising lines that may be included in future tests of valuefor cultivation and use (VCU), and will possibly be recommended for planting in the state of Minas Gerais, were derived from thepopulations Vermelhinho/AN9022180//Vermelhinho/Vermelho2157, Vermelhinho//Vermelhinho/ IAPAR81,Vermelhinho/LR720982//Vermelhinho/AB136 and Vermelhinho/AB136//Vermelhinho/ Vermelho2157.
Key words: Phaseolus vulgaris L., recurrent selection, selection within families, red bean.
INTRODUCTION
In Brazil, the common bean types with best marketacceptance are the carioca and black groups. The effortsof the main breeding programs of this legume were thereforefocused on these grain types, with significant gains foryield, disease resistance, plant architecture, earliness andgrain quality (Ramalho et al. 2005a, Melo et al. 2006, Silvaet al. 2007, Botelho et al. 2008, Menezes Júnior et al. 2008,Ragagnin et al. 2009). However, some bean types, althoughnot very significant at a national level, are important incertain regions of the country. This is the case, e.g., forred bean, widely cultivated in the Zona da Mata of MinasGerais.
Since bean breeding programs focus mainly oncarioca and black bean, producers in regions with
preference for other grain types are forced to use localtraditional varieties, which are generally uncompetitive,compared with the improved cultivars. In the case of redbean, the cultivar called Vermelhinho, used by farmers inthe Zona da Mata of Minas, has a number of undesirablecharacteristics, especially with regard to pathogensusceptibility (Alzate-Marin et al. 2006). Besides, the yieldpotential of this cultivar is low compared to improvedcultivars.
Another red bean cultivar called Vermelho 2157,regardless of the higher yield potential and better pathogensresistance, is not used by producers in the Zona da MataMineira, since the grains are large and their color is irregular.This limits the use, since such grains have no commercialvalue (Vieira 2005). Consequently, the demand is high fornew commercial cultivars in this group.
1 Universidade Federal de Viçosa (UFV), Departamento de Fitotecnia, 36.570-000, Viçosa, MG, Brazil. *E-mail: [email protected] UFV, Departamento de Biologia Geral3 Universidade Estadual de Roraima, Campus Rorainópolis, 69.373-000, Rorainópolis, RR, Brazil4 UFV, Departamento de Estatística
Crop Breeding and Applied Biotechnology 11: 50-58, 2011 51
Common bean breeding to improve red grain lines
To meet this demand, the common bean program ofthe Federal University of Viçosa (UFV) was also used forthe improvement of red bean in the late 1990s. A recentresult of this work was the recommendation of the cultivarOuro Vermelho (Carneiro et al. 2006), with 30% higher yieldthan Vermelhinho. The release of this cultivar has led tosignificant yield increases and better market supply of redbean, benefiting both producers and consumers. However,as the demand for red bean has been increasing in theregion, new cultivars must be obtained, better than thoseused by producers. Thus, aside from being more productive,the spectrum of pathogen resistance of new cultivarsshould be greater and plant architecture better.
Since the various phenotypes of interest are distributedin different parents, it is almost impossible to unite allthese phenotypes in a single selection cycle, some authorshave suggested the use of recurrent selection (Hallauer1992), i.e., the cycles of continuous selection andrecombination (Geraldi 1997). This strategy has been usedwith great success in bean breeding to obtain improved linesfor various traits of interest (Singh et al. 1999, Ramalho etal. 2005a, Amaro et al. 2007, Menezes Júnior et al. 2008).The purpose of this study was to evaluate the performancepotential of red bean lines of the common bean breedingprogram of the Federal University of Viçosa, derived frompopulations of the first cycle of recurrent selection.
MATERIAL AND METHODS
The experiments were conducted in an experimentalfield in Coimbra of the Federal University of Viçosa (UFV),in Coimbra, state of Minas Gerais (lat 20o 45’ S, long 42o 51’W, alt 690 m asl).
In the beginning of the red bean breeding programof the Federal University of Viçosa, the only red beancultivar available to farmers in the Zona da Mata Mineira,Vermelhinho, was crossed with the following lines: Aporé,Pérola, IAPAR31, IAPAR81, AN9022180, LR720982CP,AFR19521, AFR19535, AB136, and Vermelho 2157.Segregating populations were established by single,double and back-crosses with cv Vermelhinho 18 (Table 1),representing the basis for a recurrent selection program ofthe UFV. The crosses were made in a greenhouse followingthe procedure without emasculation described by Peternelliet al. (2009).
The 18 populations were advanced in bulk for twogenerations. A total of 243 families derived from plantswith the standard red grain color grown in the region Zona
da Mata in Minas Gerais were evaluated for grain yield forthree generations, F3:5 , F3:6 and F3:7 , together with 13controls, in the two of the three possible growing seasons,i.e., in the dry season (sowing Feb/Mar) and winter (sowingJun/Jul) of 2002 and dry season of 2003, respectively. Eachplot consisted of two 2-m rows. During the assessments,families were advanced by the bulk-within-family method.The regional cultural practices for common bean wereapplied and sprinkler irrigation, whenever rainfall wasinsufficient (experimental details in Table 2).
The grain yield data in kg ha-1, were subjected toanalysis of variance per generation, considering all modeleffects random, except the mean (Cruz et al. 2004), basedon the following statistical model: Yikl = m + pi + rk + bl(k)
+ eikl , where Yikl is the value observed in the plot oftreatment i in block l, within replication k; m is the overallmean, pi is the treatment effect i ( i = 1, 2, 3 ,..., 256), i.e,involving the 243 families and 13 controls; rk is the effectof replication k (k = 1, 2 and 3); bl(k) is the effect of block lwithin replication k; eikl is the experimental error associatedwith observation Yikl, assuming independent and normallydistributed errors with zero mean and variance2σ . Later,analysis of variance was conducted, using the treatmentmeans, adjusted according to Ramalho et al. (2005b).
Based on the expected mean squares the geneticvariance (GV), the phenotypic variance (PhV) and thevariance of the interaction family x generations (VIFxG)were estimated (Ramalho et al. 2005b). broad-sense
Table 1. Genealogy of the 18 populations used to breed red bean lines

52 Crop Breeding and Applied Biotechnology 11: 50-58, 2011
JAN Menezes Júnior et al.
were performed using software Genes (Cruz 2006) andMSTAT-C Michigan State University (1991).
RESULTS AND DISCUSSION
Family performance
Significant differences (P < 0.01) were detectedamong families of different populations in the threegenerations studied, indicating variation (Table 3). It mustbe pointed out that the generation effect was confoundedwith the effect of years and growing seasons, since the
heritability (h2) was also estimated for selection based onthe family mean (Vencovsky and Barriga 1992) and thefrequency distribution for grain yield obtained, accordingto the procedure proposed by Ramalho et al. (2005b).
Families that were outstanding in terms of yield andgrain appearance were used for line extraction. Thus, 154plants were selected with the main traits of interest. Theseplants were multiplied (F7:8 generation) and later evaluatedin plots of two 2-m rows, in the dry season of 2006 (F7:9)and of 2007 (F7:10), for plant architecture, yield and grainappearance (further details in Table 2). Grain appearancewas rated on a 1 – 5 scale, where 1 refers to the typical redbean, shiny, not flattened, elliptical shape and mean 100-seed weight between 22 and 24 g; 2 for a red grain withdeficiency in one of the cited standard traits; 3 for redgrain with deficiency in two of the cited standard traits; 4for red grain with deficiency in three of the cited standardtraits; and 5 for nonstandard red bean grain. Plantarchitecture was also assessed on a 1-5 scale describedby Collicchio et al. (1997), where: 1 refers to an indeterminategrowth habit, type II, erect, with a stem and high insertionof the first pod and grade 5 for growth habit III, with longinternodes and very prostrate.
Data analysis of grain yield (kg ha-1) was performedusing a similar procedure to that described earlier in theprocess of evaluating families. Initially the individualanalyses were performed and subsequently the combinedanalysis, considering treatment effects and mean as fixed(Cruz et al. 2004). For the grades of grain type and plantarchitecture the treatment effects and mean were alsoconsidered as fixed in the individual analyses. The linemeans were compared with the standard control, OuroVermelho, by the Dunnett test at 5% probability. Analyses
Table 2. Experimental details of the evaluation in segregating families and lines of the firstcycle of recurrent selection of the red bean improvement program of the UFV
Table 3. Summary of the individual and combined analyses ofgrain yield (kg ha-1) in the evaluations of the families F
3:5, F
3:6 and
F3:7
, with the respective estimates of the genetic variance amongfamily means (GV), phenotypic variance in the family means(PhV), variance of the family x generation interaction (VI
FxG) and
heritability (h2) in the family mean
1 Lower and upper limits of the genetic variance obtained according to
Ramalho et al. (2005b)2 Lower and upper limits of heritability obtained according to Knapp et al.
(1985)
** significant at 1% probability by the F test.

Crop Breeding and Applied Biotechnology 11: 50-58, 2011 53
Common bean breeding to improve red grain lines
generations were, obviously, evaluated at different times.The family x generations interaction (growing seasons)was significant (P < 0.01), indicating that families performeddifferently in different generations and that assessmentsshould be conducted in various environments. In moststudies with common bean in the state of Minas Gerais,the interaction of family x growing season was significantfor grain yield (Carneiro et al. 2002, Cunha et al. 2005, Meloet al. 2006, Moreto et al. 2007).
Interestingly, the family mean was higher than themean of the standard cultivar Vermelhinho in the threeassessments (Table 3), indicating the possibility of selectingfamilies with better performance than of this standardcontrol. It is also noteworthy that the lower limit of thegenetic variance was positive in all situations, indicatingthat the genetic variance between families is different fromzero. The variability between families was also confirmedby heritability estimates (h2) that were greater than zero inall cases, at 95% confidence, since the lower limit of h2
was positive. It should be noted that these h2 estimatesare in the broad sense, however, since dominance is notsignificant in the F3:5 , F3:6 and F3:7, generations, the h2
estimates can be considered in the narrow sense (Moretoet al. 2007).
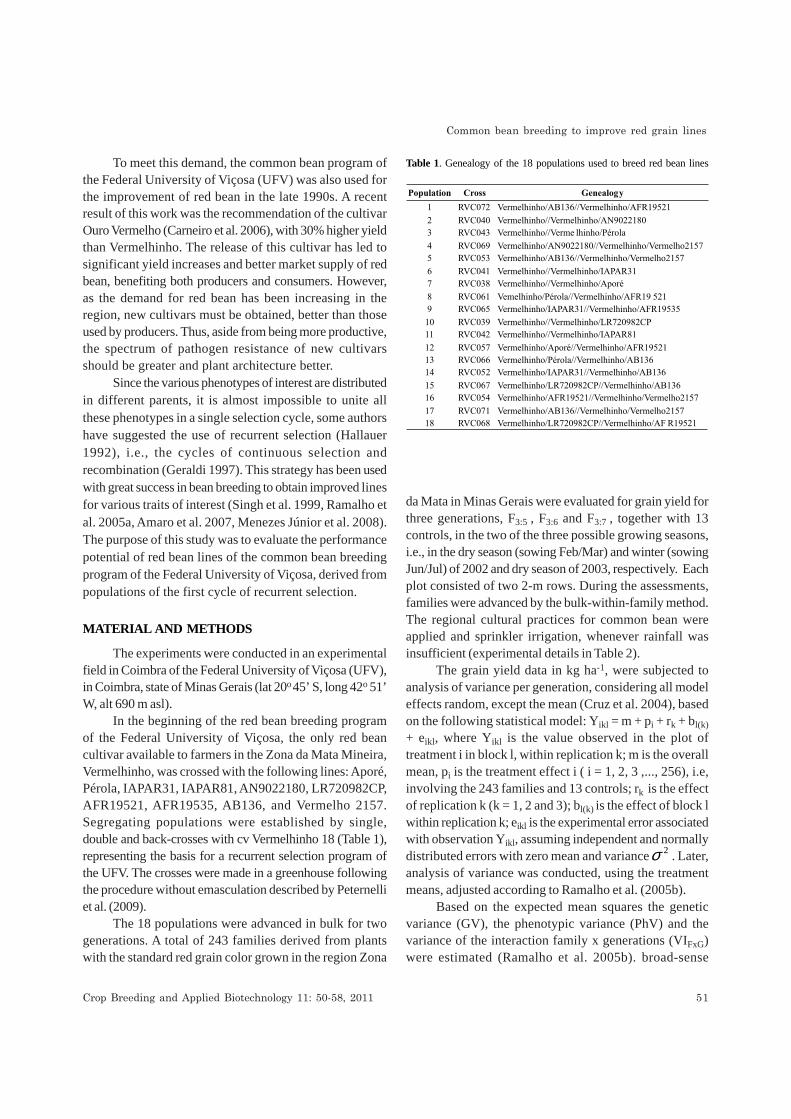
To visualize the superiority of families, compared tothe control Vermelhinho, the frequency distribution wasobtained based on grain yield (Figure 1A). It was observedthat the mean yield of a large number of families was higherthan of the control (Figure 1A). It is worth rememberingthat the tested families had been advanced by bulk withinfamilies and the selection of lines with superior meanperformance among these families is expected to bepossible.
Of the 243 families tested, five were promoted to theTest of Value for Cultivation and Use (VCU) growingseason 2003-2004, (partnership of UFLA, UFV, Epamig andEmbrapa Rice and Beans), leading to the recommendationof Ouro Vermelho for the state of Minas Gerais (Carneiroet al. 2006).
The lines evaluated in this study were selected from 43families of 17 populations (Table 1). Only population 18, crossRVC068, was not used. For the final evaluations, 154 lineswere selected.
Line performance
The individual analysis revealed that, in general, linesof a same population did not differ in grain yield and plantarchitecture. The source of variation among populations
(groups of lines) was significant (P < 0.01) for all traits,indicating better performance of some populations.
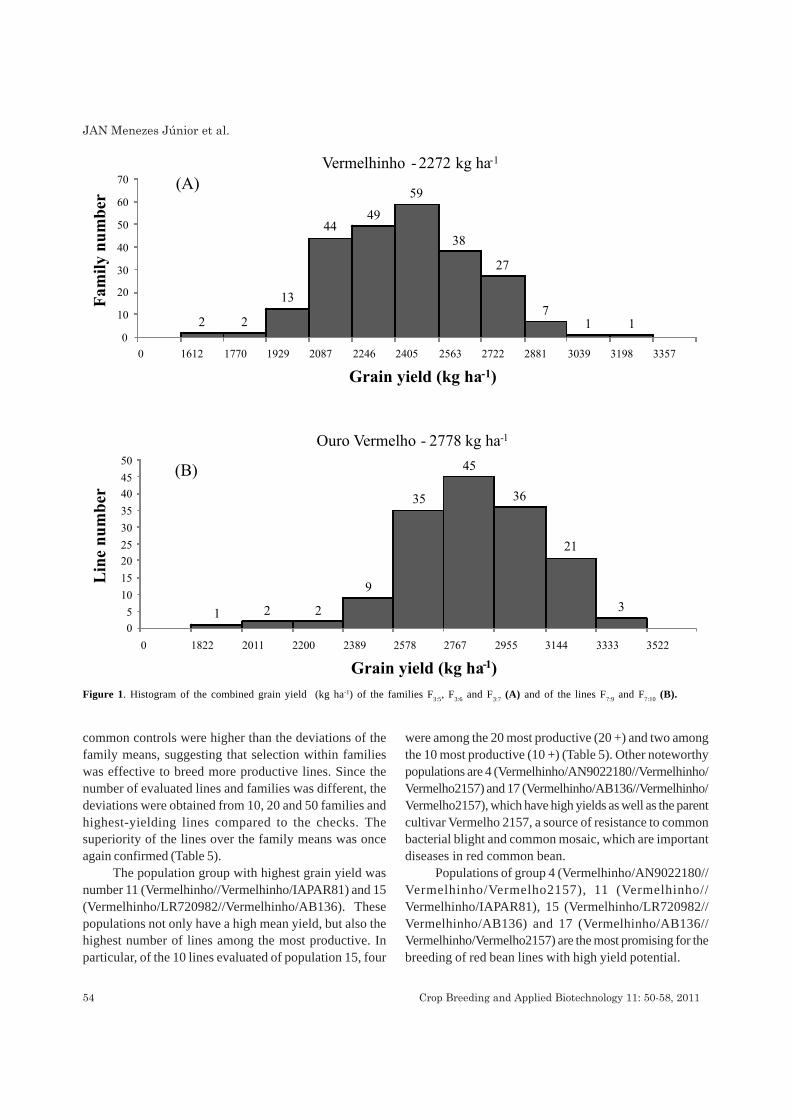
The combined analysis (Table 4) showed that the line xyear interaction was significant (P < 0.01) for yield, indicatingthat the line performance was not consistent in different years.The same observation was made in the evaluation of families.The significance of the line x year interaction complicates theselection of promising lines in different environments anddemonstrates that assessments should be conducted atdifferent times. Couto et al. (2008), evaluated carioca grainlines in southern Minas Gerais, which also performeddifferently in different environments. The authors suggested,in the particular case of common bean, that best lines shouldbe selected based on the mean of multiple environments.
In the partitioning of the line x year interaction, it wasobserved that the interaction between lines of each populationand years was in most cases insignificant (Table 4), whereasthe source of variation population x year was significant(P < 0.01). The mean of the lines (2876 kg ha-1) was clearlyhigher than of cultivar Ouro Vermelho (2778 kg ha-1) (Table 4)and even than of Ouro Negro (2780 kg ha-1), considered areference in yield.
Dunnett’s test (5% probability) indicated that 151 lines(98%) had a mean yield equal to or higher than the standardcontrol Ouro Vermelho. The grain scores ranged from 1.1 to3.6, and 89 lines (57.8%) had grades below 2, statisticallyequal to the grade of standard control Ouro Vermelho (1.4). Itis worth mentioning that grain appearance is a limiting featurefor the recommendation of a bean cultivar, since consumersare rather picky about this aspect. Therefore, the number ofred-grained lines with performance potential to be includedin VCU trials is noteworthy. Comparing plant architecturehowever only four lines performed better than the control, asrevealed by Dunnett test.
To show the superiority of lines over the control, thefrequency distribution was calculated based on grain yield(Figure 1B). A considerable number of lines had a highermean yield than the control Ouro Vermelho, demonstratingthe efficiency of selection within the segregating families.
The superiority of lines over the means of familiescan also be demonstrated by the deviation from commoncontrols, since the evaluations were conducted in differentyears and there are environmental and interaction effectsin the trait expression. The mean grain yield of each populationand the deviations from the mean of the common controls(Vermelhinho, Vermelho 2157, AFR-140, Pérola, Talismã,and Ouro Negro) are shown in Table 5. It was observedthat the deviations of the line means from the mean of the
54 Crop Breeding and Applied Biotechnology 11: 50-58, 2011
JAN Menezes Júnior et al.
common controls were higher than the deviations of thefamily means, suggesting that selection within familieswas effective to breed more productive lines. Since thenumber of evaluated lines and families was different, thedeviations were obtained from 10, 20 and 50 families andhighest-yielding lines compared to the checks. Thesuperiority of the lines over the family means was onceagain confirmed (Table 5).
The population group with highest grain yield wasnumber 11 (Vermelhinho//Vermelhinho/IAPAR81) and 15(Vermelhinho/LR720982//Vermelhinho/AB136). Thesepopulations not only have a high mean yield, but also thehighest number of lines among the most productive. Inparticular, of the 10 lines evaluated of population 15, four
were among the 20 most productive (20 +) and two amongthe 10 most productive (10 +) (Table 5). Other noteworthypopulations are 4 (Vermelhinho/AN9022180//Vermelhinho/Vermelho2157) and 17 (Vermelhinho/AB136//Vermelhinho/Vermelho2157), which have high yields as well as the parentcultivar Vermelho 2157, a source of resistance to commonbacterial blight and common mosaic, which are importantdiseases in red common bean.
Populations of group 4 (Vermelhinho/AN9022180//Vermelhinho/Vermelho2157), 11 (Vermelhinho//Vermelhinho/IAPAR81), 15 (Vermelhinho/LR720982//Vermelhinho/AB136) and 17 (Vermelhinho/AB136//Vermelhinho/Vermelho2157) are the most promising for thebreeding of red bean lines with high yield potential.
Figure 1. Histogram of the combined grain yield (kg ha-1) of the families F3:5
, F3:6
and F3:7
(A) and of the lines F7:9
and F7:10
(B).
Crop Breeding and Applied Biotechnology 11: 50-58, 2011 55
Common bean breeding to improve red grain lines
Table 4. Summary of the combined analysis of variance of grainyield (kg ha-1), obtained in the evaluation of the lines F
7:9 and F
7:10
in 2006 and 2007

56 Crop Breeding and Applied Biotechnology 11: 50-58, 2011
JAN Menezes Júnior et al.
The bulk method in F3-derived families provedpromising as a strategy for common bean improvement.
Lines with a better performance potential than of thered bean cultivars Vermelhinho and Ouro Vermelho wereobtained, which may be included in future VCU trials andlater recommended for planting in the state of Minas Gerais.
ACKNOWLEDGEMENTS
The authors acknowledge the CNPq, CAPES andFAPEMIG for the financial support of the researchactivities in the Common Bean Program of the FederalUniversity of Viçosa.
Table 5. Mean grain yield (kg ha-1) and deviations compared to the common controls in the evaluation of families and lines
CC = Mean of the common controls; NF = number of tested families; NL = number of tested lines; NL(20+) = number of lines among the 20 most
productive; NL(10+) = number of lines among the 10 most productive; Mean(10+) = mean of the 10 most productive; Mean(20+) = mean of the 20 most
productive; Mean (50+) = mean of the 50 most productive.
Crop Breeding and Applied Biotechnology 11: 50-58, 2011 57
Common bean breeding to improve red grain lines
REFERENCES
Amaro GB, Abreu AFB, Ramalho MAP and Silva FB (2007)Phenotypic recurrent selection in the common bean (Phaseolusvulgaris L.) with carioca-type grains for resistance to the fungiPhaeoisariopsis griseola. Genetics and Molecular Biology30: 584-588.
Alzate-Marin AL, Souza TLPO, Arruda KMA, Silva MGM, ChagasJM, Barros EG and Moreira MA (2006) Reação do cultivar defeijoeiro-comum Vermelhinho à ferrugem, antracnose e mancha-angular. Revista Ceres 56: 164-170.
Botelho FBS, Ramalho MAP, Abreu AFB and Rezende BA (2008)Estimates of compensation and stability parameters in commonbean lines aiming at multilines. Crop Breeding and AppliedBiotechnology 8: 339-345.
Carneiro JES, Ramalho MAP, Abreu AFB and Gonçalves FMA (2002)Breeding potential of single, double and multiple crosses in commonbean. Cr op Breeding and Applied Biotechnology 2: 515-524.
Carneiro JES, Silva LC, Paula Junior TJ, Araujo GAA, Carneiro PCS,Giudice MP, Menezes Júnior JAN, Ramalho MAP, Peloso MJ andAbreu AFB (2006) Ouro Vermelho: new red bean cultivar forMinas Gerais. Annual Report of the Bean ImprovementCooperative 49: 281 - 282.
Collicchio E, Ramalho MAP and Abreu AFB (1997) Associação entreo porte da planta do feijoeiro e o tamanho dos grãos. PesquisaAgropecuária Brasileira 32: 297-304.
Couto MA, Santos JB and Ferreira JL (2008) Melhoramento dofeijoeiro comum com grão tipo carioca, visando resistência àantracnose e à mancha angular. Ciência e Agrotecnologia 32:1643 -1648.
Cruz CD (2006) Programa Genes: estatística experimental ematrizes. Editora UFV, Viçosa, 285p.
Cruz CD, Regazzi AJ and Carneiro PCS (2004) Modelos biométricosaplicados ao melhoramento genético. Editora UFV, Viçosa,480p.
Cunha WG, Ramalho MAP and Abreu AFB (2005) Selection aiming atupright growth habit common bean with carioca type grains. CropBreeding and Applied Biotechnology 5: 379-386.
Geraldi IO (1997) Selección recurrente en el mejoramiento de plantas.In Guimarães EP (ed.) Selección recurrente en arroz. CIAT,Cali, p. 3-11.
Hallauer AR (1992) Recurrent selection in maize. Plant BreedingReviews 9: 115-179.
Knapp SJ, Stroup WW and Ross WM (1985) Exact confidenceintervals for heritability on a progeny mean basis. Crop Science25: 192-194.
Melo CLP, Carneiro JES, Carneiro PCS, Cruz CD, Barros EG andMoreira MA (2006) Linhagens de feijão do cruzamento ‘OuroNegro’ x ‘Pérola’ com características agronômicas favoráveis.Pesquisa Agropecuária Brasileira 41: 1593-1598.
Menezes Júnior JAN, Ramalho MAP and Abreu AFB (2008) Seleçãorecorrente para três caracteres do feijoeiro. Bragantia 67: 833-838.
Moreto AL, Ramalho MAP and Abreu AFB (2007) Estimação doscomponentes da variância fenotípica em feijoeiro utilizando ométodo genealógico. Ciência e Agrotecnologia 31: 1035-1042.
MSTAT-C (1991) A software program for the design,management and analysis of agronomic researchexperiments. [S.1]: Michigan State University, East Lansing.
Peternelli LA, Borém A and Carneiro JES (2009) Hibridação emfeijão. In Borém A (ed) Hibridação artificial de plantas. EditoraUFV, Viçosa, p. 514-536.
Melhoramento do feijoeiro visando a obtenção de linhagens
de grãos vermelhos
RESUMO - Este trabalho foi realizado com o objetivo de avaliar o potencial de linhagens de feijão vermelho, oriundas depopulações do primeiro ciclo de seleção recorrente do programa de melhoramento do feijoeiro da Universidade Federal de Viçosa.Foram avaliadas 243 famílias, provenientes de 18 populações segregantes, nas gerações F3:5, F3:6 e F3:7. Essas famílias foramconduzidas pelo método do “bulk dentro de famílias” e daquelas com maior potencial, foram extraídas 154 linhagens, avaliadasnas safras da seca de 2006 (F7:9) e seca de 2007 (F7:10), em Coimbra - MG. As estimativas dos parâmetros genéticos e fenotípicosevidenciaram a presença de variabilidade entre as famílias. O método do “bulk dentro de famílias” derivadas de plantas F3
mostrou-se promissorcomo estratégia de melhoramento do feijoeiro. Linhagens com maior potencial para inclusão nos futurosensaios de valor de cultivo e uso (VCU) para Minas Gerais foram extraídas das populações Vermelhinho/AN9022180//Vermelhinho/Vermelho2157,Vermelhinho//Vermelhinho/IAPAR81,Vermelhi-nho/LR720982//Vermelhinho/AB136 e Vermelhinho/AB136//Vermelhinho/Vermelho2157.
Palavras-chave: Phaseolus vulgaris L., seleção recorrente, seleção dentro de famílias, feijão vermelho.

58 Crop Breeding and Applied Biotechnology 11: 50-58, 2011
JAN Menezes Júnior et al.
Ragagnin VA, Souza TLPO, Sanglard DA, Arruda KMA, Costa MR,Azate-Marin AL, Carneiro JES, Moreira MA and Barros EG (2009)Development and agronomic performance of common bean linessimultaneously resistant to anthracnose, angular leaf spot andrust. Plant Breeding 128: 156-163.
Ramalho MAP, Abreu AFB and Santos JB (2005a) Genetic progressafter four cycles of recurrent selection for yield and grain traits incommon bean. Euphytica 144: 23-29.
Ramalho MAP, Ferreira DF and Oliveira AC (2005b) Experimentaçãoem genética e melhoramento de plantas. Editora UFLA,Lavras, 322p.
Silva FB, Ramalho MAP and Abreu AFB (2007) Seleção recorrentefenotípica para florescimento precoce de feijoeiro “carioca”.Pesquisa Agropecuária Brasileira 42: 1437-1442.
Singh SP, Terán H, Muñoz CG and Takegami JC (1999) Two cycles ofrecurrent selection for seed yield in common bean. Crop Science39: 391-397.
Vencovsky R and Barriga P (1992) Genética biométrica nofitomelhoramento. Revista Brasileira de Genética, RibeirãoPreto, 496p.
Vieira C (2005) Memórias de meio século de estudo sobre acultura do feijão. UFV, Viçosa, 214 p.
Top Related