


Languages
Pages
Legal

Experiment 1 23 January 2020
Colliga7ve Proper7es
So, what exactly is a colliga1ve property, you may ask. We will find
out today!
Our first experiment! Woo-‐hoo!
Colliga1ve… it just sort of rolls off the tongue… Try it. Try using it in polite
conversa1on.
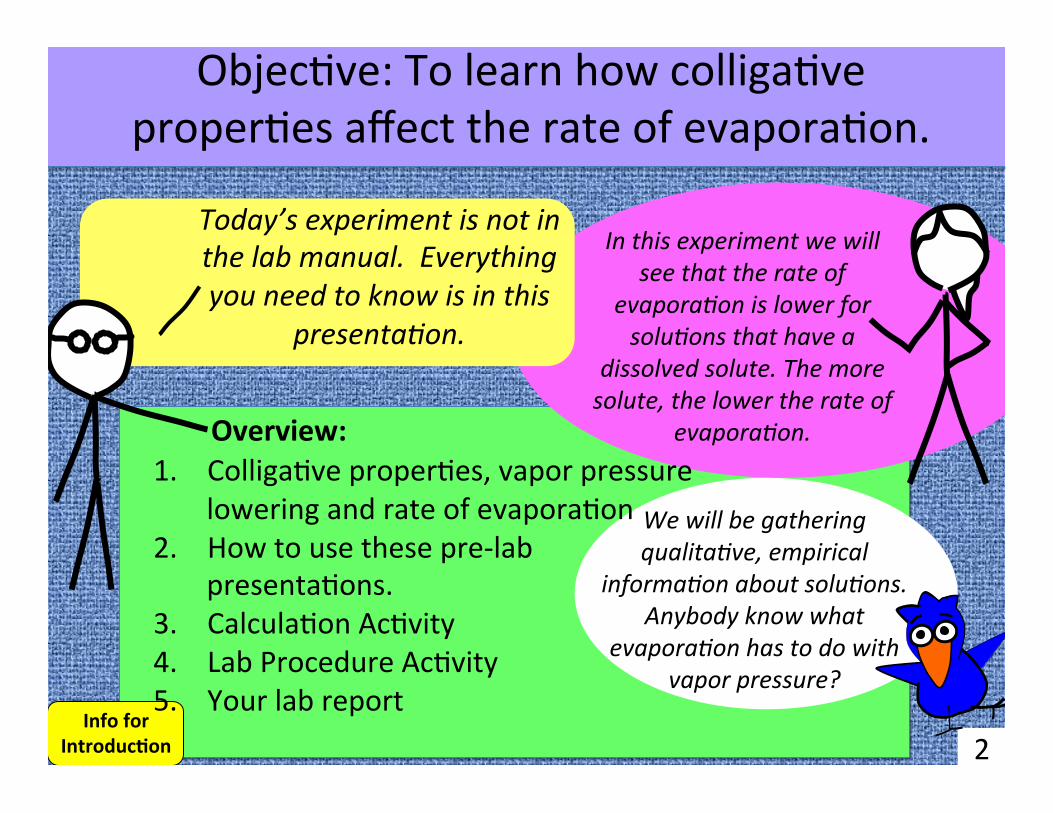
In this experiment we will see that the rate of
evapora1on is lower for solu1ons that have a
dissolved solute. The more solute, the lower the rate of
evapora1on.
Today’s experiment is not in the lab manual. Everything you need to know is in this
presenta1on.
2 Info for
Introduc7on
Objec(ve: To learn how colliga(ve proper(es affect the rate of evapora(on.
We will be gathering qualita1ve, empirical
informa1on about solu1ons. Anybody know what
evapora1on has to do with vapor pressure?
Overview: 1. Colliga(ve proper(es, vapor pressure
lowering and rate of evapora(on 2. How to use these pre-‐lab
presenta(ons. 3. Calcula(on Ac(vity 4. Lab Procedure Ac(vity 5. Your lab report
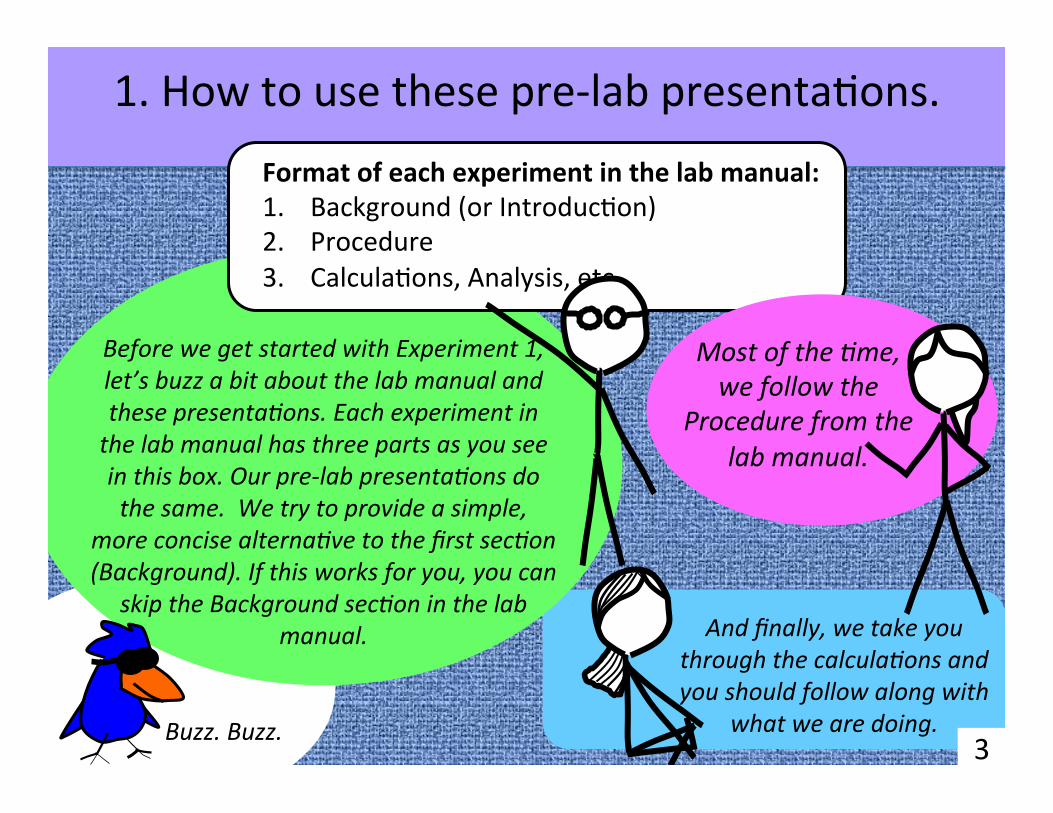
1. How to use these pre-‐lab presenta(ons.
3
Before we get started with Experiment 1, let’s buzz a bit about the lab manual and these presenta1ons. Each experiment in the lab manual has three parts as you see in this box. Our pre-‐lab presenta1ons do the same. We try to provide a simple,
more concise alterna1ve to the first sec1on (Background). If this works for you, you can
skip the Background sec1on in the lab manual.
Format of each experiment in the lab manual: 1. Background (or Introduc(on) 2. Procedure 3. Calcula(ons, Analysis, etc.
Most of the 1me, we follow the
Procedure from the lab manual.
And finally, we take you through the calcula1ons and you should follow along with
what we are doing. Buzz. Buzz.
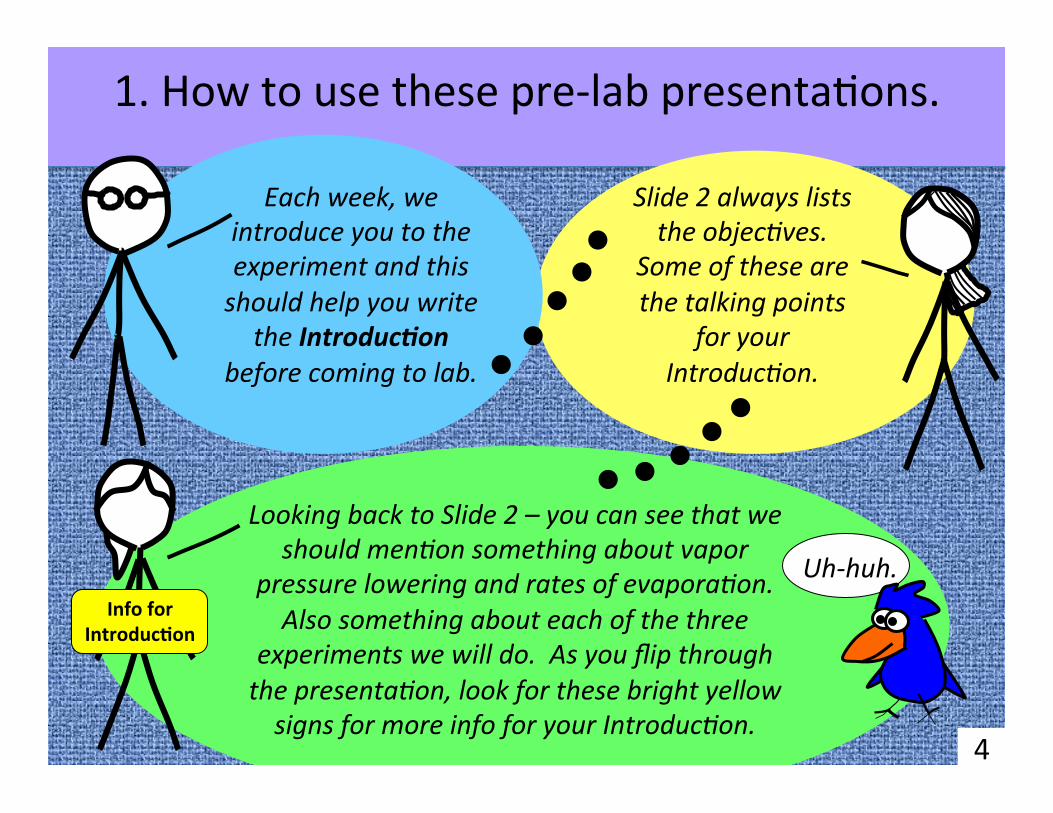
1. How to use these pre-‐lab presenta(ons.
4
Slide 2 always lists the objec1ves.
Some of these are the talking points
for your Introduc1on.
Each week, we introduce you to the experiment and this should help you write the Introduc)on
before coming to lab.
Info for Introduc7on
Looking back to Slide 2 – you can see that we should men1on something about vapor
pressure lowering and rates of evapora1on. Also something about each of the three
experiments we will do. As you flip through the presenta1on, look for these bright yellow signs for more info for your Introduc1on.
Uh-‐huh.

These presenta1ons introduce you to the experiment, so you can usually skip the Background/Introduc1on sec1on from the lab manual and go straight to the
Procedure (once we are in lab). These presenta1ons are tailored to go with Dr MaZson’s lectures, using the
same vocabulary and approaches you’ve seen in lecture.
1. How to use these pre-‐lab presenta(ons.
5
The pre-‐lab presenta1ons also
provide an overview of the procedure followed each week, however,
they lack the detail that the lab manual gives.
So we generally follow the Procedure sec1on in the lab manual carefully. Usually, word for
word.
1. How to use these pre-‐lab presenta(ons.
6
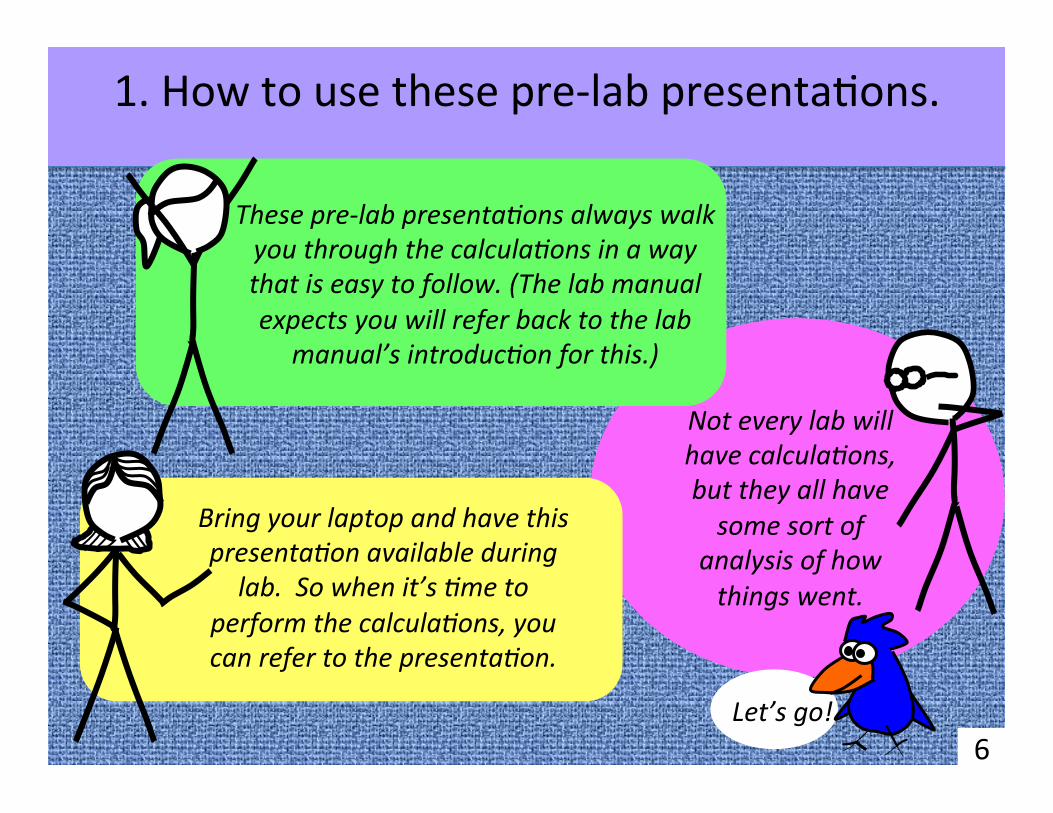
These pre-‐lab presenta1ons always walk you through the calcula1ons in a way that is easy to follow. (The lab manual expects you will refer back to the lab
manual’s introduc1on for this.)
Bring your laptop and have this presenta1on available during lab. So when it’s 1me to
perform the calcula1ons, you can refer to the presenta1on.
Not every lab will have calcula1ons, but they all have some sort of
analysis of how things went.
Let’s go!
7
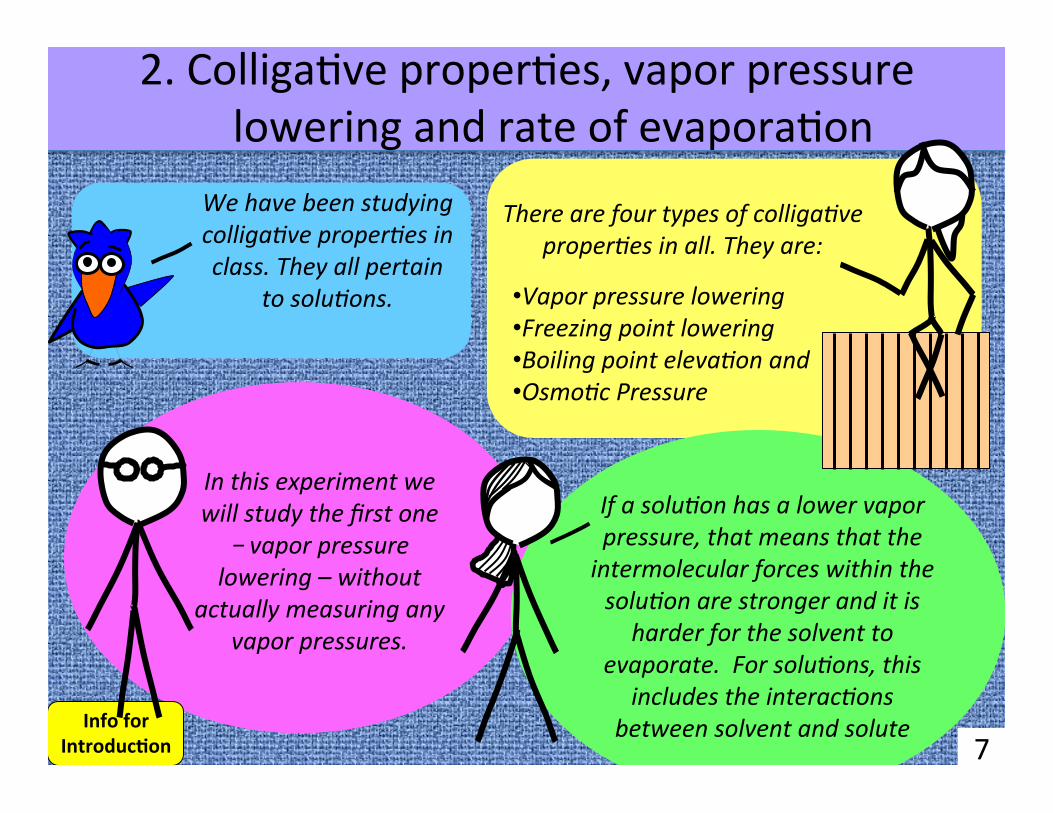
We have been studying colliga1ve proper1es in class. They all pertain
to solu1ons.
2. Colliga(ve proper(es, vapor pressure lowering and rate of evapora(on
There are four types of colliga1ve
proper1es in all. They are:
• Vapor pressure lowering • Freezing point lowering • Boiling point eleva1on and • Osmo1c Pressure
In this experiment we will study the first one – vapor pressure lowering – without
actually measuring any vapor pressures.
If a solu1on has a lower vapor pressure, that means that the intermolecular forces within the solu1on are stronger and it is harder for the solvent to
evaporate. For solu1ons, this includes the interac1ons
between solvent and solute Info for Introduc7on
Info for Introduc7on
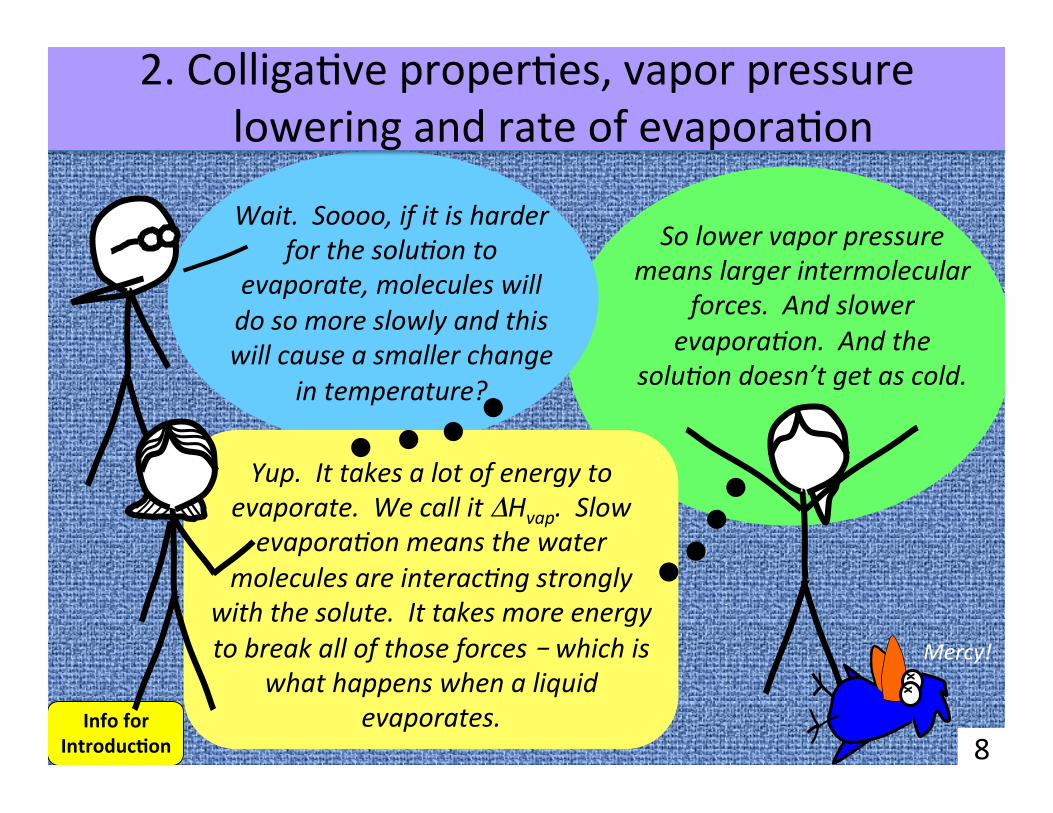
Wait. Soooo, if it is harder for the solu1on to
evaporate, molecules will do so more slowly and this will cause a smaller change
in temperature?
So lower vapor pressure means larger intermolecular
forces. And slower evapora1on. And the
solu1on doesn’t get as cold.
Yup. It takes a lot of energy to evaporate. We call it ΔHvap. Slow evapora1on means the water
molecules are interac1ng strongly with the solute. It takes more energy to break all of those forces – which is
what happens when a liquid evaporates.
8
x x
Mercy!
2. Colliga(ve proper(es, vapor pressure lowering and rate of evapora(on
9
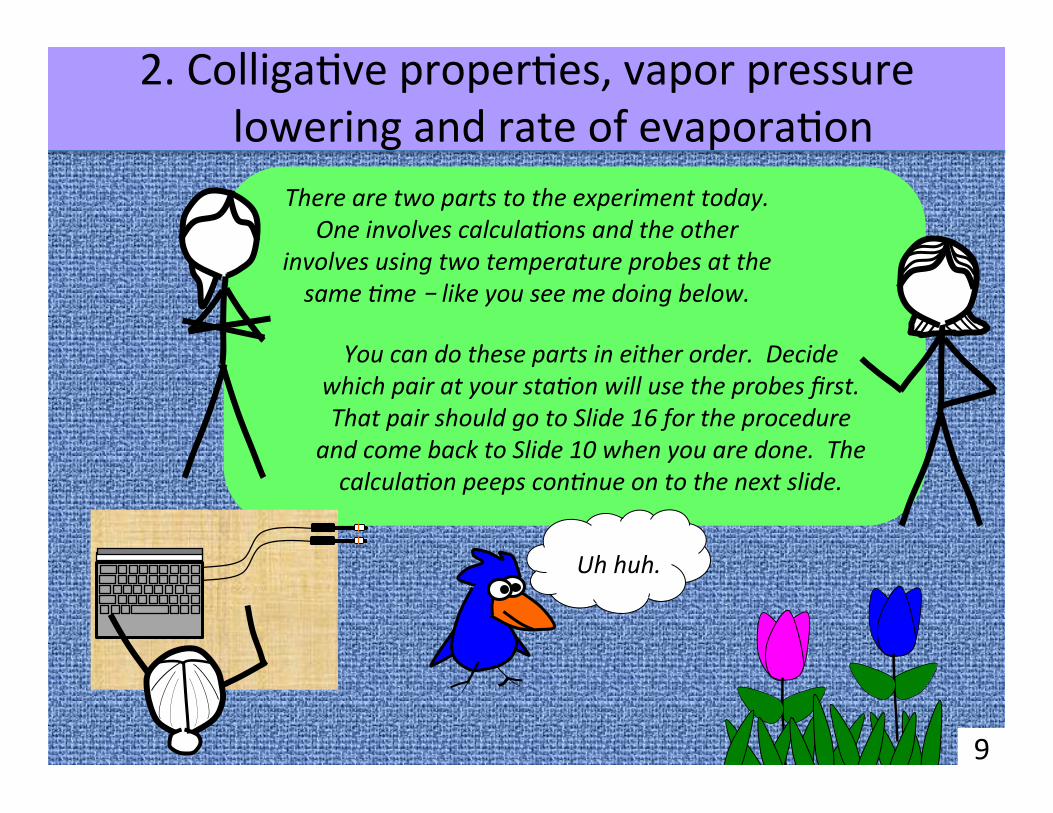
There are two parts to the experiment today. One involves calcula1ons and the other
involves using two temperature probes at the same 1me – like you see me doing below.
Uh huh.
You can do these parts in either order. Decide which pair at your sta1on will use the probes first. That pair should go to Slide 16 for the procedure
and come back to Slide 10 when you are done. The calcula1on peeps con1nue on to the next slide.
2. Colliga(ve proper(es, vapor pressure lowering and rate of evapora(on
10
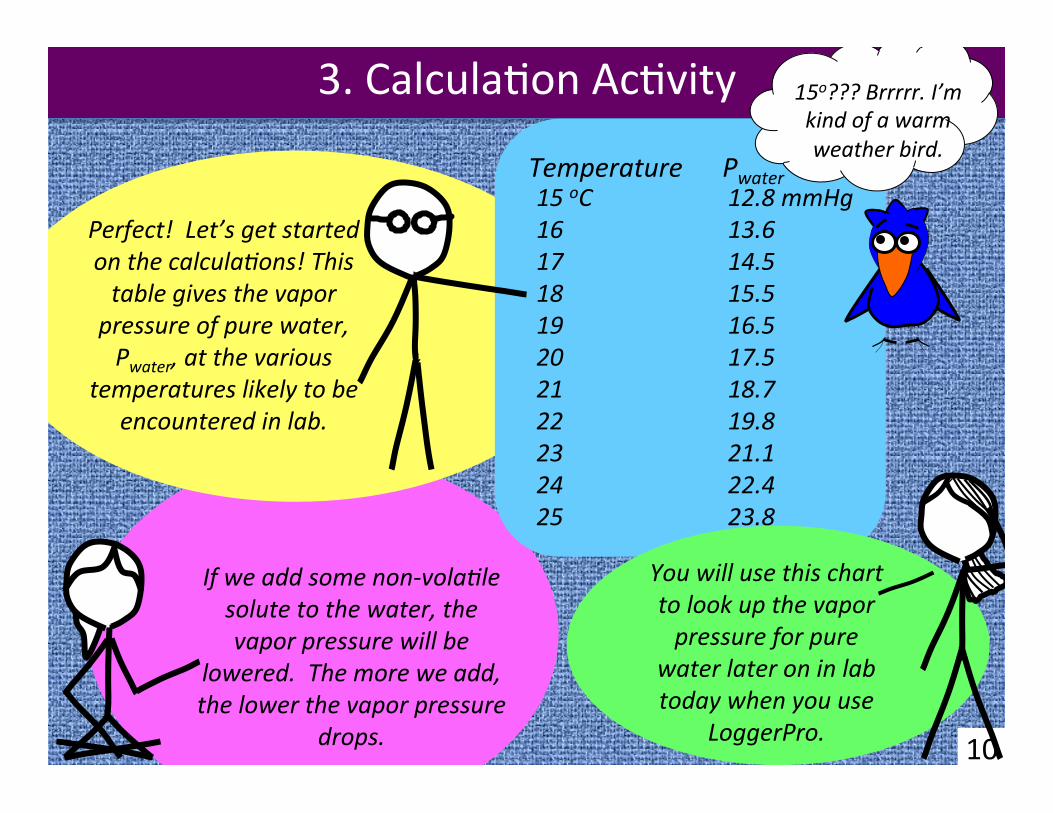
Perfect! Let’s get started on the calcula1ons! This table gives the vapor pressure of pure water, Pwater, at the various
temperatures likely to be encountered in lab.
3. Calcula(on Ac(vity
Temperature Pwater 15 oC 12.8 mmHg 16 13.6 17 14.5 18 15.5 19 16.5 20 17.5 21 18.7 22 19.8 23 21.1 24 22.4 25 23.8
If we add some non-‐vola1le solute to the water, the vapor pressure will be
lowered. The more we add, the lower the vapor pressure
drops.
15o??? Brrrrr. I’m kind of a warm weather bird.
You will use this chart to look up the vapor pressure for pure
water later on in lab today when you use
LoggerPro.
11
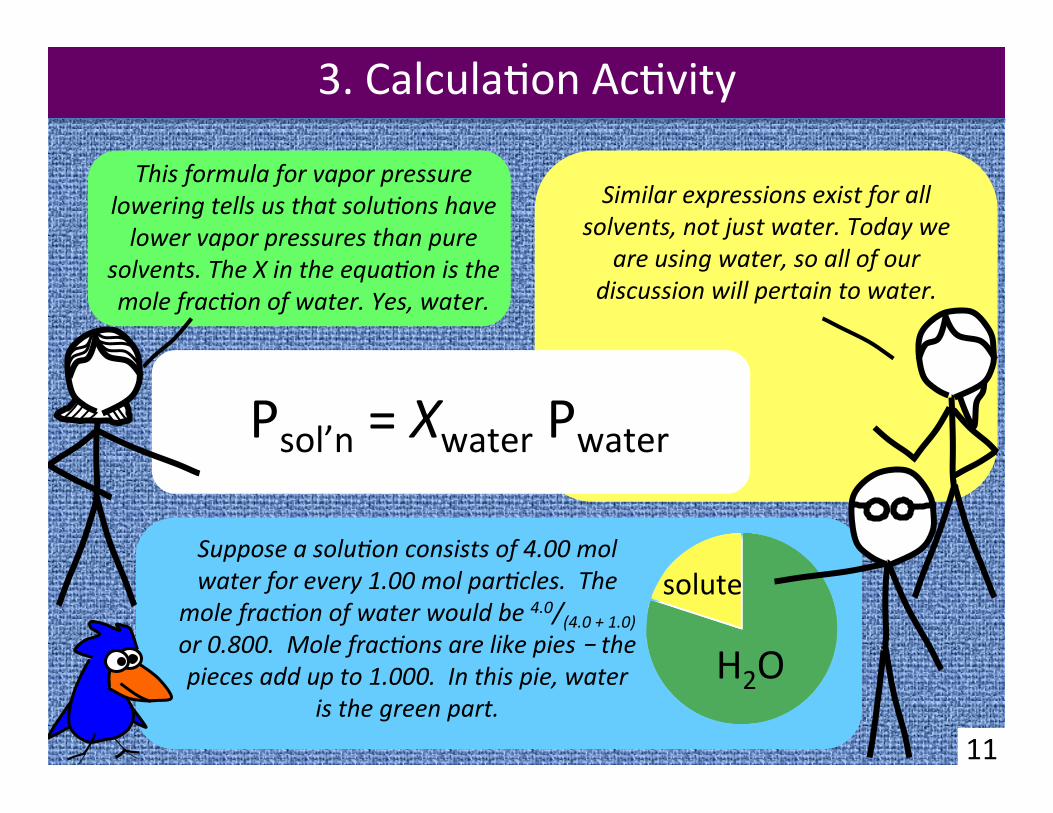
This formula for vapor pressure lowering tells us that solu1ons have lower vapor pressures than pure
solvents. The X in the equa1on is the mole frac1on of water. Yes, water.
Psol’n = Xwater Pwater
Similar expressions exist for all solvents, not just water. Today we
are using water, so all of our discussion will pertain to water.
Suppose a solu1on consists of 4.00 mol water for every 1.00 mol par1cles. The
mole frac1on of water would be 4.0/(4.0 + 1.0) or 0.800. Mole frac1ons are like pies – the pieces add up to 1.000. In this pie, water
is the green part. H2O
solute
3. Calcula(on Ac(vity
12
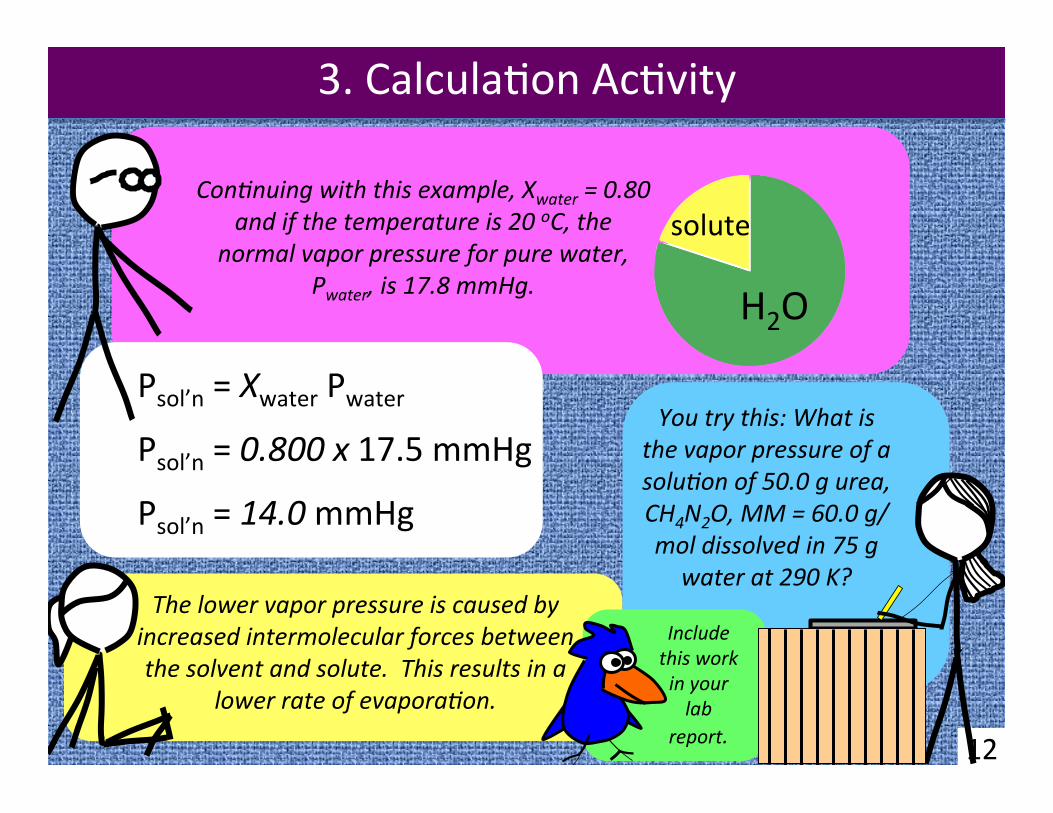
Psol’n = Xwater Pwater
The lower vapor pressure is caused by increased intermolecular forces between the solvent and solute. This results in a
lower rate of evapora1on.
Con1nuing with this example, Xwater = 0.80 and if the temperature is 20 oC, the
normal vapor pressure for pure water, Pwater, is 17.8 mmHg.
Psol’n = 0.800 x 17.5 mmHg
Psol’n = 14.0 mmHg
You try this: What is the vapor pressure of a solu1on of 50.0 g urea, CH4N2O, MM = 60.0 g/mol dissolved in 75 g water at 290 K?
solute
H2O
3. Calcula(on Ac(vity
Include this work in your lab
report.
13
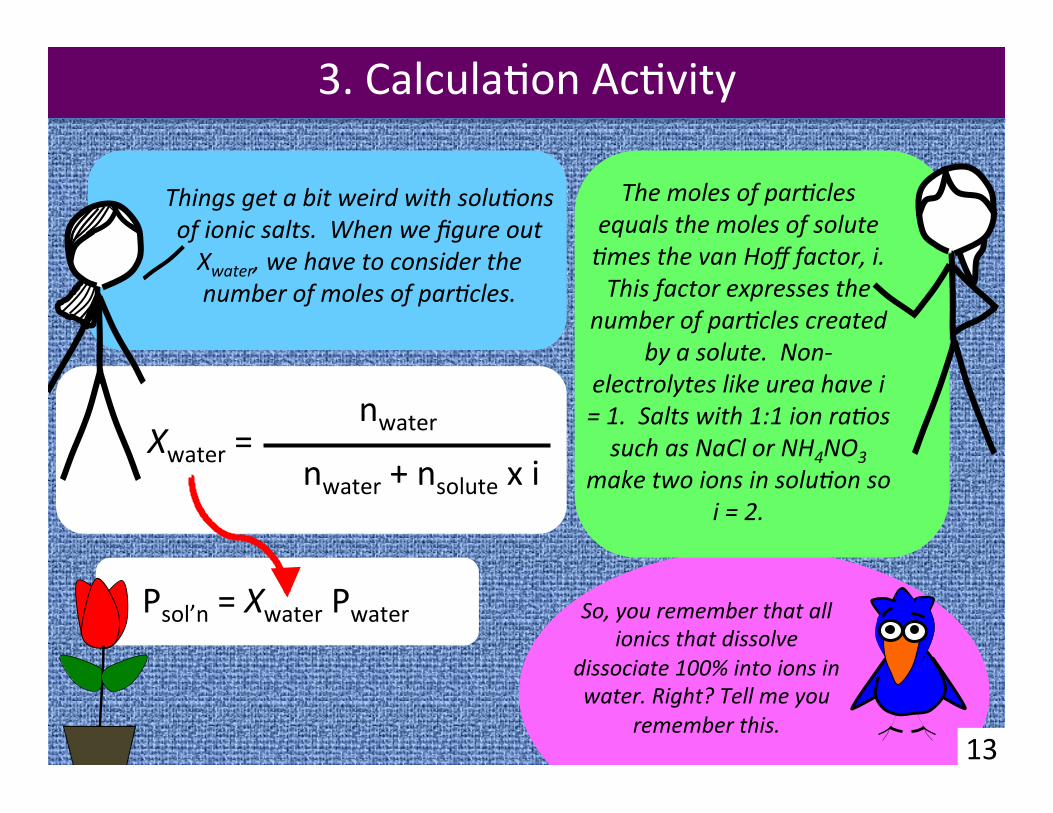
Things get a bit weird with solu1ons of ionic salts. When we figure out Xwater, we have to consider the number of moles of par1cles.
Psol’n = Xwater Pwater
Xwater = nwater
nwater + nsolute x i
The moles of par1cles equals the moles of solute 1mes the van Hoff factor, i. This factor expresses the
number of par1cles created by a solute. Non-‐
electrolytes like urea have i = 1. Salts with 1:1 ion ra1os such as NaCl or NH4NO3
make two ions in solu1on so i = 2.
So, you remember that all ionics that dissolve
dissociate 100% into ions in water. Right? Tell me you
remember this.
3. Calcula(on Ac(vity
14
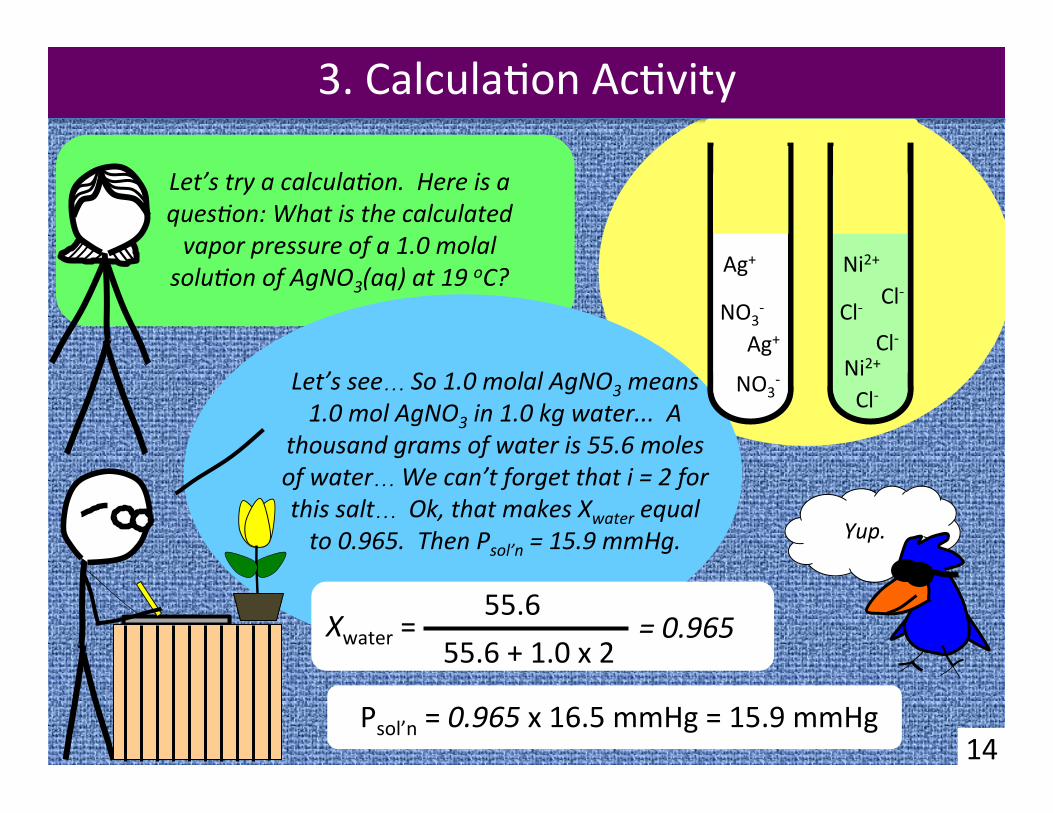
Let’s try a calcula1on. Here is a ques1on: What is the calculated vapor pressure of a 1.0 molal solu1on of AgNO3(aq) at 19 oC?
Ag+
Ag+ NO3
-‐
NO3-‐
Ni2+
Ni2+
Cl-‐
Cl-‐
Cl-‐
Cl-‐
Let’s see… So 1.0 molal AgNO3 means 1.0 mol AgNO3 in 1.0 kg water... A
thousand grams of water is 55.6 moles of water… We can’t forget that i = 2 for this salt… Ok, that makes Xwater equal to 0.965. Then Psol’n = 15.9 mmHg.
Psol’n = 0.965 x 16.5 mmHg = 15.9 mmHg
Xwater = 55.6
55.6 + 1.0 x 2 = 0.965
Yup.
3. Calcula(on Ac(vity
15
Ag+
Ag+ NO3
-‐
NO3-‐
Ni2+
Ni2+
Cl-‐
Cl-‐
Cl-‐
Cl-‐
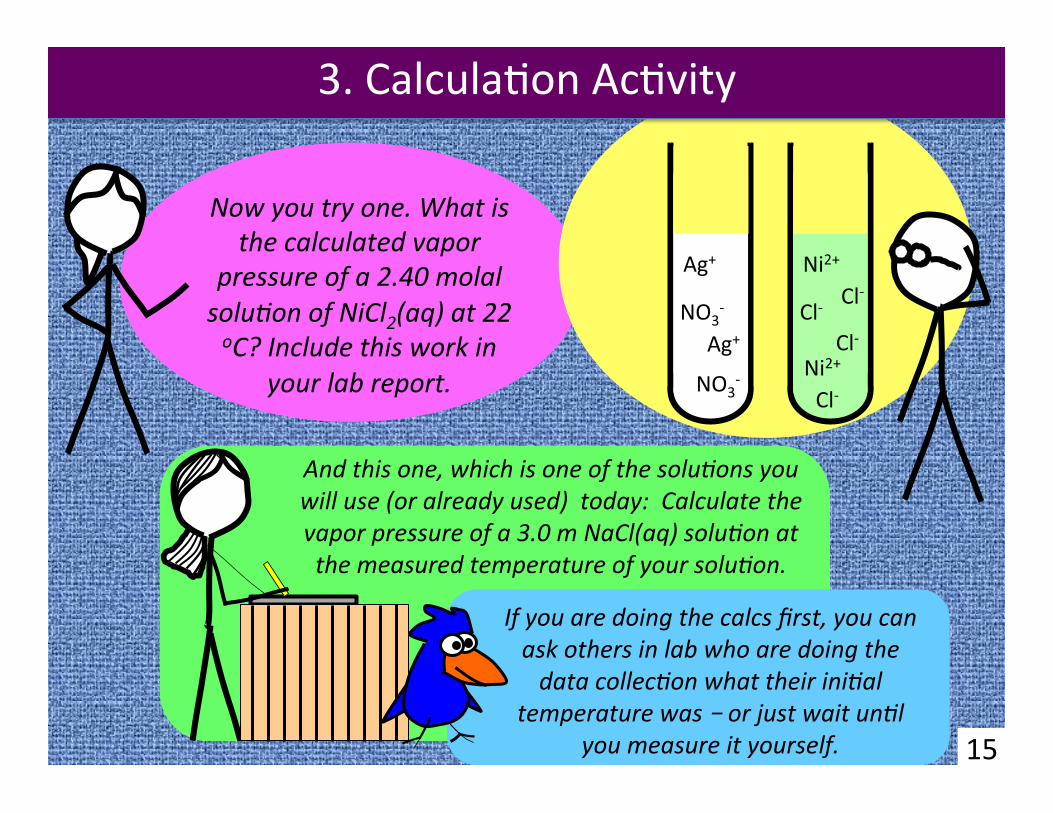
Now you try one. What is the calculated vapor
pressure of a 2.40 molal solu1on of NiCl2(aq) at 22 oC? Include this work in
your lab report.
And this one, which is one of the solu1ons you will use (or already used) today: Calculate the vapor pressure of a 3.0 m NaCl(aq) solu1on at the measured temperature of your solu1on.
If you are doing the calcs first, you can ask others in lab who are doing the data collec1on what their ini1al
temperature was – or just wait un1l you measure it yourself.
3. Calcula(on Ac(vity
16
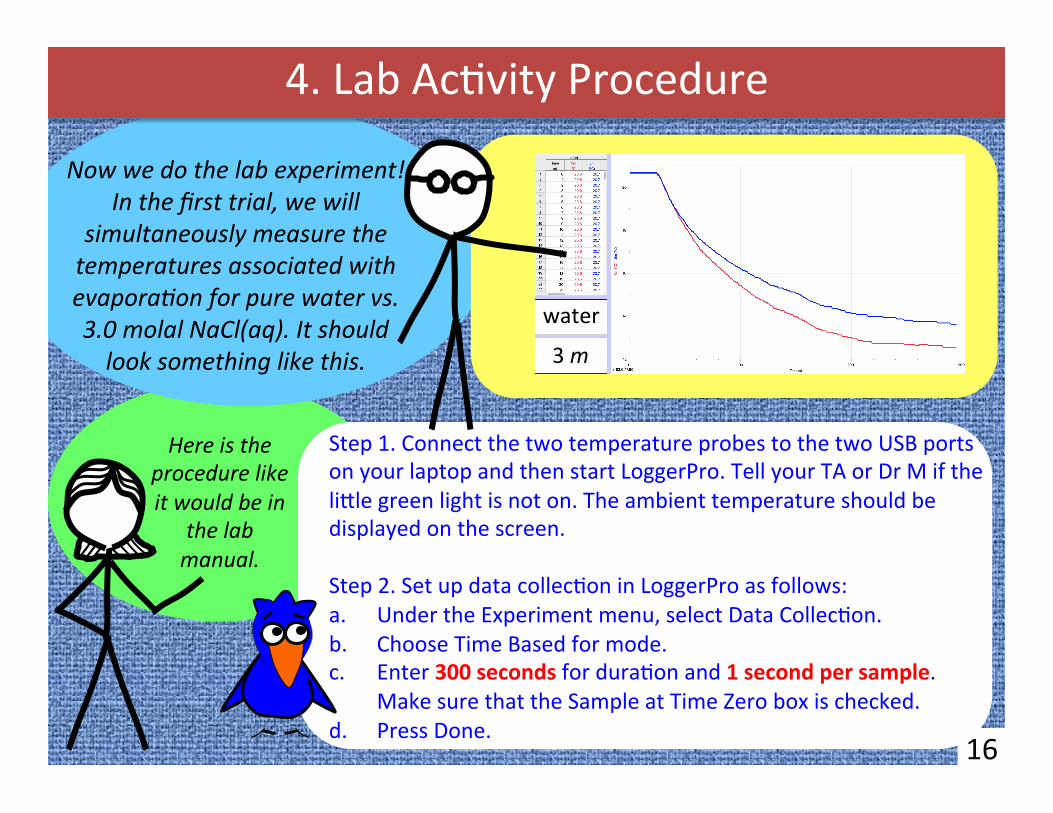
Now we do the lab experiment! In the first trial, we will
simultaneously measure the temperatures associated with evapora1on for pure water vs. 3.0 molal NaCl(aq). It should look something like this.
4. Lab Ac(vity Procedure
Step 1. Connect the two temperature probes to the two USB ports on your laptop and then start LoggerPro. Tell your TA or Dr M if the li^le green light is not on. The ambient temperature should be displayed on the screen. Step 2. Set up data collec(on in LoggerPro as follows: a. Under the Experiment menu, select Data Collec(on. b. Choose Time Based for mode. c. Enter 300 seconds for dura(on and 1 second per sample.
Make sure that the Sample at Time Zero box is checked. d. Press Done.
Here is the procedure like it would be in
the lab manual.
3 m
water
17
4. Lab Ac(vity Procedure
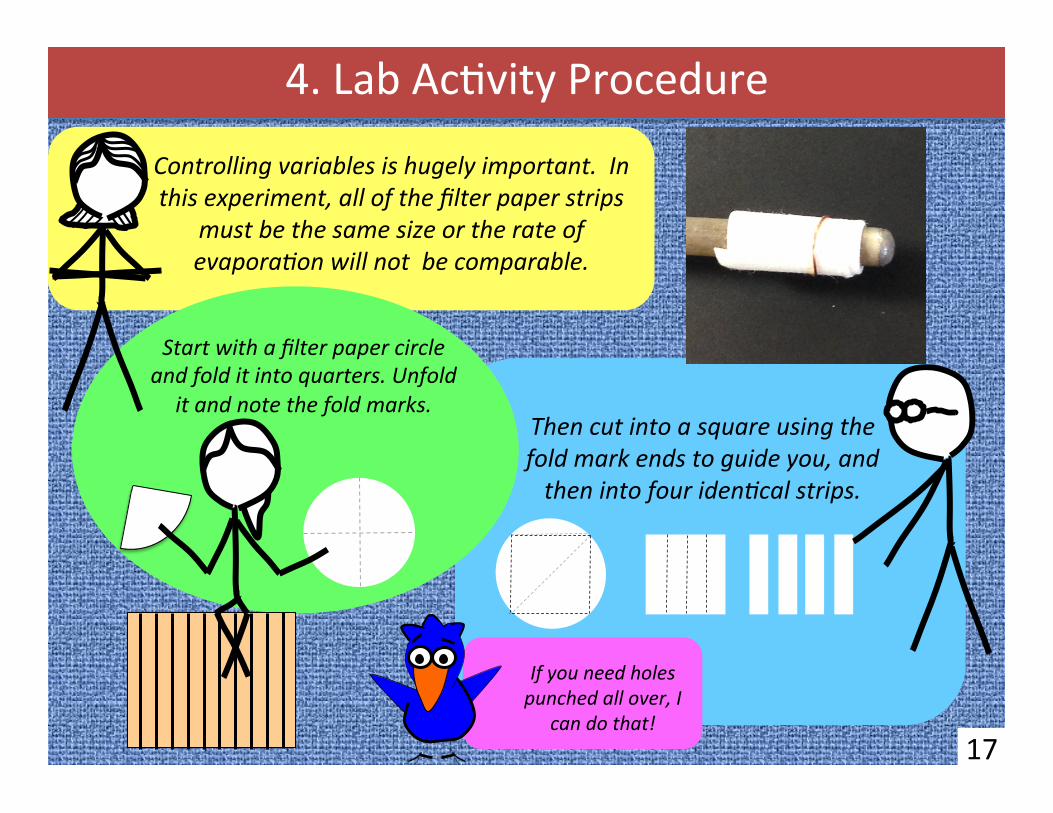
Controlling variables is hugely important. In this experiment, all of the filter paper strips
must be the same size or the rate of evapora1on will not be comparable.
Start with a filter paper circle and fold it into quarters. Unfold
it and note the fold marks. Then cut into a square using the fold mark ends to guide you, and then into four iden1cal strips.
If you need holes punched all over, I
can do that!
18
4. Lab Ac(vity Procedure
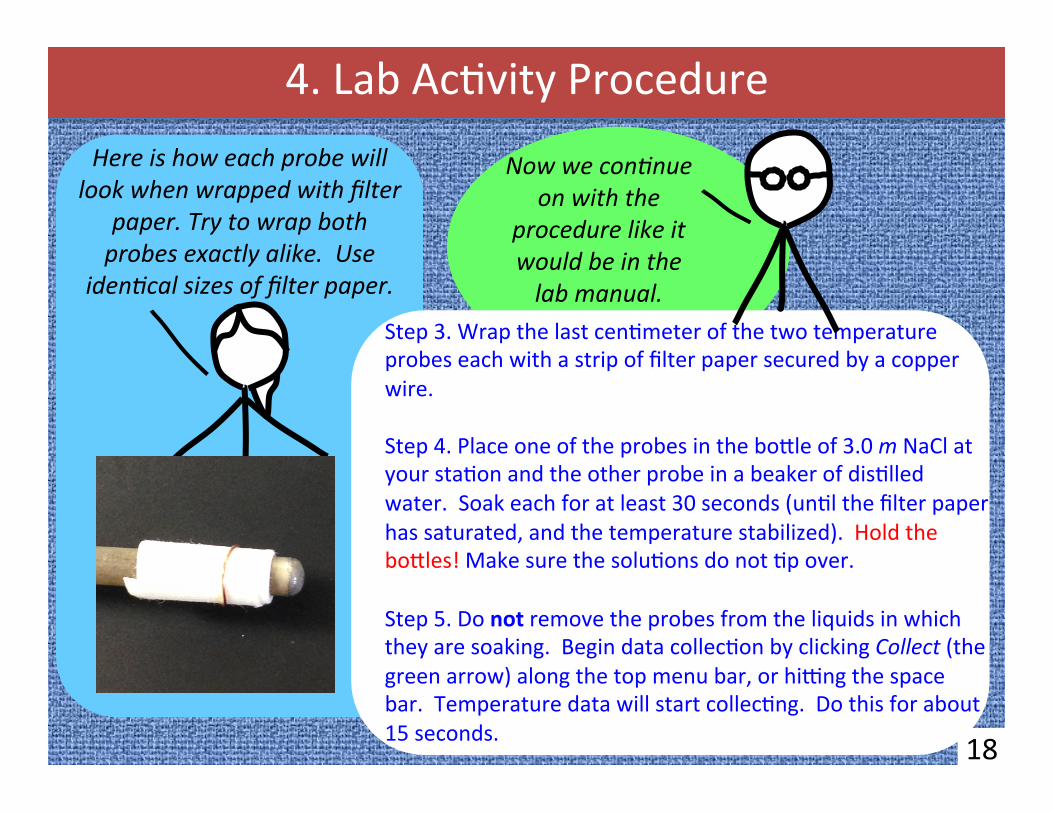
Step 3. Wrap the last cen(meter of the two temperature probes each with a strip of filter paper secured by a copper wire. Step 4. Place one of the probes in the bo^le of 3.0 m NaCl at your sta(on and the other probe in a beaker of dis(lled water. Soak each for at least 30 seconds (un(l the filter paper has saturated, and the temperature stabilized). Hold the bo^les! Make sure the solu(ons do not (p over. Step 5. Do not remove the probes from the liquids in which they are soaking. Begin data collec(on by clicking Collect (the green arrow) along the top menu bar, or hifng the space bar. Temperature data will start collec(ng. Do this for about 15 seconds.
Now we con1nue on with the
procedure like it would be in the lab manual.
Here is how each probe will look when wrapped with filter
paper. Try to wrap both probes exactly alike. Use
iden1cal sizes of filter paper.
19
4. Lab Ac(vity Procedure
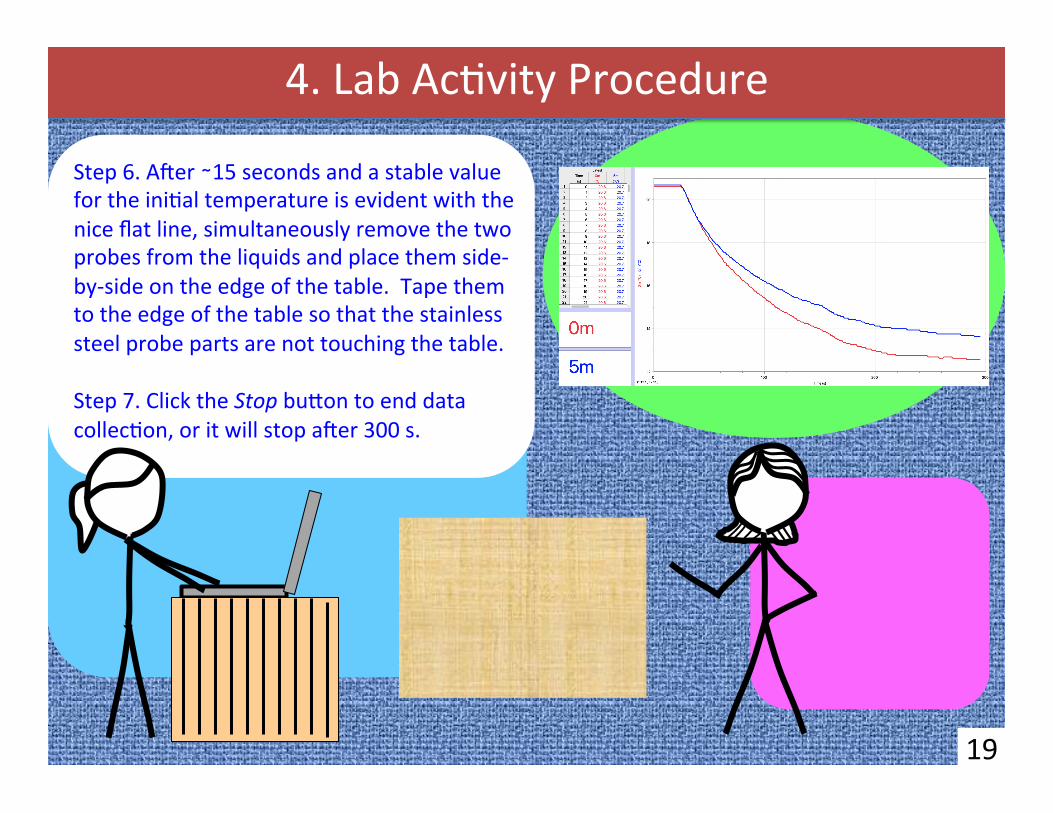
Step 6. Ager ∼15 seconds and a stable value for the ini(al temperature is evident with the nice flat line, simultaneously remove the two probes from the liquids and place them side-‐by-‐side on the edge of the table. Tape them to the edge of the table so that the stainless steel probe parts are not touching the table. Step 7. Click the Stop bu^on to end data collec(on, or it will stop ager 300 s.
See how this minimizes
variables? This is good
experimental design.
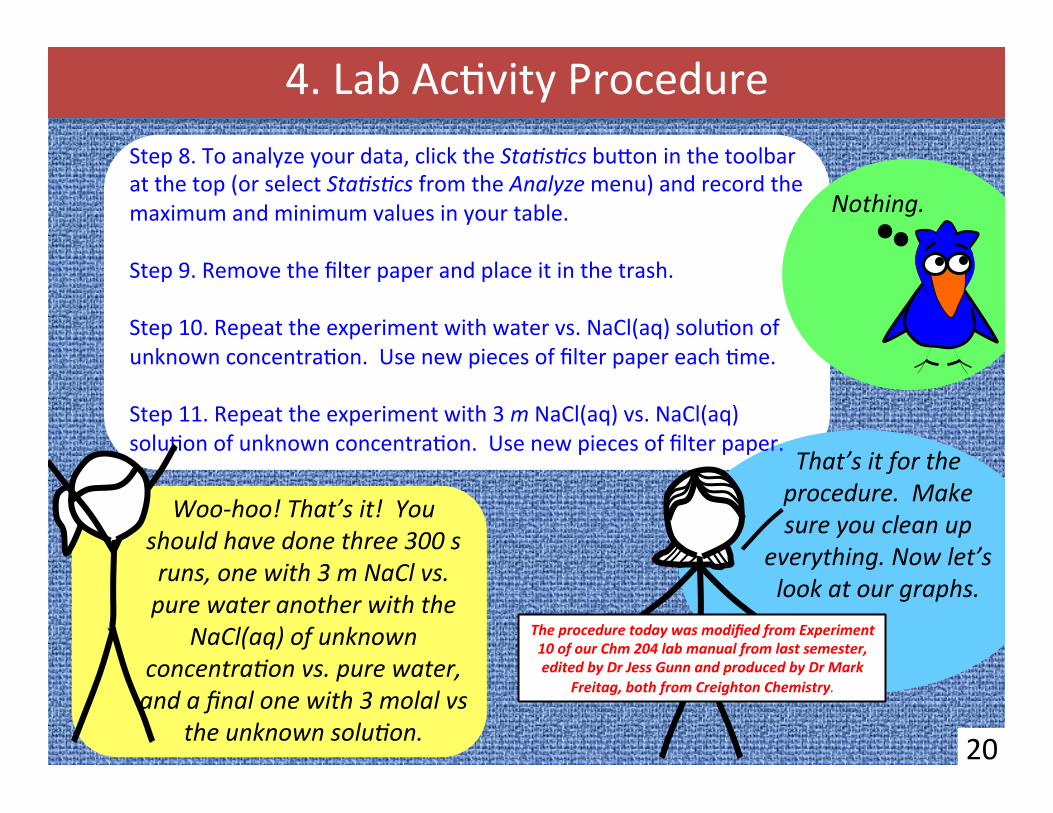
Woo-‐hoo! That’s it! You should have done three 300 s runs, one with 3 m NaCl vs. pure water another with the
NaCl(aq) of unknown concentra1on vs. pure water, and a final one with 3 molal vs
the unknown solu1on.
4. Lab Ac(vity Procedure Step 8. To analyze your data, click the Sta1s1cs bu^on in the toolbar at the top (or select Sta1s1cs from the Analyze menu) and record the maximum and minimum values in your table. Step 9. Remove the filter paper and place it in the trash. Step 10. Repeat the experiment with water vs. NaCl(aq) solu(on of unknown concentra(on. Use new pieces of filter paper each (me. Step 11. Repeat the experiment with 3 m NaCl(aq) vs. NaCl(aq) solu(on of unknown concentra(on. Use new pieces of filter paper.
20 20
The procedure today was modified from Experiment 10 of our Chm 204 lab manual from last semester, edited by Dr Jess Gunn and produced by Dr Mark
Freitag, both from Creighton Chemistry.
That’s it for the procedure. Make sure you clean up
everything. Now let’s look at our graphs.
Nothing.
21
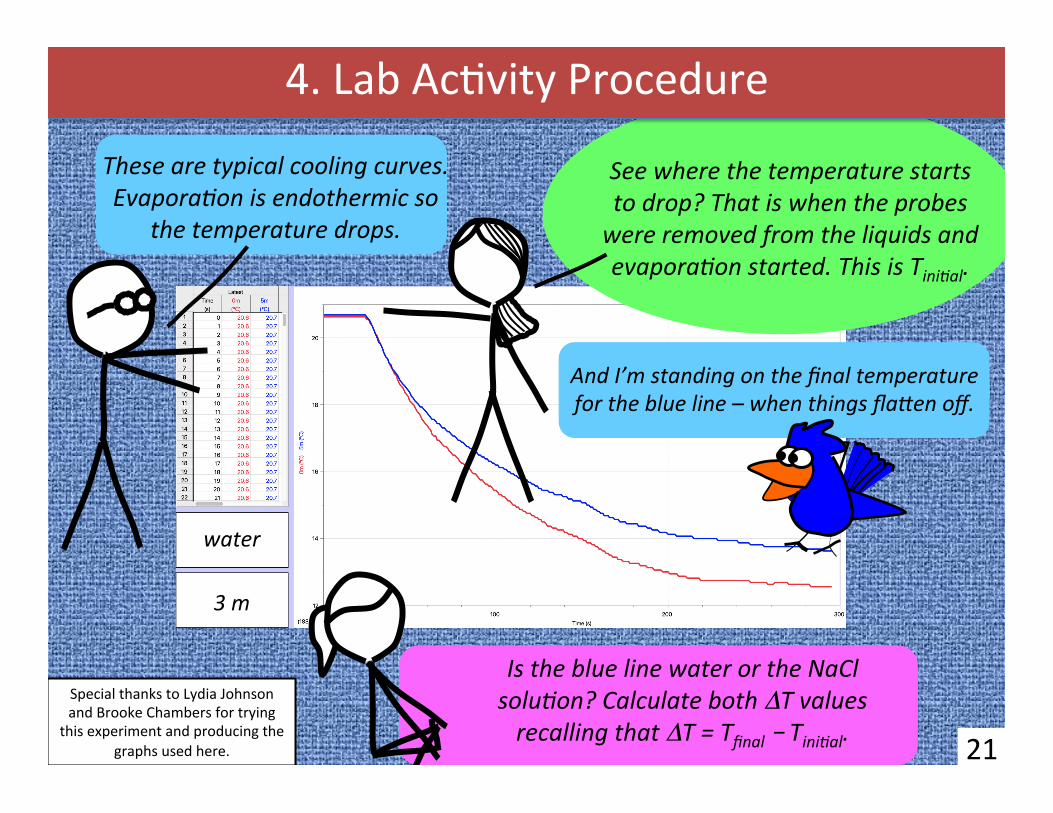
These are typical cooling curves. Evapora1on is endothermic so
the temperature drops.
See where the temperature starts to drop? That is when the probes were removed from the liquids and evapora1on started. This is Tini1al.
Is the blue line water or the NaCl solu1on? Calculate both ΔT values recalling that ΔT = Tfinal – Tini1al.
4. Lab Ac(vity Procedure
And I’m standing on the final temperature for the blue line – when things flaZen off.
Special thanks to Lydia Johnson and Brooke Chambers for trying
this experiment and producing the graphs used here.
3 m
water
S(ck people inspired by xkcd cartoons by Randall Munroe
(www.xkcd.com)
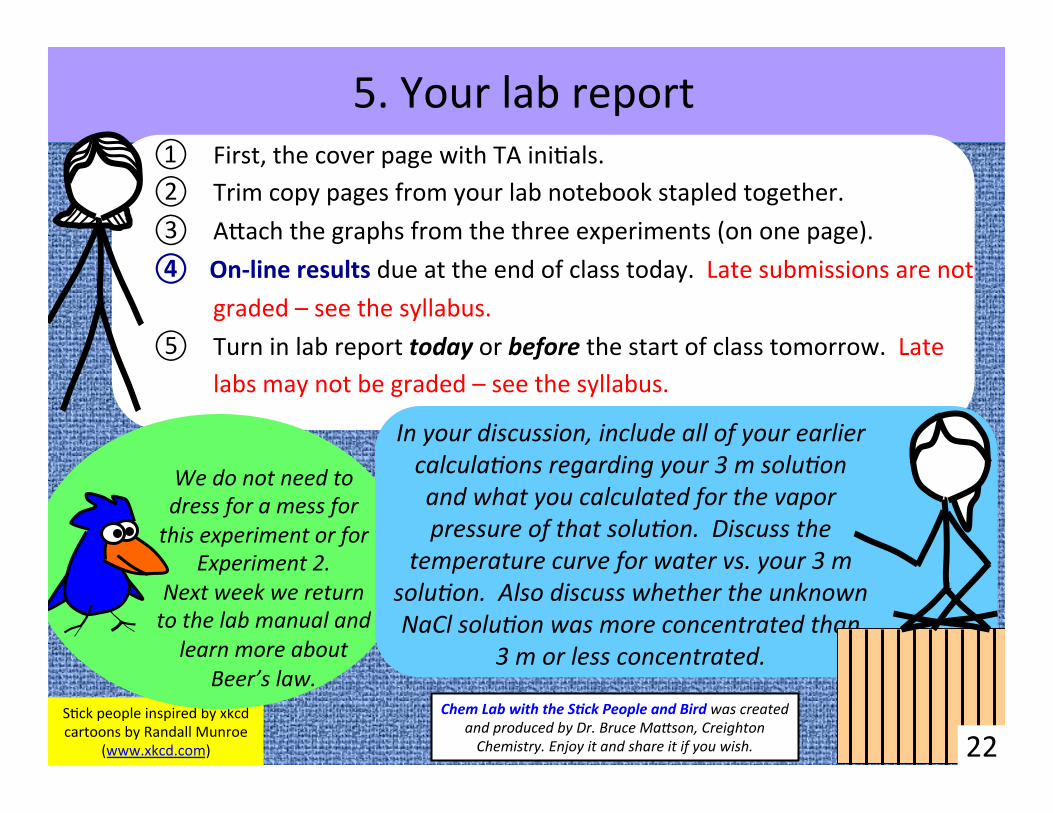
① First, the cover page with TA ini(als. ② Trim copy pages from your lab notebook stapled together. ③ A^ach the graphs from the three experiments (on one page). ④ On-‐line results due at the end of class today. Late submissions are not
graded – see the syllabus. ⑤ Turn in lab report today or before the start of class tomorrow. Late
labs may not be graded – see the syllabus.
5. Your lab report
We do not need to dress for a mess for this experiment or for
Experiment 2. Next week we return to the lab manual and learn more about
Beer’s law.
In your discussion, include all of your earlier calcula1ons regarding your 3 m solu1on and what you calculated for the vapor pressure of that solu1on. Discuss the
temperature curve for water vs. your 3 m solu1on. Also discuss whether the unknown NaCl solu1on was more concentrated than
3 m or less concentrated.
22 Chem Lab with the S)ck People and Bird was created
and produced by Dr. Bruce MaZson, Creighton Chemistry. Enjoy it and share it if you wish.
Top Related