


Languages
Pages
Legal


7/31/2019 Coal Demand and Supply
http://slidepdf.com/reader/full/coal-demand-and-supply 1/23
1
OUTLOOK OF COAL DEMAND/SUPPLY AND POLICY IN INDIA
2009 APEC CLEAN FOSSIL ENERGY TECHNICAL AND POLICY SEMINAR
12TH - 14TH OCTOBER 2009INCHEON, KOREA
7/31/2019 Coal Demand and Supply
http://slidepdf.com/reader/full/coal-demand-and-supply 2/23
Presentation Sturcture
nCoal Sector Overview
nDemand profile
n Production Profile
n Strategic Initiatives
n Policy Challenges
22

7/31/2019 Coal Demand and Supply
http://slidepdf.com/reader/full/coal-demand-and-supply 3/23
Coal Sector Overview
33
7/31/2019 Coal Demand and Supply
http://slidepdf.com/reader/full/coal-demand-and-supply 4/23
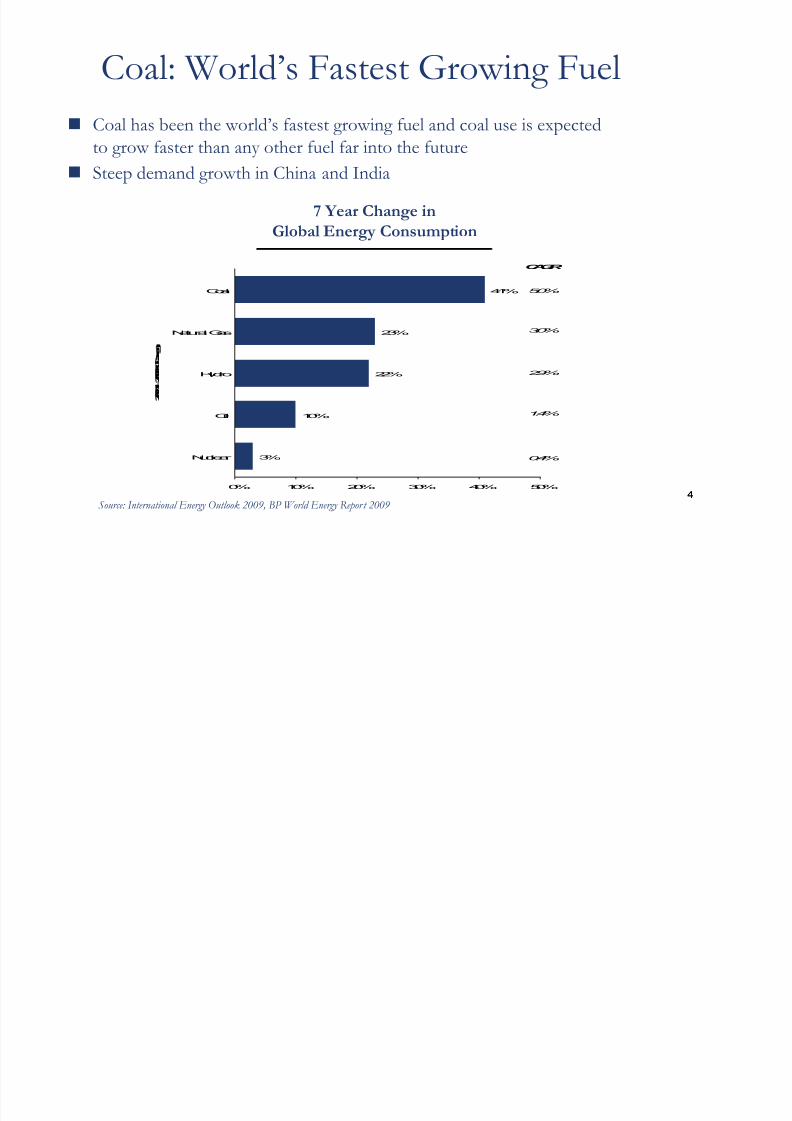
Coal: World’s Fastest Growing Fuel
4
n Coal has been the world’s fastest growing fuel and coal use is expected
to grow faster than any other fuel far into the future
n Steep demand growth in China and India
4
7 Year Change in
Global Energy Consumption
Source: International Energy Outlook 2009, BP World Energy Report 2009
3%
10%
22%
23%
41%
0% 10% 20% 30% 40% 50%
Nuclear
Oil
Hydro
Natural Gas
Coal
2 0 0 1 - 2 0 0 8 C h a n g
CAGR
5.0%
3.0%
2.9%
1.4%
0.4%

7/31/2019 Coal Demand and Supply
http://slidepdf.com/reader/full/coal-demand-and-supply 5/23
Asia’s Most Important Fueln Coal remains a key source of energy in the world
– Provides ~29% of global primary energy needs – Generates ~41% of world’s electricity
n Primarily used for power generation and metallurgy
n Cheapest source of energy on a heat adjusted basis
n Long term secular factors to drive global growth incoal demand
– Growth driven by China and India ~50% of global demand
– Global demand driven by steel and powerindustries and higher cost of competing fuels
– Asian growth driven primarily by powergeneration needs
n Infrastructure and regulatory constraints, access tolow-cost reserves and higher cost structuresimpacting supply
5
Energy Consumption1 (2008)
5
Oil
34.8%
Coal
29.2%
Natural
Gas
24.1%
Hydro electric
6.4%
Nuclear Energy
5.5%
World 11,295 Mtoe
Asia 3,982 Mtoe
Coal
51.0%Oil
29.7%
Natural
Gas
11.0%
Hydro electric
5.3%
Nuclear Energy
3.0%
Source: BP World Energy Report 2009 1 Mtoe= Million tonnes of oil equivalent= 1.5 metric tonnes of hard coal

7/31/2019 Coal Demand and Supply
http://slidepdf.com/reader/full/coal-demand-and-supply 6/23
6
Coal Industry in Indian Total resources
– ~267bn tonnes: 106bn proved,124bn indicated and 37bn inferred
n 81% of production from opencastmines; 19% from underground mines
n Coal present in 14 out of 28 states
n [Indian coal is generally high ash,
~4500 GCV, low Sulfur]
6
Coal Production and Imports
Source: Ministry of Coal, India; Coal India Management
Types of Coal Produced in India
Coking
12.6%
Non Coking
87.1%
Tertiary Coking
0.4%
Coal Reserves in India
India
China
Pakistan
Myanmar
Nepal Bhutan
Sri Lanka
Coalfields
India
China
Pakistan
Myanmar
Nepal Bhutan
Sri Lanka
Coalfields
323.5 343.4 360.9 379.5 403.7
59.163.6 69.9
77.689.3
29.038.6
43.149.8
59.0
411.6445.6
473.9506.9
552.0
0.0
100.0
200.0
300.0
400.0
500.0
600.0
2004-05 2005-06 2006-07 2007-08 2008-09
Coal Others Imports
7/31/2019 Coal Demand and Supply
http://slidepdf.com/reader/full/coal-demand-and-supply 7/23
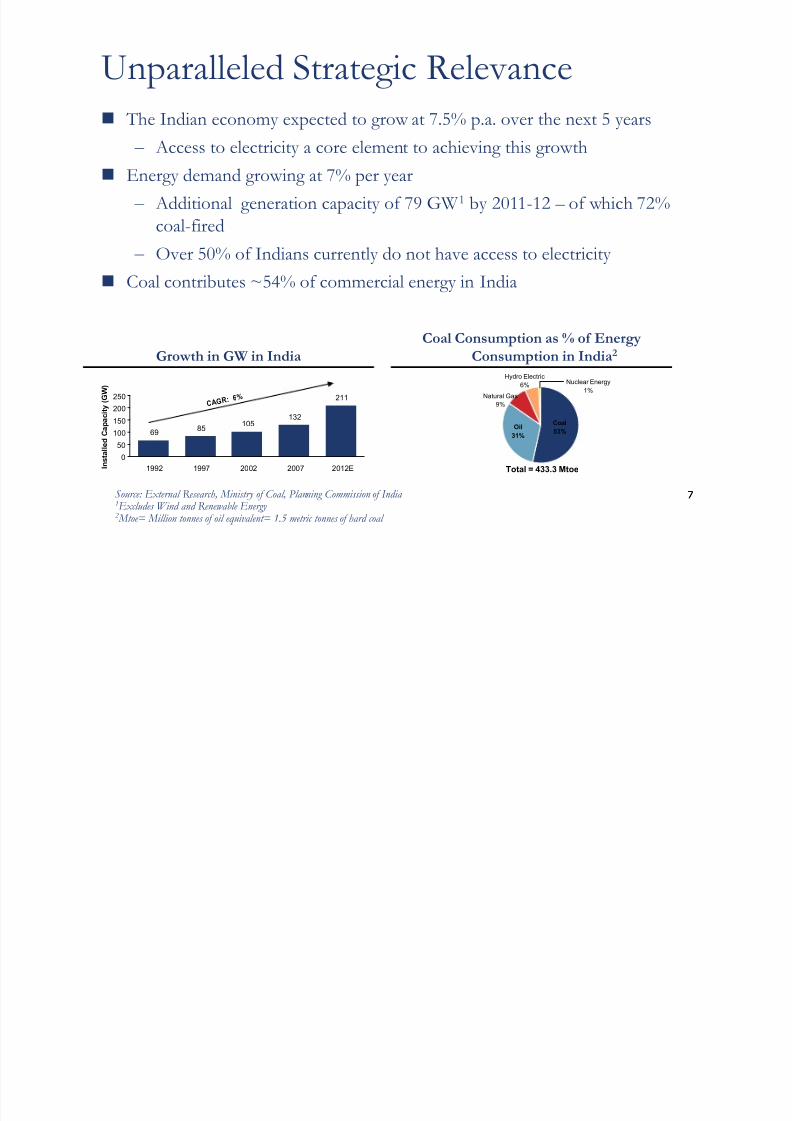
Unparalleled Strategic Relevance
n The Indian economy expected to grow at 7.5% p.a. over the next 5 years
– Access to electricity a core element to achieving this growth
n Energy demand growing at 7% per year
– Additional generation capacity of 79 GW 1 by 2011-12 – of which 72%
coal-fired
– Over 50% of Indians currently do not have access to electricity
n Coal contributes ~54% of commercial energy in India
77
Growth in GW in India
Coal Consumption as % of Energy
Consumption in India2
Coal
53%Oil
31%
Natural Gas
9%
Hydro Electric
6%Nuclear Energy
1%
Total = 433.3 Mtoe
Source: External Research, Ministry of Coal, Planning Commission of India 1 Excludes Wind and Renewable Energy 2 Mtoe= Million tonnes of oil equivalent= 1.5 metric tonnes of hard coal
6985
105132
211
0
50
100
150
200
250
1992 1997 2002 2007 2012E I n s t a l l e d C a p a c i t y ( G W )
CA G R : 6 %
7/31/2019 Coal Demand and Supply
http://slidepdf.com/reader/full/coal-demand-and-supply 8/23
8
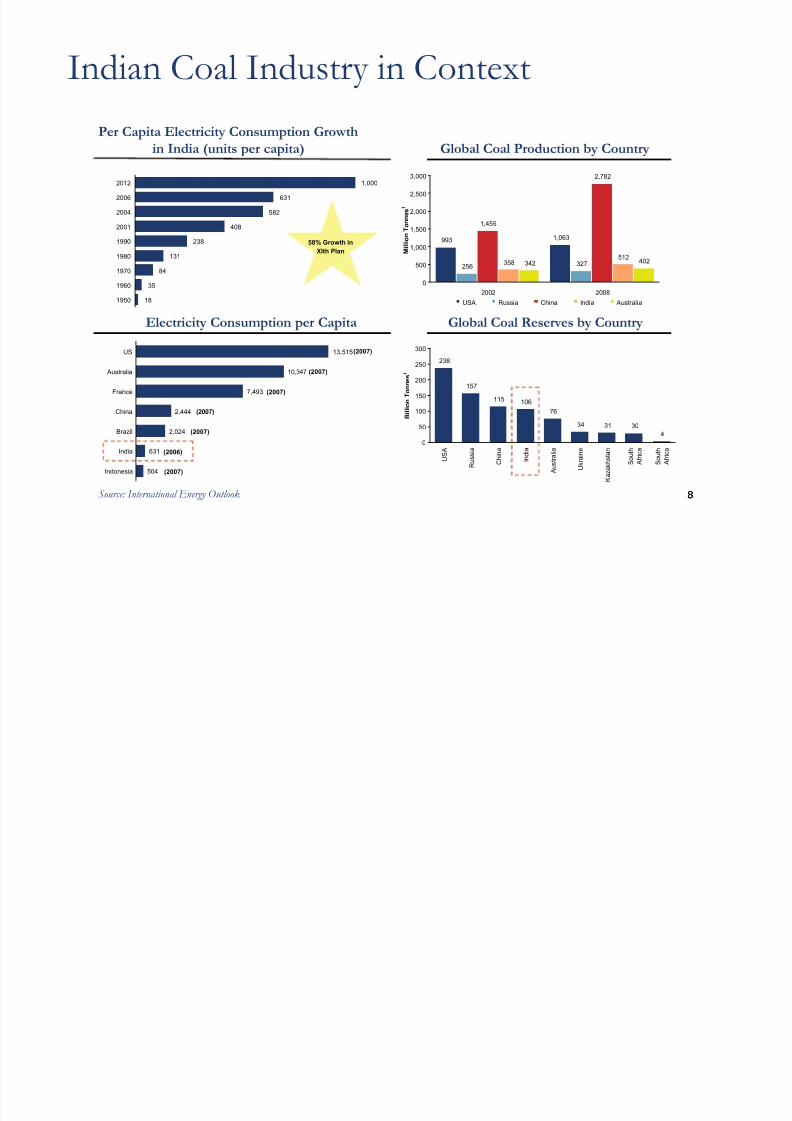
Indian Coal Industry in Context
8
Electricity Consumption per Capita
Source: International Energy Outlook
Per Capita Electricity Consumption Growthin India (units per capita)
Global Coal Reserves by Country
Global Coal Production by Country
238
157
115 106
76
34 31 30
4
0
50
100
150
200
250
300
U S A
R u s s i a
C h i n a
I n d i a
A u s t r a l i a
U k r a i n e
K a z a k h s t a n
S o u t h
A f r i c a
S o u t h
A f r i c a
B i l l i o n T o n n e s
1
504
631
2,024
2,444
7,493
10,347
13,515
Indonesia
India
Brazil
China
France
Australia
US (2007)
(2007)
(2007)
(2007)
(2007)
(2006)
(2007)
18
35
84
131
238
408
582
631
1,000
1950
1960
1970
1980
1990
2001
2004
2006
2012
58% Growth in
XIth Plan
993
256 327
1,455
2,782
358512
342 402
1,063
0
500
1,000
1,500
2,000
2,500
3,000
2002 2008
M i l l i o n T o n n e s
1
USA Russia China India Australia
7/31/2019 Coal Demand and Supply
http://slidepdf.com/reader/full/coal-demand-and-supply 9/23
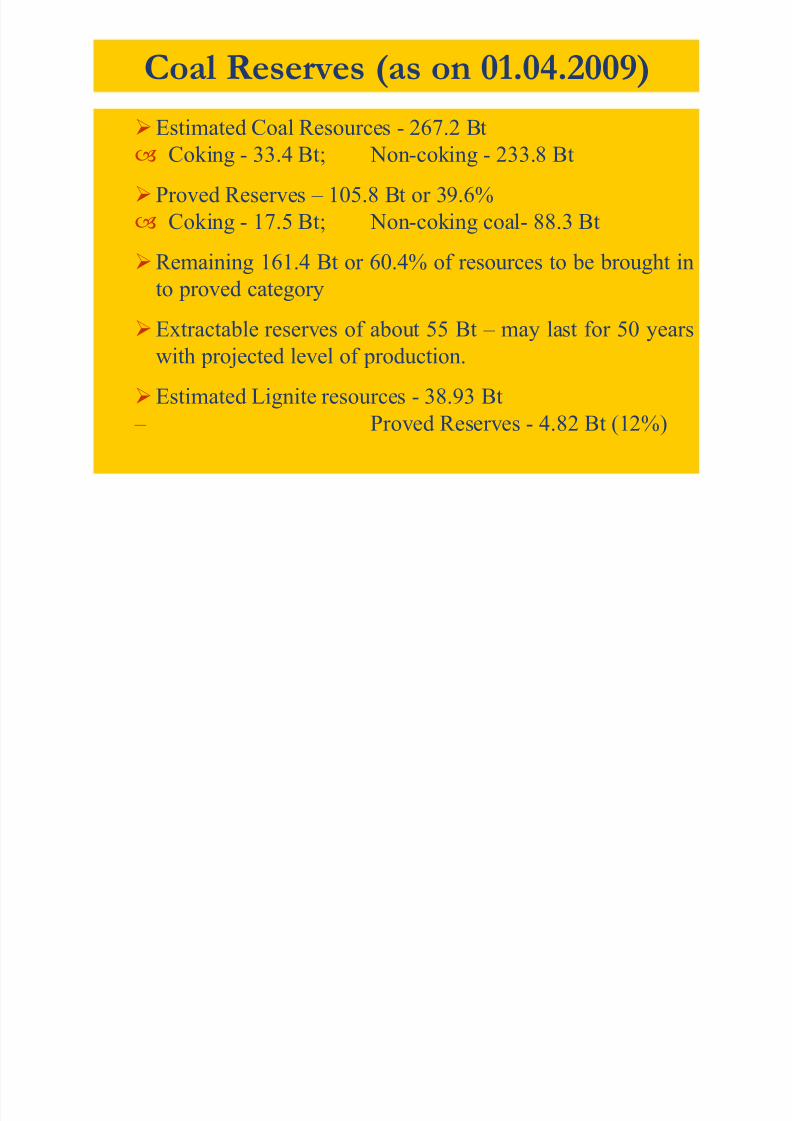
Coal Reserves (as on 01.04.2009)
ØEstimated Coal Resources - 267.2 Bt Coking - 33.4 Bt; Non-coking - 233.8 Bt
ØProved Reserves – 105.8 Bt or 39.6%
Coking - 17.5 Bt; Non-coking coal- 88.3 Bt
ØRemaining 161.4 Bt or 60.4% of resources to be brought in
to proved category
ØExtractable reserves of about 55 Bt – may last for 50 years
with projected level of production.
ØEstimated Lignite resources - 38.93 Bt
– Proved Reserves - 4.82 Bt (12%)
7/31/2019 Coal Demand and Supply
http://slidepdf.com/reader/full/coal-demand-and-supply 10/23
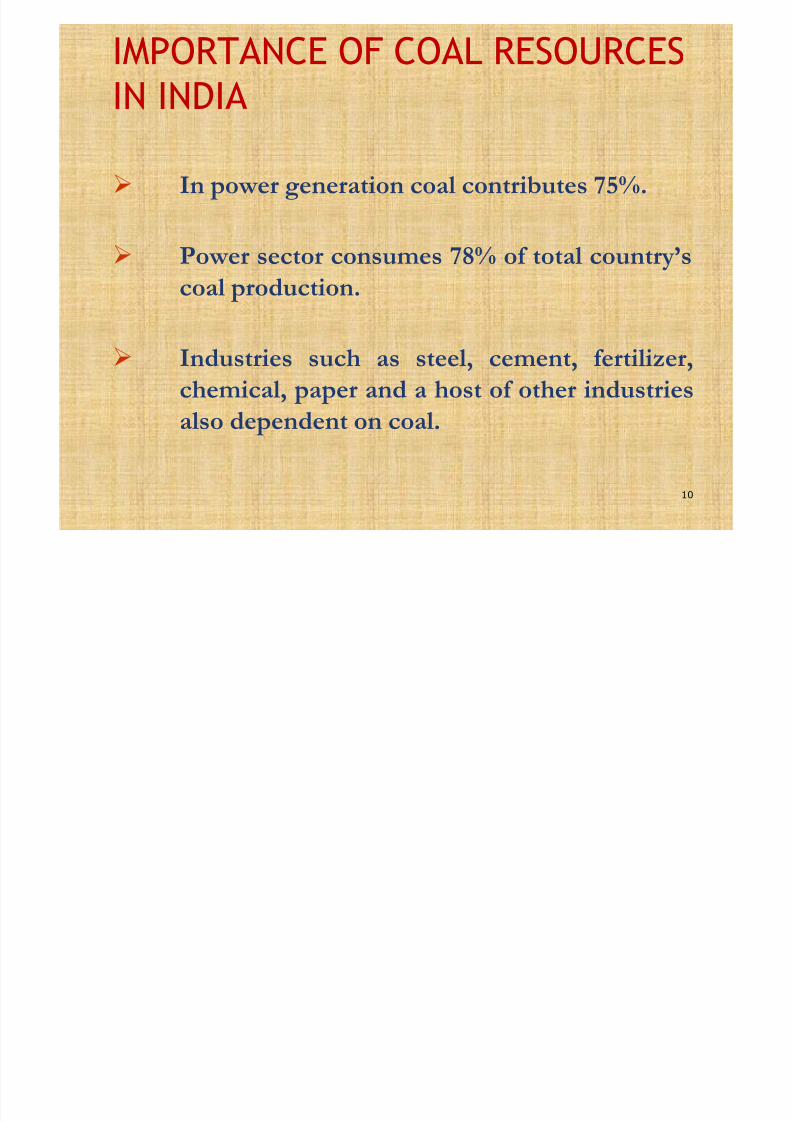
IMPORTANCE OF COAL RESOURCES
IN INDIA
Ø In power generation coal contributes 75%.
Ø Power sector consumes 78% of total country’s
coal production.
Ø Industries such as steel, cement, fertilizer,
chemical, paper and a host of other industries
also dependent on coal.
10
7/31/2019 Coal Demand and Supply
http://slidepdf.com/reader/full/coal-demand-and-supply 11/23
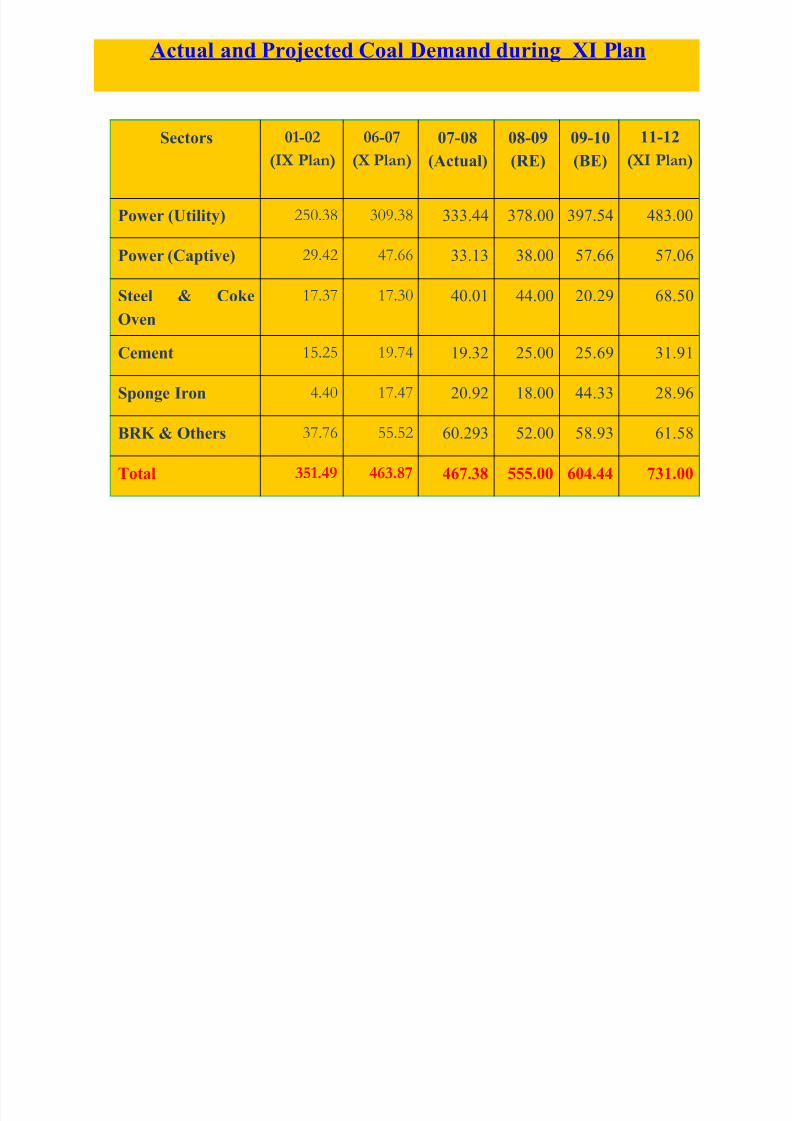
Actual and Projected Coal Demand during XI Plan
731.00604.44555.00467.38463.87351.49Total
61.5858.9352.0060.29355.5237.76BRK & Others
28.9644.3318.0020.9217.474.40Sponge Iron
31.9125.6925.0019.3219.7415.25Cement
68.5020.2944.0040.0117.3017.37Steel & Coke
Oven
57.0657.6638.0033.1347.6629.42Power (Captive)
483.00397.54378.00333.44309.38250.38Power (Utility)
11-12(XI Plan)
09-10(BE)
08-09(RE)
07-08(Actual)
06-07(X Plan)
01-02(IX Plan)
Sectors
7/31/2019 Coal Demand and Supply
http://slidepdf.com/reader/full/coal-demand-and-supply 12/23
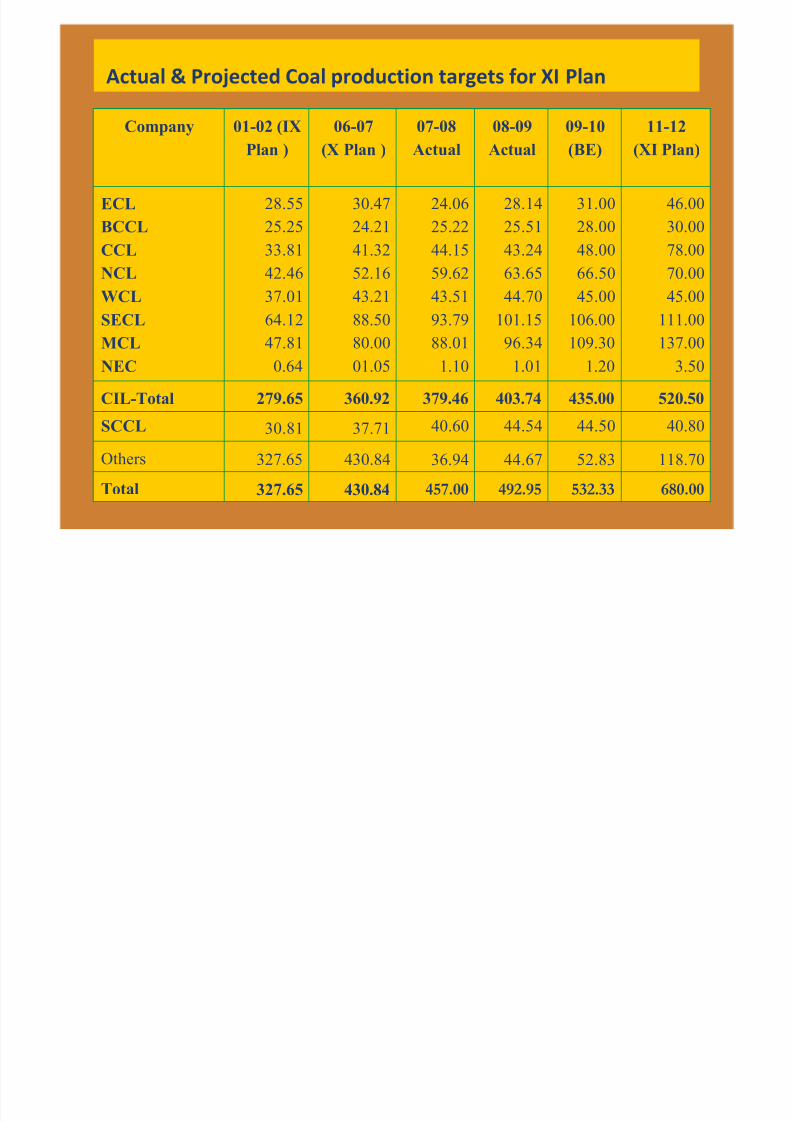
Actual & Projected Coal production targets for XI Plan
12680.00532.33492.95457.00430.84327.65Total
118.7052.8344.6736.94430.84327.65Others
40.8044.5044.5440.6037.7130.81SCCL
520.50435.00403.74379.46360.92279.65CIL-Total
46.00
30.00
78.00
70.0045.00
111.00
137.00
3.50
31.00
28.00
48.00
66.5045.00
106.00
109.30
1.20
28.14
25.51
43.24
63.6544.70
101.15
96.34
1.01
24.06
25.22
44.15
59.6243.51
93.79
88.01
1.10
30.47
24.21
41.32
52.1643.21
88.50
80.00
01.05
28.55
25.25
33.81
42.4637.01
64.12
47.81
0.64
ECL
BCCL
CCL
NCLWCL
SECL
MCL
NEC
11-12
(XI Plan)
09-10
(BE)
08-09
Actual
07-08
Actual
06-07
(X Plan )
01-02 (IX
Plan )
Company

7/31/2019 Coal Demand and Supply
http://slidepdf.com/reader/full/coal-demand-and-supply 13/23
Emerging Demand – Supply Gap in XI Plan
n Actual production from domestic sources - not likely toreach the envisaged level by the terminal year of XIPlan.
n Estimated demand based on existing linkages/ FSAs
and LOAs - outstrips estimated supply projections.nGgap likely to be wider than the gap projected by
Working Group.
13
7/31/2019 Coal Demand and Supply
http://slidepdf.com/reader/full/coal-demand-and-supply 14/23
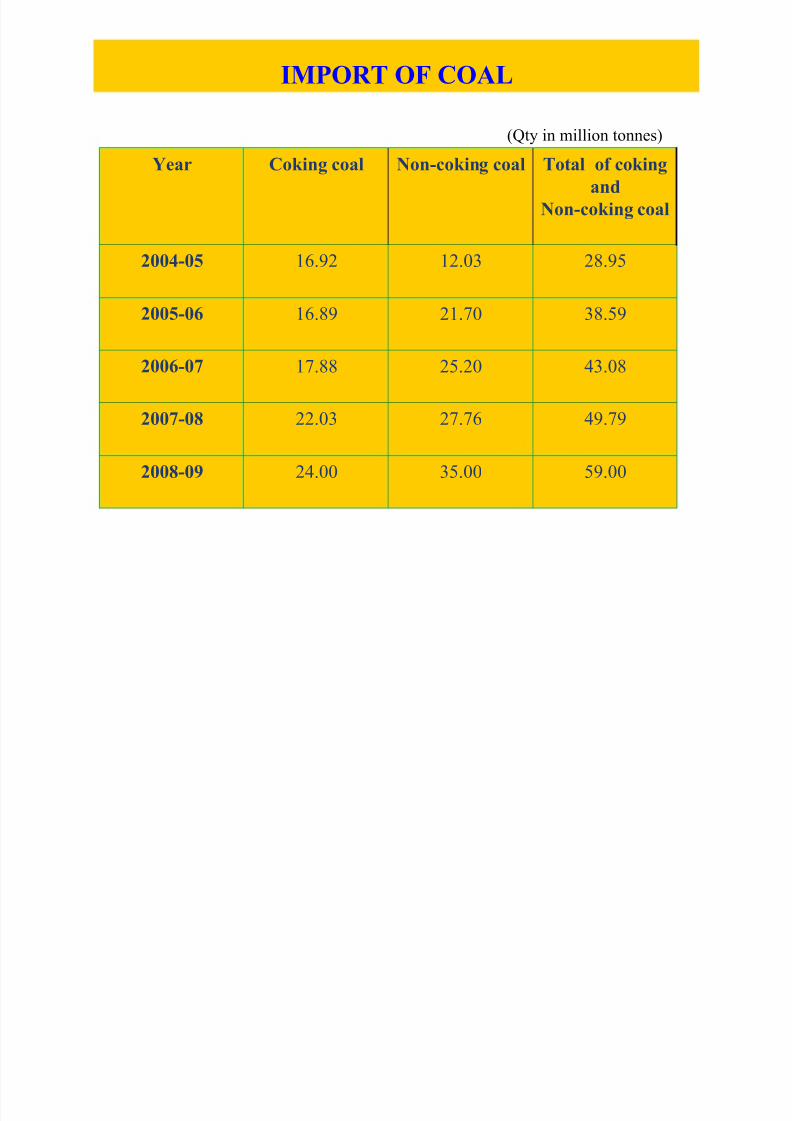
IMPORT OF COAL
59.0035.0024.002008-09
49.7927.7622.032007-08
43.0825.2017.882006-07
38.5921.7016.892005-06
28.9512.0316.922004-05
Total of coking
and
Non-coking coal
Non-coking coalCoking coalYear(Qty in million tonnes)

7/31/2019 Coal Demand and Supply
http://slidepdf.com/reader/full/coal-demand-and-supply 15/23
7/31/2019 Coal Demand and Supply
http://slidepdf.com/reader/full/coal-demand-and-supply 16/23
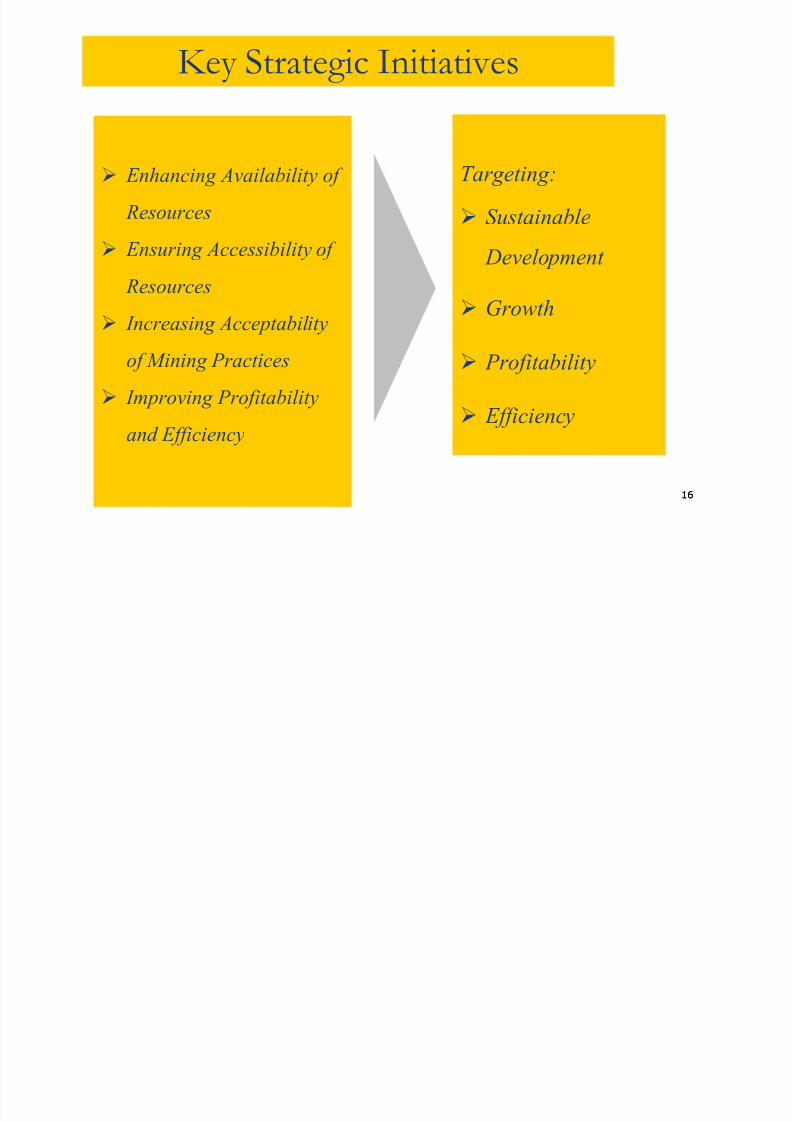
Key Strategic Initiatives
1616
Ø Enhancing Availability of
Resources
Ø Ensuring Accessibility of
Resources
Ø Increasing Acceptability
of Mining Practices
Ø Improving Profitability
and Efficiency
Targeting:
Ø Sustainable
Development
Ø Growth
Ø Profitability
Ø Efficiency

7/31/2019 Coal Demand and Supply
http://slidepdf.com/reader/full/coal-demand-and-supply 17/23
17
Enhancing Availability of Resources
17
EXPLORATION
COAL INVENTORY
n Drilling targets increased 5x
— Convert ‘inferred’ and ‘indicated’ category of reserves to‘proved’ category
n Carrying out detailed drilling and projectisation of coal blocksallocated to captive block owners
n Exploration being carried out in systematic manner to arrive at
reliable estimate of coal reservesn Application of Information Technology to create geo database
PROJECTS
n New projects for ultimate capacity of ~325 Mty in publicsector
n New players to contribute ~450 Mty by 2016-17
FOREIGN
ACQUISITIONS
n Process of acquiring coal resources abroad through equity stake
in working or green field projects — Acquired 2 virgin coal blocks in Mozambique
n Global EoI floated for selection of strategic partners foroverseas operations
7/31/2019 Coal Demand and Supply
http://slidepdf.com/reader/full/coal-demand-and-supply 18/23
P r
1818
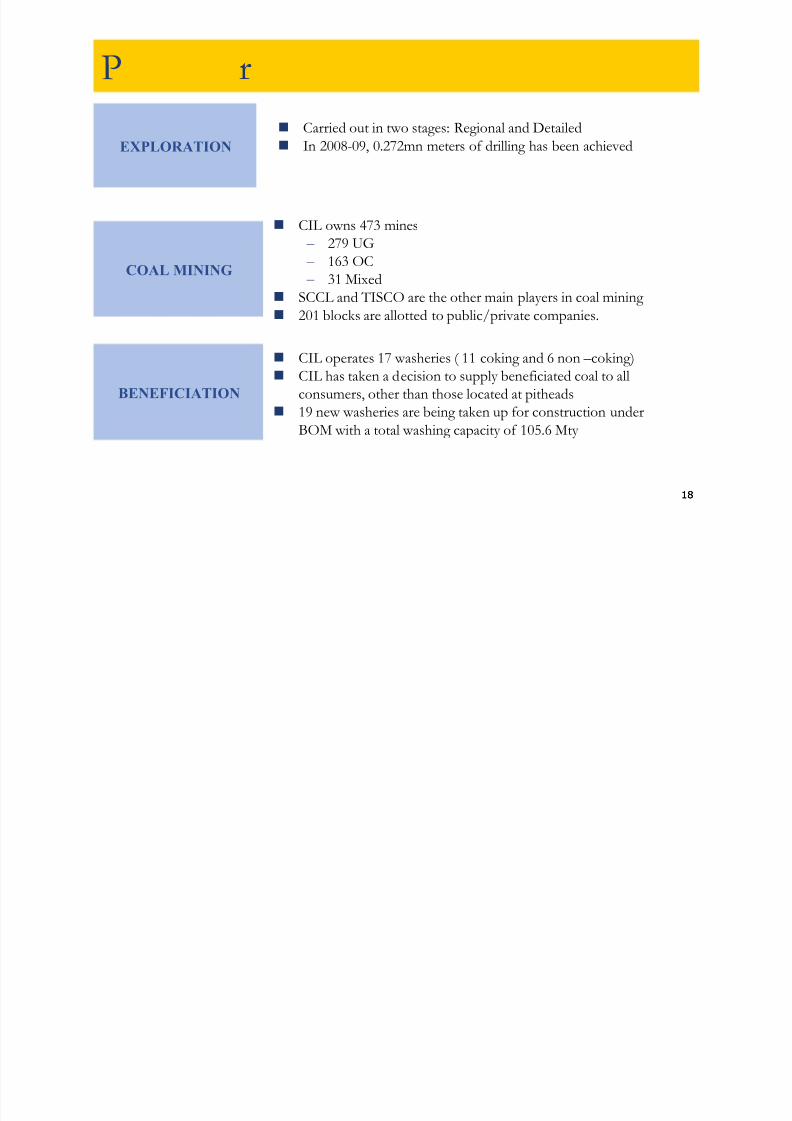
EXPLORATION
COAL MINING
BENEFICIATION
n CIL owns 473 mines
– 279 UG – 163 OC
– 31 Mixedn SCCL and TISCO are the other main players in coal mining
n 201 blocks are allotted to public/private companies.
n CIL operates 17 washeries ( 11 coking and 6 non –coking)
n CIL has taken a decision to supply beneficiated coal to allconsumers, other than those located at pitheads
n19 new washeries are being taken up for construction underBOM with a total washing capacity of 105.6 Mty
n Carried out in two stages: Regional and Detailed
n In 2008-09, 0.272mn meters of drilling has been achieved

7/31/2019 Coal Demand and Supply
http://slidepdf.com/reader/full/coal-demand-and-supply 19/23
19
Ensuring Accessibility of Resources
19
OPENCAST MINING
UNDERGROUND
MINING
n Computer-aided mine planning for deeper OC mines
n Deploying high capacity equipment to achieve economies of scale
n OITDS for efficient fleet managementn State-of-the-Art mass production technology being used
n Tapping large reserves below 300m depth
n 7 UG Greenfield properties being developed
n 18 abandoned mines with estimated reserves over 1600 MTidentified for development
HIGHWALL MINING
n Mining of good quality thin seams
n Recovery of good quality coal in OC mines beyond economicstripping ratio limit
CBM/UCG
n Recovery and commercial utilization of CBM from deep seated
seamsn Underground coal gasification of deep seated seams
7/31/2019 Coal Demand and Supply
http://slidepdf.com/reader/full/coal-demand-and-supply 20/23
20
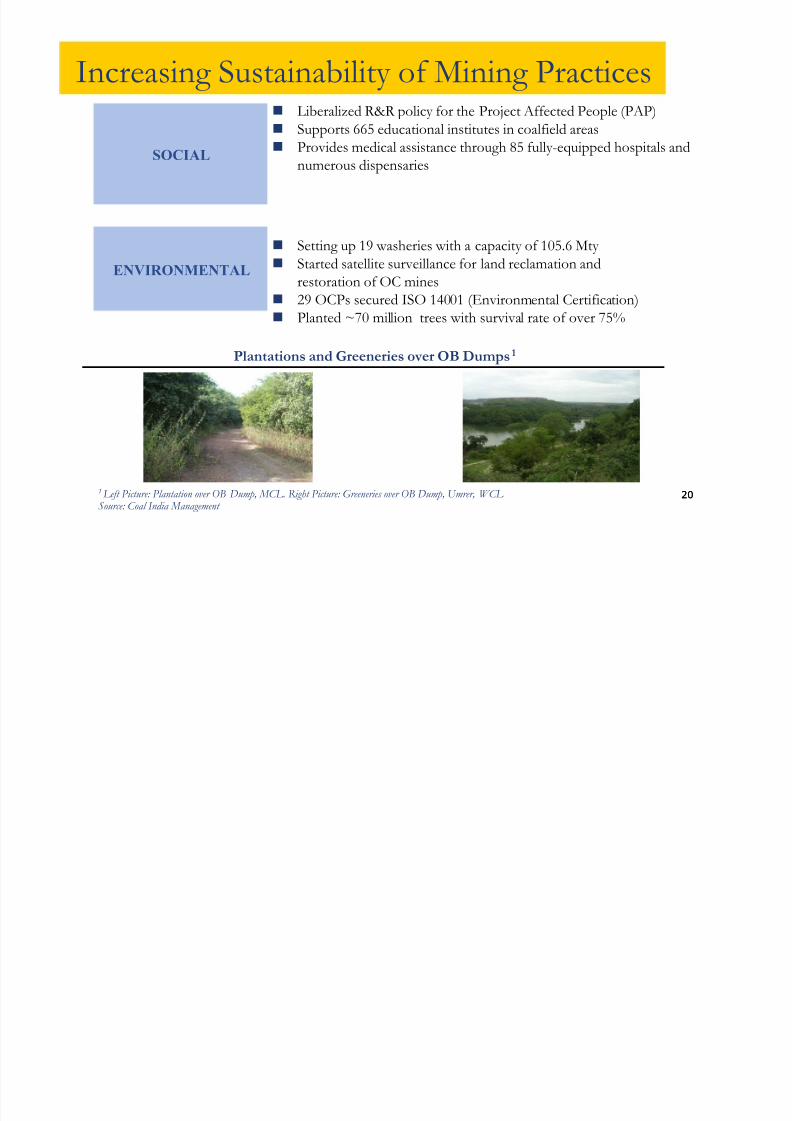
Increasing Sustainability of Mining Practices
20
SOCIAL
n Liberalized R&R policy for the Project Affected People (PAP)
n Supports 665 educational institutes in coalfield areas
n Provides medical assistance through 85 fully-equipped hospitals andnumerous dispensaries
n Setting up 19 washeries with a capacity of 105.6 Mty
n Started satellite surveillance for land reclamation and
restoration of OC minesn 29 OCPs secured ISO 14001 (Environmental Certification)
n Planted ~70 million trees with survival rate of over 75%
ENVIRONMENTAL
Plantations and Greeneries over OB Dumps1
1 Left Picture: Plantation over OB Dump, MCL. Right Picture: Greeneries over OB Dump, Umrer, WCL Source: Coal India Management
7/31/2019 Coal Demand and Supply
http://slidepdf.com/reader/full/coal-demand-and-supply 21/23
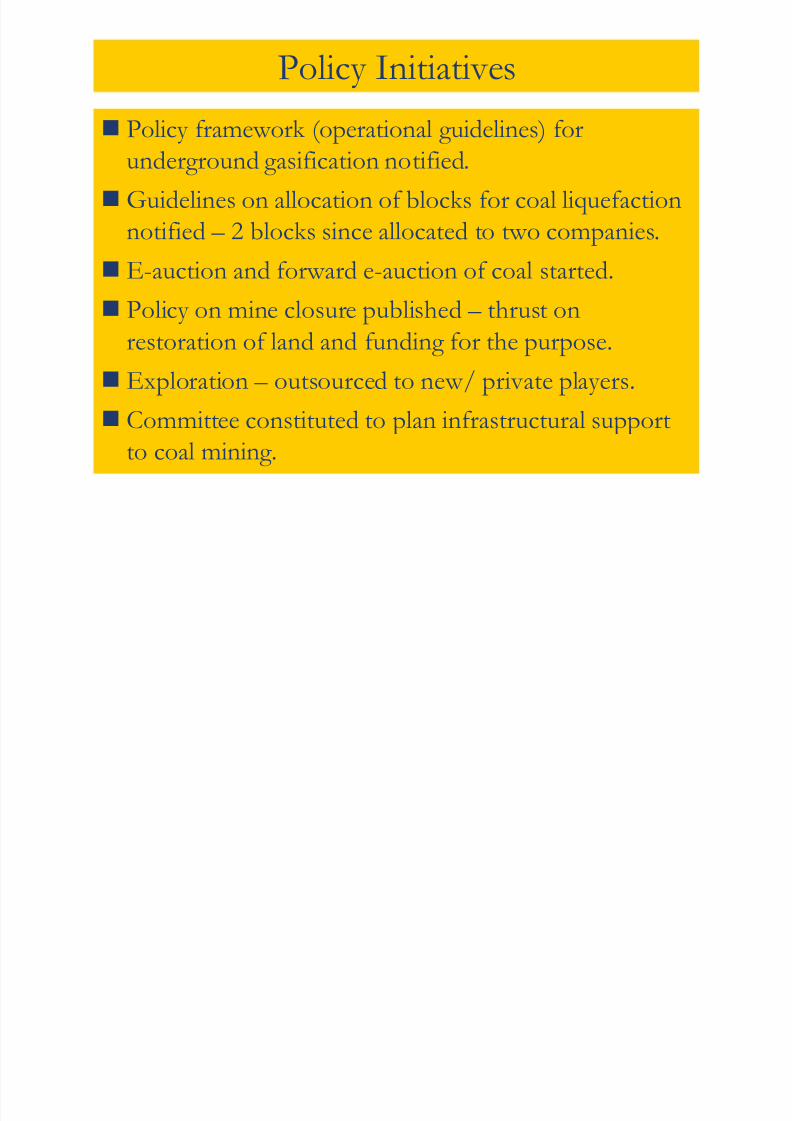
Policy Initiatives
nPolicy framework (operational guidelines) forunderground gasification notified.
nGuidelines on allocation of blocks for coal liquefactionnotified – 2 blocks since allocated to two companies.
nE-auction and forward e-auction of coal started.
n Policy on mine closure published – thrust on
restoration of land and funding for the purpose.
n Exploration – outsourced to new/ private players.
n Committee constituted to plan infrastructural supportto coal mining.

7/31/2019 Coal Demand and Supply
http://slidepdf.com/reader/full/coal-demand-and-supply 22/23
Policy Challenges
n
Opening up of sector – removal of entry barriers :Group of Ministers constituted.
n Independent Regulator – draft Bill (legislation) circula-ted for inter-Ministerial consultation.
n Competitive bidding for grant of concessions – a Bill
(legislation) introduced in the Parliament.n Listing of coal PSEs/ SOEs – for better corporate
governance and market discipline.
n Land use regulation – entire coal bearing area to be
mapped, regulation of use for other purposes.nNew statute on land acquisition, resettlement & rehab.

7/31/2019 Coal Demand and Supply
http://slidepdf.com/reader/full/coal-demand-and-supply 23/23
Thank You!
23
Top Related