


Languages
Pages
Legal


NOAA Technical Memorandum NMFS-PIFSC-36
November 2012
Commonwealth of the Northern Mariana Islands
As a Fishing Community
Stewart D. Allen and Judith R. Amesbury
Pacific Islands Fisheries Science Center National Marine Fisheries Service National Oceanic and Atmospheric Administration U.S. Department of Commerce

About this document
The mission of the National Oceanic and Atmospheric Administration (NOAA) is to
understand and predict changes in the Earth’s environment and to conserve and manage
coastal and oceanic marine resources and habitats to help meet our Nation’s economic,
social, and environmental needs. As a branch of NOAA, the National Marine Fisheries
Service (NMFS) conducts or sponsors research and monitoring programs to improve the
scientific basis for conservation and management decisions. NMFS strives to make
information about the purpose, methods, and results of its scientific studies widely available.
NMFS’ Pacific Islands Fisheries Science Center (PIFSC) uses the NOAA Technical
Memorandum NMFS series to achieve timely dissemination of scientific and technical
information that is of high quality but inappropriate for publication in the formal peer-
reviewed literature. The contents are of broad scope, including technical workshop
proceedings, large data compilations, status reports and reviews, lengthy scientific or
statistical monographs, and more. NOAA Technical Memoranda published by the PIFSC,
although informal, are subjected to extensive review and editing and reflect sound
professional work. Accordingly, they may be referenced in the formal scientific and
technical literature.
A NOAA Technical Memorandum NMFS issued by the PIFSC may be cited using the
following format:
Allen, S. D., and J. R. Amesbury.
2012. Commonwealth of the Northern Mariana Islands as a fishing
community. U.S. Dep. Commer., NOAA Tech. Memo., NOAA-TM-NMFS-
PIFSC-36, 89 p.
__________________________
For further information direct inquiries to
Chief, Scientific Information Services
Pacific Islands Fisheries Science Center
National Marine Fisheries Service
National Oceanic and Atmospheric Administration
U.S. Department of Commerce
2570 Dole Street
Honolulu, Hawai`i 96822-2396
Phone: 808-983-5386
Fax: 808-983-2902
___________________________________________________________
Cover: Courtesy of Judith Amesbury, Micronesian Archeological Research Services

Pacific Islands Fisheries Science Center National Marine Fisheries Service National Oceanic and Atmospheric Administration U.S. Department of Commerce
Commonwealth of the Northern Mariana Islands
As a Fishing Community
Stewart D. Allen Pacific Islands Fisheries Science Center
National Marine Fisheries Service
Socioeconomics and Planning Group
1601 Kapiolani Boulevard, Suite 1000
Honolulu, Hawai`i 96814
Judith R. Amesbury Micronesian Archeological Research Services
P.O. Box 22303
GMF, Guam 96921
NOAA Technical Memorandum NMFS-PIFSC-36
November 2012


iii
Contents
INTRODUCTION AND PURPOSE ............................................................................................... 1
Organization of this Report .................................................................................................... 4
LOCATION AND SETTING ........................................................................................................ 5
HISTORICAL OVERVIEW OF SOCIETY AND FISHERIES .......................................................... 7
Prehistoric Period ...................................................................................................................... 7
Prehistoric Period Fishing .........................................................................................................10
HISTORIC PERIOD ....................................................................................................................14
Spanish Period (1521-1899) ......................................................................................................14
Spanish Period Fishing ..........................................................................................................16
German Period (1899-1914) ......................................................................................................23
German Period Fishing .........................................................................................................25
Japanese Period (1914-1944) .....................................................................................................27
Japanese Period Fishing ........................................................................................................28
American Period Post-War (1944–1979) .....................................................................................29
Fishing during the American Period Post-War (1944-1979). ......................................................31
POPULATION AND ECONOMY SINCE 1980 .............................................................................38
The Economic Boom of the 1980s .............................................................................................38
The Economic Collapse in the late 1990s and 2000s .....................................................................40
Garment Industry .................................................................................................................40
Tourism Industry ..................................................................................................................41
Current Population and Economy ...............................................................................................42
CONTEMPORARY CNMI FISHERIES (1980-PRESENT) .............................................................48
Sociocultural Importance of Fishing ...........................................................................................48
Small Boat Fleet ......................................................................................................................50
Saipan .................................................................................................................................52
Tinian .................................................................................................................................56
Rota ....................................................................................................................................56
2011 Survey of CNMI Small Boat Fishermen ..............................................................................57
Saipan Fishermen’s Association ................................................................................................60
Commercial Fishery Statistics ...................................................................................................61

iv
Longlining in the CNMI ........................................................................................................65
FISHERIES GOVERNANCE AND INSTITUTIONS .....................................................................65
Federal Government .................................................................................................................65
Division of Fish and Wildlife ....................................................................................................66
CNMI Coral Reef Initiative Program ..........................................................................................69
Coastal Resources Management (CRM) Program .........................................................................70
Western Pacific Regional Fishery Management Council ...............................................................71
Marianas Trench Marine National Monument .............................................................................72
ISSUES AFFECTING CNMI AS A FISHING COMMUNITY .........................................................74
The Declining Economy ...........................................................................................................76
Federal Regulations and Involvement .........................................................................................76
Saipan Fishermen’s Cooperative Association ..............................................................................77
Fishing as Economic Development ............................................................................................78
Trends in Fishing Patterns .........................................................................................................79
REFERENCES ...........................................................................................................................81

INTRODUCTION AND PURPOSE
This report describes the Commonwealth of the Northern Mariana Islands (CNMI) as a fishing
community. We have tried to strike a balance between the report being concise enough to be
useful while covering the full range of topics and issues necessary to describe CNMI as a fishing
community. Readers are encouraged to let us know if we have missed an event, activity or
research report that is part of the story of the social, cultural, and economic importance of fishing
in CNMI. We will update the report periodically, as social, economic, and environmental
conditions change and fishermen and fisheries management adapt to those changes.
We will define below what is meant legally by a fishing community. However, Lee Cataluna’s
column in the Honolulu Advertiser, June 11, 2002, captures the social, collective nature of
community:
When we talk about “community” we tend to think of structures and
infrastructure: rows of houses on well-lit streets, fire stations, gas stations, a
Longs down the street if you’re lucky. But a strong community isn’t just a
bunch of people who live next to each other and all keep their lawns mowed;
it’s a group of people who work together for a common good.
In his book, The Rope of Tradition, Lino Olopai (2005) talked about his experiences as a
fisherman and navigator, and about being Carolinian in a changing world. At one point he
described how it felt when he moved to Honolulu and became immersed in American culture,
and the contrast with the family and community focus of life in the village. His thoughts also
reflect the spirit of community:
At home on Saipan I had been used to always thinking about family and not
just about myself…I had been used to working to help the family, so I felt
guilty when I wasn’t contributing to society in Honolulu (p. 195).
The legal concept of a fishing community comes from the Magnuson Fishery Conservation and
Management Act, reauthorized in 1996 and amended by enactment of the Sustainable Fisheries
Act (SFA), which also renamed it the Magnuson-Stevens Fishery Conservation and Management
Act (MSA). The MSA requires Fishery Management Councils to amend existing fishery
management plans and, among other things, pay more attention to human fishing communities.
MSA National Standard 8 (NS8) specifies that:
Conservation and management measures shall, consistent with the conservation
requirements of this Act (including the prevention of overfishing and the
rebuilding of overfished stocks), take into account the importance of fishery
resources to fishing communities in order to (A) provide for the sustained
participation of such communities, and (B) to the extent practicable, minimize
adverse economic impacts on such communities (MSA Section 301(a)(8)).

2
The amendments also defined fishing community:
The term “fishing community” means a community which is substantially
dependent on or substantially engaged in the harvest or processing of fishery
resources to meet social and economic needs, and includes fishing vessel owners,
operators, and crew and United States fish processors that are based in such
community. (MSA Section 3(16))
The National Standard Guidelines (50 CFR 600.345(b)(3)) provided additional definition of
fishing communities:
A fishing community is a social or economic group whose members reside in a
specific location and share a common dependency on commercial, recreational, or
subsistence fishing or on directly related fisheries-dependent services and
industries (for example, boatyards, ice suppliers, tackle shops).
In response to the mandate of MSA to identify and describe fishing communities, the Western
Pacific Regional Fishery Management Council (Council) proposed that each of the major island
areas (Hawaii, Guam, American Samoa, and the Commonwealth of the Northern Mariana
Islands) be identified as a fishing community, because
In contrast to most U.S. mainland residents, who have little contact with the
marine environment, a large proportion of the people living in the western pacific
region observe and interact daily with the ocean for food, income and
recreation…fishing also continues to contribute to the cultural integrity and social
cohesion of island communities…In each island area within the region the
residential distribution of individuals who are substantially dependent on or
substantially engaged in the harvest or processing of fishery resources
approximates the total population distribution. These individuals are not set
apart…from island populations as a whole (September 1998, p. 52-53).
On April 19, 1999, the National Marine Fisheries Service (NMFS) approved identification of
American Samoa, the Northern Mariana Islands, and Guam as fishing communities (64 FR
19067). NMFS rejected the characterization of the State of Hawaii as a fishing community,
saying it was overly broad and encouraged the Council to identify fishing communities in Hawaii
at smaller scales.1
Another definition of fishing communities provides additional insight into the type of
information useful in fishing community profiles. The Community Demonstration Project
Program was designed by the Council to promote involvement of western Pacific communities in
western Pacific fisheries. The program gives grants to 3-5 communities for fisheries
demonstration projects to foster and promote traditional indigenous fishing practices. Program
goals are to demonstrate application or adaptation of methods and concepts derived from
1 In 2004, NMFS approved a Council recommendation to identify each of the inhabited, main islands of the State of
Hawaii as a fishing community (Kauai, Niihau, Oahu, Maui, Molokai, Lanai, and the island of Hawaii).

3
traditional indigenous practices, to enhance opportunities for communities to participate in
fisheries, and to benefit indigenous communities that haven’t been able to sustain participation in
fisheries or marine resource management of their native lands. The program’s definition of
fishing community reflects its purposes and links well to program priorities:
A population of non-transient people descended from the aboriginal people
indigenous to the area who share a common history based on social, cultural,
and economic interactions and a functional relationship sustained by
participation in fishing and fishing related activities. Priorities are promoting
fishery resource stewardship, and community economic growth and stability,
self-determination, and solidarity.
The first part defines the nature of community by emphasizing social, cultural, and economic
interactions in a certain place. The second part, which corresponds to NS8's language on
substantial dependence or engagement, characterizes a fishing community as being sustained
socially, culturally, and economically through fishing and related activities.
The description of CNMI as a fishing community is especially relevant because NMFS and the
Council are shifting to an ecosystem-based approach to fisheries management. One aspect of this
approach is facilitating community-based management (WPRFMC, 2009a). Management of
natural resources is usually discussed in terms of scientific research and government regulation
without regard to the level of public confidence and cooperation in the process. However, an
ecosystem-based approach recognizes that responsible actions by citizens and communities are
necessary for long-term wise use of marine resources. In some cases, localization can rebuild the
connections to the natural world lost in the current globalized and transient society.
In August 2004, President Bush issued Executive Order 13352 to promote partnerships between
federal agencies and states, local governments, tribes, and individuals that will facilitate
cooperative conservation and appropriate inclusion of local participation in federal decision-
making regarding the Nation’s natural resources. Similarly, the U.S. Ocean Action Plan (2004),
the Bush Administration’s Response to the U.S. Commission on Ocean Policy, found that “local
involvement by those closest to the resource and their communities is critical to ensuring
successful, effective, and long-lasting conservation results.” Evidence indicates that many
community-based approaches in U.S. land management are achieving success (Yaffee, 1999;
McCaffrey, 2006; Cheng and Fernandez-Gimenez, 2006), and there has been increasing
emphasis on community-based approaches to natural resource management worldwide (Birkes et
al., 2000; Cheng and Fernandez-Gimenez, 2006). For example, subsistence fisheries in the
Pacific may best be managed through community involvement (King and Lambeth, 2000).
Ecosystem-based management is made up of many interrelated components and integrated
activities. Species management cannot be conducted effectively without consideration of other
components of the marine ecosystem, upstream watershed, and political, cultural, and economic
influences. Just as biodiversity can strengthen the resilience of natural systems, diversity in
management approaches, such as connecting community-based initiatives with governmental
programs, can provide a valuable contribution that allows for locally relevant management
strategies. The Council’s fishery ecosystem plans (FEP) are focused on community

4
collaboration, participation, and partnership (WPRFMC, 2009a). Successful resource
management will need to incorporate the perspectives of both local and national stakeholder
groups in a transparent process that explicitly addresses issues of values, fairness, and identity.
The Council’s FEPs organize management by archipelago, so Guam and CNMI are contained in
a single Marianas Archipelago FEP. This report thus should be considered in tandem with the
report on Guam as a Fishing Community (Allen and Bartram, 2008). It also serves as a
sociological counterpart to biophysical descriptions of Mariana archipelago marine resources (for
example Brainard and others 2012).
Organization of this Report
The next chapter provides an overview of the location and environmental setting of CNMI,
followed by a history of settlement, population, and fishing traditions until about 1980. The
subsequent chapters describe recent and current socioeconomic conditions in the CNMI and
provide a contemporary snapshot of fishing, its socioeconomic and cultural importance, and
management institutions. The final chapter identifies some key issues that can be monitored to
help assess the ways in which CNMI is changing as a fishing community.
Photo 1.--The plaque on The 13 Fishermen Memorial Monument on Beach Road in Garapan, Saipan.
Family members and friends of the 13 fishermen lost at sea aboard M/V Olwol during Typhoon Ben on
September 23, 1986, continue to observe the anniversary of their deaths with a Mass followed by a
gathering near the monument (David, 2010). The names of the 13 fishermen are Isidro R. Romolor, Jose
T. Igisaiar, Silvestre R. Selepeo, Joaquin L. Moteisou, Juan Benusto R. Olopai, Enrique L. Moteisou,
Guillermo Saures, Benusto M. Lisua, Joseph R. Kaipat, Petro L Mettao, Martin L. Saures, Joseph T.
Lisua, and Jovencio C. Falguera. The names of two other fishermen, Emilio T. Lisua and Antonio S.
Fitial, who died on the same day, are included on the monument. Photo Credit: J. Amesbury.

5
LOCATION AND SETTING
The Commonwealth of the Northern Mariana Islands lies between 14° and 21° north latitude at
about 145° east longitude (Fig. 1). The geological division of the Mariana Archipelago differs
from the political division. Politically there are 2 entities, Guam and the CNMI. The latter is
made up of the 14 islands north of Guam, while the former encompasses only the island of
Guam. Geologically there are 2 island arcs. The southern arc includes the 6 islands from Guam
to Farallon de Medinilla, while the northern arc includes the 9 islands from Anatahan to Uracas.
Figure 1.--Mariana Islands. Map courtesy of Barry Smith, University of Guam Marine
Laboratory.
The southern arc islands, which began to form about 43 million years ago (Randall, 1995), are
older and larger than the islands of the northern arc. They are raised limestone islands with
volcanic cores and well-developed reef flats and coral reefs. The southern arc islands are much
more densely inhabited by people and, according to one survey, have nearly twice as many
species of fishes as the islands of the northern arc (Donaldson et al., 1994) and much higher
levels of biomass of larger fish (Starmer et al., 2008).
The northern arc islands are younger, smaller, high volcanic islands with steep slopes and limited
coral development. They are still volcanically active. Pagan erupted in 1981 and Anatahan
6
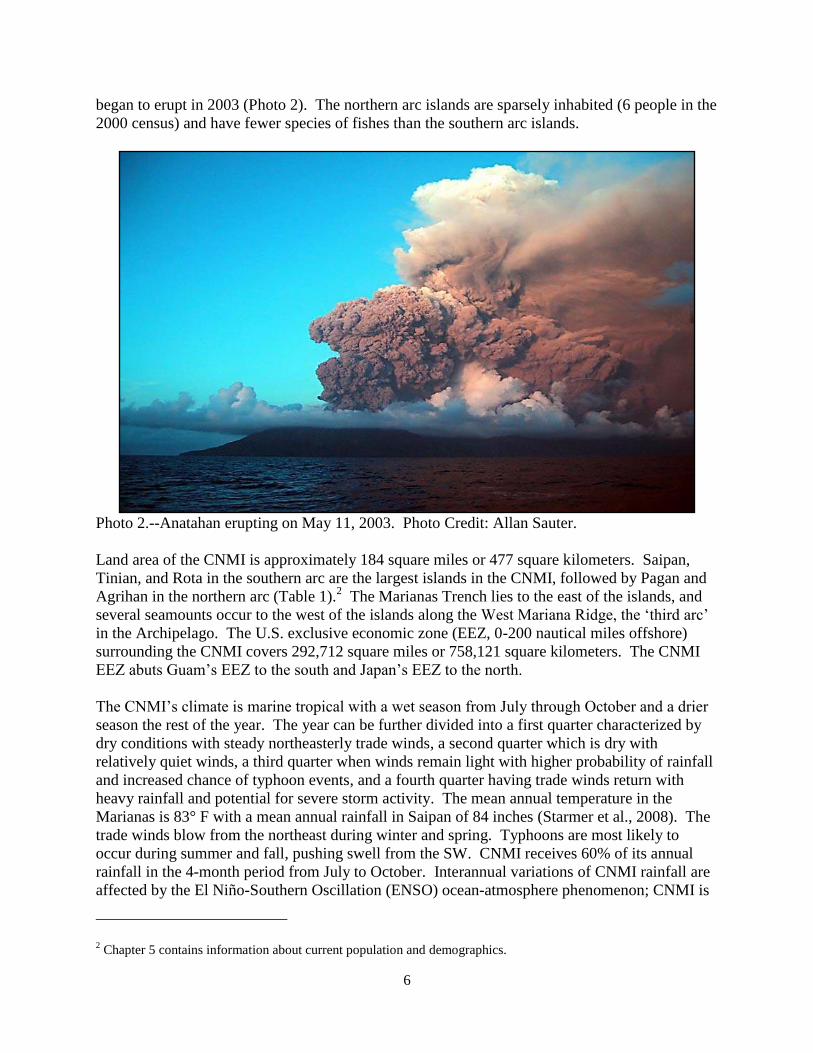
began to erupt in 2003 (Photo 2). The northern arc islands are sparsely inhabited (6 people in the
2000 census) and have fewer species of fishes than the southern arc islands.
Photo 2.--Anatahan erupting on May 11, 2003. Photo Credit: Allan Sauter.
Land area of the CNMI is approximately 184 square miles or 477 square kilometers. Saipan,
Tinian, and Rota in the southern arc are the largest islands in the CNMI, followed by Pagan and
Agrihan in the northern arc (Table 1).2 The Marianas Trench lies to the east of the islands, and
several seamounts occur to the west of the islands along the West Mariana Ridge, the ‘third arc’
in the Archipelago. The U.S. exclusive economic zone (EEZ, 0-200 nautical miles offshore)
surrounding the CNMI covers 292,712 square miles or 758,121 square kilometers. The CNMI
EEZ abuts Guam’s EEZ to the south and Japan’s EEZ to the north.
The CNMI’s climate is marine tropical with a wet season from July through October and a drier
season the rest of the year. The year can be further divided into a first quarter characterized by
dry conditions with steady northeasterly trade winds, a second quarter which is dry with
relatively quiet winds, a third quarter when winds remain light with higher probability of rainfall
and increased chance of typhoon events, and a fourth quarter having trade winds return with
heavy rainfall and potential for severe storm activity. The mean annual temperature in the
Marianas is 83° F with a mean annual rainfall in Saipan of 84 inches (Starmer et al., 2008). The
trade winds blow from the northeast during winter and spring. Typhoons are most likely to
occur during summer and fall, pushing swell from the SW. CNMI receives 60% of its annual
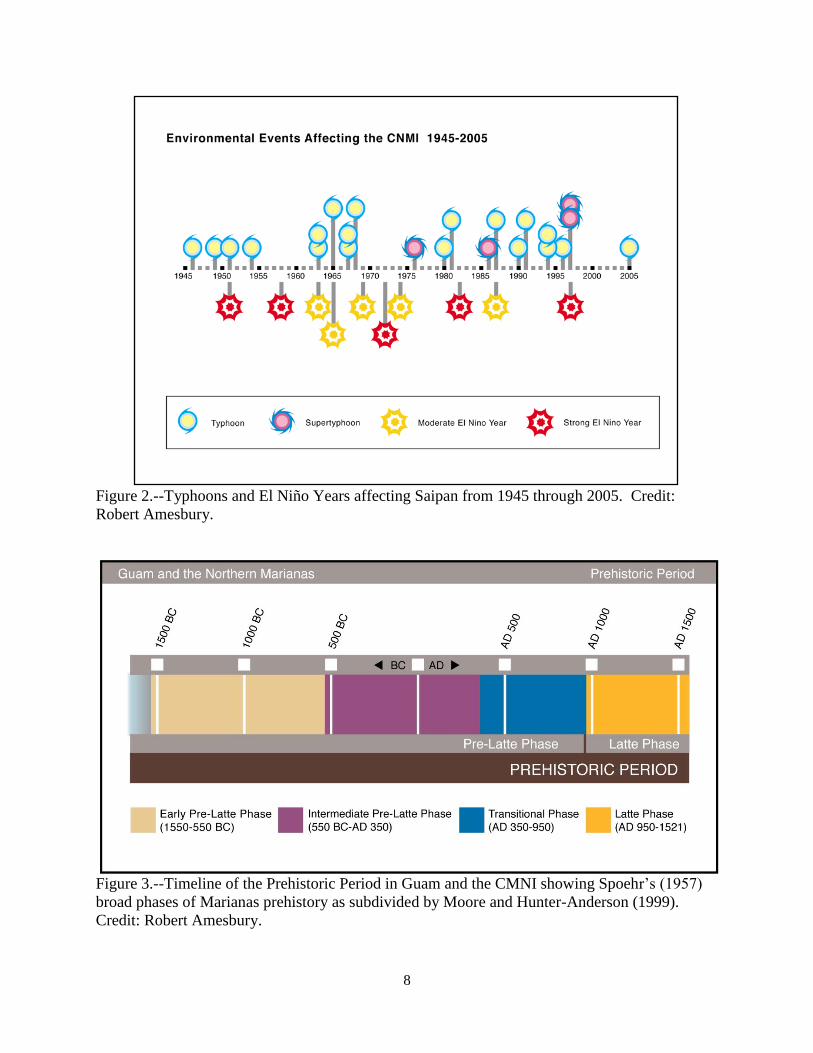
rainfall in the 4-month period from July to October. Interannual variations of CNMI rainfall are
affected by the El Niño-Southern Oscillation (ENSO) ocean-atmosphere phenomenon; CNMI is
2 Chapter 5 contains information about current population and demographics.

7
in an ENSO core region characterized by very dry conditions in the year following El Niño and
an increase in the threat level from typhoons during an El Niño year (Lander, 2004). Typhoons
and El Niño years affecting Saipan’s ecosystem from 1945 to 2005 are shown on Figure 2.
Table 1.--Land areas of the Mariana Islands (Karolle, 1993; Farrell, 1991).
Southern Arc
Islands
Area
(sq. mi.)
Northern Arc Islands
Area
(sq. mi.)
Farallon de
Medinilla
0.35 Uracas (or
Farallon de Pajaros)
0.79
Saipan 47.46 Maug 0.81
Tinian 39.29 Asuncion 2.82
Aguijan (or
Aguiguan)
2.77 Agrihan 18.29
Rota 32.90 Pagan 18.65
Guam 214.00 Alamagan 4.35
Total for the
Southern Arc
Islands
336.77 Guguan 1.62
Sarigan 1.93
Anatahan 12.48
Total for the
Northern Arc Islands
61.74
HISTORICAL OVERVIEW OF SOCIETY AND FISHERIES
Prehistoric Period
People have lived in the Mariana Islands for at least 3500 years, or about 3000 years prior to
European contact (http://www.doi.gov/oia/Islandpages/cnmimain.htm). The Prehistoric Period
lasted from the arrival of the first people by at least 1500 BC until the arrival of Magellan in AD
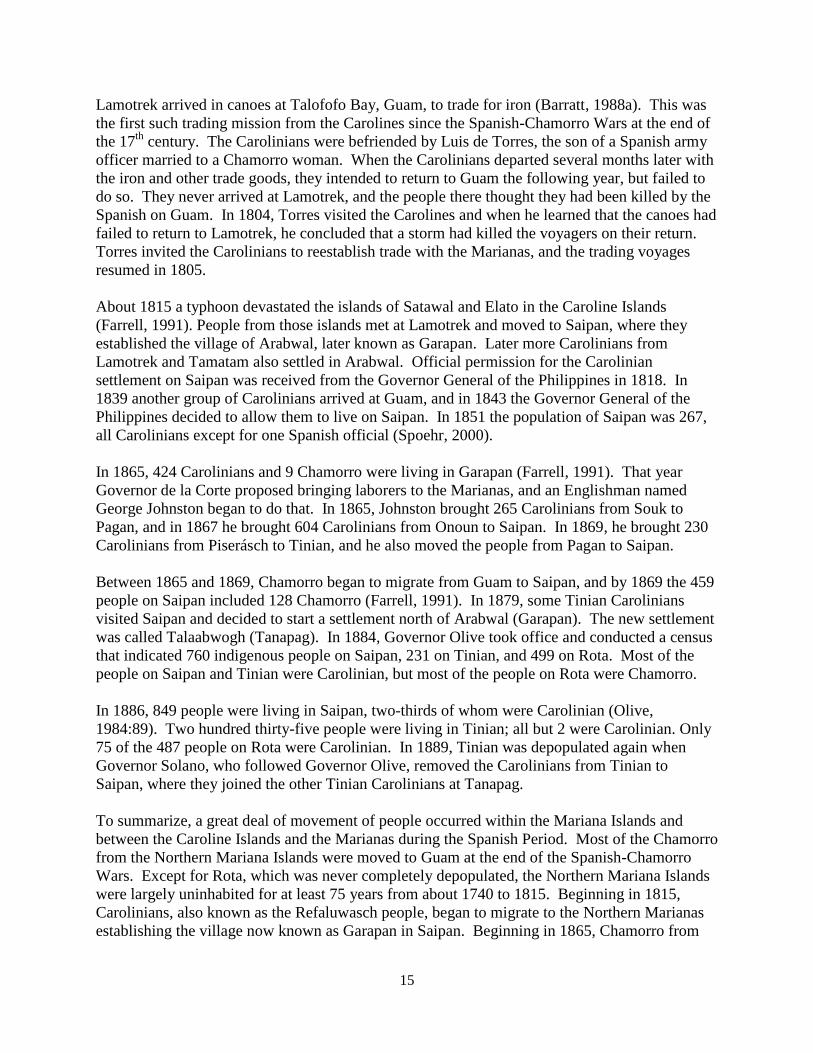
1521. Spoehr (1957) divided the long Prehistoric Period into the Pre-Latte Phase and Latte
Phase (Fig. 3). Subsequent authors (Moore and Hunter-Anderson, 1999; Craib, 1990; Moore,
1983) have proposed various subdivisions of the Pre-Latte Phase.
Pre-Latte Phase cultural deposits are found below the surface usually along the coasts. Two of
the earliest sites in the Marianas have been excavated on the west coast of Saipan. These are
Achugao in northwest Saipan (Butler, 1995) and Chalan Piao in southwest Saipan (Amesbury et
al., 1996; Moore et al., 1992; Spoehr, 1957). Unai Chulu in Tinian is another site with Early Pre-
Latte Phase deposits (Haun et al., 1999). Artifacts that characterize the Pre-Latte Phase include
pottery shards with red-slipped exterior surfaces, some of which are decorated with lime-filled
designs, and beads and bracelets made from cone shells.
8
Figure 2.--Typhoons and El Niño Years affecting Saipan from 1945 through 2005. Credit:
Robert Amesbury.
Figure 3.--Timeline of the Prehistoric Period in Guam and the CMNI showing Spoehr’s (1957)
broad phases of Marianas prehistory as subdivided by Moore and Hunter-Anderson (1999).
Credit: Robert Amesbury.

9
The Latte Phase began by at least AD 1000 and is characterized by the megalithic features called
latte sets. A latte set consists of two parallel rows of upright stone shafts (known as haligi in
Chamorro) associated with capstones (tasa) (Photo 3). The number of shafts in a set varies, but
sets with 8, 10 or 12 shafts are common (Hunter-Anderson and Moore, 2002; Graves, 1986).
Based on the cultural materials and features associated with latte sets, they are believed to have
functioned as foundations for residential structures.
Photo 3.--The “wall latte” at Mochong, Rota, with upright shafts and fallen capstones along one
side and five limestone blocks along the other side. Photo Credit: J. Amesbury.
Latte Phase sites are widely distributed along the coastline as well as in the interior of the
Mariana Islands. They are found not only on the major islands of the southern arc, but on the
islands of the northern arc as well. Figure 4 shows the distribution of latte stones observed on
Saipan by Hans Hornbostel in the 1920s. The largest latte stones erected are at the House of
Taga on Tinian, although larger ones can be seen still in the ground at As Nieves Latte Stone
Quarry on Rota. Characteristic artifacts of the Latte Phase include plain pottery sherds, stone
mortars, and shell beads made from Spondylus.
During the Prehistoric Period the inhabitants of the Mariana Archipelago, who are now known as
Chamorro, were in contact with one another. Evidence shows that all the islands shared the same
culture and language. Archaeological assemblages from the various islands are similar. It is
possible that the Chamorro were also in contact with their closest Micronesian neighbors, the
Refaluwasch people of the Caroline Islands to the south. The ocean-going sailing canoes of both
groups would have made that possible.

10
Figure 4.--Hornbostel’s (1924-25) map of Saipan with shading showing the distribution of latte
stones.
Prehistoric Period Fishing
When the first people arrived in the Marianas between 3500 and 4000 years ago, there were no
large land mammals to hunt, but the ancient Chamorro had an almost unlimited supply of animal
protein from the sea. They fished for both reef and pelagic (open ocean) species and collected
mollusks and other invertebrates, including crustaceans and echinoderms. They also caught sea
turtles.
There is no written record for the Prehistoric Period. Instead, archaeologists study the
archaeological record, the artifacts (man-made objects) and ecofacts (natural objects with
archaeological significance) left in the ground by the people of that period. Faunal analysts, such
as Foss Leach and Janet Davidson of the Museum of New Zealand Te Papa Tongarewa, calculate
the Minimum Number of Individuals (MNI) in archaeological fish bone collections by
identifying the unique or paired bones from fishes. They also suggest what methods were used
for catching the fishes based on the technology of the time period, the habits and habitats of the
fishes, and ethnographic comparison.
Table 2 is an example of the results of fishbone analysis. Leach et al. (1990) were able to
identify 313 fishes from the archaeological collections from Mochong, Rota. The families of
fishes are grouped by probable fishing methods. The Mochong site was occupied during the Pre-
Latte and Latte Phases from about 1000 BC to AD 1700 (Craib, 1990). (See Photo 3 in this
report.)

11
Table 2.--Likely catch methods of fishes from Mochong, Rota by families with Minimum Number of
Individuals (MNI) and percent MNI (Leach et al., 1990). Likely Catch Method Family or Other Group Common Name MNI Percent MNI
Netting 105 33.5
Bothidae Left-eyed flounders
Scaridae Parrotfishes
Acanthuridae Surgeonfishes
Balistidae Triggerfishes
Aluteridae Filefishes
Demersal Baited Hook 109 34.8
Epinephelidae Groupers
Lutjanidae Snappers
Nemipteridae Monocle breams
Lethrinidae Emperors
Coridae Wrasses
Coridae/Labridae Wrasses
Pelagic Lures 51 16.3
Acanthocybiidae Wahoo
Coryphaenidae Mahimahi
Carangidae Jacks
Thunnidae/Katsuwonidae Tunas including yellowfin
and skipjack
Harpoons or Bait
Trolling
10 3.2
Istiophoridae Marlins, sailfishes
Istiophoridae/Xiphiidae Marlins, sailfishes/
Swordfishes
General Foraging 23 7.3
Holocentridae Squirrelfishes
Aphareidae Snappers
Kyphosidae Sea chubs or rudderfishes
Scorpaenidae Scorpionfishes
Diodontidae Porcupinefishes
Tetraodontidae Puffers
Basket Traps 8 2.6
Muraenidae Moray eels
Opportunistic Catch 3 1.0
Elasmobranchii Sharks and rays
No Strong Opinion 4 1.3
Platacidae Batfishes
Teleostomi Includes bony fishes
Total 313 100.0
This type of fishbone analysis has been conducted for several archaeological sites in the
Northern Marianas (Amesbury and Hunter-Anderson, 2003; 2008). Sites on Rota that have
yielded pelagic fish remains from the families Coryphaenidae (mahimahi),
Istiophoridae/Xiphiidae (marlin, sailfishes, and swordfishes), and Scombridae (tunas and
wahoo), and sea turtle remains from the family Cheloniidae are shown on Figure 5. Other sites
in the CNMI that have yielded pelagic fish remains dating to the Prehistoric Period include
Afetña, Saipan, and Unai Masalok and Tachogna, Tinian.

12
Figure 5.--Rota, showing archaeological sites with pelagic fish and turtle remains. Credit:
Robert Amesbury.
In addition to the remains of fishes, invertebrates, and turtles, archaeologists find pieces of
fishing gear, including one-piece fishhooks (Fig. 6) and composite fishhooks, gorges, fishing
weights, and bone spears or harpoons (Fig. 7). Many one-piece J-shaped hooks and V-shaped
gorges were made from Isognomon shell. Composite hook points and shanks were made from
shell and bone and possibly wood. Human bone spear points may have been used in fighting
and/or for harpooning fishes.

13
Figure 6.--Robust U-shaped fishhook (a),
possibly of Turbo shell, from an early Pre-
Latte context at Achugao, Saipan (Butler,
1995); and (b) J-shaped Latte Phase fishhook
of Isognomon shell, from Objan, Saipan
(Spoehr, 1957). Credit: Drawn by Rick
Schaefer from photos.
Figure 7.--Human bone spear points found in
association with Burial 6 at Afetña, Saipan.
Credit: McGovern-Wilson (1989).

14
HISTORIC PERIOD
In contrast to the long Prehistoric Period (Table 3), the Historic Period has lasted less than 500
years from European contact until the present.
Table 3.--Prehistoric and Historic Periods in the CNMI.
Period Dates Duration
Prehistoric Period At least as early as 1500 BC
to AD 1521
More than 3000 years
Spanish Period AD 1521-1899 More than 300 years
German Period 1899-1914 15 years
Japanese Period 1914-1944 30 years
American Period 1944-present Continuing
Spanish Period (AD 1521-1899)
Magellan arrived in the Marianas in 1521, and Legazpi claimed the islands for Spain in 1565.
More than 100 years later in 1668, Guam was colonized when the first permanent Spanish
mission in the Marianas was established. Father Diego Luis de Sanvitores, a Jesuit priest and the
superior of the mission arrived on Guam on June 15, 1668 (Carano and Sanchez, 1964). Along
with Father Sanvitores were four other Jesuit priests, Fathers Medina, Cardeñoso, Casanova, and
Morales, and a scholastic brother and lay assistants. In addition to the missionaries, there was a
garrison force consisting of a captain, Don Juan de Santa Cruz, and 32 soldiers.
After an initial period of apparent success in converting the islanders to Roman Catholicism, the
mission encountered hostility. Open rebellion on the part of the Chamorro against the Spaniards
broke out in 1670. Father Medina was killed on Saipan in 1670, and Father Sanvitores was
killed on Guam in 1672 (García, 1985). The Spanish-Chamorro Wars continued for 25 years
until 1695 when the final battle took place on Aguijan (also spelled Aguiguan), where the
Chamorro from Tinian had taken refuge but were finally overwhelmed by Governor Quiroga and
his men.
At the end of the Spanish-Chamorro Wars, the Spanish required the natives of the Northern
Mariana Islands to move to Guam. By the middle of 1699, only Saipan and Rota were still
inhabited. The population on Saipan was about 600 to 700 Chamorro (Farrell, 1991). There
were two churches on the island that were destroyed by a typhoon in 1705 destroyed both
churches. A new church was completed by 1720, but the mission on Saipan closed in 1730.
Rota was never completely depopulated, but all of the islands north of Rota were depopulated by
about 1740. Until 1815, there were no permanent Saipan residents.
Refaluwasch (or Carolinian) people from the Caroline Islands to the south of the Marianas had
no doubt traveled to the Marianas during the Prehistoric Period, but their visits were largely
curtailed during the Spanish Period because they feared the Spaniards. In 1788, Carolinians from
15
Lamotrek arrived in canoes at Talofofo Bay, Guam, to trade for iron (Barratt, 1988a). This was
the first such trading mission from the Carolines since the Spanish-Chamorro Wars at the end of
the 17th
century. The Carolinians were befriended by Luis de Torres, the son of a Spanish army
officer married to a Chamorro woman. When the Carolinians departed several months later with
the iron and other trade goods, they intended to return to Guam the following year, but failed to
do so. They never arrived at Lamotrek, and the people there thought they had been killed by the
Spanish on Guam. In 1804, Torres visited the Carolines and when he learned that the canoes had
failed to return to Lamotrek, he concluded that a storm had killed the voyagers on their return.
Torres invited the Carolinians to reestablish trade with the Marianas, and the trading voyages
resumed in 1805.
About 1815 a typhoon devastated the islands of Satawal and Elato in the Caroline Islands
(Farrell, 1991). People from those islands met at Lamotrek and moved to Saipan, where they
established the village of Arabwal, later known as Garapan. Later more Carolinians from
Lamotrek and Tamatam also settled in Arabwal. Official permission for the Carolinian
settlement on Saipan was received from the Governor General of the Philippines in 1818. In
1839 another group of Carolinians arrived at Guam, and in 1843 the Governor General of the
Philippines decided to allow them to live on Saipan. In 1851 the population of Saipan was 267,
all Carolinians except for one Spanish official (Spoehr, 2000).
In 1865, 424 Carolinians and 9 Chamorro were living in Garapan (Farrell, 1991). That year
Governor de la Corte proposed bringing laborers to the Marianas, and an Englishman named
George Johnston began to do that. In 1865, Johnston brought 265 Carolinians from Souk to
Pagan, and in 1867 he brought 604 Carolinians from Onoun to Saipan. In 1869, he brought 230
Carolinians from Piserásch to Tinian, and he also moved the people from Pagan to Saipan.
Between 1865 and 1869, Chamorro began to migrate from Guam to Saipan, and by 1869 the 459
people on Saipan included 128 Chamorro (Farrell, 1991). In 1879, some Tinian Carolinians
visited Saipan and decided to start a settlement north of Arabwal (Garapan). The new settlement
was called Talaabwogh (Tanapag). In 1884, Governor Olive took office and conducted a census
that indicated 760 indigenous people on Saipan, 231 on Tinian, and 499 on Rota. Most of the
people on Saipan and Tinian were Carolinian, but most of the people on Rota were Chamorro.
In 1886, 849 people were living in Saipan, two-thirds of whom were Carolinian (Olive,
1984:89). Two hundred thirty-five people were living in Tinian; all but 2 were Carolinian. Only
75 of the 487 people on Rota were Carolinian. In 1889, Tinian was depopulated again when
Governor Solano, who followed Governor Olive, removed the Carolinians from Tinian to
Saipan, where they joined the other Tinian Carolinians at Tanapag.
To summarize, a great deal of movement of people occurred within the Mariana Islands and
between the Caroline Islands and the Marianas during the Spanish Period. Most of the Chamorro
from the Northern Mariana Islands were moved to Guam at the end of the Spanish-Chamorro
Wars. Except for Rota, which was never completely depopulated, the Northern Mariana Islands
were largely uninhabited for at least 75 years from about 1740 to 1815. Beginning in 1815,
Carolinians, also known as the Refaluwasch people, began to migrate to the Northern Marianas
establishing the village now known as Garapan in Saipan. Beginning in 1865, Chamorro from

16
Guam began to migrate to Saipan, and people from the Carolines were brought as laborers to
various islands in the Northern Marianas, including Pagan, Saipan, and Tinian. The Carolinians
from Tinian later established the village of Tanapag in Saipan.
Spanish-Period Fishing
The authors of the earliest written records pertaining to the Marianas all remark on the
exceptional sailing and fishing skills of the Chamorro. Magellan’s historian on the first
expedition to circumnavigate the globe, Antonio Pigafetta, recorded the European discovery of
the Mariana Islands in March 1521 (Lévesque, 1992a:189-202). In his brief description of
Guam, Pigafetta provided the following information about the islanders’ food and fishing
practices:
Their food is from certain fruits called coconuts, and potatoes [either yams or
taro, according to Lévesque, Editor’s note 6, p. 200]. There are birds, bananas as
long as one palm, sugar-cane and flying fish…The pastime of the men and
women of the said place, and their sport, is to go with their canoes to catch some
of these flying fish with some fish-hooks made of fish bones (Lévesque,
1992a:200-202).
Andrés de Urdaneta sailed on board one of the vessels of the Loaysa expedition, which arrived in
the Marianas in 1526. Urdaneta later became an Augustinian friar and returned to the Marianas
in 1565 with the Legazpi expedition. In Urdaneta’s first eyewitness account (Lévesque,
1992a:453-460), he described the Marianas. “In these islands, there is no livestock whatever, no
chickens, nor any other animals nor food supplies, except rice, which they have in abundance, as
well as fish, coconut, coconut oil, and salt” (Lévesque, 1992a:456). In his second eyewitness
account, which also covered the 1526 stop in the Mariana Islands (Lévesque, 1992a:461-469),
Urdaneta remarked on the islanders’ use of tortoise shell and their ability to fish. “As for tortoise
shells, they praise them very much for making combs and hooks to fish with…As for fish, they
kill many with hooks” (Lévesque, 1992a:465-466).
Pelagic fishing during the Prehistoric Period and the first 200 years of the Spanish Period
depended on the flying proa, the large ocean-going sailing canoe. An idea of the number of
proas comes from a narrative of Legazpi’s voyage attributed to Father Martin Rada. Rada
reported that more than 400 proas surrounded Legazpi’s ships anchored at Umatac, Guam in
1565. He said, “It certainly is something to see how fast they sail and how easily they change
direction” (Lévesque, 1992b:158). Rada also described a boathouse in the village of Umatac that
could hold 200 men.
Both Urdaneta and Rada made statements to the effect that there were no large mammals or even
chickens in the Marianas in 1526 or 1565. Rada (Lévesque, 1992b:164) wrote, “No-one was
found who ate or had any kind of meat, any wild or domestic cattle, any birds whatever except a
few turtle doves that they kept in cages.”

17
Just before the end of the 16th
century and at the beginning of the 17th
century, religious zealots
jumped ship in the Mariana Islands to convert the islanders to Roman Catholicism. Other
Spaniards were shipwrecked in the Marianas. Their longer tenure in the islands allowed them to
learn more of the customs of the Chamorro. A lay brother named Fray Juan Pobre de Zamora
jumped ship at Rota and spent 7 months there in 1602. While in Rota, he was visited by another
Spaniard named Sancho, who had survived the shipwreck of the Santa Margarita in 1601 and
had become the servant of a Chamorro named Suñama, who lived at Pago, Guam.
Sancho described how the Chamorro fished for flying fish and used it as bait for mahimahi,
billfish, and other large fishes.
When they fish for these flying-fish, those from one town all come together in a
bunch and they go out in their canoes, each one with from ten to twelve gourds; to
each gourd is tied with a very slim cord a small two-pointed shell hook [probably
an Isognomon gorge]. One hook is baited with coconut meat and the other with
shrimp or some minnow from the sea. All the fishermen throw these gourds into
the sea together, everyone taking care of his own. It is by watching the gourds
and seeing them wiggle that they know they have a flying-fish. There are so
many fishermen because all those living on the coast of all the islands are
fishermen. There are flying-fish for all of them as there are sardines in Spain.
The average fish measures about one palm in length, and others about two. The
first flying-fish they catch, they then eat it raw. The second one is placed as a bait
on a large hook and the cord is thrown over the poop and in this manner they
usually catch many dorados [mahimahi], swordfish, and other big fishes
(Lévesque, 1993:176, brackets added).
Sancho told the following fish story about his master Suñama to Fray Juan Pobre. Suñama
caught a flying fish and ate the first one raw. With the second flying fish, he baited his hook and
hooked a very large billfish (probably a blue marlin) and spent a great deal of time playing the
fish to tire it. A large shark came and seized the billfish. When Suñama did not let go of the
line, his boat capsized. He tied his line to the capsized boat and followed the line to the shark,
diverted the shark, then brought the billfish back to his boat, which he righted and sailed home
flying a woven mat from the masthead to indicate a successful catch. Sancho concluded that the
Chamorro were “the most skilled fishermen ever to have been discovered” (Driver, 1983:15).
Apparently the first large land mammals in the Marianas arrived with the priests and soldiers in
1668. Brother Marcelo Ansaldo, who did not remain on Guam but continued on to the
Philippines, wrote about Father Sanvitores’ landing on Guam: “A moment of intense surprise
and interest was when our sailors brought ashore rams, sheep, a little bull, a cow and three
parrots which are to stay here. The indios had never seen any of these animals before so they
greatly marveled at seeing them” (Rogers, 1995:47). In addition to the cattle and sheep
mentioned by Ansaldo, the Spanish introduced horses, carabaos, pigs, goats, and deer during the
remainder of the 1600s and the 1700s. It is possible that the precontact Chamorro had pigs, but
there is no unequivocal archaeological evidence.

18
During the Spanish-Chamorro Wars (1670-1695), the Spanish burned Chamorro villages and
boats, overtook canoes that attempted to flee from Guam to Rota, and rounded up fugitives on
Rota who had fled from Guam (García, 1985). The years of war and the policy of moving the
Chamorro from the Northern Marianas to Guam eventually put a stop to interisland travel and
pelagic fishing by the Chamorro.
The flying proa, which first had been described in the 1500s, was seen and described by William
Dampier in 1686 (Dampier, 1937), Captain Woodes Rogers in 1710 (Rogers, 1928), and George
Anson in 1742 (Anson, 1748; Barratt, 1988b). Anson and some of his lieutenants captured a
proa on their arrival at Tinian, later dismantled it, and then burned it before they left the island
(Barratt, 1988b:11, 14, 69). Their descriptions and drawings of the proa are among the last in
history (Fig. 8).
Figure 8.--“Flying proa” of the Mariana Islands. a) view from leeward with sail set: 1, one of two stays
supporting mast, the other hidden behind sail; 2, matting sail; 3, 4, running stays. b) head view, outrigger
to windward: 1, mast shore; 2, shroud. c) plan: 1, proa; 2, “boat” at end of outrigger frame; 3, 4, braces
from the ends to steady frame; 5, thin plank placed to windward to prevent shipping of water, to serve as
seat for native who bales, and sometimes as rest for goods transported; 6, part of middle outrigger boom
on which mast is fixed; 7, 8, horseshoe sockets, in one of which yard is lodged according to tack (after
Anson 1748). Figure and caption from Hornell (1975:414).
19
Anson had arrived at Tinian more than 40 years after the Chamorro had been moved to Guam
and found no permanent population there. Instead, he encountered a party of about two dozen
men, islanders under the command of a Spanish sergeant, who had come from Guam to kill and
cure beef for the garrison in Guam and for the Spanish galleon, which would stop on her way
from Acapulco to Manila. The Anson expedition estimated the number of cattle on Tinian at
10,000 and an abundance of wild hogs and domestic poultry (Barratt, 1988b:46).
Hornell noted that the last voyager to describe the flying proa of the Chamorro was Captain
Crozet, who spent nearly 2 months on Guam in 1772. However, Hornell questioned Crozet’s
description because it “coincides so closely with that of Dampier that it is impossible to resist the
conclusion that Crozet had Dampier’s account before him as he wrote and that he based his own
almost entirely upon it” (Hornell, 1975:417). As proof of his conclusion, Hornell cited the fact
that Crozet repeated Dampier’s error in saying that the outrigger was on the lee side of the boat,
rather than the windward side, as correctly reported by other writers. A footnote in Crozet
(1891:96), added by the translator H. Ling Roth, says that Dumont D’Urville wrote that at the
time of his first visit to the Mariana Islands in May 1828, the islanders were no longer able to
make these canoes and instead used similar ones from the Carolines. This statement was
confirmed to Roth in August 1888 by Vice Admiral E. Paris, who had been a midshipman with
D’Urville.
It appears that Anson was the last European visitor to see the proa in use, and even then it was
put to the unusual use of transporting meat from Tinian, rather than pelagic fishing. Pelagic
fishing by the Chamorro apparently came to an end by about 1750 if not before. When Governor
Henrique Olavide took office in 1749, he noted a lack of seagoing vessels. He had three 30-ft
vessels built in Guam, and he had 11 bancas (seagoing canoes) built for interisland travel—6 in
Guam, 4 in Rota, and 1 in Tinian (Driver, 2005:37). Governor José de Soroa, who took office in
1759, sent bancas to Tinian for meat (Driver, 2005:38). During Governor José Arlegui’s
administration (1786-1794), several disasters highlighted the importance of the Carolinians and
their oceangoing canoes (Driver, 2005:54-57). By this time, interisland travel was dependent on
the Carolinians. The Carolinian bancas traveled from Guam to Rota for purposes of the
government and church, and they traveled to Tinian to obtain meat and produce. No doubt both
Chamorro and Carolinians, wherever they lived in the Mariana Islands, continued to fish for reef
fish.
The Freycinet expedition, which arrived at Guam March 17, 1819, was a French scientific
expedition that spent several months in the Marianas, visiting Tinian and Rota as well as Guam.
Freycinet (2003) provided a lengthy and detailed account of the tools and techniques of fishing
in the Marianas. He described the methods of fishing for mañåhak (juvenile rabbitfishes,
Siganus spp.), hachuman (Decapterus sp., opelu in Hawai’i), parrotfishes (family Scaridae),
flying fishes (family Exocoetidae), anaho (probably mahimahi, Coryphaena hippurus) and other
marine resources including turtles.
Freycinet (2003:163) reported that mañåhak were caught regularly during the months of April,
May, and June, and rarely in September and October, but only at the time of the moon’s last
quarter. Mañåhak that appeared during the fall months were called magnahak ababa or crazy

20
mañåhak, because they appeared only about once every 25 years. Freycinet said these fishes
were “seen in most extraordinary numbers and vast shoals.”
Two species of mañåhak occur in the Marianas. The smaller fish are Siganus spinus (Linnaeus)
and the larger are Siganus argenteus (Amesbury and Myers, 1982). The smaller fish appear first
and then the bigger ones, sometimes on the same day or on subsequent days. The appearance of
larger species indicates the run is coming to a close. People in the Marianas still fish for
mañåhak during the seasonal runs.
Hachuman were caught with the use of the poiu or fishing stone (Photo 4), which is a type of
chumming device. The stone was hemispherical and flat on top. A coconut shell cap about the
same size as the stone was attached to the flat top with cords to hold the two pieces together.
Chewed coconut meat was placed inside the coconut shell cap, and the device was used to attract
fish toward the surface where they could be taken in a net, known as the lagua atchuman
Freycinet (2003:164) said hachuman were caught beyond the reefs, one-half league to five
leagues from land. The fishing began in August and continued until October when the fish were
full grown. The fisherman filled a poiu with the chewed pulp of a young coconut and lowered
the device on a line to a depth of 6 to 8 fathoms [36-48 feet]. The fisherman shook the line from
time to time to disperse the coconut meat into the water. The hachuman came in great numbers
to eat the coconut. When the poiu was empty, the fisherman took it out, refilled it, and continued
the operation until evening. The following morning, the fisherman returned to the same spot, but
this time he lowered the poiu 1 or 2 feet less deep than the previous day. He did this each day
for 1.5 or 2 months except during bad weather. By this time the hachuman were almost
surfacing. Ordinarily, this fish was caught at a depth of 1 fathom [6 feet]. Estanislao Taisacan, a
fisherman on Rota (below), still uses the poiu to fish for hachuman.
In the section on fishing law, Freycinet (2003:189) said that a hachuman fisherman would
sometimes throw his poiu into the water while crossing several fishing grounds. The fish would
follow his canoe, and when he arrived at his own ground, he would have a better catch.
However, if the fisherman were caught doing this, he would receive the death penalty.
Freycinet (2003:165) described two types of fishing for parrotfishes. One took place at night and
the other by day. The nighttime fishing occurred after the new moon in the months of August
through November. After sunset, when the tide was low and the sea was calm, a canoe went out
with a man in front holding a torch. The light of the torch permitted the fishermen to see the
parrotfishes sleeping near the outer edge of the reef. Previously, the fishermen carried a barbed
wooden spear, but by Freycinet’s time, they used the multiprong iron spear to retrieve the fishes.

21
Photo 4.--Ancient poiu or fishing stone made of argillaceous limestone and refitted with lines
and coconut shell. Photo Credit: Frank Wells.
The daytime fishing for parrotfishes involved the use of a live fish as a decoy. The live
parrotfish had a line attached through its lower jaw. The fisherman carried the fish in his canoe
to an appropriate place where there were natural basins formed by corals inside the reefs. The
fish was put into the water and allowed to swim as far as the cord extended. The other parrotfish
saw the captive fish and hurried to attack it. The fisherman then removed the decoy fish from
the water and made a sliding knot near the spot where the fish was wounded. When the decoy
fish was placed back into the water, the other fish attacked the bleeding spot, and the fisherman
pulled the noose around the attacking fish. Freycinet reported that a skilled fisherman would not
catch more than six or eight parrotfish per day in this way. The live decoy could be kept in water
near the shore and used for a week.
Freycinet’s description of fishing for flying fishes (Freycinet, 2003:166) is much the same as that
provided by Sancho to Fray Juan Pobre (above). A special arrangement of lines and hooks
known as kinatchit gumahga was used. The main line was held afloat by gourds (taguadji), and
lateral lines were attached to it at intervals of 1 or 1.5 fathoms. Both Freycinet and Fray Juan
Pobre noted that in the past the fishhooks were made of shell, but by early Spanish times were
made of iron.
Freycinet (2003:166) also mentioned fishing for what he called l’anaho. The addition of the
word dorado indicates that he was talking about mahimahi (Coryphaena hippurus). The content
of Freycinet’s description also indicates he was talking about mahimahi, because he said the fish
was caught using a recently killed flying fish. However, Freycinet said that this fish was taken

22
formerly. Apparently no one was fishing for mahimahi at the time Freycinet was in the
Marianas.
Freycinet (2003:166) reported that the islanders had no method for catching turtles other than
tipping them over onto their backs.
Freycinet included a description of the Chamorro sailing canoes written by Gemelli Careri, who
saw them in 1696, just after Spanish conquest, when the canoes were still being built. Freycinet
concluded that the craft of the Mariana Islanders of old were similar to those of the Carolinians
still used in Freycinet’s time. He said, “The craft used nowadays to make crossings from one
island to another are of Carolinian construction, and they are even manned by natives of those
islands, rather than by natives of the Marianas” (Freycinet, 2003:178). Freycinet was in the
islands in 1819, soon after the Carolinians began to move to the Marianas about 1815.
Two Spanish governors of the second half of the 19th
century described fishing. Governor Felipe
María de la Corte y Ruano Calderón, who served as governor from May 1855 to January 1866,
said that there was no pelagic fishing. “In the contiguent seas there are considerable large fish,
but as the natives never go fish them beyond the reef few fish are caught” (de la Corte,
1970:143). But he described the fishing for three seasonal fishes: 1) mañåhak, which de la
Corte spelled atañaja (juvenile rabbitfishes, Siganus spp.); 2) ti’ao (juvenile goatfishes, family
Mullidae); and 3) atulai, which de la Corte spelled atislai (big-eye scad, Selar
crumenophthalmus).
De la Corte (1970:144) said the mañåhak “come in through the reefs at low tide in some moons
of May to July and sometimes come in compact layers of 5 and 6 feet thick and many braces
wide and long. The town comes out in mass to catch all they can in small nets and sometimes
this lasts two or three days each moon. This fish is tasty and besides eating it fresh, they pickle it
and keep it the whole year round.” The ti’ao, he said, “also comes in shoals, but not as big as
those of the atañaja [mañåhak]. They turn up around April to August.”
Concerning the atulai, de la Corte (1970:144) said, “Some shoals of fish like mackerel or large
sardines also appear which are called atislai and they catch them in the same way, but they do
not come in such great abundance nor every year. They are caught during the moons of June to
August and are eaten like the others, fresh and pickled.” Atulai are still caught in the Marianas.
De la Corte’s description of hachuman fishing (de la Corte 1970:144-145) is quite similar to
Freycinet’s, except that he said the fish are fattened for 1 to 3 months. He also quantified the
catch, “With this operation they sometimes catch more than a ton of fish a day, and repeat the
fishing for a month, around August.” However, he added, “As this requires a certain amount of
patience, perseverance and experience, only certain old men practice this, and I do not think
anybody does so nowadays. This practice seems to have originated from the old natives.” It
appears that de la Corte never saw catches of a ton per day, but he had been told that was the size
of the catch in the past.
Concerning navigation, de la Corte (1970:146) remarked, “In spite of the fact that on their
discovery these natives created a reputation as good navegators [sic], and notwithstanding the

23
fact that they individually have a good disposition as sailors, they do not at present exercise it
whatsoever, on the island since there is no boat capable of making a trip even to the nearest
route.” He reported there were three or four boats or “whale hunters’ canoes” used for
transporting goods from the harbor to Hagåtña or for carrying unmilled rice from Inarajan or
Merizo at harvest time. He said the islanders used small canoes or “galquides” [galaides] for
fishing, but added, “they are so small, they cannot be used for anything other than going between
the reefs, and thus nobody fishes beyond them.” He said that in 1863 there were only 24 of these
small canoes and concluded, “Consequently, we can say there is no navegation [sic] of any kind
on the island.”
Governor Francisco Olive y García’s notes (1984) pertain to the years 1884-1887. The section
of his report concerning fishing is almost item for item the same as de la Corte’s. He described
the same seasonal runs for mañåhak, ti’ao, and atulai, as well as the fishing for hachuman. The
similarity to de la Corte’s descriptions leads one to conclude that Olive copied them from de la
Corte. Olive added that the hachuman fishing was still done on the island of Rota, saying “we
believe this is practiced only by an occasional person, especially on the island of Rota” (Olive y
García, 1984:34). Concerning turtles, Olive (1984:34) said, “There are turtles—but no tortoise
shell.”
German Period (1899-1914)
Just prior to the beginning of the 20th
century, Spain lost control of the Mariana Islands, and the
histories of Guam and the Northern Mariana Islands diverged (Fig. 5). Guam was ceded to the
U.S. in 1898 as a result of the Spanish-American War, and in 1899 Germany purchased the
Mariana Islands north of Guam, beginning the German Period (Fig. 9).
Georg Fritz, the first district officer for the German Northern Marianas, arrived on Saipan and
took office on November 17, 1899. He established public education and a police force and
undertook public health programs and public works projects. His programs brought the
Chamorro and Carolinians on Saipan into regular contact with each other (Farrell, 1991). Prior
to this, the two groups had lived separately. During Fritz’s administration more than 100
Carolinian people from the Maria Cristina barrio on Guam were moved to Saipan. The 1902
census found 2402 people living in the Northern Marianas (Table 4). In 1904, Fritz wrote a
history and ethnography of the Chamorro people entitled Die Chamorro (Fritz, 2001).
Copra production was the main economic interest of the Germans in Micronesia, and Fritz
promoted the copra industry. He enlisted prisoners, school children, and public workers to plant
coconuts, and 50,000 coconut trees were planted on Saipan (Farrell, 1991). Copra exports more
than doubled in 2 years from 400 tons in 1901 to 900 tons in 1903. Fritz established a homestead
program to bring workers to the Northern Marianas, and many Guam Chamorro relocated. The
population of the Northern Mariana Islands increased by 30% between 1900 and 1905.
However, three typhoons struck the islands in 1905, and economic development slowed.

24
Figure 9.--Timelines of the Historic Period in Guam and the Northern Mariana Islands. Credit:
Robert Amesbury.
Table 4.--Population of the German Northern Mariana Islands as of April 1, 1902 (Fritz, 2001).
Island Village Chamorro Carolinians Foreigners Total
Rota 440 49 1 490
Tinian 36 59 1 96
Saipan 1631
Garapan 891 524 42
Tanapag 76 97 1
Sarigan 7 1 0 8
Alamagan 6 2 0 8
Pagan 35 102 0 137
Agrihan 14 18 0 32
TOTAL 1505 852 45 2402
The German Period was the shortest of the colonial administrations of the Northern Marianas. It
ended at the beginning of World War I. On October 14, 1914, Saipan was seized by Japan. The
Germans offered no resistance, and no blood was shed.

25
German-Period Fishing
Fritz’s 1904 history and ethnography of the Chamorro recorded the customs of the turn-of-the-
century Chamorro and, to a lesser extent, the Carolinians of the Northern Marianas. Concerning
fishing, Fritz (2001:68) wrote, “Naturally, fishing provides the main source of food for the island
inhabitants. However, fishing takes place only inside the reef. Only the Carolinians sometimes
go on the high seas to visit Aguiguan [or Aguijan] 25 sea miles away from Saipan, and dive for
trepang (balate) which they sell to the Japanese. They also catch turtle (haggan) and utilize weir
traps inside the reef, a fishing technique not practiced by the Chamorros.”
By Fritz’s time, the Chamorro no longer built or sailed the flying proas. Fritz (2001:73-74)
wrote
With the demise of the brave [Chamorro] nation, these ocean craft disappeared.
Only the Carolinians who migrated to the Marianas in the 19th
century, whose
canoes and sails had the same form and construction as the canoes from the
Marianas, resumed the traffic among Guam, Rota, Tinian and Saipan. [These
voyages were stopped as a result of Spanish] government policy because of a few
accidents. The last sagman is supposed to have arrived in Guam from Saipan in
1892.
According to Freycinet (2003:178), sagman is the Chamorro word for the largest proas. Fritz did
not state clearly whether the last sagman to sail from Guam to Saipan in 1892 was sailed by
Chamorro or Carolinians, but it appears that he meant it was sailed by Carolinians. He said the
Chamorro oceangoing craft disappeared with the demise of their nation, which took place as a
result of Spanish conquest in 1695, and that the Carolinians resumed the interisland traffic in the
1800s. Fritz (2001:74) said, “The Chamorros now use - solely for fishing within the reef -
outrigger canoes made of dugdug [seeded breadfruit, Artocarpus mariannensis] or lemai
[seedless breadfruit, Artocarpus altilis]. They are from three to six meters in length and are
called galaide.” (English names and species names of breadfruit added by J. Amesbury).
Fritz (2001:68) reported that the Chamorro used mainly nets for fishing, and he described three
types of nets. The talaya is a round throw net, 4 meters in diameter, with lead weights around
the perimeter. The fisherman throws it in such a way as to completely surround a school of fish
seen from the shore. He then pulls the net to shore. If a large fish is netted, the fisherman jumps
into the water and kills the fish by biting it. The fisherman can throw the net a distance of about
8 meters.
Fritz provided four Chamorro names of fishes caught with the talaya. Three of the four are
identified in the editor’s notes as follows: kichu (Acanthurus triostegus, convict tang), guili
(Kyphosus cinerascens, rudder fish) and laiguan (Valamugil seheli, mullet). According to
Amesbury and Myers (1982:123), laiguan refers to the large individuals of at least four species
of the family Mugilidae (Chelon engeli, Crenimugil crenilabis, Liza vaigiensis, and Neomyxus
leuciscus). The fourth fish that Fritz said is caught with the talaya is ti’ao (juvenile goatfishes,
family Mullidae).

26
The second net described by Fritz (2001:68-69) is the lagua. It is 5 meters long and 1.7 meters
wide, with lead weights on the bottom edge and on the top edge, floats of light wood, such as
hibiscus or breadfruit. The sides are fastened to poles. This description is similar to Freycinet’s
(2003:161) description of the lagua pula.
A group of 12 to 15 women and young men gather to use the lagua. One person stands at each
side with the poles. One person holds the net in place while another one stretches the net in the
direction of a school of fish. The remaining participants rush toward the net, shouting and
splashing to drive the fish toward the net. Then they grab the weights along the bottom edge and
raise them in order to catch the fish in the net. Fritz said the net was sometimes made of locally
spun cotton but more commonly from imported net twine. Daytime fishing with the lagua is
called lalago; nighttime fishing with the lagua is called gumade.
The third net Fritz described (2001:69) is the chentchulo, a surround net up to 200 meters long
and 3 meters wide, made of imported hemp. Up to 40 participants take the net in two boats to a
good location, preferably a small bay. Each boat takes half the net and goes in opposite
directions, letting the net slide into the water. After the entire net is in the water, both boats row
with haste to the shore, and the crews pull the net and catch onto the beach. Fritz (2001:70) gave
the Chamorro names of eight fishes caught with the chentchulo.
Sometimes at low tide, a closed in area of rocks is built as a trap near the reef. At high tide, the
chentchulo is stretched around the wall, and the fish are caught in the trap. They are grasped by
hand or speared with the two-pronged iron spear (fiska). Daytime fishing with the chentchulo is
called chentchulo haane; nighttime fishing is called chentchulo-painge.
Fritz (2001:70) also described a kind of fishing called lumulai, which takes place during full
moons. This fishing is done with an iron hook (haguet). The hook is baited with small fish or
crabs and hung in a hole on the reef. Another type of fishing, called sumulo, takes place at night
during low tides using torches (haéf, the dry sheath of the coconut flower). The fish or crabs are
grabbed by hand or speared.
Fritz (2001:71-73) said that two of the types of fishing described by Freycinet, the hachuman
fishing with the fishing stone and the låggua (parrotfish) fishing with a decoy fish, take place
only on Rota. Fritz (2001:73) described the use of fish poison, also described by Safford (1905)
on Guam, and the use of fish weirs (gigao), described by Freycinet (2003). Turtles, he said, are
caught by hand, and sometimes a female turtle is used to lure other turtles.
Fritz (2001:68) reported that women and children dig for clams and snails. He provided six
Chamorro names for mollusks. Crabs, he said, are caught by hand, and lobsters are speared with
the fiska.

27
Japanese Period (1914-1944)
After the Japanese takeover in 1914, the Northern Marianas became one of six Japanese naval
districts of Micronesia. Other districts were Palau, Yap, Chuuk, Pohnpei, and Jaluit in the
Marshall Islands. When World War I ended, the League of Nations gave Japan the mandate over
Micronesia. Japan resigned from the League of Nations in 1933 but continued to govern the
Northern Marianas as part of the Japanese Empire. Many Japanese, as well as Okinawans and
Koreans, occupied the Northern Marianas. Japan’s policy was to assimilate the Chamorro and
Carolinians into the Japanese culture. In 1935, when the indigenous population of the Northern
Marianas was less than 5000 (Table 5), there were nearly 40,000 Japanese, Okinawans, and
Koreans living in the Northern Marianas (Table 6).
Table 5.--Indigenous population of the Northern Mariana Islands during the Japanese Period.
Year
Rota
Tinian
Saipan
Northern
Islands
Total
1920 651 112 2,449 186 3,398
1925 487 180 2,639 187 3,493
1930 644 43 2,915 227 3,829
1935 788 24 3,194 291 4,297
Table 6.--Number of Japanese, Okinawan, and Korean people in the Northern Mariana Islands in
1935 (Farrell, 1991).
Island Number of Japanese, Okinawans, and Koreans
Rota 4,841
Tinian 14,108
Saipan 20,280
Anatahan 3
Alamagan 4
Pagan 89
Agrihan 2
TOTAL 39,327
What copra was to the Germans, sugarcane was to the Japanese. During World War I, the price
of sugar soared, and two Japanese companies began planting sugarcane on Saipan. When the
war ended, the price of sugar dropped, and the companies failed. But in 1920 a Japanese man
named Haruji Matsue, who had graduated with a degree in agriculture from Louisiana State
University, visited Saipan and decided he could successfully grow sugarcane there (Farrell,
1991). He formed the Nanyo Kohatsu Kaisha (NKK or South Seas Development Company) and
brought in Okinawans to grow the sugarcane. He built a narrow-gauge railroad line to carry the
cane to the factory in Chalan Kanoa, Saipan. In 1926, Matsue gained an exclusive lease on the
entire island of Tinian, which eventually produced 50% more sugar per year than Saipan. In
1930, the NKK began developing Rota, where they found phosphate deposits and began mining
operations.
By the late 1930s, Japan had begun a military buildup in the Northern Marianas. On December
8, 1941, just a few hours after the bombing of Pearl Harbor in Hawaii, Japanese planes took off

28
from Aslito Field on Saipan to bomb Guam. The American governor of Guam surrendered to
the Japanese on December 10, 1941, and all of the Marianas remained under Japanese control
until 1944.
In 1944, U.S. forces fought their way across the Pacific toward Japan. The American pre-
invasion bombing of Saipan and Tinian began on June 11, 1944 (Denfeld, 1997). After days of
bombarding Saipan from air and sea, American troops landed there on June 15. Weeks of
intense fighting with heavy losses on both sides culminated in the Americans officially declaring
Saipan secure on July 9, 1944.
The naval bombardment of Tinian was accelerated on July 22 and 23, and the 4th
Marine
Division made a surprise landing at Unai Babui and Unai Chulu (known at White One and White
Two to the Marines) on northwest Tinian on July 24, while the 2nd
Marine Division staged a fake
landing at Tinian Town to draw the attention of the Japanese. Tinian was declared secure on
August 1, 1944.
Guam had been invaded by the Americans on July 21 and was declared secure on August 10,
1944. Rota and the islands north of Saipan remained in Japanese hands until the end of the war.
Japanese-Period Fishing
Beginning in the 1920s and ending in 1944, the Japanese operated a pole-and-line fishery out of
Saipan, which was the first large scale commercial fishery in the Marianas. Table 7 shows the
Japanese pole-and-line catch of bonito (skipjack tuna) and tuna (probably yellowfin tuna) from
Saipan District for the years 1922 through 1941. Higuchi (2007) referred to the years 1922-1931
as the “Experimental Period,” and the years 1931-1941 as the “Rise of Fishing Industries." The
bonito catch peaked in 1937 at more than 8,000,000 pounds. Tuna peaked in 1936 at more than
330,000 pounds.
The Japanese pole-and-line fishery employed Japanese and Okinawan people, and most of the
fish were shipped to Japan. According to Bowers (2001:189), “No natives were employed in the
industry, neither on the boats nor in processing plants, and native fishing continued in its
traditional function of providing day-by-day food supply.” The local people were involved in
reef fishing for subsistence. However Alfonso C. Reyes, who was born on Saipan in 1924 and
interviewed there in 2005, was quite clear in stating that some local people were employed by
the Japanese in the tuna fishery (Amesbury and Hunter-Anderson, 2008).
Toward the end of the war, the Japanese fishing boats were unable to leave Saipan lagoon
because of American submarines. At that time, they fished inside the lagoon using dynamite
(Bowers, 2001:30). The American invasion of Saipan brought an end to the Japanese fishing
industry there. “American attack on the islands completely wrecked the Japanese fishing
industry. All shore installations were destroyed and the boats either sunk in the harbor or
beached and destroyed by fire” (Bowers, 2001:189).

29
Table 7.--Bonito (skipjack tuna) and tuna (probably yellowfin tuna) from Saipan District, 1922
through 1941 (Higuchi, 2007).
Year
Bonito
(metric tons)
Bonito
(1000 pounds)
Tuna
(metric tons)
Tuna
(1000 pounds)
1922 2.4 5.2 1.3 2.9
1923 2.8 6.2 1.3 2.8
1924 9.1 20.1 1.5 3.4
1925 14.8 32.6 1.4 3.1
1926 44.8 98.9 2.3 5.1
1927 28.1 62.0 2.9 6.4
1928 26.5 58.4 1.3 2.8
1929 24.7 54.4 0.6 1.2
1930 258.0 568.8 4.5 10.0
1931 564.3 1,244.0 16.7 36.9
1932 1,309.7 2,887.4 48.2 106.4
1933 1,762.3 3,885.2 9.6 21.1
1934 2,516.0 5,546.8 27.3 60.2
1935 1,786.0 3,937.4 42.9 94.6
1936 1,696.0 3,739.1 151.0 332.9
1937 3,697.3 8,151.1 88.9 195.9
1938 2,592.0 5,714.4 33.9 74.8
1939 1,297.4 2,860.2 not available not available
1940 3,379.0 7,449.5 84.5 186.3
1941 1,297.4 2,860.2 33.7 74.2
Average 1,115.4 2,459.1 29.1 64.3
In an article published in the Guam Recorder in 1931, Hans G. Hornbostel confirmed that the
fishing stone, the poiu, originally described by Freycinet (2003), was still in use on Rota.
Hornbostel’s description of hachuman fishing varied little from Freycinet’s. Hornbostel’s article
verified Fritz’s (2001) statement that this ancient type of fishing was preserved on Rota.
American Period Post-War (1944 – 1979)3
Before the end of the war, Saipan, Tinian, and Guam all became important American military
bases. Saipan was the staging area for the invasion of Iwo Jima in February 1945, and Tinian
became the largest operational airbase in World War II (Farrell, 1991). It was from Tinian that
the American B-29s Enola Gay and Bock’s Car carried the atom bombs that were dropped on
Hiroshima and Nagasaki on August 6 and 9, 1945.
From 1944 to 1947, the U.S. Naval Military Government administered the Northern Marianas.
The Chamorro and Carolinians were considered liberated people. Japanese and Okinawans were
3 The American period continues to the present, but for clarity we are discussing 1980 to the present as a separate
chapter.

30
treated as citizens of an enemy nation, while the Koreans and Chinese were treated as citizens of
countries that would regain their sovereignty after the war.
On Saipan, a camp was built for the Chamorro and Carolinians at Lake Susupe, and separate
camps were built for the Koreans and for the Japanese and Okinawans. The Chamorro from
Tinian were brought to Saipan. Before the end of 1944, the Chamorro and Carolinians were
relocated to Camp Chalan Kanoa, where they remained until July 4, 1946.
As of April 1945, the population of Saipan, excluding military personnel, was 17,974 (2426
Chamorro, 810 Carolinians, 13,373 Japanese and Okinawans, and 1365 Koreans) (Farrell, 1991).
By the end of the war in September 1945, Camp Churo on Tinian held 11,479 people, none of
whom was Chamorro or Carolinian. In September 1945, about 500 Chamorro and Carolinians
were brought to Saipan from Pagan, Agrihan, Asuncion, and Alamagan. The Chamorro on Rota
remained there.
At the end of the war, nearly 50,000 Asian civilians lived in the Marianas. All Japanese were
returned to Japan. Okinawans were given the option to remain in the Marianas, and originally
several thousand wanted to stay and live on Tinian. However, most changed their minds, and by
the end of 1946 all Asian civilians had been repatriated. The American military personnel also
left Tinian in 1946, leaving that island unpopulated for the third time in the Historic Period. By
1950, all U.S. military installations on Saipan had been closed as well.
Between 1945 and 1948, many Chamorro returned to the Northern Marianas from other parts of
Micronesia. They had moved to the other islands during the Spanish, German, and Japanese
Periods. In 1945, 76 Chamorro were brought from Pohnpei to Saipan. In 1946, 226 Chamorro
and 8 Carolinians were brought from Yap to Saipan, and 39 others returned from Palau. In 1948,
nearly 600 Chamorro from Yap were brought to Saipan and Tinian, thus repopulating Tinian.
Even with the removal of the large number of Asians and the return of many Chamorro, there
was not complete cultural unity in the Northern Marianas. Rota, whose population was mainly
Chamorro, except during the Japanese Period, was different from Saipan, whose population since
the 1800s had included many Carolinians. Also Tinian, whose Chamorro population had just
returned from Yap in 1948, was different from both Rota and Saipan.
From 1947 to 1976, the Northern Mariana Islands were part of the Trust Territory of the Pacific
Islands. A series of polls from 1958 to 1969 indicated that a majority of people wanted the
Northern Marianas to be reunited with Guam (Farrell, 1991; Rogers, 1995). However, in a
special referendum on Guam in 1969, the Guamanians voted against reunification.
The population of the Northern Marianas grew relatively slowly from 1950 to 1980, when the
Northern Marianas were under the U.S. Trust Territory governance and foreign investment and
economic development were somewhat restricted. In 1980, the population was just 16,780
(Table 8).

31
Table 8.--Population of the Northern Mariana Islands, 1958-2010.
Year Rota Tinian Saipan Northern Islands Total
1958 969 405 6,654 262 8,290
1967 1,078 610 9,035 263 10,986
1973 1,104 714 12,382 133 14,333
1980 1,261 866 14,549 104 16,780
1990 2,295 2,118 38,896 36 43,345
1995 3,509 2,631 52,698 8 58,846
2000 3,283 3,540 62,392 6 69,221
2010 2,527 3,136 48,220 0 53,883
In 1975, the voters of the Northern Marianas chose to join the U.S. as a commonwealth (U.S.
Government 1975:6), and in 1976 the U.S. Congress passed and the President signed the
Covenant to Establish a Commonwealth of the Northern Mariana Islands in Political Union with
the United States of America (Covenant) (Public Law 94-241). The Covenant defines the
political relationship between the CNMI and the United States, with the CNMI as a self-
governing entity under the sovereignty of the U.S. The relationship is governed by the Covenant
together with those provisions of the U.S. Constitution, treaties and laws of the U.S. applicable to
the CNMI.
The CNMI government adopted its own constitution in 1977, and the constitutional government
took office in 1978 when Dr. Carlos S. Camacho became the first governor of the CNMI (U.S.
Government, 1978:5). The Covenant was fully implemented on November 3, 1986, pursuant to
Presidential Proclamation 5564, which conferred United States citizenship on legally qualified
CNMI residents. The people of CNMI are U.S. citizens, but they cannot vote in the U.S.
presidential election. In 2008, Congress established a nonvoting CNMI delegate’s seat in the
U.S. House of Representatives; the first CNMI delegate took office in January 2009.
The CNMI has four municipalities (the Northern Islands, Saipan, Tinian and Rota), each having
a mayor, as well as a chiefly structure for their Carolinian communities that influence
community life. The village system, with individual mayors elected to each village, is the
prevalent local political structure.
Fishing during the American Period Post-War (1944-1979)
Soon after the end of hostilities in Saipan, the sunken hulls of the Japanese pole-and-line fishing
vessels were raised from the lagoon and reconstructed by Japanese and Okinawan carpenters,
prior to the removal of all Japanese nationals early in 1946 (Bowers, 2001:189, 65). American
diesel engines replaced the Japanese engines, which made the boats faster and more easily
repaired with American parts. Four boats were restored for use in Saipan and Tinian.
A fishing base was established at Garapan, Saipan, and another on Tinian in the embayment
north of the harbor (later the site of the Trust Territory Leprosarium shown on the 1983 USGS
map). In addition to offshore fishing, a seine crew operated in Saipan lagoon. The fish caught
were distributed to the interned civilians. The base on Tinian was abandoned when the island
was left uninhabited by the repatriation of the Japanese nationals (Bowers, 2001:189).

32
After the repatriation of the Japanese, a cooperative of indigenous fishermen was formed on
Saipan to engage in commercial fishing. The Saipan Fishing Company was the larger of two
indigenous commercial fishing operations in the Trust Territory. The other was in Truk
(Bowers, 2001:242). A small group of Carolinian men who were employed as policemen started
the Saipan Fishing Company and provided the capital. Shareholders increased to 173 people.
Only a half dozen were Chamorro; most were Carolinian (Spoehr, 2000:129).
Post-war production of the commercial fishing industry was greatly reduced from the prewar
Japanese production. More than 4000 tons of bonito were harvested in 1937, compared with
fewer than 100 tons in 1948 (Table 9). Spoehr (2000:129) reported that by 1950, the Saipan
Fishing Company was on the verge of bankruptcy. Only 12 tons of fish had been caught in the
first 9 months of 1950, and more than 2 tons had been lost to spoilage.
Table 9.--Prewar and postwar production of the commercial fishing industry, Saipan District
(Bowers, 2001:191).
Marine Products 1937 (tons) 1948 (tons)
Fish
Bonito 4075.64 Species breakdown unavailable
Tuna 97.99
Mackerel 15.98
Mullet .22
Shark 6.39
Other fish 168.98
Total Fish 4365.20 89.45
Other Marine Products
Trepang 24.34 0.00
Trochus 0.00 0.00
Turtle 0.00 0.03
Lobster 0.00 0.44
Total Other Marine Products 24.34 0.47
Grand Total 4389.54 89.92
Spoehr (2000:129-130) cited four factors in the demise of the Saipan Fishing Company: (1) the
fishermen were more familiar with reef and lagoon fishing than deep-sea fishing for bonito and
tuna; (2) maintenance of the fishing boats was a problem; (3) management of the commercial
venture was lacking; and (4) there were difficulties in transporting the fish to market in Guam
and in marketing the fish there.
Two men, Lino Olopai and Rafael Rangamar, whose fathers were part of the Saipan Fishing
Company, were interviewed on Saipan in 2005 (Amesbury and Hunter-Anderson, 2008) (Photo
5). Olopai’s father was one of the Carolinian policemen who provided the capital for the fishing
company whereas Rangamar’s father was captain of one of the boats.
The three boats were identified by their numbers, 1, 6, and 7, with the numbers pronounced in
Japanese. Boat 1 was captained by Bwabwa Rabauliman, Boat 6 by Pedro Apolisan, and Boat 7

33
by Ernesto W. Rangamar, the father of Rafael Rangamar. Ernesto Rangamar became the captain
of Boat 7 when Juan Olopai, the uncle of Lino Olopai, retired from that position.
Both Olopai and Rangamar went out on the boats when they were children. Olopai said that his
parents sent him out with different boats, and since he was believed to bring luck to the
fishermen, they fought over him.
Photo 5.--Lino Olopai (left) and Rafael Rangamar at the Seaman’s Restaurant, Saipan, February
2005. Photo Credit: J. Amesbury.
The two men described a day of fishing with the Saipan Fishing Company, which caught mostly
skipjack (bonito). Very early in the morning, they set out for Tinian or Aguijan (Goat Island) to
catch bait, a small silver-colored fish, known in Japanese as iriko. The boats would drop men off
in the water while it was still dark, and the men would move toward the cliff concentrating the
small fish as they moved, using a fine, long net tied against the wall of the cliff with weights to
hold it down. The men on board the boats would pull the net in and scoop the baitfish into the
boats, storing them in saltwater containers to hold the live bait.
When a school of fish was spotted, the captain brought the boat up toward the school and slowed
the boat down. The fishermen threw a couple handfuls of bait into the water. When the school
of fish moved in, the boat was stopped. The boats, which had diesel engines, pumped saltwater
and sprayed it out to camouflage the boat and fishermen.
The fishermen used bamboo poles, which they worked on in their spare time. The line they used
was from Japan. The hooks had metal heads and no barbs. There was no need to unhook the
fish. A fisherman would pull in his pole and flick it or snap it to release the fish. They fished
with unbaited hooks. One man would move about the boat throwing bait into the water as the
others fished and called out for bait as necessary. Each boat was staffed with 15 men, and they
could fill the boat with their catch in 30 minutes. Olopai and Rangamar estimated the catch

34
consisting of bonito, yellowfin tuna, and wahoo at 60 tons per boat, but Amesbury noted that
figure is high compared with data in Bowers (2001:191) and Table 9 (above).
In the heat of the day, from about 10:00 am to 2:00 pm, the fish would stop biting, causing the
fishermen to cease pole-and-line fishing operations and engage in bottomfishing or trolling.
About 2:30 or 3:00 pm, the fishermen would resume pole-and-line fishing until sunset. The
fishermen sold their fish in Saipan, Tinian, Rota, and Guam. It was a long day by the time they
had delivered their fish and returned home. The boats came in by the lighthouse. There was a
walk-in refrigerator at Garapan, and several of them near Kristo Rai.
Olopai said that sometimes the fishermen played jokes on him. They would fling their fish way
back in the boat, then look around surprised and ask what happened to it. Olopai said his uncle
would sometimes break into a Carolinian dance to rejoice over the catch or some
accomplishment of Olopai’s. Both men said they were lucky to grow up in those times because
the families were very close back then. When the Saipan Fishing Company ended about 1950,
the men who had been involved in the company fished for their own families.
Olopai and Rangamar related how they dried fish. They cut the fish in half and salted and dried
it in the sun for a day or two. Then they put the fish into a bucket and covered it with leaves, and
put weight on it. When they took it out, they put it on a screen and smoked it. The smoked fish
lasted longer than dried fish. They said the fire was always going in a Carolinian outdoor
kitchen. Fish that was not dried was eaten raw, as sashimi, barbecued or cooked in a soup.
When a large amount of food was prepared for a big gathering, the um or underground oven was
used. The um was used to cook a turtle or pig. Sometimes two um were used for a big gathering
with a separate um for breadfruit.
When the Chamorro returned from Yap to Tinian in 1948, there was no employment, so the men
were self-employed as farmers and fishermen. Lino Lizama of Tinian said that his father, who
was one of the people who moved to Tinian from Yap, obtained a Grumman aluminum canoe
from a U.S. military man (Amesbury and Hunter-Anderson, 2008). Lizama still has the canoe
(Photo 6). The manufacturer’s plate on the canoe indicates that it was the 2,424th
canoe built for
sale by Grumman, and it is a 17-ft model that was built in 1946 or 1947. Lizama said his father
used the throw net and long net for reef fishing and the canoe for bottomfishing, but not in deep
water. The canoe was also used to harvest atulai (big-eye scad, Selar crumenophthalmus) from
fish traps made of wire. Lizama called the chamber of the trap apusento (Chamorro for bedroom
or room) in which the fish were caught. Sometimes moray eels swam into the fish traps and ate
the fish. Lizama’s father took the atulai to Saipan in coolers on Pangelinan’s boat. Carmen Dela
Cruz Farrell’s father fished with Lizama’s father. They had a small organization for atulai
fishing.

35
Photo 6.--Lino Lizama in his yard in Tinian in March 2005 with a Grumman aluminum canoe
built in 1946 or 1947. Photo Credit: J. Amesbury.
As the cash economy grew in the 1960s, people in the CNMI began to buy boats. According to
Lino Lizama there were only three or four boats on Tinian by the mid-1960s, and Tony Mesngon
said only about four people on Rota owned boats in the 1960s (Amesbury and Hunter-Anderson,
2008). Lizama told how his father acquired the cash to purchase a boat. In the mid-1960s,
Lizama’s father found a large quantity of machine gun shells made of brass left by the U.S.
military. The brass was located at Dumpcoke, northwest coast of Tinian, where the military
dumped coke bottles and other things. Lizama’s father tied a weapons carrier to a big tree and
used the winch on the weapons carrier to raise the drum cans of brass. He sold the brass and
used the money to buy a boat and engine. He had five sons who fished with him.
The boat Lizama’s father purchased was an 18-foot wooden boat locally built in Saipan by
Lizama’s father’s brother-in-law, Pobio Cabrera. (Pobio Cabrera’s wife was a cousin of
Lizama’s father.) Cabrera worked for Public Works as a carpenter, but he also built and sold
boats. The engine was a 40-horsepower Evinrude. The name of the boat was Bithen de Carmen.
Estanislao “Stan” Taisacan and Frank Toves, two fishermen on Rota, recalled that electricity was
available on Rota by the late 1960s, but it was shut off at 8 pm or midnight (Amesbury and
Hunter-Anderson, 2008). It was not until the 1970s that everyone on Rota had 24-hour-a-day

36
electricity. Toves worked for the government, but he fished for his family, sometimes sold fish,
and also dried fish. He had a kerosene-operated refrigerator before electricity was available 24
hours a day.
Carmen Sanchez of Tinian told how she preserved ti’ao (juvenile goatfishes, family Mullidae)
that her father Justo Lewis Sanchez, a Chamorro born on Yap in 1920, caught with a talaya or
throw net (Amesbury and Hunter-Anderson, 2008). Carmen used six large pots that were left
behind on Tinian by the U.S. Navy to salt and store the fish. When the salt caused liquid to
come out of the fish, the liquid was poured off and boiled to kill the bacteria, but the fish were
not boiled. The liquid was allowed to cool and poured back over the fish. In this way, the fish
could be preserved for a long time. Carmen said it was the more well-to-do families who
purchased the first refrigerators.
Stan Taisacan’s father, Clemente Saralu Taisacan, was born in Saipan in 1922, but moved to
Rota in the late 1920s (Amesbury and Hunter-Anderson, 2008). He was half Chamorro and half
Carolinian. Clemente’s fishing partner was Tobias Songao Maratita, Stan’s mother’s
stepbrother. Maratita carved a canoe from a seeded breadfruit tree (Artocarpus mariannensis),
and the men used it for fishing. The canoe was lost during Typhoon Karen in 1962, and after
that they used a rowboat built of marine plywood.
Clemente did all kinds of fishing, including fishing for hachuman with the poiu from about
March through June. The fishermen would chew up young coconut of a certain stage of ripeness
to use as bait. Using the poiu and shortening the line a little each day, they fed the fish in a
certain spot every day for about a week. After a week, as soon as the canoe reached the spot, the
fish would be splashing around near the surface where they could be easily netted. The
fishermen could fill the canoe, which Stan estimated was about 16 feet long, 2 feet wide and 2
feet deep. After netting the fish, the fishermen would have to paddle back with their feet over
the sides of the canoe, because the canoe was so full of fish.
Stan helped his father with the hachuman fishing, which they did until the late 1960s. He said
they sometimes slept on the beach to watch who was going out and to guard their fish (the fish
they were feeding). Stan said it would be considered a crime for another fisherman to steal their
fish from the water where they had been feeding them. The catch was shared with family
members and salted and dried or pickled to preserve it.
Stan’s father passed away in 1980, but Stan is now perpetuating the old fishing methods. He and
his son have carved two paddling canoes (galaide in Chamorro) from Hernandia logs (Photo 7).
The larger of the two canoes is about 14 feet long. Stan uses the poiu for hachuman fishing. He
still has the poiu used by his father, and he has made two replicas using modern tools including a
grinder and sander. Stan said that rather than chewing the coconut meat, they sometimes use a
food processor, and they use rice as well as coconut.

37
Photo 7.--Estanislao Taisacan on the beach in Rota in February 2006 with two canoes he and his
son carved from Hernandia logs. Photo Credit: J. Amesbury.
At the time he was interviewed in 2005, Juan San Nicolas of Saipan was President of the Saipan
Fishermen’s Association and also the Resident Executive of the Indigenous Affairs Office,
CNMI (Amesbury and Hunter-Anderson, 2008). San Nicolas is a Chamorro born in 1947. He
learned how to fish from a friend and has been fishing since about 1972. His friend was
unemployed, and they wanted to earn some income, so San Nicolas bought the boat, and the
friend taught him how to fish. They shared equally the profits they made after expenses.
The boat, which San Nicolas bought from Joeten Enterprises in Saipan, was a 21-foot Bayliner
with a 135-horsepower outboard motor. The men caught skipjack (bonito) by trolling and onaga
(Etelis coruscans) and opakapaka (Pristipomoides flavipinnis) by bottomfishing. They had no
Global Positioning System to help them locate their fishing spots. They used landmarks, or if
they were caught in a rainstorm, they used a compass.
San Nicolas owned two big refrigerators; as a result, people would come to buy fish from him.
He sold skipjack for 35 cents a pound and bottomfish for less. San Nicolas became the first
president of the Saipan Fishing Co-op in about 1976. He said the problem with the Co-op was
that the fishermen caught more than they could sell. They had agreed not to sell outside the Co-
op, but the Co-op couldn’t market all the fish. San Nicolas said that at that time there were only
two hotels (Royal Taga and Hafa Adai Hotel), and there were few outsiders in Saipan. Saipan
was still part of the Trust Territory. The population was small and their buying power was weak.
The next president of the Co-op did not succeed in getting the cooperation of the fishermen, as
the fishermen kept on fishing, but bypassed the Co-op. As a result, the Co-op ended 2 or 3 years
later.
38
POPULATION AND ECONOMY SINCE 1980
This chapter begins with the post-Commonwealth boom and then describes the following
economic collapse, and the resulting current condition of CNMI’s population and economy.
The Economic Boom of the 1980s
After the Northern Marianas became a Commonwealth, its social and economic conditions
changed dramatically. According to the Commonwealth Covenant, only certain sections of the
U.S. naturalization and immigration laws applied to the CNMI, which allowed the CNMI to
control its own immigration. Under local immigration authority, the CNMI could allow aliens to
enter the territory for travel purposes and the local government could issue permits to aliens for
work opportunities. Aliens with passports could also travel from the CNMI to the United States,
if they had the necessary travel documents.
This allowed the CNMI to bring in low-wage labor from Asia. The Covenant also allowed
products made in the CNMI to enter the United States duty free. Both of these provisions
encouraged the growth of the garment industry in Saipan. The local government liberalized
foreign investment, established a low minimum wage and allowed businesses to utilize foreign
"guest workers." This began an era of rapid expansion in the CNMI population as the economy
grew. A 2003 Bank of Hawaii-East West Center report described the economic considerations
that led to development of the garment industry on Saipan:
Soon after its legal identity was established, the question was: what would the
commonwealth’s economy be like once it became an integral part of a vast but
geographically distant economy? The nearest U.S. territory, Guam, was not an
appropriate example because there was no U.S. military presence in the
commonwealth. Control of immigration and labor matters were major
advantages, but political autonomy in itself was not a sufficient condition to
attract large sums of capital to initiate large-scale industry, whether in services
or manufacturing. Another important advantage, although not limited to the
commonwealth, was that goods manufactured there could be sold in the United
States without import duty and without the requirement that workers be paid
U.S. minimum wages.
Together these various advantages enabled the commonwealth to take a totally
different route from its neighbors. They could allow Asian manufacturers to
set up shop in the islands, hire Asian temporary workers, manufacture
garments, and sell them in the U.S. domestic market as if they were produced
anywhere else in the country. Similar arrangements were in place in American
Samoa, but there a small manufacturing (tuna-canning) labor force from its
neighbor, Samoa, was involved. As would be the case with CNMI garments,
fish canned in American Samoa factories are sold duty-free in the United
States. However, since the labor market and working conditions in the

39
canneries have not made news in the regional media, American Samoa has not
attracted the same kind of attention as has the commonwealth.
By encouraging Asian garment manufacturers to commence operations on
Saipan under the terms and conditions they did, the commonwealth in effect
enhanced its comparative economic advantage and its leaders concluded that
tourism alone was not the best path to economic prosperity and stability. The
belief was that garment making would supplement other economic activities,
thus preventing a one industry economy, especially one based on tourism,
which would be subject to unpredictable swings in addition to cyclical changes
in the regional and global markets (Bank of Hawaii, 2003).
Over the next 15 years, the success of the apparel industry contributed to a dramatic change in
the CNMI economy; between 1980 and 1995, the number of jobs in the apparel industry climbed
from almost nothing to 7710. The CNMI garment industry produced clothing for global brands
such as Tommy Hilfiger, Calvin Klein, Gap, Levi's, Abercrombie and Fitch, Polo Ralph Lauren,
Ann Taylor, and Liz Claiborne.
Tourism was joining the garment industry as a major economic driver. The proximity of the
CNMI to Japan and other Asian countries combined with its natural tropical beauty made the
CNMI a prime location for the establishment of a tourism-based economy during the 1980s and
1990s. From 1980 to 1995, the number of tourists and other travelers to the CNMI increased
sevenfold, rising to nearly 700,000 and boosting visitor industry employment to an estimated
9570 (McPhee & Associates and Conway, 2008). From 1988 to 1996, tourism was the
Commonwealth’s largest income source and most dynamic industry, as well as its main
comparative economic advantage (Bank of Hawaii, 2003). Visitor arrivals increased steadily
from 1990, reaching a high of 726,690 in 1997 (Fig. 10). The impact of tourism extended
beyond airlines, hotels and restaurants; it partly supported the Commonwealth’s retail trade,
especially in the core urban area that catered more to tourists than to residents, and transportation
sectors. When tourist numbers rose, the effect rippled through many segments of the economy
(Bank of Hawaii, 2003).
Both the garment and tourist industries contributed directly to the economy by generating
employment and bringing revenue from outside the CNMI via exports. In 1995, these two
industries accounted for about 80% of all employment. In addition, a 1999 study found that
garment manufacturing and tourism accounted for about 85% of CNMI’s total economic activity
and 96% of its exports.
From 1980 to 1995 CNMI employment levels increased by nearly 13% annually, one of the
highest growth rates in the world (McPhee & Associates and Conway, 2008), and another 11,060
jobs were added in nonbasic sectors, including government, during the same period. The
expansion of the CNMI economy was made possible by a fourfold increase in population, much
of it due to a wave of migrants from Asia looking for work (many of them were employed in the
visitor and apparel industries) (McPhee & Associates and Conway, 2008).

40
Figure 10.--Trends in visitor arrivals.
The expanding economy increased employment rates (from 31.1 percent in 1980 to 56.4 percent
in 1995) and average household income (from $12,859 in 1980 to $29,946 in 1995); the average
income of households headed by Chamorro increased even more during this time period, from
$11,464 to $39,750 (McPhee & Associates and Conway, 2008).
The Economic Collapse in the late 90s and 2000s
The garment industry and tourism produced such rapid economic expansion that other sectors of
the economy were not expanded, leaving the Commonwealth highly dependent on these two
sectors. When they began to decline, there was little to replace them and the effects, which
remain today, were devastating.
Garment Industry
For years, CNMI’s garment industry enjoyed favorable treatment under the Multi-Fiber
Agreement (also known as the Agreement on Textile and Clothing), which expired in January
2005, thereby opening up U.S. garment markets to manufacturers in developing countries, most
notably China. In January 2005, in accordance with World Trade Organization agreements, the
United States eliminated quotas on textile and apparel imports from other textile-producing
countries. It was just a matter of time when the garment industry in the CNMI would not survive
competition from much lower-cost manufacturers. The first garment factory closed its doors in
2000 (McPhee & Associates and Conway, 2008) and the last in 2009.
The seeds of the downturn were sown when China entered the World Trade Organization in
2001 and obtained access to American markets in 2005 (McPhee & Associates and Conway,
2008). Up to that time, CNMI garment factories competed successfully in the U.S. apparel
market because of the commonwealth’s relatively low minimum wage and access to foreign
0
100,000
200,000
300,000
400,000
500,000
600,000
700,000
800,000
Nu
mb
er
of
visi
ts

41
labor. But in competition with China’s extremely low wage rates, the CNMI could not maintain
its advantage. Of the 34 factories operating in 2000, only 3 remained open in September 2008,
and the last 3 closed in March 2009 (First Hawaiian Bank, 2010). The value of CNMI textile
exports to the United States dropped from $1.1 billion in 1998 to $317 million in 2007 (GAO,
2008), and just $3 million in 2009.
Tourism Industry
Tourism’s role as an economic driver remains, but its benefits have dropped significantly over
the years. In 2003, the Bank of Hawaii noted that tourism’s
Sharp decline in 1997-98 and then in 2001 and only modest recovery since then
has shown how fragile and vulnerable that advantage was. The tourism industry
is always subject to seasonal ups and down; for example, October to mid-
December is considered a ‘death valley’ period for travel …several factors--
Korean Air Lines’ decision to suspend flights, the Asian financial crisis, the
ongoing economic decline in its principal market, Japan, and the terrorist attacks--
combined to stall the commonwealth’s once thriving tourist and retail industry…
The Asian economic crisis has had a clear impact on visitor arrivals in the late 1990s. From the
peak in 1997, visitor arrivals fell to 491,602 in 1999 but rebounded slightly to 526,111 in 2000.
The economic disaster brought by 182,000 in lost airline seats annually as a result of Japan
Airlines’ pullout from CNMI in October 2005 still lingers. More recently, Japanese tourists
cancelled 1800 reservations in CNMI following the March 11 earthquake, tsunami, and resulting
nuclear crisis.
As shown in Figure 10 (above), the outlook has not grown brighter (Bank of Hawaii, 2003).
During the 2005-2009 period, visitor arrivals declined from 506,846 to 353,956, both reductions
from the previous high of approximately 700,000 in the mid-1990s. The decline in visitor
arrivals was also evident in hotel occupancy rates, which decreased from 70% in 2005 to 61% in
2009. Hotel room rates per night increased from $83 in 2005 to $95 in 2009, as some hotel
businesses attempted to recoup their costs of renovation and all hotels attempted to compensate
for the higher costs of operation, including fuel, shipping, food, and labor (First Hawaiian Bank,
2010).
The CNMI’s greatest declines in both visitors and flight seats by country were from Japan, which
represented the largest share of visitors from any country. The Japanese market share dropped
from 71% of the tourist arrivals in 2005 to 50% in 2010, a decrease in Japanese arrivals of 51%,
from 376,263 to 182,820 (GAO, 2011a). In 2011, visitors from Japan dropped below 50 percent
of CNMI visitor arrivals, an ominous statistic for a tourism industry highly dependent on
Japanese visitors.
The tourism economy of the CNMI is closely linked to the economies of Japan, Korea, and
China. When the Asian currency crisis unfolded in the late 1990s the CNMI was in a highly
vulnerable position. Suddenly, the cost of business operations for Asian companies operating in
the CNMI skyrocketed as the U.S. dollar grew stronger against Asian currencies. This also

42
affected tourists because their currency no longer had the purchasing power to afford them trips
to the CNMI. The results were dramatic. A drastic decline in tourism occurred, which resulted
in declines in tourism service industries such as hotels and restaurants, retail trade, construction,
and other services.
The tourism industry is always volatile, responding to a variety of social and economic forces
and events. The industry may try to adapt to conditions, in part, through marketing. The
economy affects such efforts, which compounds the problem; in 2010, for example, the Marianas
Visitor Authority (MVA) temporarily suspended a number of promotional activities in Japan and
Korea in order to pay outstanding liabilities to hotels, tour agencies, and marketing partners.
Another avenue to tourism economic development had been legalized casino gambling and
associated development which has not, to date, provided the level of benefits once expected. In
1989, Tinian voters approved the legalization of gambling, with the first casino opening on the
island in 1995. This casino is no longer in operation, but the Tinian Dynasty Hotel & Casino
opened on April 25, 1998 and is still operating. While up to five licenses are allowed, three
proposed casino investments received conditional licenses but have not begun operating.
The Rota Casino Act of 2007 established the Rota Casino Gaming Commission and provided for
an unlimited number of licenses for casinos on Rota (although the Commission can cap the
number of licenses if necessary for public health, safety, and/or welfare). Saipan voters first
rejected the Saipan casino initiative in 2007 and have continued to reject them since then.
Current Population and Economy
The closing of the garment industry and inconsistency of tourism created effects that rippled
through the Commonwealth’s society. In 2000, the CNMI had a population of 69,921, 90% on
the capital island of Saipan, about 5% each on Tinian and Rota, and a handful of people in the
Northern Islands. By 2005, as a result of the faltering economy, the CNMI-wide population
dropped to 65,927 and Tinian’s population had declined even more rapidly to 2829, just 4% of
the total population (CNMI Department of Commerce, Central Statistics Division 2008). Less
than half (49%) of the residents of CNMI were U.S. citizens at the time, and the population
consisted of 30% Filipinos, 23% Chamorro, 16% Chinese, 5% Carolinians. Asians made up
more than half (53%) of the CNMI’s total population, Pacific Islanders about 37%, Caucasian
less than 2%, while 8% reported multiple ethnicities (CNMI Department of Commerce, Central
Statistics Division, 2008). In 2009, the CNMI Department of Labor reported that guest workers
accounted for 16,500 (59 percent) of the CNMI workforce of 28,000 persons (Government
Accounting Office, 2010).

43
The population was not prospering economically in 2000, according to a 2003 report from the
Bank of Hawaii:
In 2000, 46.0 percent of CNMI’s population lived in households with income
below the poverty level, according to the U.S. Bureau of the Census. Allowing
that poverty status comparisons may be inappropriate because the CNMI
economy is vastly different from the nation’s, they do shed light on some of
the underlying issues of this unusual labor market. Of the 46.0 percent in
households living below poverty level, 10.3 percent were in households of
married couples, 7.6 percent in other families with wife or husband absent, and
a significant 28.2 percent in households of unrelated individuals. Regardless
of the characteristics of these segments of the low income population, that
nearly half of the CNMI population existed below the poverty level in 2000 is
a phenomenon deserving of more careful and detailed study. (BOH, 2003)
The 2005 CNMI Department of Commerce Household Income and Expenditure Survey counted
2829 residents on Tinian. All of Tinian’s population is located in the south with 76% of the
island’s 2005 population located in and around the main village of San José. The ethnic makeup
of Tinian is influenced by the resort/tourism industries that employ guest workers from the
Philippines and other Asian countries, with 32% of the population of Tinian of Filipino descent.
Just under half of the population of Tinian citizenry was born in CNMI. The great majority of
the foreign-born had not become U.S. citizens, and the foreign born population had a higher
outward migration rate than did native born residents (Joint Guam Program Office, 2010).
Rota’s population peaked at 3509 in 1995, declined to 3283 in 2000, less than Tinian’s
population at the time, and then dropped to 2490 in 2005, still under Tinian’s population (Joint
Guam Program Office, 2010). Rota’s 2005 population had the highest proportion of Chamorro
(65%), compared to 44% for Tinian and 20% for Saipan, and had the highest proportion of U.S.
citizens (77%), compared to 55% for Tinian and 49% for Saipan (Joint Guam Program Office,
2010).
Based on data available from the 2010 Census (Table 10), the population of the CNMI decreased
by more than 22% from 2000 to 2010 (Table 6). The greatest percent drop was on Rota (23%)
while the lowest was on Tinian (11%).4
4 The U.S. Census Bureau will not publish a full demographic profile until 2013. This profile will consist
of a detailed cross tabulation report by places or village level geography, and a report on social, economic
and housing characteristics by places or village level geography. (http://gov.mp/2011/01/14/12-22-10-us-
census-schedules-data-release-for-cnmi/).

44
Table 10.--CNMI Population (Source: U.S. Census Bureau).
Population
Change,
2000 to 2010
2000 2010 Number Percent
Geographic area
Commonwealth of the Northern Mariana
Islands.
69,221 53,883 - 15,338 -22.2
Northern Islands Municipality 6 0 - 6 -100.0
Rota Municipality 3,283 2,527 - 756 -23.0
Saipan Municipality
62,392 48,220 - 14,172 -22.7
Tinian Municipality 3,540 3,136 - 404 -11.4
Paralleling the drop in population is continued economic decline, no matter what measures are
used. Business Gross Receipts, a measure of the value of sales on CNMI, have decreased over
6% per year since 2005 (First Hawaiian Bank, 2010). Government general expenditures
declined almost 7% per year over the same period, while cost of living, as measured by the
change in the Consumer Price Index (CPI) for all items sold in the CNMI, increased more than
6% per year between 2002 and 2009. The decreases in real consumer spending in 2008 and 2009
negatively impacted economic growth, most notably in 2009. In 2009, real consumer spending
fell by approximately 13% after decreasing by less than 1% in 2008.
In testimony before the U.S. Senate Committee on Energy and Natural Resources, GAO (2007)
described results of its 2006 report on CNMI5:
CNMI faces daunting economic, fiscal, and financial accountability challenges.
CNMI’s economic and fiscal conditions are affected by its economy’s general
dependence on two key industries. In addition, although progress has been
made in improving financial accountability, CNMI continues to have serious
internal control and accountability problems that increase its risk of fraud,
waste, abuse, and mismanagement.
A GAO report (2007) and accompanying congressional testimony described the declines
apparent in the early 2000s:
The fiscal condition of CNMI’s government has steadily weakened from fiscal
year 2001 through fiscal year 2005, the most recent year for which audited
5 U.S. Insular Areas: Economic, Fiscal, and Financial Accountability Challenges (GAO-07-119)

45
financial statements for CNMI were available. CNMI’s fund balance, which
generally reflects the amount of resources available for current government
operations, went into a deficit balance during fiscal year 2002 and continued to
decline to a deficit balance of $84.1 million by the end of fiscal year 2005.
CNMI has also shown significant declines and negative balances in its reported
net assets, which is another measure of fiscal health, and which represents the
balance of total assets less liabilities. In order to finance its government
activities in an environment where expenditures have exceeded revenues,
CNMI has increased its debt, causing its debt to asset ratio to increase
significantly since fiscal year 2002. In addition, several indicators point to a
severe fiscal crisis during fiscal year 2006. The CNMI government has
implemented several drastic cost-cutting and restructuring measures, including
“austerity holidays” consisting of biweekly furloughs, during which
government workers are not paid and many government operations are closed
to reduce personnel and operating costs during fiscal years 2006 and 2007. In
addition, other measures were passed, including restructuring of payments to
the retirement plan and reforming the rate of compensation for boards and
commissions (GAO, 2007).
An article in the Saipan Tribune (June 11, 2010) summarized the changes: “From business gross
sales to exports, imports and hotel occupancy rate, the CNMI's major economic indicators have
dramatically dropped in at least the last five calendar years, mainly due to the death of the
garment industry and the steady drop in tourist arrivals.” The article cited such dramatic
decreases in such indicators as business gross revenues, bank deposits, auto sales, and building
permits, some of them dropping to historic lows.
The economy is reflected in the issues facing the CNMI government, including Executive
Branch agency furlough days increasing to every Friday and significant problems with the NMI
Retirement Fund. As of February 2012, the Fund's investment portfolio (from which it draws
pension funds) had an estimated value of $253 million, while its accrued unfunded liability is
over $900 million, and the fund is projected to collapse within 3 years
(http://pidp.eastwestcenter.org/pireport/2012/April/04-06-06.htm). The 2010 Auditor’s report
(Pai, 2010) found that in 2009 the CNMI General Fund deficit rose 17.4% from 2008 to 2009,
from $256 to $301 million. FY09 reports on financial statements for the public school system
and Commonwealth Ports Authority disclosed material weaknesses in internal controls, as well
as problems with the Commonwealth Utilities Corporation.
Gross domestic product6, a measure of the output of goods and services produced by labor and
property located in the United States, is another key economic indicator. Gross domestic product
(GDP) was not calculated for American Samoa, the CNMI, Guam and the U.S. Virgin Islands
until the beginning of 2009. In July, 2011, the Bureau of Economic Analysis released estimates
6 The Bureau of Economic Analysis defines gross domestic product (GDP) as the sum of consumer
spending (or “personal consumption expenditures”), private investment, net exports (exports less imports)
of goods and services, and government spending (or “government consumption expenditures and gross
investment”). http://www.bea.gov/scb/pdf/2011/09%20September/0911_territories.pdf.

46
of GDP for CNMI for 2008 and 2009 and revised the estimates for 2002 to 2007 that had been
released the year before. The revised estimates showed a steeper decline over the 2002 to 2007
period (6.3%) than the previously published estimated decline of 4.2%.
The estimated real GDP (GDP adjusted to remove price changes) decreased 19.8% in 2009 after
decreasing 12.1% in 2008; this compares to a real GDP for the U.S. (excluding the territories)
decrease of 2.6% in 2009 and no change from 2008 to 2009. The estimates of real GDP for 2008
and 2009 reflected continued declines in exports and in consumer spending. The decrease in
exports of goods in 2008 and 2009 reflected the continued decline of the CNMI’s garment
manufacturing industry. Exports of goods fell by more than 60% in 2008 and by over 80% in
2009. Further contributing to the decline in real exports in 2009 was a significant drop in exports
of services, reflecting a decrease in the number of visitors to the islands. Despite this decline,
tourism services were the territory’s only significant export in 2009.
Osman (2004) described one possible comparative advantage for tourism in the CNMI: “A
somewhat longer-term prospect for CNMI looks more promising, mainly because of the
emergence of China as a regional tourist supplier. … since CNMI-bound tourists do not need
U.S. visas, as they do to enter Guam, CNMI has the advantage to receive Chinese tourists any
time once China places the Commonwealth on the list of ‘approved destinations’ and allows
Chinese citizens to travel there.” Korean arrivals increased from 65,049 in 2005 to 108,079 in
2010, and the Korean market share increased from 12% to 29% in the same period (GAO,
2011a). The outlook for Russian tourism to Saipan has also improved; in January 2012, a
Russian family was welcomed as the 20,000th guest to arrive on Saipan (Marianas Variety Jan.
5; http://www.mvariety.com/special-features/business-edge/42954-20000th-russian-guest-
arrives-on-saipan.php). China and Russia still have a combined share of less than 10% of the
total tourist arrivals, but they are emerging markets, and Russia accounts for a disproportionate
percentage of tourism expenditures (GAO, 2011a).
However, a recent First Hawaiian Bank report on the economies of Guam and CNMI (First
Hawaiian Bank, 2010) stated, “economic prospects through 2014 appear to lack promise as
well.” The report cited one source of business uncertainty as implementation of the
Federalization law on November 28, 2009, which applied U.S. immigration law to CNMI, with
implications for visa requirements for tourism as well as for foreign workers.
As allowed by Section 503 of the Covenant, Congress passed the Consolidated Natural
Resources Act of 2008 (Public Law 110-229), which applied federal immigration laws to the
CNMI. The application of federal immigration laws to the CNMI created a situation where
aliens legally residing in the CNMI under local laws would be without legal status under federal
laws and could face deportation (GAO, 2011a). The Act provided a 2-year transition period,
which ended on November 27, 2011, for federal immigration laws to be fully applied. During
this 2-year transition, aliens working under CNMI-issued umbrella permits had legal status. In
November, 2011, U.S. Citizenship and Immigration Services announced that until December 31,
2012, it would consider granting parole on a case-by-case basis to the immediate relatives of
U.S. citizens and certain “stateless” individuals in the CNMI. This announcement came just
before the November 27 expiration of umbrella permits held by these nonresidents who may not

47
have had other options under U.S. immigration law.
http://pidp.eastwestcenter.org/pireport/2011/November/11-25-01.htm
The Guam-CNMI Visa Waiver Program replaced CNMI’s former visa program, which had
benefitted tourists and foreign investors from China and Russia--countries currently not included
in the Guam-CNMI Visa Waiver Program. The report did point out that the parole status to
visitors from these nations could be extended on the discretion of the secretary of the U.S.
Department of Homeland Security (DHS). Visa requirements for hiring foreign workers are also
affected by the Federalization law, which will terminate the CNMI-only “CW” visa after
December 31, 2014, unless extended. The change is expected to make it more difficult for
foreign workers to get in to the CNMI, affecting all industries including tourism, although how
federal agencies implement the law over time could determine the level and magnitude of its
economic effects (GAO, 2008).
Another federal action having significant social and economic
implications was application of minimum wages to CNMI (and
American Samoa). In 2007, the United States enacted PL-110-
28, incrementally raising the minimum wages until they equal
the U.S. minimum wage. CNMI’s minimum wage increased
four times before legislation delayed the increases, providing for
no increase in 2011 (GAO, 2011b). If further increases are
implemented as scheduled, CNMI's minimum wage will reach
that of the U.S. in 2016.
Mandated annual studies by the GAO have described effects as
the wage increases over time (GAO, 2010; GAO, 2011b; GAO,
2011c). The first minimum-wage increase raised wages for
about a third of workers at private sector employers that
responded to a GAO questionnaire (GAO, 2010). Wage data
from GAO’s questionnaire indicated that future increases will
affect the wages of more than 80% of those employers’ workers
by 2015. Small employers and other private sector officials had mixed views of the increases.
Many private sector employers said minimum wage increases imposed additional costs during a
time in which multiple factors made it difficult to operate, but many expressed greater concern
over immigration changes than minimum wage hikes.
In the tourism industry, scheduled minimum wage increases through 2016 would affect 95% of
workers employed by questionnaire respondents (GAO, 2011a). Tourism employers reported
that they took cost-cutting actions from June 2009 to June 2010 and planned to take additional
actions, including laying off workers. Few of these tourism employers attributed past actions
largely to the minimum wage increases, and one half or less did so for each of the planned
actions. Employers in the tourism industry emphasized that their employment actions were
linked to multiple factors, especially the federal immigration law and the declines in the number
of tourists. Workers said they favored pay increases to help meet rising prices, but were
concerned about losing jobs and work hours. CNMI hotels have generally absorbed minimum
wage costs rather than increasing room rates (GAO, 2011b).

48
CONTEMPORARY CNMI FISHERIES (1980-PRESENT)
This section first describes the sociocultural importance of fishing and then the small boat fleet,
commercial fishing trends, and fisheries governance and institutions. These sections provide a
snapshot of CNMI’s dependence on and engagement in fishing, the basis of CNMI as a fishing
community today.
Sociocultural Importance of Fishing
The previous sections on the history of fishing describe a long attachment to the sea and marine
resources; this tradition continues today.
Saipan residents surveyed in 2005 (Van Beukering et al., 2006) who said they were active and/or
commercial fishermen were asked to answer additional questions to better understand the
cultural importance of fishing on Saipan and the social and economic role it plays among
households and individuals (Van Beukering et al., 2006). About 20% of the sample (79 people)
responded to these questions. Of these individuals, 76% had fished more than 10 years. The
most frequent type of fishing reported was snorkel spearfishing at night (participated in by 73%
of the fishermen) and snorkel spear fishing during daytime (58% of the fishermen), followed by
hook-and-line less than 100 ft deep (36%), trolling (21%) cast net (talaya; 14%) hook-and-line
more than 100 ft deep (9%), trapping (octopus, crabs, etc.; 19%), foraging the reef (8%); 18%
said they participated in one or more other techniques. Less than a third (30%) said they owned
a boat.
When asked about motivations for fishing, social and cultural reasons dominated. Nearly a third
(32%) said they just really like fishing; 23% said they really need the fish to feed their family;
13% reported that giving catch to family and friends strengthened social bonds; 12% said their
family has always fished and fishing is their life; 6% said it strengthens the bond with their
children/family; and 4% said they needed the money from the fish they sold. Other reasons
included strengthening the bond with their fellow fishermen, fishing to catch fish for
fiestas/parties, and seasonal fishing for manahak, ti'ao, and i'e (2% each).
The fishermen reported going fishing an average of 71 days a year, with 26% going once every
2-3 days and 24% fishing once every 2 weeks. The average trip was about a half day (4.4 hours)
with 41% fishing between 2 and 4 hours and 30% fishing between 4 and 6 hours. The fishermen
reported having decreased their amount of fishing over time, fishing an average of 93 days a year
10 years ago. The most common reason for the change was having less time to go fishing,
followed by changing availability of fish, older age, higher costs, and changing family
conditions.
The most frequently caught fish were Saipan reef fish (caught by 54% of the fishermen),
followed by shallow-water bottomfish (23%) and reef invertebrates such as octopus, shellfish
and crabs (14%). The median monthly catch was 40 lbs per person.

49
Photo 8.--A tale of the land and sea is told
on the back of Saipan resident John
Castro. Several symbols are included in
the large turtle tattoo. At the center of the
turtle’s back is a latte stone, a symbol of
the strength of the Chamorro people.
Above the capstone is the rising sun,
symbolizing the continuation of life. On
either side of the latte pillar are great
frigate birds. The frigate birds appear to
be the fins of dolphins, which stretch from
the top to the bottom along either side of
the turtle shell. Between the latte stone
and the dolphins are three whale tails
representing strength. Below the latte
pillar are triangles. The triangles pointing
up represent the peaks of islands as seen
from the sea, and the triangles pointing
down represent shark teeth. Photo Credit:
J. Amesbury.
Saipan fishermen reported that 70% of their catch was consumed by themselves and immediate
family, with another 20% consumed by extended family and friends. Only 8% of the catch was
sold, not surprising given that the fishermen had social and cultural reasons for fishing, rather
than economic motivations. The 18 who identified themselves as commercial fishermen
reported a median monthly income from fishing of $200 and a mean (average) of just over
$1,000; the mean was greater than the median because three fishermen had monthly incomes of
more than $3,000.
Noting that the ratio of monthly costs to sales ratio showed that costs exceeded sales for almost
every income category of fishermen except those earning over $501 a month and those earning
less than $26, the authors suggested that “the bulk of “selling” fishermen are not selling to earn a
profit, i.e. that fishing is not a business for them but rather they sell their catch simply to recover
some of the costs for their activities” (Van Beukering et al., 2006).
That survey also addressed fish consumption and related characteristics of the Saipan population.
Fish remains an important part of the local diet and an integral part of the people’s history and
culture, but adaptation to and integration with a more westernized lifestyle have changed
people’s diets on Saipan (Van Beukering et al., 2006). Nearly half (45%) of the survey
respondents reported eating “somewhat less fish” than they did 10 years ago. The majority said
they ate fish between 1 and 3 times a week (28% said every 2 days, 27% said twice a week, and
50
23% said once a week). Of the remainder, 4% said they eat fish every day and 18% either once
or twice a month.
The majority purchased their fish from a store or restaurant (40%) while 31% purchase fish from
roadside vendors. Less common was acquiring fish from an extended relative/friend (13%) or
their own catch (11%). The majority of the fish consumed is reported to come from the U.S.
mainland (41%), while the next most important source is from inside Saipan’s reef (31%), deep
water or pelagic fish caught off Saipan (23%), or imported from other Pacific islands such as
Chuuk (10%).
Communication among fishermen and from fishermen to the broader community helps to
maintain the CNMI fishing community. One outlet is the Marianas Fishing Magazine, which is
published bimonthly. Both Guam and Saipan addresses and contact numbers are listed in the
magazine, which covers events in the CNMI, Guam, and other parts of Micronesia. The second
magazine is the Journal of Micronesian Fishing (www.micronesianfishing.com) published
quarterly by the Pacific Marine Resources Institute, a nonprofit environmental organization
based on Saipan.
Small Boat Fleet
According to Richard Seman, former Secretary of the Department of Land and Natural
Resources and former Director of the Division of Fish and Wildlife, more than 400 vessels are
registered in the CNMI. More than 200 of the vessels are active and operating in CNMI waters,
and more than 100 of the vessels are involved in fishing activities. Fresh fish and fishing have
important cultural significance and an active small boat fleet targets tunas, other small pelagics,
and bottomfish, although with the increases in the price of gas, pelagic fishing has dropped off
somewhat. These fish are marketed locally, given away to family and friends, or used for
ceremonial purposes such as parties, culturally significant fiestas, and each village’s patron
saint’s day (National Research Council, 1999).
This rest of this section contains an overview of small boat fleet characteristics, access, and sale
of fish on each of the three main islands; these descriptions are taken with permission from a
draft report by Impact Assessment Inc. (2011).

51
Figure 11.--Diversity of food fishes in the CNMI.

52
Saipan
Small boat fleet.--As of 2010–2011, fisheries managers estimate the active small boat fleet at
approximately 100 vessels. Full-time commercial fishing is primarily conducted by ethnic
nonindigenous minorities. Filipino residents, who have recently been displaced from the
construction industry with the demise of the tourism boom, fish primarily as independent owners
and/or operators. Recent immigrants from the Federated States of Micronesia are primarily
employed for wages. Chamorro and Carolinians, in contrast, currently fish for recreational and
subsistence purposes, selling catch primarily to recoup costs.
Of the 100 vessels, the majority (60) range from 15 to 22 ft in length and are trailered. Fishing
effort is primarily focused within a 20-mile radius on day trips with two fishermen on board.
The current vessel size has remained fairly consistent over the past 2 decades and relates to
operational costs and local demand for and pricing of catch. As one longtime fishery manager
observed, “there is no need for a larger vessel.” Handlines, hand reels and electric reels are
common for small scale fishing operations.
Of these 60 vessels, approximately 10 are fished by foreigners who serve as employees to boat
owners and 10 are fished by residents of Saipan who are employed as independent operators.
Fisheries managers report that the creation of an employment system, wherein a fishing vessel is
operated by salaried crew or an independent operator, is relatively new, having developed within
the last 10 years. Vessel owners typically own two to three vessels and will either pay in cash or
as a cut of the catch; the latter reportedly provides motivation to increase catch. Vessel owners
provide fuel and gear. Vessels operated by employed fishermen typically fish on a daily basis, as
weather permits.
The remaining 40 vessels are owner operated and are fished on a part-time basis, 2 to 3 times a
week, often on weekends. Part-time fishermen can be further subdivided into those who are
motivated by economic reasons and those who fish more for recreational/subsistence reasons.
The former, estimated to be 25 in number, have other part-time/ irregular employment and need
additional income whereas the latter, estimated to be 15 in number, are unemployed and/or
retired. The two types, however, often overlap in so far as both will sell fish and keep fish to eat;
the percentages, however, differ. An estimated five-vessel owner operators are considered
“pescadors”, a term used to refer to fishermen who provide fish for important community and
familial events; especially important are those dedicated to the 10 annual celebrations of patron
saints. Pescadors will customarily provide 100-200 lbs of reef fish for cooked dishes and
pelagic species for kelaguen (a raw fish dish) for community and family celebrations.
Of the 100 active vessels in the fleet, approximately 30 range from 23 to 30 feet in length. Of
these 30, 10 are full-time commercial fishermen, 10 are part-time commercial fishermen and 10
are part-time recreational and subsistence fishermen. Operators of larger vessels reportedly
target primarily pelagic species and occasionally will target bottom or reef fish.
In 2010, a fishery manager estimated only four commercial vessels over 35 feet in length that
were active. Larger vessels fish primarily within a 100-mile radius, making trips from 3 to 5
days in length. An estimated 40% of landings is pelagic species and 60% is bottomfish. The
vessels are owner operated and carry 3 to 6 member crews; all of whom are residents. The crews

53
are all full-time fishermen although on occasion the vessels (and crew) will fish for special social
and cultural events such as weddings, funerals and fiestas. Increases in fuel prices and low
market prices for fish have led to a general decline in boat and trip numbers and landings since
2001 (especially over the past few years), and a high turnover rate for highliner participants
(WPRFMC, 2010a ).
Fisheries managers report that the commercial vessels have gradually decreased in size even
within the smallest range. In the 1980s and early 1990s boats were reportedly commonly 17-24
feet long; currently, boats are more commonly 14-17 feet long. Smaller size coupled with the
use of efficient two-stroke or four-stroke engines have allowed operators to continue profitability
in the face of increased fuel prices. The number and avidity of part-time weekend fishermen has
also reportedly declined due to increased fuel prices. When fishermen do fish, they reportedly
sell more to cover fuel costs.
Access.--Sugar Dock and Fishing Base are the most popular launch sites in Saipan for both full-
time and part-time fishermen. Sugar Dock lies in close proximity to a majority of the commercial
fishing community. It is an area of high use by swimmers, shore net fishermen and tourists
undergoing scuba training. Limited roadside parking is available; the dock is currently under
repair. A roofed area providing sink and picnicking facilities is located nearby. Fishermen have
reported that a lighted channel would be beneficial (Miller, 2001).
Fishing Base is located near fish vendors and the tourist center. It has one launch ramp and
ample parking for trucks and trailers. Fifteen trailers were observed during a field visit. There are
no other facilities. Smiling Cove Marina is the primary docking area for small vessels in Saipan.
It is used by a variety of types of vessels, including: fishing vessels, sailboats, and charter
operations. It has floating dock space for more than 60 vessels and is capable of accommodating
vessels up to 60 feet in length. There is one launching ramp; launching is reportedly difficult
during low tide. It has ample paved parking and a fish weighing station, commonly used during
derbies.
The nearby Outer Cove Marina is primarily utilized by large commercial vessels, the ferry, and
tourist operations that provide dive boats and tour charters, and does not have a launch ramp.
The Division of Fish and Wildlife ramp is used frequently, while the Tanapag ramp is hardly
used as it routinely becomes inundated with sand. Both offer parking (on grass and/or gravel).
There are, however, no other facilities and no trailers were observed during field visits. The
latter is used by dive operators.
Lau Lau on the eastern side of the island has poor/rough road access. It is used primarily by
fishermen with small vessels (12-15 feet) targeting reef fish (by diving) and bottomfish for
subsistence purposes. A natural channel permits access beyond the reef, although it is illegal
under CNMI law to launch a boat from anywhere but a boat ramp. Pelagic fish reportedly swim
very close to the reef on the eastside; weather and sea conditions permitting, small vessel
fishermen will also target pelagic species.

54
Sale of fish.--Full-time commercial fishermen sell primarily through or to vendors. In contrast,
part-time fishermen prefer to sell to restaurants or to individuals so as to cut out the middleman
and receive higher prices. Vendors sell only whole fish and, as such, large pelagic species such
as marlin can be difficult to sell. Fishermen reportedly tend to subdivide and distribute large
pelagic species among family rather than sell to vendors. Catch from charter operations is
reportedly served to guests or kept by operators and crew for home consumption. Fish landed at
tournaments is commonly distributed amongst crew to be consumed at home or sold. A portion
is also kept for the tournament banquet. Catch is also frequently donated to an elder center.
The CNMI government’s volunteer data base collection system records 30 seafood purchasers
(including fish markets, general stores, restaurants, hotels and government agencies) operating in
Saipan in 2009 (WPRFMC, 2010a). Of these, only 7 roadside vendors and one brick and mortar
store were reportedly active when Impact Assessment, Inc. was conducting its fieldwork in 2010.
Fisheries managers report that the system of seafood distribution has undergone significant
changes in the past decade because of the establishment of large seafood vendors. In contrast to
individual fishermen/vendors who only market their own catch, large vendors typically own and
operate a number of vessels and purchase catch from independent fishermen to sell. Large
vendors offer a wide selection of fish from 10 to 15 coolers, rather than the typical 2 to 3 coolers
of the individual fisherman. Currently, competition between vendors is reportedly depressing
prices.
Fisheries managers in interviews (Impact Assessment, Inc. 2011) reported that the number of
commercial fishermen (full-time or part-time) and seafood purchasers, as well as total
commercial landings, have decreased over the long term in response to downturns in the
domestic economy. Pelagic participation peaked in the mid-1980s and then grew again in the
mid-1990s and dropped again in the early 2000s (WPRFMC, 2010a).
Fish vendors report that demand spikes at the beginning of the month when food stamps are
distributed, on paydays (alternating Fridays for government and private sector employees), and
Fridays through Sundays. Vendors also report increased demand during Lent; much of the
population, regardless of ethnicity, is Catholic and follows traditional Lent practices of giving up
meat. Demand also increases when the weather is poor; recreational/subsistence fishermen may
not venture out under such conditions.
Currently, the average price per pound to the fishermen is $2.50 for reef fish (although some
species of reef fish, such as rabbit fish, fetch a higher price) and $3.00 to $4.00 for bottomfish;
pelagic fish prices vary with seasonal and weather related abundance from $0.75 to $2.00.

55
Photo 9.--A vendor sells fresh fish from a trailer along Beach Road. The sign to the right
advertises shrimp, parrotfish, hangon (Naso lituratus), sagamelon (squirrelfishes and
soldierfishes, family Holocentridae), mafute (emperors of the genus Lethrinus), and hiyok
(Acanthurus lineatus). The food stamp sign is a common sight at establishments across Saipan.
Photo Credit: John Calvo.
Charter Fishing.--As of 2010, an estimated three charter boats catered to the tourist industry,
conducting half and full day trips. All of the vessels measured greater than 35 feet in length.
Declines in tourism and increases in fuel costs have led to a decline in the number and activity of
charter vessels. In 1991, there were 27 active charter operations; in 2004, there were 12 active
operations (Chapman, 2004). Currently, the three remaining charter vessels are reportedly
“barely making it.”
Derby Fishing.--The first boat-based fishing tournament in Saipan was held in 1985. Currently,
two major tournaments are held annually by the Saipan’s Fisherman’s Association (SFA). The
International Fishing Tournament is held in the summer, and the 27th
annual tournament took
place on July 16 and 17, 2011, attracting 48 boats. The major prize package included a round-
trip ticket to anywhere in the United States, a cell-phone, $2,000 in cash, and side bet earnings.
An additional $10,000 was available to the boat that broke the previous billfish record. In
addition to a chance at winning in the various categories, participants are drawn to the social
aspects of the event and banquet that concludes the derby. The derby draws a large crowd of
spectators and represents an economic boost to the fishing community.
The SFA Mahi Mahi Derby has been held in the spring for the last 8 years; in 2012, it drew 34
participants and the winning fish was 26 pounds. The Marianas Apnea Spearfishing Club
conducts an annual spearfishing tournament, which has been held since 2007. The event is
designed to promote the sport, safety, camaraderie, and conservation.
56
Tinian
Small boat fleet.--Estimates of current fleet size range from 15 to 20 vessels. The majority of
vessels is reportedly 12-27 feet in length, with outboards, and are trailered to access points.
Consistently throughout the week, an estimated 1-3 fishermen fish with the primary intent of
selling fish. Boat-based fishermen target bottomfish (groupers and snappers) by hook and line
and pelagic species (yellowfin, mahimahi, wahoo and skipjack) by troll. Respondents suggest
that fishing and eating of fish is more habitual, rather than geared toward a particular event.
Fishermen frequently sell fish to cover fuel costs. Increasing fuel prices have reportedly led to
the decline in number of active fishermen.
Six to seven boats serve tourist clientele, conducting primarily dive trips and, secondarily,
charters for trolling, 1 to 2 times a month. Charter boats are reportedly owned by nonlocal
residents and target tourists from their country of origin: Japan, China or Korea. Charter trips
serve primarily as photo opportunities for clients rather than fishing trips per se, and as such
charter boats do not land much catch.
In season, pelagic species run close enough to shore to permit shore hook-and-line fishing.
There are an estimated three locations where cliff fishing for mahimahi occurs. Spearfishing is
also a common fishing method. Based on the limited lagoon area on Tinian, net casting is not a
popular method of fishing.
Tinian has not held a boat fishing derby for an estimated 10 years.
Access.--Water access for boats is limited in Tinian as a result of a coastal topography
characterized by high cliffs and narrow or nonexistent reef areas. Launch and docking facilities
are located on the west side of Tinian. Both are protected by a breakwall. Ample parking is
available. The current launching and marina facilities appear sufficient for the current needs of
the fleet.
Fish sales.--Three restaurants and two stores in Tinian purchase fish. Fishermen will also sell
house to house and commonly have an established clientele. The selling price is $2.50 to $3.00
per pound. The selling opportunities are reportedly limited primarily by demand, as local
residents either engage in subsistence fishing practices or cannot afford the market price. Three
operators of larger vessels (17-20 feet) will occasionally deliver fish for sale to Saipan, when
seasonal pelagic species appear in Tinian waters first. The difference in market prices, however,
reportedly serves as a deterrent to selling in Saipan.
Previous attempts to support fishing efforts through consignment selling (to Guam) and a
fishermen’s market have been unsuccessful. The former, although offering a higher market
price, was reportedly not received well by fishermen because of their need to recoup operation
costs quickly.
Rota
Small boat fleet.--Small fishing vessels range from 14 to 18 feet in length, and are trailered to
launch sites. Many are fished primarily on weekends. Two fishermen reportedly fish more

57
frequently with the intent of selling catch. There is reportedly only one fishing vessel which has
a more fuel-efficient four stroke engine.
Currently, 3 to 4 businesses own a total of 6 to 8 boats which serve tourists. They are used for
both dive and fishing operations. In addition, one 45-foot boat, which is used primarily to
transport construction materials from Guam, is also used occasionally for fishing.
Fishermen target bottomfish (both shallow- and deepwater species), which are available year
round, and pelagic species when in season. Fishing grounds for skipjack are reportedly 8 miles
offshore and for wahoo and mahimahi 2 miles offshore. Spearfishing, from shore and/or boat,
and net casting are also common fishing methods. The number and activity of fishermen have
declined as a result of increased fuel prices. Fishermen will only pursue pelagic species “when
they are biting;” reportedly word spreads quickly in the close community. Family members also
often contribute money to purchase fuel for a fishing trip and make requests for certain kinds of
fish.
Rota holds one fishing derby in celebration of the saint of their island, San Francisco. The derby
is held in October. When prize money has been generous, up to 40 boats have participated with
some coming from Saipan, Tinian and Guam.
Access.--Rota has one marina located on the west side of the island. The marina has dock space
that can accommodate up to 15 boats. Launch ramps are located on both the west side at the
marina and on the east side. Although launching is equally easy on both sides, exiting the
channel on the west side is reportedly difficult. As such, launching on the east leeside is
reportedly preferred by many. Boats fish for wahoo as they troll out of Sasanhaya Bay along
Wedding Cake.
Fish sales.--Fishermen sell catch to 3 restaurants that currently serve the community and to
neighbors and friends within the community (door to door or from a cooler on the roadside).
One general store in downtown Rota sells fish caught by a family member, who fishes
specifically to sell. Three restaurants reportedly closed in 2009 because of a lack of business.
Based on increased fuel prices, fishermen who need to sell their catch will often check demand
with local restaurants. The market price is approximately $3 per pound as a result of current fuel
prices. One active fisherman reports the desire to create an export market serving Guam, where
he hopes there would be enough demand and a high enough price. The market in Saipan is
generally perceived to have too much competition.
2011 Survey of CNMI Small Boat Fishermen
Additional information about the CNMI small boat fleet and its characteristics was obtained
from a 2011 survey of Marianas Archipelago commercial fishermen (Hospital and Beavers,
2012).7 NOAA’s Pacific Islands Fisheries Science Center conducted the Mariana Archipelago
7 The results in this section should be considered preliminary because, as of this draft, additional survey forms are
being collected, so the sample size will increase. However, the nature of the results and main conclusions are not
expected to change. Readers are encouraged to view the full report for additional information.

58
Cost-Earnings Survey during 2011 to better understand the economic, social, and behavioral
characteristics of boat-based fishing in Guam and the Commonwealth of the Northern Mariana
Islands. These data are expected to establish important baselines for assessing the economic and
social impacts of future management plans, management alternatives and actions. Surveys were
completed by fishermen from Saipan, Tinian, and Rota.
A majority (60%) of the 88 fishermen in the sample was Chamorro, followed by 19% Filipino
and 12% Carolinian; 13% checked more than one category to describe their race. The largest
proportion (43%) was between 35 and 44 years old, while 28% were 45-54 years old and 17%
were 25-34. The fishermen reported having fished from a boat for an average of 15 years, and
had lived in the Marianas an average of 30 years.
Preliminary analyses support the strong sociocultural role of fishing in the Northern Marianas.
The fishermen reported taking an average of 25 fishing trips over the past 12 months; 40% said
they took about 1 trip a month, 25% about 2 trips a month, 15% took 1 trip a week, and 15%
took 1-2 trips a week. Only a small percentage of fishermen responding to the survey considered
themselves to be only part- or full-time commercial fishermen, while the highest proportion
described themselves as subsistence fishermen (Fig. 12). More than one-third described
themselves as subscribing to more than one of the fisherman categories, emphasizing that CNMI
fishermen have multiple reasons for fishing.
Over the past 12 months, the fishermen reported that a higher proportion of their boat fishing
trips used trolling as the primary technique, followed by deep bottomfishing (Fig. 12) and
reported that the highest proportion of trips took place primarily in both local and federal waters
(Fig. 13).
Figure 12.--Fishing trips over the past 12 months.
Trolling 34%
Deep Bottom
23%
Shallow Bottom
13%
Atulai 8%
Spear 16%
Reef - Net 2%
Other 3%

59
Figure 13.--Location of fishing trips over the past 12 months.
A vast majority of the pelagic fishermen (84%), the bottomfish fishermen (89%), and the reef
fishermen (92%) said that the fish they caught were an important source of food for their
families. Consistent with that result, a higher proportion of their catch from the last 12 months
was consumed at home (29%) or given away to crew, family members or friends and neighbors
(33%) than was sold (25%), and an additional proportion (8%) was described as being caught for
fiestas or other community and cultural events. Another question asked whether, as a fisherman,
they were respected by the community. This reflects the artisanal role of the fisherman as a
member of the broader community. Nearly half of the fishermen (47%) agreed that as
fishermen, they were respected by the community; just 2% disagreed, while about a third were
neutral and 15% said they didn’t know.
The survey analysis also identified highliners—the fishermen reporting the largest catches over
the past 12 months. This category of fisherman included those reporting catches of 500 lbs or
more of pelagics, or 500 lbs or more of bottomfish, or 250 lbs or more of reef fish. Thirty-two of
the fishermen (34% of those surveyed) were identified as highliners for subsequent analyses. Of
the highliners, 66% were Chamorro compared to 57% of the non-highliners. The highliners also
tended to be older, less likely to be employed full- or part-time, more likely to be self-employed
or retired, and less likely to have attended college.
The highliners said that 40% of their personal income in the past 12 months had come from
fishing, compared to just 18% for the non-highliners. When asked what they did with their fish,
it is not surprising that the highliners reported selling a higher proportion of their catch (46%)
than did the non-highliners (17%). However, even the highliners, for whom the income from
fishing was more important, reported that 19% of their catch was consumed at home, 24% was
given away, and 8% was caught for fiestas or other community or cultural events. In addition, a
high proportion of the highliners (77-81%) reported that the fish they caught was an important
source of food for their families (although these proportions were even higher among the non-
highliners).
When asked about trends in fishing, about two-thirds of the fishermen believed that fish had
gotten more difficult to catch over the past 5 years; these proportions were about the same
whether they were talking about pelagics, bottomfish or reef fish. A higher proportion of the
highliners believed that bottomfish and reef fish had been harder to catch, while the proportion
was about the same among highliners and non-highliners who had fished primarily for pelagics.
Local Waters
37%
Federal Waters
23%
Both Local and
Federal 37%

60
Their reasons for fish becoming harder to catch included increased competition for fish, higher
fuel costs, and changes in weather and climate.
When asked whether they believe more people on CNMI will be involved in fishing in the next
year, there was overwhelming agreement that more people would be involved in fishing,
regardless of the type of fishery the fishermen had participated in or whether or not they were a
highliner. Their reasons for believing that more people will be involved in fishing included the
poor economy (and hence a greater reliance on fish for food as well as income), the
establishment of a fishermen’s co-op, and the continued cultural importance of fishing.
Photo 10.--Orangespine unicornfish (Naso
lituratus), known as hangon in Chamorro, in
the ice chest at a fish trailer on Beach Road,
Saipan. Photo Credit: John Calvo.
Saipan Fishermen’s Association
As mentioned earlier in this chapter, the Saipan Fishermen’s Association (SFA) is a nonprofit
organization that holds fishing derbies annually. When the SFA was established in 1985, it went
by the name Saipan Sports Fishermen’s Association. That was the name until 2005, when it was
decided to remove the word “Sports” and pursue programs that could benefit all local fishermen.
When Juan “Money” San Nicolas was President, the group applied for a federal grant to jump-
start a fishermen’s cooperative. The SFA was awarded grant money from the NOAA
Community Demonstration Project Program (CDPP) to help fund the cooperative.
The first fishing derby held by the SFA was in 1985 at Fishing Base in Garapan, across from
Kristo Rai Church. SFA has adopted that beach for beach cleanup. The SFA derby is held
annually in July or August; derby results and photos available on the web site
(www.go2cnmi.com). There is also a mahimahi derby in March or April and a wahoo
tournament in November. The 26th
Fishing Derby took place July 17-18, 2010. The tournament
attracted 66 boats and more than 200 fishermen from Saipan, Tinian, Rota, Guam, Japan, and the
Philippines. In addition to organizing the fishing tournaments, the SFA also participates in
community involvement projects, such as beach cleanup.
Usually there is also an annual derby (by invitation only) that targets emperors, such as mafuti
and lililok (Lethrinus spp.). Boats may not be more than 15 feet long, and the fish must be at

61
least 8 inches long. Fishermen enter their biggest fish by weight and the total weight of their
next five fish. This derby takes place from 4 to 9 pm. Each boat pays $25 to enter, which is
used to purchase ice and water. Everyone brings half a case (12 cans) of their favorite beverage
and leaves it on the dock. The weighing is done by 9:30 pm, and the banquet takes place the
same night.
In September 2010, Gene Weaver, current SFA president, reported about 20 active members of
the SFA.8 There are no dues for membership; the “dues” consist of coming to meetings and
participating. SFA receives money for prizes by selling ads in the tournament booklets. SFA
has corporate sponsors including the petroleum companies, Shell and Mobil, and
communications companies, IT&E and Docomo Pacific. Another sponsor of the annual
tournament is Micronesian Marine, a boat manufacturing company in Saipan run by Roland
Johnson.
Commercial Fishery Statistics
There are currently no requirements for commercial fishing vessel, operator, or crew licenses for
inshore or offshore waters of CNMI. All data collection efforts are on a voluntary basis. Since
the mid-1970s, the CNMI Division of Fish and Wildlife (DFW) has been collecting data on
fishing in Saipan. DFW later expanded its fisheries monitoring programs to include Rota and
Tinian. DFW distributes and collects invoice books from participating fish purchasers on
Saipan. These records encompass approximately 90% of all commercial fishing. The Western
Pacific Fisheries Information Network (WPacFIN) compiles and expands the data to represent
the entire CNMI. The data from 1983 and later are considered the most accurate.
DFW’s principal method of collecting domestic commercial fisheries data is a dealer invoicing
system, sometimes referred to as a trip ticket system. The DFW provides numbered two-part
invoices to all purchasers of fresh fishery products (including hotels, restaurants, stores, fish
markets, and roadside vendors). Dealers then complete an invoice each time they purchase fish
directly from fishers; one copy goes to DFW and one copy goes to their records.
Information collected includes: date; weight (pounds); buyer’s name (dealer); price per pound;
seller’s name (fisherman); species; and invoice number. These data are collected for all
purchases of fishery products; however, species identification is frequently made only to a group
level, especially for reef fish.
Some advantages of this data collection method are that it is relatively inexpensive to implement
and maintain and it is a fairly easy way to inventory the entire commercial fishery. DFW can
also provide feedback to dealers and fishers to ensure data accuracy and continued cooperation.
There are some disadvantages: (1) dependency on non-DFW personnel to identify the catch and
record the data; (2) restrictions on the types of data that can be collected; (3) required education
and cooperation of all fish purchasers; and (4) limited recordings of fish actually sold to dealers.
Therefore, a potentially important portion of the total landings is unrecorded. Since 1982, DFW
8 G. Weaver, pers. commun., conversation with Judith Amesbury, September 2010.

62
has tried to minimize these disadvantages in several ways: (1) maintaining a close working
relationship with dealers; (2) adding new dealers to their list and educate them; and (3)
implementing a creel survey to help estimate total catch, including recreational and subsistence
catch.
The current system collects data from dealers in Saipan, where DFW estimates more than 90% of
all CNMI commercial landings occur. The DFW also estimates that the proportion of total
commercial landings that have been recorded in the Saipan database since 1983 is about 90%. In
2011, fisheries managers noted concerns regarding incomplete participation (by vendors);
incomplete listing of species (especially of bottomfish and reef species) on fish tickets; incorrect
identification of species; and incomplete coverage of the Northern Mariana Islands. In regards to
the lattermost point, data collection efforts in CNMI are confined to Saipan; landings and
revenue are inflated by 30% to represent CNMI as a whole. Data collection efforts for Rota
reportedly stopped in 2009. DFW staff on Tinian report that the lack of data collecting is a result
of understaffing; in addition, the database does not include information on catch that is kept for
noncommercial use (Impact Assessment Inc., 2011).
Figure 14 shows estimated commercial landings in the CNMI from 1981 through 2009
(http://www.pifsc.noaa.gov/wpacfin/cnmi/Pages/cnmi_data_1.php), while Figure 15 displays the
dollar value of these catches. Pelagics have constituted the largest proportion of the catch in
most years, especially since 2002. The proportion of reef fish in overall catch has declined,
while bottomfish catch has remained stable. The catch numbers reflect the 2002 ban on the use
of spearfishing with scuba and 2003 restrictions on the use of gill, drag, and surround nets.
Figure 14.--Annual estimated commercial landings in the CNMI of pelagic fishes, bottomfishes,
reef fishes, and other fishes by 1000 pounds
(http://www.pifsc.noaa.gov/wpacfin/cnmi/Pages/cnmi_data_1.php).

63
Figure 15.--Nominal Value of CNMI Commercial Fish Catch 1981–2009
(http://www.pifsc.noaa.gov/wpacfin/cnmi/Pages/cnmi_data_1.php).
Table 11 provides additional detail for 2009 commercial landings, showing that skipjack tuna
provided the largest share of both pounds and value, despite having one of the lowest prices per
pound among commercial fish
(http://www.pifsc.noaa.gov/wpacfin/cnmi/Pages/cnmi_data_1.php). From 1983 to 2009,
skipjack constituted an overall average of 77% of the catch, followed by yellowfin tuna (10%),
mahimahi (9%), ono (3%), and blue marlin (1%) (WPRFMC, 2010a). The composition of the
CNMI pelagic catch is very different from that of Guam’s pelagic catch. In the CNMI, the
average annual commercial catch of skipjack exceeds 170,000 pounds, but yellowfin, mahimahi,
wahoo, and marlin average less than 22,000 pounds each. On Guam, the average annual total
catches of mahimahi and skipjack exceed 170,000 pounds each, and 55,000 to 87,000 pounds of
wahoo, yellowfin, and marlin (WPRFMC, 2010b). It is possible that the preference for skipjack
in the CNMI is a result of Saipan’s history with the prewar Japanese and postwar Carolinian
pole-and-line fishery for skipjack.
Table 11.--Annual estimated commercial landings in the CNMI for 2009
(http://www.pifsc.noaa.gov/wpacfin/cnmi/Pages/cnmi_data_1.php).
Species Pounds Value ($) Price/Per Pound ($)
Bigeye scad 25,052 62,584 2.50
Jacks 2,092 5,132 2.45
Black jack 112 280 2.51
Giant trevally 55 136 2.50
Bottomfishes (unknown) 4,487 11,296 2.52
Sickle pomfret 511 1,201 2.35
$0.00
$200,000.00
$400,000.00
$600,000.00
$800,000.00
$1,000,000.00
$1,200,000.00
$1,400,000.00
19
81
19
83
19
85
19
87
19
89
19
91
19
93
19
95
19
97
19
99
20
01
20
03
20
05
20
07
20
09
Dollar value

64
Species Pounds Value ($) Price/Per Pound ($)
Ehu (red snapper) 2,572 9,263 3.60
Gindai (flower snapper) 2,393 8,698 3.63
Groupers 768 2,240 2.92
Kalikali (yellowtail) 2,393 5,894 2.46
Onaga (red snapper) 3,517 15,008 4.27
Opakapaka (pink snapper) 3,898 10,569 2.71
Jobfish (uku) 1,701 3,550 2.09
Silvermouth (deep lehi) 1,042 2,945 2.83
Amberjack 326 868 2.66
Blue lined snapper 1,126 2,790 2.48
Reef fishes (unknown) 34,807 88,800 2.55
Wrasses 365 873 2.39
Rabbitfishes 1,288 3,806 2.95
Emperors 11,386 28,577 2.51
Squirrelfishes 215 536 2.50
Parrotfishes 23,911 74,276 3.11
Surgeonfishes 2,113 4,589 2.17
Orangespine unicornfish 313 782 2.50
Unicornfishes 1,296 3,333 2.57
Goatfishes 830 2,077 2.50
Bigeye emperor 48 120 2.50
Pelagic fishes (unknown) 125 251 2.00
Barracudas 24 35 1.50
Mahimahi 19,580 34,980 1.79
Blue marlin 47 71 1.50
Sailfish 162 243 1.50
Rainbow runner 1,759 3,476 1.98
Wahoo 3,389 6,777 2.00
Skipjack tuna 129,176 209,875 1.62
Dogtooth tuna 2,575 4,233 1.64
Yellowfin tuna 25,113 49,435 1.97
Kawakawa (saba) 1,521 2,311 1.52
Spiny lobster 881 4,385 4.98
Slipper lobster 165 827 5.00
Octopus 438 903 2.06
Squid 8 16 2.00
TOTAL 313,581 668,042 2.13

65
Longlining in the CNMI
In 2008, a longline fishing company began operating out of Saipan. USA Islands Seafood Inc.
(USAISI) was purchased by private investors in May 2008. The firm’s mission was
to produce, process and market quality fish and processed fish products at
competitive prices in the local market and to establish itself as the leading seafood
exporter in the region. The company aims to maintain an environmentally
friendly and sustainable fishery to assist in protecting and preserving the fishery
reserves of the CNMI. (www.USAIslandsSeafood.com).
The USAISI fishing fleet in Saipan was made up of 4 vessels, the 70-ft F/V Jenny (which
appeared in the movie The Perfect Storm), the 80-ft F/V Pacifica, the 85-ft F/V Miss Saipan, and
the 100-ft F/V Lady Carolina. Its website lists 12 species of fish that they caught: 4 species of
tuna (albacore, bigeye, yellowfin, and skipjack); 4 species of billfish (blue marlin, striped marlin,
shortbill spearfish, and broadbill swordfish); and 4 other species (mahimahi, wahoo, opah, and
monchong). According to one of the owners, Dave Lewis, they also caught and marketed about
10 sharks a month (threshers, makos, white tips, blue sharks, and even the shallower black tips).
However, USAISI has shut down operations and does not fish anymore in the CNMI. The
company is considering moving operations to the FSM or to Hawaii.9
FISHERIES GOVERNANCE AND INSTITUTIONS
This chapter describes how fisheries and marine resources are managed in the CNMI, and by
whom. These include both federal government and CNMI government agencies, as well as local
groups.
Federal Government
As of this writing, CNMI still does not have authority over territorial waters, which continues to
be a highly sensitive political issue. As previous sections suggested, other actions such as the
increase in minimum wages, the federal management of immigration, and designation of the
Marianas Trench Marine National Monument, along with other events, have contributed to
commonwealth-federal government tensions.
In the mid-1970s, the United States (Public Law 93-435) conveyed to certain territories,
including Guam, American Samoa, and the Virgin Islands, their submerged lands extending out
to three geographical miles from the coastline. At that time, CNMI did not belong to the United
States. After the Northern Mariana Islands became a commonwealth, CNMI sued the United
9 M. Trianni, pers. commun. (review of draft of this document), April 18, 2012.

66
States for ownership of the entire 200-mile EEZ. That claim was not supported, so the entire
200-mile EEZ falls under the authority of the federal government.
In 2009, a bill (HR 934), sponsored by CNMI Delegate Gregorio Sablan and which passed the
U.S. House of Representatives, would have amended PL 93-435 to convey the submerged lands
out to 3 miles to the CNMI. Subsequent legislation in the House and Senate would have
accomplished this same goal but, to date, the conveyance has not occurred. Recently the CNMI
Legislature passed a Resolution requesting that the federal government give back the entire 200-
mile EEZ or pay the CNMI $67 billion. CNMI has always been granted 0-3 mile management
authority by NMFS.10
Division of Fish and Wildlife
The Division of Fish & Wildlife (DFW) is one of several agencies under the CNMI
government’s Department of Lands and Natural Resources. The Division was created in 1981
by Public Law Number 2-51, the "Fish, Game and Endangered Species Act". As described on
the DFW website, the DFW mission is to conserve fish, game and wildlife, and to protect
endangered and threatened species: “Through research, monitoring, regulation, enforcement,
planning and management, the Division seeks to ensure the long-term survival and sustainability
of the CNMI's natural resources for present and future generations.”
DFW consists of a Wildlife Section, Fisheries Section, Planning and Education Section,
Enforcement Section and Administrative Section. Activities include species-specific research,
population and habitat monitoring, adaptive management, educational programs at schools,
outreach at public events, environmental planning, and permitting for major developments, and
enforcement activities. DFW has deployed 11 fish aggregating devices (FADs) for recreational
fishing. DFW develops and enforces regulations for hunting, fishing, harvesting, and taking of
species, as well as human behavior and activities in protected and conservation areas in the
CNMI. For example, there is currently a local moratorium on harvesting trochus and sea
cucumber in the CNMI. DFW also reviews development proposals submitted to the Coastal
Resources Management Office (CRMO) and/or Division of Environmental Quality (DEQ).
Within the Fisheries Section, the Fisheries Research Program is charged with protecting
endangered, threatened, and scarce species; restoring and conserving marine habitat; and
sustaining fisheries stocks for multiple uses. As described above, the Fisheries Data Program
works with WPacFIN to provide data for fisheries management purposes, including data
obtained via a boat-based offshore creel survey, data on fish imports, and commercial purchase
data.
10 See footnote #9.

67
Photo 12.--Sign on Mañagaha Island informing the public of the Conservation Area. Photo
Credit: J. Amesbury.
DFW also administers CNMI’s marine protected areas with varying levels of restricted activities.
No-take reserves prohibit the fishing or harvesting of any marine species of plant or animal,
prohibit take of coral (live or dead), and prohibit all exploitive or destructive activities to marine
life. In Saipan, there are three no-take reserves:
Managaha Marine Conservation Area
Forbidden Island Marine Sanctuary
Bird Island Marine Sanctuary
The Mañagaha Marine Conservation Area covers 500 hectares around Mañagaha Island within
Tanapag Lagoon and the adjacent reef slope on the west side of Saipan. Violations of the
Mañagaha Marine Conservation Area are considered civil violations and violators are subject to
administrative hearings. Violations of the Forbidden Island and Bird Island Marine Sanctuaries
are criminal violations and violators are subject to court hearings.11
The island of Rota has the Sasanhaya Fish Reserve, which is a no-take zone for all marine
species; created in 1994, it was the first marine protected area in the CNMI. The island of Tinian
has CNMI’s newest marine reserve, established in 2007, extending from the Southwest Carolinas
11 R. Seman, pers. commun., December 2010.

68
Point to Puntan Diablo and now extends to the end of the harbor. The reserve is primarily a no-
take reserve for 5 years from the date it was established, but seasonal fish, such as atulai (big-eye
scad, Selar crumenophthalmus), i’e (juvenile jacks, such as Caranx melampygus), and ti’ao
(juvenile goatfishes, family Mullidae) may be harvested during their respective seasons. The law
calls for an assessment after 3 years to determine whether certain other activities may be
permitted.
.
Photo 13.--Poster showing Sasanhaya Bay Fish Reserve boundaries and regulations.
Maps showing the boundaries of the reserves, as well as the management plans of each, are
available on the DFW website Wildlife (www.dfw.gov.mp). In addition, the Lighthouse Reef
Trochus Sanctuary was designated in 1982 and the Lau Lau Bay Sea Cucumber Sanctuary was
designated in 2008.
Other fisheries conservation actions are taken directly by the CNMI government. Public Law
No. 15-124 (January 3, 2008) was the first law that banned shark fins:
It shall be unlawful for any person within the Commonwealth or any place
subject to the jurisdiction thereof, to take, possess, sell, purchase, barter, offer
to sell, purchase or barter, transport, export or import, at any time or in any
manner, any SHARK, alive or dead, or any part thereof, without being
permitted to do so as provided in this section…may be assessed a civil penalty
by the (DFW) Director of not more than $5,000 for each such violation…

69
Photo 14.--Mañagaha Island. Photo Credit: J. Amesbury.
CNMI Coral Reef Initiative Program
NOAA’s Coral Reef Information System website provides the following description of CNMI’s
coral reef systems:
Saipan has the most diverse types of coral reefs and associated habitats in the
CNMI. A fringing and barrier reef system protects the majority of the beaches
along the western and coastal plains. The western side of the island is the most
populated and the coral reefs along these areas are negatively affected by
human activity. Continuing sediment and nutrient pollution, combined with
sporadic stressors such as outbreaks of crown-of-thorns starfish (COTS) and
bleaching, affect many of Saipan's western and southeastern reefs.
Coral reef ecosystems in the CNMI are, on the whole, reasonably healthy.
However, environmental stressors acting synergistically with anthropogenic
stressors, such as nonpoint source pollution and fishing pressure, have clearly
affected areas in proximity to the populated southern islands. From a fisheries
perspective, the northern islands and more distant banks and reefs appear to be
in better condition than those closer to population centers.
http://coris.noaa.gov/portals/cnmi.html#1)
The CNMI Coral Reef Initiative Program was established by Executive Directive 235 in 1997 in
conjunction with the first International Year of the Coral Reef. The Program is supported by
funding through the U.S. Coral Reef Initiative Management and Monitoring Grant programs.
The Program, which is under the Office of the Governor, uses an interagency structure to
coordinate coral reef issues. The agencies include the Coastal Resources Management Office,
the Division of Fish and Wildlife, and the Division of Environmental Quality. The interagency
group is tasked with protecting coral reefs and implementing Local Action Strategies (LAS)
projects (http://www.cnmicoralreef.net/). The Program monitors nearshore and reef flat areas on
all three main islands and issues a number of reports available on its web site. The Program

70
produces a variety of educational and outreach materials and activities, and sponsors a summer
internship program allowing several college or college-bound students the opportunity to work in
coral reef conservation projects.
Since 2003, CNMI's CRI has used LAS to identify management priorities based on a suite of
NOAA-designated priority threat categories. To date, CNMI has addressed Non-Point Source
Pollution, Fisheries and Coral Reef Management, Recreational Use and Public Awareness with
LAS activities. They are now reviewing and revising LAS to align with revised NOAA priorities
to address threats of Overfishing, Non-Point Source Pollution, and Climate Change. The
Program also makes sure that LAS actions complement local priorities for achieving the goals of
the Micronesia Challenge.12
The LAS web site (http://www.cnmicoralreef.net/) contains more information on activities being
conducted to conserve CNMI’s coral reef ecosystems.
Coastal Resources Management (CRM) Program
The Coastal Resources Management (CRM) Program, which implements the Coastal Zone
Management Act (CZMA) of 1972, was established by the Commonwealth government in 1980
to promote the conservation and wise development of coastal resources. The coastal zone
includes all nonfederal lands on the island, as well as offshore islands and nonfederal submerged
lands within 3 nm.
The Coastal Resources Management Office has identified Areas of Particular Concern (APC),
geographic delineated areas having special management requirements. Before work begins on
any project located wholly or partially within an APC, a valid coastal permit is required. This is
not applicable to federal-lease lands or federally owned submerged lands, but the CZMA
consistency determination addresses potential impacts on these APCs. Currently, there are five
APCs in CNMI:
1. Shoreline – The area between the mean high water mark and 150 ft (46 m) inland;
2. Lagoon and Reef – The area extending seaward from the mean high water mark to
the outer slope of the reef;
3. Wetlands and Mangrove – Those areas that are permanently or periodically covered
with water and where species of wetland or mangrove vegetation can be found;
4. Port and Industrial – Those land and water areas surrounding the commercial ports
of Saipan, Tinian, and Rota; and
12 The Micronesia Challenge is a commitment by the Federated States of Micronesia, the Republic of the Marshall
Islands, the Republic of Palau, Guam, and the Commonwealth of the Northern Marianas Islands “to preserve the
natural resources that are crucial to the survival of Pacific traditions, cultures and livelihoods.” The overall goal of
the Challenge is to effectively conserve at least 30% of the nearshore marine resources and 20% of the terrestrial
resources across Micronesia by 2020.

71
5. Coastal Hazards – Those areas identified as coastal flood hazard zones in the Federal
Emergency Management Agency Flood Insurance Rate Maps.
By statute, the CRM is mandated to balance the potentially conflicting management goals of
both allowing use of and preserving CNMI natural resources.
This task is difficult as a result of the large amount of geographic and descriptive information
that must be considered in any management decision, so the program has been using Geographic
Information Systems (GIS) technology to improve resource management and project permitting
decisions. The CRM participates in the NOAA Coastal Services Center (CSC) multiyear Pacific
region initiative, designed to build capacity of Pacific coastal zone management agencies.
Western Pacific Regional Fishery Management Council
The Western Pacific Regional Fishery Management Council (Council) is 1 of 8 regional fishery
management councils established by the Magnuson Fishery Conservation and Management Act
of 1976. The Council has 13 voting members and 3 nonvoting members. A chair and four vice
chairs (one from each island area--Hawaii, American Samoa, Guam, and CNMI) are elected
annually by the Council members. Management measures created by the Council and approved
by the Secretary are implemented by the National Marine Fisheries Service (NMFS). The
Council’s Mariana Archipelago Fishery Ecosystem Plan (WPRFMC 2009b) describes
management of the CNMI and Guam. This place-based, adaptive management structure is
designed to increase collaboration with domestic and international management bodies,
government and nongovernmental organizations, communities and the public to develop federal
fishery management policies.
According to Richard Seman, the CNMI had only observer status in the Council until 1995,13
when CNMI became a full voting member after the CNMI Governor and the U.S. Department of
the Interior agreed to disagree on the CNMIs’ claim to the 200-mile submerged lands. The
CNMI stated that by becoming a member of the Council, it was not relinquishing its claim to the
200-mile EEZ, and the U.S. also stated that by including the CNMI on the Council, the United
States was not giving up its claim to the 200 miles. However, the Council has always delegated
management authority for 0 to 3 miles to the local CNMI natural resource agencies.
In addition to representation on the Council, CNMI has members on the Council’s Scientific and
Statistical Committee, Plan Teams, Advisory Panels, Fisheries Data Coordinating Committee,
Technical Committee, Marine Protected Area Advisory Committee, Non-Commercial Advisory
Committee, Social Science Research Committee, and Marianas Archipelago Regional Ecosystem
Advisory Committee.
The Regional Ecosystem Advisory Committee (REAC) meetings serve as a forum for local
agencies and the public to voice their interests and concerns to the Council about fishing and
other marine ecosystem issues. Recent topics discussed at the REAC meetings have included
13 R. Seman, pers. commun., December 2010.

72
indigenous cultures’ interests in obtaining exemptions from the Endangered Species Act to
enable them to practice their culture by a small take of listed green sea turtles, and presentation
of Coral Reef LAS accomplishments related to the priority areas including fisheries, land-based
sources of pollution, recreational overuse, education and outreach and coral bleaching and
disease, such as educating the community on the effects of wildfire burn-offs and land erosion on
reefs.
The Council has recently taken actions to reduce competition between larger vessels and the
small, local vessels of the CNMI (and Guam and American Samoa). At its 141st meeting in
2008, it recommended prohibiting purse seining in the EEZ around Guam and CNMI and
excluding longline vessels from fishing within 30 nautical miles from shore around the CNMI.
The longline exclusion zone was subsequently approved by NMFS, but the purse seine exclusion
zone was not. The Council also set a control date for the developing CNMI-based longline
fishery.
The Council’s Western Pacific Community Demonstration Project has in the past provided grant
support to CNMI to establish a fishing outpost in the Northern Islands. One objective of the
proposal was to assess the feasibility of reestablishing a population in the Northern Islands. The
Northern Islands of the Commonwealth are largely uninhabited, but (as noted earlier in this
report) some have hosted very small resident communities. These islands are difficult to supply
and lack harbors and airfields.
The Council recently (2011) developed recommendations for annual catch limits for all managed
species in the Western Pacific region, including the Marianas Archipelago. These limits were
required by the 2006 reauthorizations of the Magnuson-Stevens Act. It appears that these will
not be limiting factors to fishing in the CNMI, although the impact will need to be monitored
because it is such a new regulation.
Marianas Trench Marine National Monument
President George W. Bush established the Marianas Trench Marine National Monument on
January 6, 2009. President Bush exercised the authority vested in him by Section 2 of the
Antiquities Act, which authorizes the President to declare by public proclamation historic
landmarks, historic and prehistoric structures, and other objects of historic or scientific interest
on lands owned or controlled by the U.S. Government to be national monuments.
The Monument includes the waters and submerged lands out to 50 nautical miles of the three
northernmost Mariana Islands, Uracas, Maug, and Asuncion (Islands Unit), the submerged lands
out to 1 nautical mile of designated volcanic sites (Volcanic Unit), and the Marianas Trench from
the northern limit of the EEZ around the CNMI to the southern limit of the EEZ around Guam
(Trench Unit). These areas make up approximately 95,216 square miles of submerged lands and
waters of the Marianas Archipelago.
According to Presidential Proclamation 8335, the Secretaries of Commerce and the Interior will
manage the Monument. The Secretary of Commerce has primary management responsibility

73
with regard to fishery-related activities. The Secretary of the Interior may permit scientific
exploration and research within the Monument, and the Secretary of Commerce may permit
fishing within the Monument for scientific exploration and research purposes. The proclamation
specified that the Secretary of Commerce prohibit commercial fishing within the Islands Unit,
but provided the potential for sustenance, recreational, and traditional indigenous fishing to be
managed as a sustainable activity. Prohibitions required by the Monument proclamation did not
apply to activities and exercises of the U.S. Armed Forces.
The Secretaries of the Interior and Commerce were directed to prepare management plans to
provide for, among other things, traditional access by indigenous persons, as identified by the
Secretaries in consultation with the Government of the CNMI, for culturally significant
subsistence, cultural and religious uses within the Monument. The proclamation also called for
the establishment of an Advisory Council, consisting of three officials of the Government of the
CNMI and one representative each from the Department of Defense and the U.S. Coast Guard.
An initial original proposal for the Monument developed by the Pew Foundation and President
Bush’s subsequent proclamation have led to social conflict within the CNMI. The organization
Friends of the Monument was developed to support the idea of Monument designation, while
other individuals catalyzed opposition. Governor Benigno R. Fitial wrote a letter to President
Bush in April 2008 opposing new protections around the northernmost islands and the adjacent
trench, saying, “We rely on fishing as a source of food and jobs…Those who live in the CNMI
have no interest in ceding their cultural heritage to the federal government under the auspices of
environmental protectionism." However, the Saipan Chamber of Commerce supported the idea
(with caveats), saying that designating a Marianas Trench Marine National Monument would
enhance tourism during financially struggling times.
When the Monument was designated, however, Governor Fitial issued a statement of support
(Saipan Tribune, 2009):
I welcome President Bush's historic announcement establishing the Marianas
Trench Marine National Monument...All of us in the Commonwealth of the
Northern Mariana Islands appreciate this recognition of our unique natural and
geological environment. We anticipate that this designation will encourage and
support scientific and educational programs that will enlighten people all over
the world regarding the Mariana Trench, hydrothermal vents, and coral reefs
now protected as parts of the Monument.
Fitial then explained the reasons behind his support:
Over the past few months, I have been actively engaged in discussions with the
White House Council on Environmental Quality regarding the objectives and
scope of the proposed monument. I have been joined in these discussions by
President Pete Reyes of the Commonwealth Senate and Speaker Arnold
Palacios of the Commonwealth House of Representatives. Our objectives in
these conservations were very simple: to put aside the very divisive advocacy
of the PEW Foundation on this subject and to focus on the need to protect the

74
interests of the people of the Commonwealth…I believe that the end result is
an example of how federal and local officials can work together productively
to achieve a common objective.
First, the Monument designation focuses on the area necessary for the proper
care and management of these unique resources-which ranks it high among the
nation's largest conservation areas…
Second, the designation prohibits commercial fishing only within the large area
surrounding the three northern islands included in the Monument which are
already protected by the CNMI Constitution.
Third, the designation defers to the local Commonwealth government to
determine what traditional indigenous fishing should take place within this
protected area.
Fourth, the designation does not conflict with areas where potential mineral
deposits are most likely to be found.
Fifth, the Administration has committed to support legislation giving the
Commonwealth control over its submerged lands and to develop legislation
providing economically beneficial access to mineral deposits on federal
submerged lands.
Finally, the Monument Proclamation provides for full participation by the
Commonwealth in the comanagement of the monument.
The U.S. Fish and Wildlife Service (representing the Secretary of the Interior) and the
NMFS Pacific Islands Regional Office (representing the Secretary of Commerce) are
currently developing a management plan for the Monument, and the NMFS Pacific
Islands Fisheries Science Center (PIFSC) is currently coordinating a marine ecosystem
science plan for research within the Monument. The Council is developing regulations
for defining and managing the types of noncommercial fishing that the proclamation
provides for in Islands Unit waters. Those regulations will be forwarded to the
Department of Commerce. The PIFSC Human Dimensions Research Program is
currently studying Guam and CNMI residents’ awareness of the Monument, their
preferences for management and scientific research, and their related attitudes. The
Program also is studying traditional fishing activities in the Islands Unit.
ISSUES AFFECTING CNMI AS A FISHING COMMUNITY
This section contains a number of key factors that can be monitored to assess how
CNMI is changing as a fishing community.

75
Figure 16.--Map showing boundaries of the Marianas Trench Marine National
Monument.

76
The Declining Economy
It is impossible to separate discussions about the trends in CNMI as a fishing community from
discussions about the overall health and condition of CNMI, which is dominated by the near
collapse of the CNMI economy. A recent economic update (First Hawaiian Bank, 2010)
concluded that,
The economic outlook nowadays for Saipan and the other islands of the
Commonwealth of the Northern Marianas (CNMI) is bleaker, and it may not
get any better soon. Both of the main traditional sectors have sustained major
blows in recent years. Clearly, the CNMI must find some new economic
growth engine. The two main pillars of the Saipan economy have been
tourism, mainly from Japan, and the garment industry. But Japanese tourism
has nosedived, and the garment industry has moved on to cheaper locations.
A report prepared for the 2007 Business Opportunities Conference sponsored by the U.S.
Department of the Interior, Office of Insular Affairs (Shin, 2007) also contained a number of
ideas for revitalizing the CNMI economy, including: tourism (and related businesses);
education; island products (agriculture, aquaculture, spring water on Rota); infrastructure
(renewable energy, transshipping service, sewage system); the film industry (production and
post-production); and opportunities associated with the military buildup in Guam.
Many other ideas are being discussed, some of which involve fishing as an economic
development mechanism (see following section). Results of a survey of CNMI fishermen
(Hospital and Beavers, 2012) suggest that current fishermen believe more people will be fishing
on CNMI in the future—commercially as a way to supplement income, and for subsistence to
supplement diet and assist the community. Fishing rates could also decrease because of rising
fuel costs that inhibit people’s inability to participate. There is also concern about immigrants,
especially people living in poverty, and their effect of fish and reef resources. Regardless, it will
be important to track economic conditions and the corresponding adaptive behavior and
implications for fishing and fish populations.
Impact Assessment, Inc. (2011) reported that the economy was affecting fishing activities, with
fishing levels and market prices being affected by government pay cuts and furloughs and an
ongoing decline in the tourism industry in CNMI. The impact of pay cuts and furloughs was
perceived as encouraging people to look at other ways to earn and save money, including fishing
for home consumption and sales, but high fuel prices were serving as an impediment to fishing.
Federal Regulations and Involvement
U.S. Public Law 110-229 re-federalized the CNMI immigration policy and control. Areas of
uncertainty include guest worker labor availability and the continued ability of Chinese and
Russians to invest in second homes or other real estate (Joint Guam Program Office, 2010).
Resorts are particularly at risk because of their dependence on foreign workers who may be
repatriated, and because tourists from the People’s Republic of China and Russia, comprising

77
about 20% of tourism revenues, may no longer qualify for visa waivers under the new rules.
Another significant piece of legislation is U.S. Public Law 110-28, which increased the CNMI
minimum wage incrementally to meet the U.S. federal minimum wage, potentially resulting in an
increase in unemployment. Other federal issues include the ongoing dispute over control of
waters out to 3 miles and the designation of the Marianas Trench Marine Monument is another
federal action. Although the Monument could be an economic asset to CNMI, its creation was
viewed by some as yet another federal encroachment on the CNMI’s local sovereignty. The use
of CNMI lands, waters, and air space by the U.S. military is also a social issue and source of
conflict.
At the same time, federal funds flowing into CNMI contribute substantially to the economy. A
recent Saipan Tribune article (2011a) described a new commitment of $1 million to aid
economic development efforts through job training.
The military buildup taking place on Guam also could affect CNMI, although not at the same
scope or scale. The Final EIS on the project (Joint Guam Program Office, 2010) described the
proposed action in CNMI as consisting primarily of development at Tinian of live-fire training
ranges and airspace use. No Marine Corps relocation and/or training activities are planned for
the marine environment on Tinian, nor are in-water construction, dredging, or training activities,
or land-based construction activities that would directly impact the marine environment (Joint
Guam Program Office, 2010). Construction of facilities for training and operations on Tinian are
expected to be conducted by contractors based on Saipan or Guam and to create a maximum of
180 construction jobs per year, for a 2-year period, and about 35 indirect jobs in the Tinian
economy. However, Tinian ranchers would be “significantly impacted by the termination of
grazing leases located within the range footprints and associated Surface Danger Zone (SDZs).”
Depending on the alternative, the acreage of land with agricultural/grazing permits that would be
affected by the proposed action would be between 5 and 15% of the total amount of
agricultural/grazing land available in the lease back area (Joint Guam Program Office, 2010).
Many of the implications of these federal actions have not yet transpired, so it will be important
to monitor not just the status of these federal laws and actions, but how the CNMI community
responds to them and, in turn, how fishing is affected.
Saipan Fishermen’s Cooperative Association
Fishing cooperatives (co-ops) serve many functions both to the fishing community and to the
broader community. The development of a new co-op on Saipan could accomplish many goals
and strengthen both the industry and the broader community. If the co-op can find an energetic
manager and succeed like the Guam Fishermen’s Co-op, the Saipan co-op could greatly enhance
fishermen’s access to stores, restaurants, and other markets for fish.
Impact Assessment, Inc. (2011) reported that fishermen in Saipan, Tinian, and Rota noted
challenges arising primarily from low market prices and lack of local demand. A cooperative
could provide the facilities and proper handling standards to process fish and, as such, may
provide fishermen with an outlet for larger pelagic fish. Currently, vendors only sell whole fish

78
and such prefer smaller pelagics that can fit into coolers. In addition, fishermen and managers
alike note that a cooperative structure might support the more casual or weekend fishermen by
assuring purchase of catch at an established price. Fishermen in Rota and Tinian noted a lack of
local demand to support consistent sale of catch. Cold storage, processing, and transport
facilities were reportedly required and desired to support the creation an export market.
Infrastructure challenges in CNMI primarily relate to boat ramp access.
Miller (2001) suggested several actions that could be taken to improve the operations of the
small boat fleet, including a Commonwealth rebate of the liquid fuels tax for commercial fishing
vessels, fisherman education and training on fish quality and handling and possible gear
alternatives, and market development. The report noted that development of a successful
fishermen’s coop could contribute substantially toward these and related efforts.
Fishing as Economic Development
The fishing industry, including local fishermen and the import market, is linked to tourism. A
study by the Department of Commerce Central Statistics Division found that fish imports
dropped by close to 85% in a 6-year period, from 1.194 million pounds in 1992 to only about
184,300 pounds in 1997. The report said this trend indicated that an increasing number of local
businessmen ventured into commercial fishing, spurred by the increasing demand by the islands’
hotels and restaurant for fresh sea products (Saipan Tribune, 2001). Of the 380,135 pounds of
fish caught and sold in the Northern Marianas in 1997, reef fish constituted the largest species
group, followed by skipjack tuna and mahimahi. However, imports still comprised more than
half of total fish sold in the Northern Marianas each year.
Fisheries also are recognized as an economic development mechanism; the same report (Saipan
Tribune, 2001) also mentioned that “A study previously commissioned by the Commonwealth
Ports Authority has, in fact, recognized the bright potential for fish transshipment in the Northern
Marianas ... A domineering program that may be implemented by the CNMI government on fish
transshipment can handle at least 150 boat loads of 15-20 tons per month, bringing at least
$3,500 in wharfage revenue to the seaport each month. Also, there are some opportunities to
transship fresh or frozen tuna in the CNMI, taking advantage of the airlift to Japanese market.”
The developing longlining industry participants have ambitious marketing plans. Some people
don’t think they will succeed, but if they do, that would be almost a new industry for the CNMI.
There hasn’t been any significant successful commercial fishing in the CNMI since the Japanese
fishery in the 1920s and 1930s. Pelagic fish in the western and central Pacific Ocean, including
the Marianas Archipelago, are subject to regulation by a regional fisheries management
organization, the Western and Central Pacific Fisheries Commission, of which the United States
is a member. Although bigeye tuna are not a strong target species for CNMI longliners, the
WCPFC has established quite a large limit, 2000 metric tons (or an unlimited amount, if the
entity has a responsible fisheries development plan), for jurisdictions which do not currently
have an established bigeye fishery, including CNMI. This at least suggests that international
regulations would not be a limiting factor in longline expansion, and that this generous limit
could perhaps be used as an economic advantage through a leasing mechanism with other fleets.

79
In the early 2000s, the Northern Marianas College developed an economic assessment of the
domestic fisheries development potential of the Commonwealth of the Northern Mariana Islands
(Miller, 2001) This report was funded by an Saltonstall-Kennedy grant to the CNMI Department
of Commerce. The report stated that, “locally based pelagic fisheries in the Commonwealth of
the Northern Mariana Islands have not developed to fully use the 200-mile EEZ, nor have they
achieved harvest levels of formerly operating foreign fleets.” The report concluded that
Development of larger-scale domestic pelagic fisheries in the CNMI does not
appear to be likely at this time. The primary constraints on such development
are that the infrastructure that is available in the CNMI is not oriented toward
commercial fishing and it is not cost competitive with the Port of Guam.
Further, locally based pelagic vessels must compete with imported fish landed
in large volumes in Guam. Any locally based transshipment operation would
also have to be competitive with Guam operations. Large-scale fish processing
development is also not seen as a potential for development due to potential
conflicts with the tourism sector, environmental concerns, and the fact that
such operations are currently struggling in the region. In light of the limited
potential for development of larger-scale pelagic fisheries, it seems prudent
that the CNMI government should focus its efforts on promoting the existing
small boat pelagic fleet. Vessels operating in the existing pelagic fleet are
generally profitable at this time. Increased activity, participation, and harvests
in that fishery do not appear to be constrained by regulations, finance,
infrastructure, or labor. The primary constraint on the local small boat pelagic
fishery is its limited local market. The limited local market has likely been
negatively affected by a decline in the local economy. Significant import
competition also limits that market and will likely continue to do so.
Impact Assessment, Inc. (2011) reported that the fishermen interviewed had mentioned
infrastructure and fisheries closed areas as issues. Two of the most heavily used boat ramps are
difficult to operate during low tide; a previous infrastructure issue was the need for a light
channel at the most heavily used ramp at Sugar Dock (Miller, 2001). The number and
maintenance of FADS was also discussed. CNMI already has marine reserves and is a participant
in Micronesia Challenge. Additional spatial closures would likely affect shore and nearshore
users, rather than offshore fishermen. The closures could, however, indirectly impact boat-based
fishing activity by displacement of effort and/or increased market demand for fish. Tracking
many of these fishing concerns and issues will necessarily involve tracking the capacity and
actions of fisheries management institutions, whether or not the issue is economic development.
Trends in Fishing Patterns
As mentioned above in the Economy section, the current economic decline could affect fishing
in many ways. It will be important to continue to monitor levels and types of shoreline and boat-
based fishing in the CNMI, and the blend of commercial/noncommercial activity. This is
especially important given the recent development of annual catch limits (ACLs) for all managed

80
species by the Council, as mandated by the recent reauthorization of the Magnuson-Stevens Act.
ACLs for many of the species caught by CNMI-based fishermen were determined using rules of
thumb for data-poor situations and therefore based on catch history. Some of these ACLs may
need adjustment, as may the methods by which the catch data are collected and compiled, which
is currently on a voluntary basis. The social and cultural ties to fishing remain strong for both
the indigenous peoples of the CNMI and immigrants, thus so is the need to fish on a sustainable
basis.

81
REFERENCES
Allen, S., and P. Bartram.
2008. Guam as a fishing community. Pacific Islands Fish. Sci. Cent., Natl. Mar. Fish. Serv.,
NOAA, Honolulu, HI 96822-2396. Pacific Islands Fish. Sci. Cent. Admin. Rep. H-08-01,
61 p.
Amesbury, S. S., and R. F. Myers.
1982. Guide to the coastal resources of Guam: Vol. 1, The Fishes. University of Guam
Marine Laboratory Contribution Number 173. University of Guam Press, Mangilao.
Amesbury, J. R., D. R. Moore, and R. L. Hunter-Anderson.
1996. Cultural adaptations and Late Holocene sea level change in the Marianas: Recent
excavations at Chalan Piao, Saipan, Micronesia. Bulletin of the Indo-Pacific Prehistory
Association 15, pp. 53-69.
Amesbury, J. R., and R. L. Hunter-Anderson.
2003. Review of archaeological and historical data concerning reef fishing in the U.S. Flag
Islands of Micronesia: Guam and the Northern Mariana Islands. Prepared for Western
Pacific Regional Fishery Management Council, Honolulu. Micronesian Archaeological
Research Services, Guam. Available on the website of the Fishery Management Council
at www.wpcouncil.org under Mariana Archipelago Library.
Amesbury, J. R., and R. L. Hunter-Anderson.
2008. An analysis of archaeological and historical data on fisheries for pelagic species in
Guam and the Northern Mariana Islands. Prepared for Pelagic Fisheries Research
Program, University of Hawaiʻi at Mānoa. Micronesian Archaeological Research
Services, Guam. Available on the website of the Pelagic Fisheries Research Program at
www.soest.hawaii.edu/pfrp/ under Other Publications.
Anson, B. G.
1748. A Voyage Round the World (1740-1744). Compiled by Richard Walther, London.
Bank of Hawaii.
2003. CNMI Economic Report. October 2003, Bank of Hawaii and East-West Center
(http://www.boh.com/econ/). Accessed 9/14/2011.
Barratt, G.
1988a. Carolinian Contacts with the Islands of the Marianas: The European Record.
Micronesian Archaeological Survey Report Number 25, Division of Historic
Preservation, Department of Community and Cultural Affairs, Saipan.
Barratt, G.
1988b. H.M.S. Centurion at Tinian, 1742: The Ethnographic and Historic Records.
Micronesian Archaeological Survey Report No. 26, Saipan.

82
Birkes, F., C. Folke, and J. Colding.
2000. Linking social and ecological systems: management practices and social mechanisms
for building resilience. Cambridge University Press.
Bowers, N. M.
2001. (First published 1950). Problems of resettlement on Saipan, Tinian and Rota, Mariana
Islands. Occasional Historical Papers Series No. 7, CNMI Division of Historic
Preservation, Saipan.
Brainard R.E., Asher J, Blyth-Skyrme V, Coccagna EF, Dennis K, Donovan MK, Gove JM,
Kenyon J, Looney EE, Miller JE, Timmers MA, Vargas-Angel B, Vroom PS, Vetter O,
Zgliczynski B, Acoba T, DesRochers A, Dunlap MJ, Franklin EC, Fisher-Pool PI, Braun CL,
Richards BL, Schopmeyer SA, Schroeder RE, Toperoff A, Weijerman M, Williams I, Withall
RD 2012. Coral reef ecosystem monitoring report of the Mariana Archipelago: 2003-2007
Pacific Islands Fisheries Science Center, PIFSC Special Publication, SP-12-01, 1019 p.
Butler, B. M. (ed.)
1995. Archaeological investigations in the Achugao and Matansa areas of Saipan, Mariana
Islands. Micronesian Archaeological Survey Report No. 30, Division of Historic
Preservation, Department of Community and Cultural Affairs, Saipan.
Carano, P., and P. C. Sanchez.
1964. A complete history of Guam. Charles E. Tuttle Company, Rutland Vermont.
Chapman, L.
2004. Nearshore domestic fisheries development in Pacific Island countries and territories.
Noumea, New Caledonia: Secretariat of the Pacific Community, August 26 2004.
Available at: http://www.spc.int/DigitalLibrary/Doc/FAME/Meetings/HOF/4/IP8.pdf
(Accessed 7-20-12).
Cheng, A. S. and M. Fernandez-Gimenez.
2006. Ford Foundation community-based forestry demonstration program research
component final report. Available at: http://actrees.org/files/Research/cbf_report.pdf
(accessed 5-1-12).
CNMI Department of Commerce, Central Statistics Division.
2008. Report on the 2005 CNMI Household, Income, and Expenditures Survey. April 1,
2008. Available at: http://commerce.gov.mp/wp-content/uploads/2012/05/2005-HIES-
Report-Final-Complete-02.pdf (Accessed 7-25-12).
Craib, J. L.
1990. Archaeological investigations at Mochong, Rota, Mariana Islands. Submitted to the
Office of Historic Preservation, Commonwealth of the Northern Mariana Islands.
Department of Archaeology, La Trobe University, Melbourne.
Crozet, C.

83
1891. Crozet’s Voyage to Tasmania, New Zealand, the Ladrone Islands, and the Philippines
in the Years 1771-1772. Translated by H. Ling Roth. Truslove and Shirley, London.
Dampier, W.
1937. A new voyage round the world. Adam and Charles Black, London.
David, C.
2010. 13 fishermen honored on their death anniversary. Saipan Tribune, September 27,
2010.
de la Corte, F. M. y R. Calderón.
1970. Descriptive and Historical Report on the Mariana Islands. Translation courtesy of
Micronesian Area Research Center, University of Guam, Mangilao.
Denfeld, D.
1997. Hold the Marianas. White Mane Publishing Company, Inc., Shippensburg,
Pennsylvania.
Donaldson, T. J., R. F. Myers, J. T. Moyer, and P. J. Schupp.
1994. Zoogeography of fishes of the Mariana, Ogasawara and Izu Islands: A preliminary
assessment. In Asakura, Akira and Tatsuwo Furuki (eds.), Biological Expedition to the
Northern Mariana Islands, Micronesia, pp. 303-332. Natural History Research, Special
Issue, Number 1, Natural History Museum and Institute, Chiba, Japan.
Driver, M. G.
1983. Fray Juan Pobre de Zamora and his account of the Mariana Islands. Journal of Pacific
History 18(3):198-216.
Driver, M. G.
2005. The Spanish Governors of the Mariana Islands. MARC Educational Series No. 27,
Micronesian Area Research Center, University of Guam, Mangilao.
Farrell, D. A.
1991. History of the Northern Mariana Islands. Public School System, Commonwealth of
the Northern Mariana Islands, Saipan.
First Hawaiian Bank.
2010. Economic forecast – 2010 Guam-CNMI Edition.
Freycinet, L. C. de.
2003. An Account of the Corvette L’Uraine’s Sojourn at the Mariana Islands, 1819.
Translated and prefaced by Glynn Barratt. Occasional Historical Papers No. 13, CNMI
Division of Historic Preservation, Saipan, CNMI.
Fritz, G.

84
2001. The Chamorro, A history and ethnography of the Mariana Islands. Translated by
Elfriede Craddock, edited by Scott Russell. Third English edition. Occasional Historical
Papers Series, No. 1, CNMI Division of Historic Preservation, Saipan.
García, F.
1985. The life and martyrdom of the Venerable Father Diego Luis de Sanvitores. Translated
by Margaret Higgens. Nieves M. Flores Memorial Library. Agana, Guam.
Government Accountability Office.
2007. Commonwealth of the Northern Mariana Islands: serious economic, fiscal, and
accountability challenges. Testimony Before the Committee on Energy and Natural
Resources, U.S. Senate. GAO-07-436T.
Government Accountability Office.
2008. Commonwealth of the Northern Mariana Islands: managing potential economic
impact of applying U.S. Immigration Law requires coordinated federal decisions and
additional data. August 2008. Report GAO 08-791.
Government Accountability Office.
2010. American Samoa and Commonwealth of the Northern Mariana Islands employment,
earnings, and status of key industries since minimum wage increases began. Report
GAO-10-333, April, 2010.
Government Accountability Office.
2011a. American Samoa and Commonwealth of the Northern Mariana Islands employment,
earnings, and status of key industries since minimum wage increases began. Report
GAO-11-427, April 2011.
Government Accountability Office.
2011b. Commonwealth of the Northern Mariana Islands: status of transition to federal
Immigration Law. Report GAO-11-805T, Jul 14, 2011.
Government Accountability Office.
2011c. American Samoa and Commonwealth of the Northern Mariana Islands employment,
earnings, and status of key industries since minimum wage increases began. GAO-11-
956T, Sep 23, 2011.
Graves, M.W.
1986. Organization and differentiation within late prehistoric ranked social units, Mariana
Islands, Western Pacific. Journal of Field Archaeology 13(2):139-154.
Haun, A. E., J. A. Jimenez, M. A. Kirkendal, and S. T. Goodfellow.
1999. Archaeological investigations at Unai Chulu, Island of Tinian, Commonwealth of the
Northern Mariana Islands. Prepared for Commander, Pacific Division, Naval Facilities
Engineering Command, Pearl Harbor, Hawaii. Paul H. Rosendahl, Ph.D., Inc., Hilo.

85
Higuchi, W.
2007. Pre-war Japanese fisheries in Micronesia: focusing on bonito and tuna fishing in the
Northern Mariana Islands. Immigration Studies No.3, pp. 49-68. Center for Migration
Studies, University of the Ryukyus, Nishihara, Okinawa, Japan.
Hornbostel, H. G.
1924-25. Unpublished field notes, on microfilm, Micronesian Area Research Center,
University of Guam, Mangilao.
Hornell, J.
1975. Vol. 1, The canoes of Polynesia, Fiji, and Micronesia. Originally published in 1936 as
Bernice P. Bishop Museum Special Publication 27. In: Canoes of Oceania by A.C.
Haddon and James Hornell, pp. 1-454. Bishop Museum Press, Honolulu.
Hospital, J., and C. Beavers.
2012. Catch disposition and other aspects of fishing in the Commonwealth of the Northern
Mariana Islands. Pacific Islands Fisheries Science Center. PIFSC Internal Report.
Hunter-Anderson, R. L., and D. R. Moore.
2002. Phase I and Phase II archaeological survey at Waterfront Annex and Ordnance Annex,
Territory of Guam. Prepared under Contract No. N26742-97-D-3511, Task Order 12,
Task 1 between International Archaeological Research Institute, Inc. and the Department
of the Navy, Pacific Division, Naval Facilities Engineering Command, Pearl Harbor.
Micronesian Archaeological Research Services, Guam.
Impact Assessment, Inc.
2011. Draft manuscript prepared for Western Pacific Regional Fishery Management Council.
Available from Impact Assessment Inc.
Joint Guam Program Office.
2010. Guam and CNMI military relocation final Environmental Impact Statement.
Relocating Marines from Okinawa, Visiting Aircraft Carrier Berthing, and Army Air and
Missile Defense Task Force July 2010. Point of Contact: c/o Naval Facilities Engineering
Command, Pacific Attn: Guam Program Management Office
Karolle, B. G.
1993. Atlas of Micronesia, Second Edition. Bess Press, Honolulu.
King, M.G., and L. Lambeth.
2000. Fisheries Management by Communities; a manual on promoting the management of
subsistence fisheries by Pacific Island communities. Secretariat of the Pacific
Community. New Caledonia. 87 p.
Lander, M. A.
2004. A rainfall climatology for Saipan: distribution, return-periods, El Niño, tropical
cyclones, and long-term variations. University of Guam Water and Environmental
Research Institute of the Western Pacific, Technical Report No. 103, February 2004

86
Leach, B. F., M. Fleming, J. M. Davidson, G. K. Ward, and J. L. Craib.
1990. Appendix C, Prehistoric Fishing at Mochong, Rota, Mariana Islands. In:
Archaeological Investigations at Mochong, Rota, Mariana Islands, by John L. Craib, pp.
C-1 to C-34. Submitted to the Office of Historic Preservation, Commonwealth of the
Northern Mariana Islands. Department of Archaeology, La Trobe University,
Melbourne.
Lévesque, R. (compiler and editor).
1992a. History of Micronesia, a collection of source documents, Volume 1—European
Discovery, 1521-1560. Lévesque Publications, Québec, Canada.
Lévesque, R. (compiler and editor).
1992b. History of Micronesia, a collection of source documents, Volume 2—Prelude to
Conquest, 1561-1595. Lévesque Publications, Québec, Canada.
Lévesque, R. (compiler and editor).
1993. History of Micronesia, a collection of source documents, Volume 3—First Real
Contact, 1596-1637. Lévesque Publications, Québec, Canada.
McCaffrey, S. M. (tech. ed.).
2006. The public and wildland fire management: social science findings for managers. Gen.
Tech. Rep. NRS-1. Newtown Square, PA: U.S. Department of Agriculture, Forest
Service, Northern Research Station. 202 p.
McGovern-Wilson, R.
1989. Afetña: The prehistory of South West Saipan. Prepared for InterPacific Resorts and
Historic Preservation Office, Saipan. Anthropology Department, University of Otago,
Dunedin, New Zealand.
Malcolm D. McPhee & Associates and Conway, Dick.
2008. Economic impact of federal laws on the Commonwealth of the Northern Mariana
Islands. Report prepared for Office of the Governor, The Commonwealth of the
Northern Mariana Islands, under a Grant from the Office of Insular Affairs, U.S.
Department of the Interior.
Miller, S. A.
2001. Domestic fisheries development potential of the Commonwealth of the Northern
Mariana Islands. The Northern Marianas College Cooperative Research, Extension, and
Education Service, Grant Number: NA 96FD0471 April 13, 2001
Moore, D. R.
1983. Measuring change in Marianas pottery: The Sequence of Pottery Production at
Tarague, Guam. M. A. thesis, Behavioral Science, University of Guam, Mangilao.
Moore, D. R., R. L. Hunter-Anderson, J. R. Amesbury, and E. F. Wells.

87
1992. Archaeology at Chalan Piao, Saipan. Prepared for Jose Cabrera and the Historic
Preservation Division, Department of Community and Cultural Affairs, Commonwealth
of the Northern Mariana Islands, Saipan. Micronesian Archaeological Research Services,
Guam.
Moore, D. R., and R. L. Hunter-Anderson.
1999. Pots and pans in the intermediate Pre-Latte (2500-1600 BP), Mariana Islands,
Micronesia. In: The Pacific from 5000 to 2000 BP, Colonisation and Transformations,
edited by J-C Galipaud and I. Lilley, pp. 487-503. IRD Editions, Paris.
National Research Council.
1999. The community development quota program in Alaska. Report by Committee to
Review the Community Development Quota Program, Ocean Studies Board,
Commission on Geosciences, Environment, and Resources. Washington, DC: National
Academy Press. ISBN-10: 0-309-06082-6
Olopai, L. M. (with Juliana Flinn).
2005. The rope of tradition: reflections of a Saipan Carolinian. Saipan, CNMI: Northern
Mariana Islands Council for the Humanities.
Osman, W. M.
2004. An update on the economies of Guam and Commonwealth of the Northern Mariana
Islands (CNMI), May 2004.
Olive y García, F.
1984. Mariana Islands: 1884-1887. Translated and annotated by Marjorie G. Driver.
Micronesian Area Research Center, University of Guam, Mangilao.
Pai, M.
2010. Office of the Public Auditor Annual Report, January to December 2010.
Randall, R. H.
1995. Biogeography of reef-building corals in the Mariana and Palau Islands in relation to
back-arc rifting and the formation of the Eastern Philippine Sea. Natural History
Research 3(2):193-210.
Rogers, C. W.
1928. A cruising voyage round the world. Longmans, Green and Co., New York.
Rogers, R. F.
1995. Destiny's landfall, a history of Guam. University of Hawaii Press, Honolulu.
Saipan Tribune.
88
2001. NMI importing less fish. Tuesday, May 15, 2001 By Tribune Staff.
Saipan Tribune.
2009. Fitial statement on designation. Thursday, January 08, 2009.
Saipan Tribune.
(Friday, June 11, 2010). Economic indices lowest in 5 yrs. By Haidee V. Eugenio.
Saipan Tribune.
2011a. U.S. commits $1 million to help CNMI economy. Funds to provide job training, By
Haidee V. Eugenio, May 31, 2011.
Safford, W. E.
1905. Useful plants of the Island of Guam. Contributions from the United States National
Herbarium Volume IX. Smithsonian Institution, Washington, D.C.
Shin, J. S.
2007. Commonwealth of the Northern Mariana Islands Business Opportunities Report.
(Update of a Tomas Kandl, 2004 report with the same title). Prepared for USDI Office of
Insular Affairs, July, 2007.
Spoehr, A.
1957. Marianas prehistory. Fieldiana: Anthropology Vol. 48.
Spoehr, A.
2000. (Second Edition). Saipan: the ethnology of a war-devastated island. N.M.I. Division
of Historic Preservation. Originally published in 1954 in Fieldiana: Anthropology Vol.
41.
Starmer, J., J. Asher, F. Castro, D. Gochfeld, J. Gove, A. Hall, P. Houk, E. Keenan, J. Miller, R.
Moffitt, M. Nadon, R. Schroeder, E. Smith, M. Trianni, P. Vroom, K. Wong, and K.Yuknavage.
2008. The state of coral reef ecosystems of the Commonwealth of the Northern Mariana
Islands. Available at
http://ccma.nos.noaa.gov/ecosystems/coralreef/coral2008/pdf/CNMI.pdf (accessed 5-1-
12). In: Waddell, J.E. and A.M. Clarke (eds.), 2008. The State of Coral Reef Ecosystems
of the United States and Pacific Freely Associated States: 2008. NOAA Technical
Memorandum NOS NCCOS 73. NOAA/NCCOS Center for Coastal Monitoring and
Assessment’s Biogeography Team. Silver Spring, MD. 569 pp.
U.S. Ocean Action Plan.
2004. The Bush Administration’s Response to the U.S. Commission on Ocean Policy.
Available at:
http://data.nodc.noaa.gov/coris/library/NOAA/other/us_ocean_action_plan_2004.pdf
(Accessed 7-28-12).

89
U.S. Government.
1948-1978. Annual Report to the United Nations on the Administration of the Trust
Territory of the Pacific Islands. Prepared by the Department of the Navy 1948-1951, by
the Department of the Interior 1952-1953, and by the State Department 1954 through
1978.
van Beukering, P., et al.
2006. The economic value of the coral reefs of Saipan, Commonwealth of the Northern
Mariana Islands. Report prepared by Cesar Environmental Economics Consulting under
awards CRI-3, 4 and 5 from the US Department of the Interior and National
Oceanographic and Atmospheric Administration.
Western Pacific Regional Fishery Management Council. 2009a. Toward an ecosystem approach
for the Western Pacific Region: From species-based fishery management plans to place-
based fishery ecosystem plans. Final programmatic environmental impact statement.
Prepared in coordination with National Marine Fisheries Service. September 24, 2009.
Western Pacific Regional Fishery Management Council. 2009b. Fishery Ecosystem Plan for the
Mariana Archipelago. September 24, 2009. Available at:
http://www.wpcouncil.org/fep/WPRFMC%20Mariana%20FEP%20(2009-09-22).pdf
(Accessed 7-20-12).
Western Pacific Regional Fishery Management Council.
2010a. Unpublished 2009 Pelagic Fisheries Draft Annual Report Module: CNMI. Western
Pacific Regional Fishery Management Council, Honolulu, Hawaii.
Western Pacific Regional Fishery Management Council.
2010b. Unpublished 2009 Pelagic Fisheries Draft Annual Report Module: Guam. Western
Pacific Regional Fishery management Council, Honolulu, Hawaii.
Yaffee, S. L.
1999. Three faces of ecosystem management. Conserv. Biol. 13(4): 713-725.

90

Availability of NOAA Technical Memorandum NMFS
Copies of this and other documents in the NOAA Technical Memorandum NMFS series issued
by the Pacific Islands Fisheries Science Center are available online at the PIFSC Web site
http://www.pifsc.noaa.gov in PDF format. In addition, this series and a wide range of other
NOAA documents are available in various formats from the National Technical Information
Service, 5285 Port Royal Road, Springfield, VA 22161, U.S.A. [Tel: (703)-605-6000]; URL:
http://www.ntis.gov. A fee may be charged.
Recent issues of NOAA Technical Memorandum NMFS–PIFSC are listed below:
NOAA-TM-NMFS-PIFSC-30 Spillover effects of environmental regulation for sea turtle
protection: the case of the Hawaii shallow-set longline
fishery.
H. L. CHAN, and M. PAN
(January 2012)
31 The sociocultural importance of spearfishing in Hawaiʻi.
B. W. STOFFLE, and S. D. ALLEN
(March 2012)
32 A workshop on methods to estimate total and natural mortality
rates using mean length observations and life history parameters.
J. BRODZIAK, T. GEDAMKE, C. PORCH, J. WALTER,
D. COURTNEY, J. O’MALLEY, and B. RICHARDS
(June 2012)
33 Status of coral reef fish assemblages and benthic condition
around Guam: a report based on underwater visual surveys in
Guam and the Mariana Archipelago, April−June 2011.
I. WILLIAMS, J. ZAMZOW, K. LINO, M. FERGUSON, and
E. DONHAM
(August 2012)
34 Report of the Sea Turtle Longline Fishery Post-release
Mortality Workshop, November 15−16, 2011.
Y. SWIMMER, and E. GILMAN
(August 2012)
35 Institutional analysis of community-based marine resource
Management initiatives in Hawaii and American Samoa.
L. RICHMOND, and A. LEVINE
(November 2012)
Top Related