


Languages
Pages
Legal


http://eeg.sagepub.com/Clinical EEG and Neuroscience
http://eeg.sagepub.com/content/early/2014/09/20/1550059414548721The online version of this article can be found at:
DOI: 10.1177/1550059414548721
published online 21 September 2014Clin EEG NeurosciJing Li, Xianzeng Liu and Gaoxiang Ouyang
Using Relevance Feedback to Distinguish the Changes in EEG During Different Absence Seizure Phases
Published by:
http://www.sagepublications.com
On behalf of:
EEG and Clinical Neuroscience Society
can be found at:Clinical EEG and NeuroscienceAdditional services and information for
http://eeg.sagepub.com/cgi/alertsEmail Alerts:
http://eeg.sagepub.com/subscriptionsSubscriptions:
http://www.sagepub.com/journalsReprints.navReprints:
http://www.sagepub.com/journalsPermissions.navPermissions:
What is This?
- Sep 21, 2014OnlineFirst Version of Record >>
at UNIV OF SAN DIEGO on September 30, 2014eeg.sagepub.comDownloaded from at UNIV OF SAN DIEGO on September 30, 2014eeg.sagepub.comDownloaded from

Clinical EEG and Neuroscience 1 –9© EEG and Clinical Neuroscience Society (ECNS) 2014Reprints and permissions:sagepub.com/journalsPermissions.navDOI: 10.1177/1550059414548721eeg.sagepub.com
Original Article
Introduction
According to the World Health Organization, the incidence of epilepsy has affected more than 50 million individuals world-wide (ie, about 0.6% to 1% of the world’s population). This not only affects the patients themselves but also brings inconve-nience to their families. Consequently, it is important to predict seizures as early as possible such that clinicians can prescribe necessary medication for stopping the disease progression.1 During the past few decades, EEG signals have become one of the most useful tools for studying the processes involved in epileptic seizures.2-4 Currently, computational methods for ana-lysing nonlinear EEG signals mainly consist of traditional lin-ear methods such as Fourier transforms and spectral analysis5 and nonlinear algorithms such as Lyapunov exponents,6 corre-lation dimension,7,8 similarity,9 and power of scale freeness of visibility graph (PSVG).10
Understanding the transition of brain activity toward an absence seizure (ie, preseizure) is a very demanding task. EEG has become one of the most important diagnostic tools in clinical neurophysiology, most notably in epilepsy. Generally, the EEG is a recording of the mean electrical activity of the brain from the scalp in different locations of the head (scalp EEG). More spe-cially, it is the sum of the extracellular current flows of a large group of neurons, and the EEG activity can be classified by its
frequency, voltage, morphology, synchrony, and periodicity. Typical absence seizures are accompanied by an EEG hallmark of brief ictal and interictal 2.5- to 3-Hz spike-and-wave com-plexes with a maximum amplitude over the frontorolandic regions.11 A previous analysis of EEG dynamic changes of Genetic Absence Epilepsy Rat from Strasbourg (GAERS) has demonstrated that EEG epochs prior to seizures exhibit a higher degree of regularity/predictability than that in seizure-free EEG epochs, but they present a lower degree than that in seizure EEG epochs.12,13 These EEG precursors in rat models give us a clue in predicting human absence epilepsy via EEG signals.
548721 EEGXXX10.1177/1550059414548721Clinical EEG and NeuroscienceLi et alresearch-article2014
1State Key Laboratory of Cognitive Neuroscience and Learning & IDG/McGovern Institute for Brain Research, Beijing Normal University, Beijing, China2School of Information Engineering, Nanchang University, Nanchang, China3The Comprehensive Epilepsy Center, Departments of Neurology and Neurosurgery, Peking University People’s Hospital, Beijing, China4Center for Collaboration and Innovation in Brain and Learning Sciences, Beijing Normal University Beijing, China
Corresponding Author:Gaoxiang Ouyang, Center for Collaboration and Innovation in Brain and Learning Sciences, Beijing Normal University Beijing 100875, China. Email: [email protected] Full-color figures are available online at http://eeg.sagepub.com
Using Relevance Feedback to Distinguish the Changes in EEG During Different Absence Seizure Phases
Jing Li1,2, Xianzeng Liu3, and Gaoxiang Ouyang1,4
AbstractWe carried out a series of statistical experiments to explore the utility of using relevance feedback on electroencephalogram (EEG) data to distinguish between different activity states in human absence epilepsy. EEG recordings from 10 patients with absence epilepsy are sampled, filtered, selected, and dissected from seizure-free, preseizure, and seizure phases. A total of 112 two-second 19-channel EEG epochs from 10 patients were selected from each phase. For each epoch, multiscale permutation entropy of the EEG data was calculated. The feature dimensionality was reduced by linear discriminant analysis to obtain a more discriminative and compact representation. Finally, a relevance feedback technique, that is, direct biased discriminant analysis, was applied to 68 randomly selected queries over nine iterations. This study is a first attempt to apply the statistical analysis of relevance feedback to the distinction of different EEG activity states in absence epilepsy. The average precision in the top 10 returned results was 97.5%, and the standard deviation suggested that embedding relevance feedback can effectively distinguish different seizure phases in absence epilepsy. The experimental results indicate that relevance feedback may be an effective tool for the prediction of different activity states in human absence epilepsy. The simultaneous analysis of multichannel EEG signals provides a powerful tool for the exploration of abnormal electrical brain activity in patients with epilepsy.
KeywordsEEG, absence epilepsy, relevance feedback, classification, multiscale permutation entropy
Received April 16, 2014; revised July 20, 2014; accepted August 1, 2014.
at UNIV OF SAN DIEGO on September 30, 2014eeg.sagepub.comDownloaded from
2 Clinical EEG and Neuroscience
In this article, we propose a machine learning scheme to analyze EEG recordings and to explore how EEG data provide evidence for the existence of a preseizure phase in human absence epilepsy. Machine learning algorithms (eg, kernel machines including support vector machines [SVMs]14,15) have been used for epilepsy diagnosis based on EEG signals.16 Lima et al17 applied relevance vector machines (RVMs) to the detec-tion of epileptic activity and found in terms of accuracy the best-calibrated RVM models have shown comparable perfor-mance to those of SVMs. Shoeb and Guttag18 used machine learning techniques to detect the onset of an epileptic seizure via the construction of patient-specific binary classifiers. Furthermore, Shoeb et al19 applied SVMs to the detection of seizure termination in scalp EEG and obtained satisfactory results. Similarly, Nandan et al20 adopted several types of SVMs to detect epileptic seizure in an animal model of chronic epilepsy and gave comparison results. However, the aforemen-tioned algorithms mostly paid attention to classifier construc-tion and did not consider the interaction at all. In this article, we propose a machine learning algorithm based on relevance feed-back (RF), a classical human–computer interaction technique in multimedia information processing. Through embedding the interaction, promising results are achieved in distinguishing the changes in EEG during different absence seizure phases.
The scheme proposed here involves 3 stages, which are (a) signal processing (feature extraction), (b) dimensionality reduc-tion, and (c) RF-based classification. Each stage will be briefly described subsequently. In this study, we collected 19 channels of EEG recordings from 10 patients (6 males and 4 females) with absence epilepsy. The EEG signals were sampled and fil-tered. After that, they were selected and dissected from seizure-free (data set I), preseizure (data set II), and seizure phases (data set III). For each data set, a total of 112 two-second 19-channel EEG epochs from 10 patients were selected. Multiscale permu-tation entropy (MPE) explores the local order structure of suc-cessive coarse-grained time series. It is calculated at multiple scales to extract useful information for classification and has shown promising performance in absence epilepsy.21 To this end, we extract MPE features in the first stage. When the dimen-sion of extracted feature vectors is much higher than the number of training examples or it exceeds a certain value, curse of dimensionality22 will occur and subsequent classification per-formance may be degraded. Considering this, we use dimen-sionality reduction23,24 to alleviate this problem and obtain more compact representation for more accurate prediction of absence epilepsy. Here, we use linear discriminant analysis (LDA)24 to find a projection that reduces the higher dimensional feature space to a lower dimensional subspace.
After dimensionality reduction, we use RF to embed human–computer interaction into the classification task of different phases in human absence epilepsy. RF describes how we as humans interact with machines, where a machine is defined as any mechanical or electrical device that transmits or modifies energy to assist in the performance of human tasks. RF origi-nated from document retrieval,25 but has been widely used in multimedia information retrieval because it can bridge the
semantic gap between the low-level visual features and high-level image concepts. Although RF was previously adopted in medical imaging,26 this study is a first attempt to apply the sta-tistical analysis of RF to the distinction of different EEG activity states in absence epilepsy. Traditional RF methods in informa-tion retrieval include the following 2 steps27: (a) when retrieved results are returned to the user, some relevant and irrelevant examples are labeled as positive feedbacks and negative feed-backs, respectively and (b) the retrieval system refines the retrieved results based on these labeled examples. These 2 steps are conducted iteratively until the user is satisfied with pre-sented results. Over the past few decades, RF techniques have been developed based on diverse machine learning techniques: feature selection, semisupervised learning, query modification, density estimation of positive samples, negative samples analy-sis, and distance metric learning.28-31 To accomplish the classifi-cation task of different activity states in absence seizures, we adopt the direct biased discriminant analysis (DBDA),32 treating RF as a (1 + x)-class biased learning problem.
The organization of this article is as follows. We introduce the material and methods in the next section, which is followed by experimental results. The discussion and conclusions are presented in the final section.
Material and Methods
Data for Acquisition
EEG recordings were collected from 10 patients (6 males and 4 females) with absence epilepsy, aged from 8 to 21 years. The study protocol had previously been approved by the ethics committee of Peking University People’s Hospital and the patients had signed informed consent that their clinical data might be used and published for research purposes. The EEG data were recorded by the Neurofile NT digital video EEG sys-tem from a standard international 10-20 electrode placement (Fp1, Fp2, F3, F4, C3, C4, P3, P4, O1, O2, F7, F8, T3, T4, T5, T6, Fz, Cz, and Pz). They were sampled at a frequency of 256 Hz using a 16-bit analog-to-digital converter and filtered within a frequency band from 0.5 to 35 Hz.
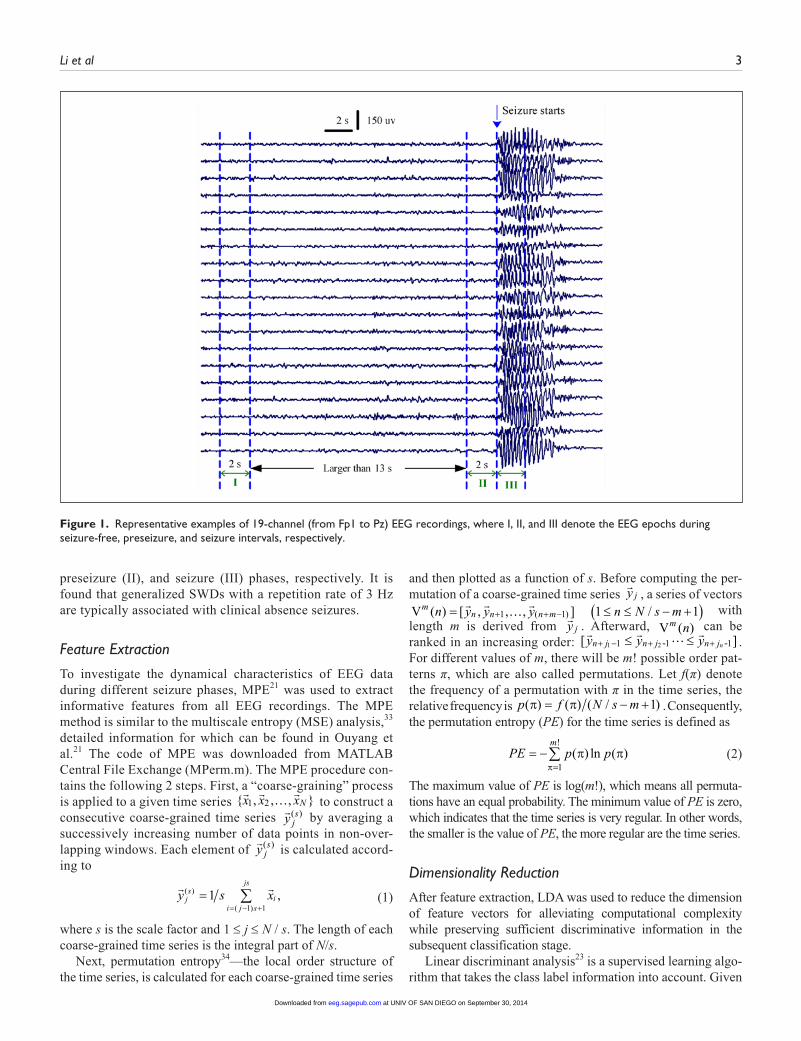
Afterward, the EEG signals were selected and dissected from different seizure phases: seizure-free (data set I), pre-seizure (data set II), and seizure (data set III) phases. For each data set, a total of 112 two-second 19-channel EEG epochs from 10 patients were extracted. The timing of onset and offset in spike-wave discharges (SWDs) was identified by an epilepsy neurologist, and these SWDs were defined as large-amplitude rhythmic 2.5- to 4-Hz discharges with typi-cal spike-wave morphology lasting longer than 1 second. The criteria for selecting seizure-free, preseizure, and seizure data are that the interval between the seizure-free data and the beginning point of seizures is greater than 15 seconds, the interval is between 0 and 2 seconds prior to seizure onset, and the interval is the first 2 seconds of the absence seizure, respectively. Figure 1 shows representative examples of 19-channel EEG recordings during seizure-free (I),
at UNIV OF SAN DIEGO on September 30, 2014eeg.sagepub.comDownloaded from
Li et al 3
preseizure (II), and seizure (III) phases, respectively. It is found that generalized SWDs with a repetition rate of 3 Hz are typically associated with clinical absence seizures.
Feature Extraction
To investigate the dynamical characteristics of EEG data during different seizure phases, MPE21 was used to extract informative features from all EEG recordings. The MPE method is similar to the multiscale entropy (MSE) analysis,33 detailed information for which can be found in Ouyang et al.21 The code of MPE was downloaded from MATLAB Central File Exchange (MPerm.m). The MPE procedure con-tains the following 2 steps. First, a “coarse-graining” process is applied to a given time series { , , , }
� � … �x x xN1 2 to construct a
consecutive coarse-grained time series
y js( ) by averaging a
successively increasing number of data points in non-over-lapping windows. Each element of
y js( ) is calculated accord-
ing to
y s xjs
ii j s
js( )
( )
,== − +∑11 1
(1)
where s is the scale factor and 1 ≤ j ≤ N / s. The length of each coarse-grained time series is the integral part of N/s.
Next, permutation entropy34—the local order structure of the time series, is calculated for each coarse-grained time series
and then plotted as a function of s. Before computing the per-mutation of a coarse-grained time series
y j , a series of vectors Vm n n n mn y y y( ) [ , , , ]( )= + + −
� � … �1 1 1 1≤ ≤ − +( )n N s m/ with
length m is derived from
y j . Afterward, Vm n( ) can be ranked in an increasing order: [ ]
� � � �y y yn j n j n jn+ − + +≤ ≤1 21 1 1- - .
For different values of m, there will be m! possible order pat-terns π, which are also called permutations. Let f(π) denote the frequency of a permutation with π in the time series, the relative frequency is p f N s m( ) ( ) ( / )π π= − +1 . Consequently, the permutation entropy (PE) for the time series is defined as
PE p pm
= −=∑ ( ) ln ( )!
π ππ 1
(2)
The maximum value of PE is log(m!), which means all permuta-tions have an equal probability. The minimum value of PE is zero, which indicates that the time series is very regular. In other words, the smaller is the value of PE, the more regular are the time series.
Dimensionality Reduction
After feature extraction, LDA was used to reduce the dimension of feature vectors for alleviating computational complexity while preserving sufficient discriminative information in the subsequent classification stage.
Linear discriminant analysis23 is a supervised learning algo-rithm that takes the class label information into account. Given
Figure 1. Representative examples of 19-channel (from Fp1 to Pz) EEG recordings, where I, II, and III denote the EEG epochs during seizure-free, preseizure, and seizure intervals, respectively.
at UNIV OF SAN DIEGO on September 30, 2014eeg.sagepub.comDownloaded from
4 Clinical EEG and Neuroscience
a set of labeled training examples, it aims at separating the examples from different classes far away while keeping the examples within the same class close to each other. LDA is one of the most classical linear subspace methods that projects original higher dimensional data points
xin∈ℜ 1 ≤ j ≤ N / s to
a lower dimensional space through a linear transformation.Each feature vector can be considered as a point in the fea-
ture space. Given that the original high-dimensional data points X x x xN= { }
1 2, ,..., in ℜn belong to c classes, the between-class scatter matrix S
b and the within-class scatter matrix S
w are
given by
SN
N m m m m
SN
x m x m
b i i i
T
i
c
w i j i i j i
T
= −( ) −( )
= −( ) −( )=∑
1
11
,
; ;jj
Ni
i
c
==∑∑11
(3)
where in the i-th class, Ni is the number of data points,
xi j; represents the jth example, and m N xi i i jj
ni= ( )∑ =1 1
; is the mean value; N Nii
c= =∑ 1 is the number of all training examples; and
m N xi jj
Ni
i
c= ( ) == ∑∑1 11
; is the mean vector of the whole input data.
The formulation of LDA is to maximize the ratio between Sb
and Sw in the projected low-dimensional subspace:
UU S U
U S Uopt
U
Tb
Tw
= argmax . (4)
The generalized eigenvalue problem is S U S Ub w= λ , and the resulted lower dimensional subspace is spanned by U u u uL= { }
1 2, ,..., ( L c≤ −1 ). Herein, the covariance matrix of all training examples is S N x m x m S St i j i j
T
j
ni
i
cb w= ( ) −( ) −( ) = +== ∑∑1 11
; ; , which is also called the total-class scatter matrix.
Relevance Feedback
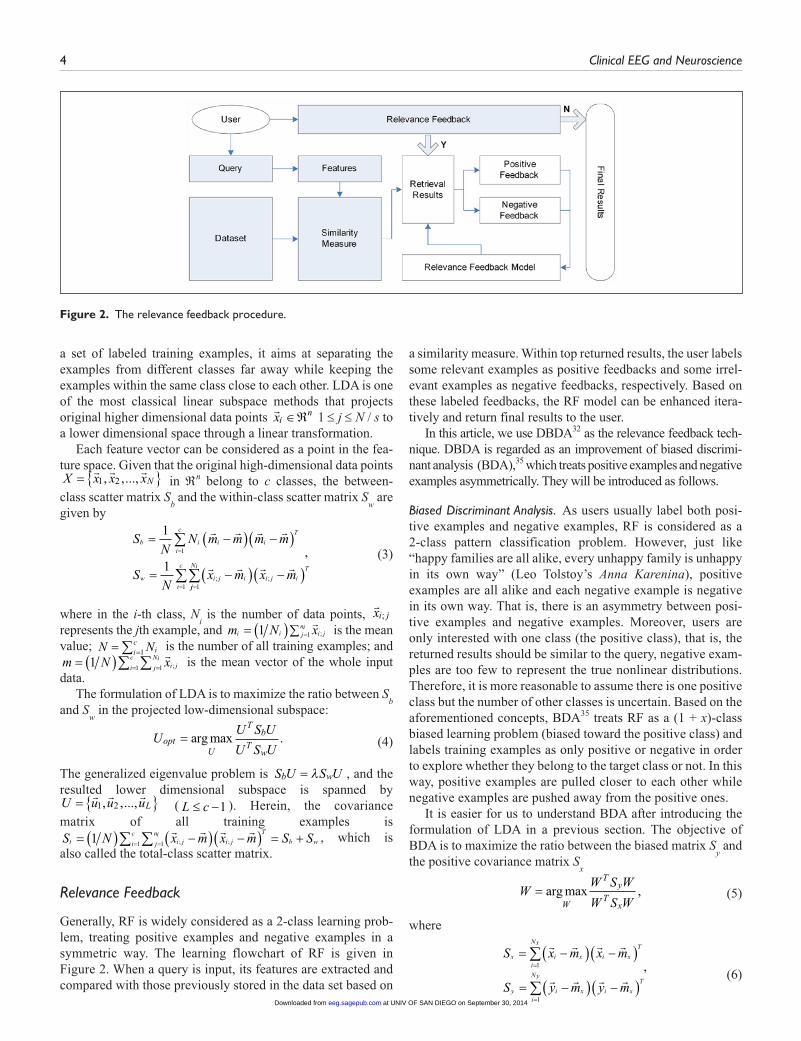
Generally, RF is widely considered as a 2-class learning prob-lem, treating positive examples and negative examples in a symmetric way. The learning flowchart of RF is given in Figure 2. When a query is input, its features are extracted and compared with those previously stored in the data set based on
a similarity measure. Within top returned results, the user labels some relevant examples as positive feedbacks and some irrel-evant examples as negative feedbacks, respectively. Based on these labeled feedbacks, the RF model can be enhanced itera-tively and return final results to the user.
In this article, we use DBDA32 as the relevance feedback tech-nique. DBDA is regarded as an improvement of biased discrimi-nant analysis (BDA),35 which treats positive examples and negative examples asymmetrically. They will be introduced as follows.
Biased Discriminant Analysis. As users usually label both posi-tive examples and negative examples, RF is considered as a 2-class pattern classification problem. However, just like “happy families are all alike, every unhappy family is unhappy in its own way” (Leo Tolstoy’s Anna Karenina), positive examples are all alike and each negative example is negative in its own way. That is, there is an asymmetry between posi-tive examples and negative examples. Moreover, users are only interested with one class (the positive class), that is, the returned results should be similar to the query, negative exam-ples are too few to represent the true nonlinear distributions. Therefore, it is more reasonable to assume there is one positive class but the number of other classes is uncertain. Based on the aforementioned concepts, BDA35 treats RF as a (1 + x)-class biased learning problem (biased toward the positive class) and labels training examples as only positive or negative in order to explore whether they belong to the target class or not. In this way, positive examples are pulled closer to each other while negative examples are pushed away from the positive ones.
It is easier for us to understand BDA after introducing the formulation of LDA in a previous section. The objective of BDA is to maximize the ratio between the biased matrix S
y and
the positive covariance matrix Sx
WW S W
W S WW
Ty
Tx
= argmax , (5)
where
S x m x m
S y m y m
x i x i x
T
i
Nx
y i x i x
T
i
Ny
= −( ) −( )
= −( ) −( )=
=
∑
∑
1
1
, (6)
Figure 2. The relevance feedback procedure.
at UNIV OF SAN DIEGO on September 30, 2014eeg.sagepub.comDownloaded from
Li et al 5
given that
xi belongs to the positive class,
yi denotes the neg-ative examples. Herein, N
x is the number of positive examples,
Ny is the number of negative examples, and
m N xx x ii
Nx= ( ) =∑1 1
is the mean vector of the positive examples. To obtain W, we can compute the eigenvectors of S Sx y
−1 .
Direct Biased Discriminant Analysis. DBDA,32 which is regarded as an enhanced BDA, adopts the same idea as direct LDA.36 In DBDA, it is assumed that the null space of S
y contains no impor-
tant information for discriminating different classes and the dis-criminant vectors are restricted in the subspace spanned by class centers. Therefore, the formulation of DBDA is obtained by first diagonalizing S
y and then removing its null space
Y S Y DTy y= 0 (7)
Here, Dy comprises the corresponding nonzero eigenvalues of
Sy and Y comprises the eigenvectors. Then, S
x is transformed to
K D Y S YDx yT
x y=− −1
2
1
2 , (8)
where Kx is diagonalized by eigenanalysis:
U K U DTx x= . (9)
The BDA transformation matrix is defined as
W YD UDy x=
− −1
2
1
2 . (10)
Adaptive Neuro-Fuzzy Inference System
To compare the accuracy of classification between the proposed rel-evance feedback scheme and some traditional methods, the Adaptive Neuro-Fuzzy Inference System (ANFIS)37 is also adopted to evaluate the ability and effectiveness of the MPE measures in classifying different seizure phases. The ANFIS learns features in the data set and adjusts the system parameters according to a given error criterion. For more details please refer to Jang.37 To improve the generalization, 3 ANFIS classifiers are trained with the back-propagation gradient descent method in combination with the least squares method when the calculated MPE measures are used as input. Each of the ANFIS classifier is trained so that they are likely to be more accurate for one state of EEG signals than the other states. The samples with target outputs, seizure-free (data set I), pre-seizure (data set II), and seizure (data set III) phases are given the binary target values of (0, 0, 1), (0, 1, 0), and (1, 0, 0), respectively. Each ANFIS classifier is implemented using the MATLAB soft-ware package (MATLAB version 7.0 with fuzzy logic toolbox).
Experimental Results
Multiscale Permutation Entropy Measure of EEG Data
The MPE measure was applied to analyze all 6384 two-second EEG epochs in this study (112 × 19-channel from each data set
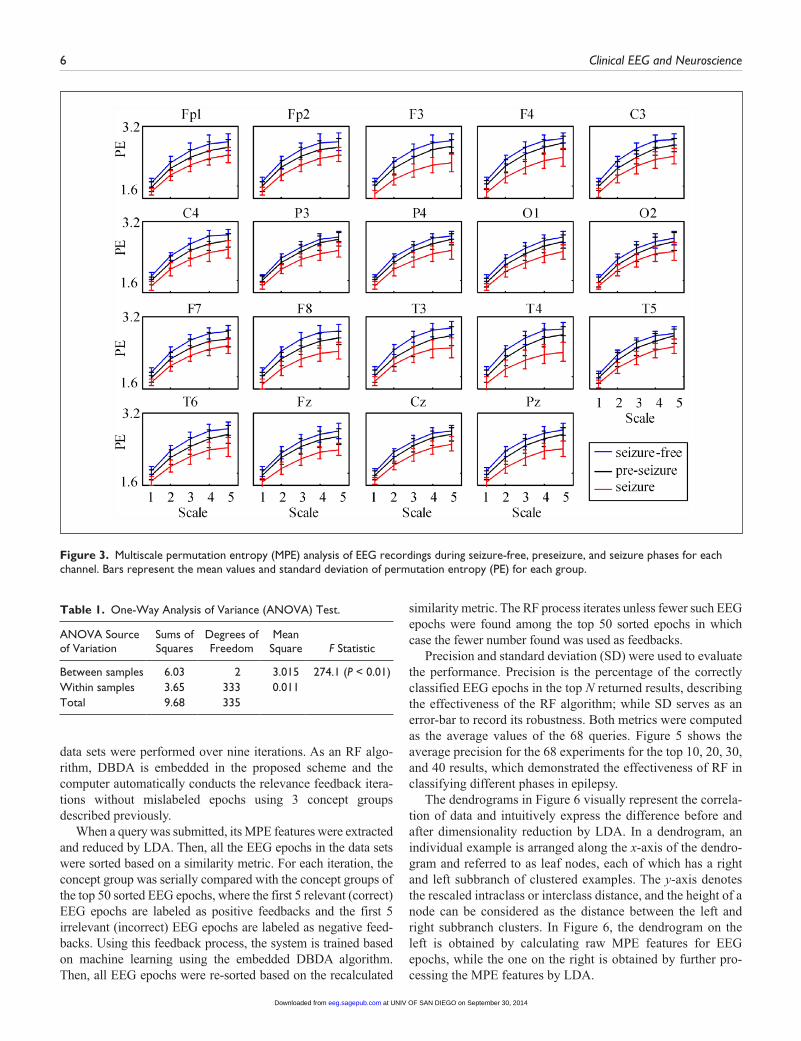
I, II, and III). Scale 1 (ie, s = 1) is the only scale considered by traditional single-scale-based methods. For example, the per-mutation entropy values for EEG segments of channel F3 were averaged at 1.694 ± 0.092 in the seizure-free phase, 1.569 ± 0.116 in the preseizure phase, and 1.369 ± 0.105 in the seizure phase, respectively. That is, the entropy values in seizure-free and preseizure phases are larger than those in the seizure phase. We computed MPE at 5 scales with similar results of permuta-tion entropy measures obtained for the other 4 scales. For all EEG epochs from 19 channels, the mean permutation entropy values of EEG were plotted by subgroups, as shown in Figure 3.
Next, to investigate whether their distributions over the three states are significantly different, the 1-way analysis of variance test is used for calculating entropy values on each scale and each channel, respectively. As calculated, the critical value is F
crit(2,
333) = 4.67 at α = 0.01. At this point, the test statistic must exceed to reject the null hypothesis. For example, the results of the MPE at scale 1 from channel F3 are shown in Table 1. It can be seen that the statistical test yields an F statistic (F = 274.1) that is much higher than the threshold F
crit. This suggests the null
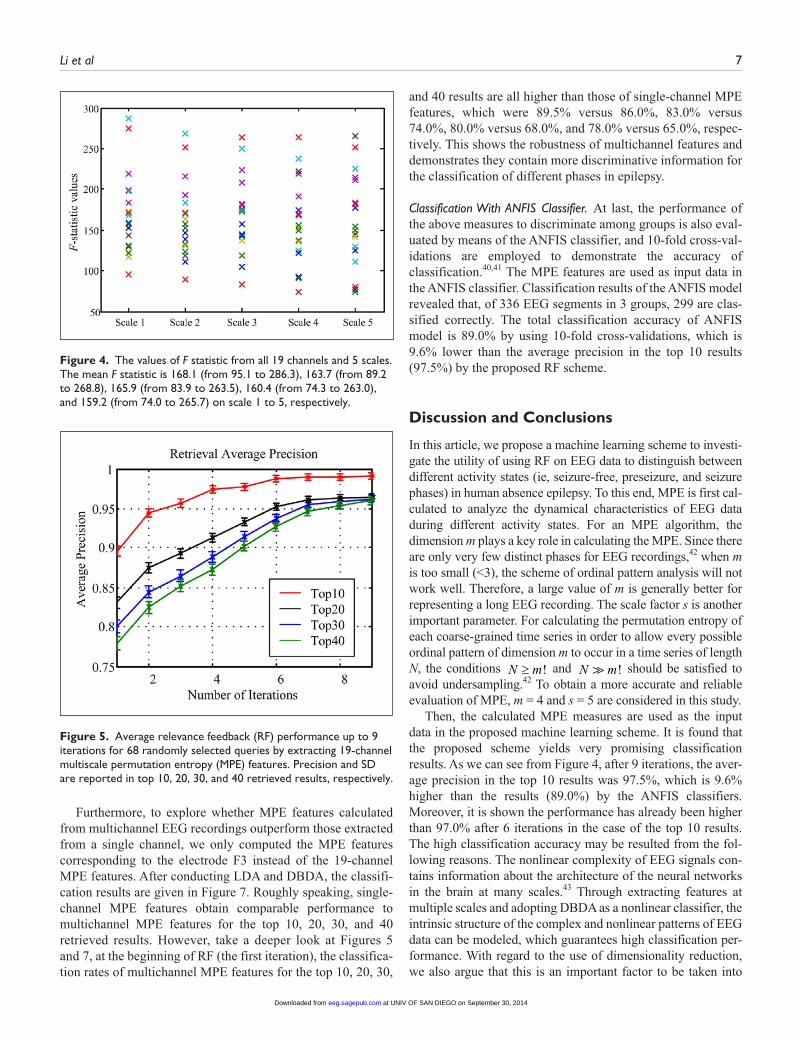
hypothesis, that is, no differences between these 3 different groups, should be rejected. The results of F statistic from all 19 channels and 5 scales are shown in Figure 4. It can be seen that, on all 19 channels and 5 scales, the values of F statistic (x) are much higher than the threshold F
crit. Therefore, the differences between
3 different EEG epochs are significant at the 1% significance level for each channel and each scale. However, there is consid-erable overlap between the permutation entropy values in sei-zure-free, preseizure, and seizure phases, so it is difficult to use the permutation entropy itself directly for classification. To dis-tinguish the changes in EEG during preseizure phase, a further step (classification) is needed to ensure the performance.
Classification
In this section, we carried out a series of statistical experiments to explore the utility of using RF on EEG data to distinguish between different activity states in human absence epilepsy. For each data set, 112 19-channel EEG epochs from 10 patients were extracted at 5 different scales and each channel of the 112 samples was described by a 5-dimensional feature vector. Multiple scales may reveal information about neural connec-tivity that is diagnostically useful,21,38,39 and thus are more suitable for the phase-classification problem in epilepsy. Afterward, LDA was implemented for dimensionality reduc-tion. As the rank of the between-class scatter matrix is at most c − 1 (ie, c is the number of classes), the maximum number of eigenvectors with nonzero eigenvalues is c − 1. As a result, we represented each EEG epoch by a 2-dimensional feature vec-tor. Subsequently, RF was evaluated on data set I, data set II, and data set III with 3 concept groups, which are seizure-free, preseizure, and seizure phases, respectively.
Classification With Relevance Feedback Classifier. In this study, experiments with 68 different queries (ie, EEG epochs) from all
at UNIV OF SAN DIEGO on September 30, 2014eeg.sagepub.comDownloaded from
6 Clinical EEG and Neuroscience
data sets were performed over nine iterations. As an RF algo-rithm, DBDA is embedded in the proposed scheme and the computer automatically conducts the relevance feedback itera-tions without mislabeled epochs using 3 concept groups described previously.
When a query was submitted, its MPE features were extracted and reduced by LDA. Then, all the EEG epochs in the data sets were sorted based on a similarity metric. For each iteration, the concept group was serially compared with the concept groups of the top 50 sorted EEG epochs, where the first 5 relevant (correct) EEG epochs are labeled as positive feedbacks and the first 5 irrelevant (incorrect) EEG epochs are labeled as negative feed-backs. Using this feedback process, the system is trained based on machine learning using the embedded DBDA algorithm. Then, all EEG epochs were re-sorted based on the recalculated
similarity metric. The RF process iterates unless fewer such EEG epochs were found among the top 50 sorted epochs in which case the fewer number found was used as feedbacks.
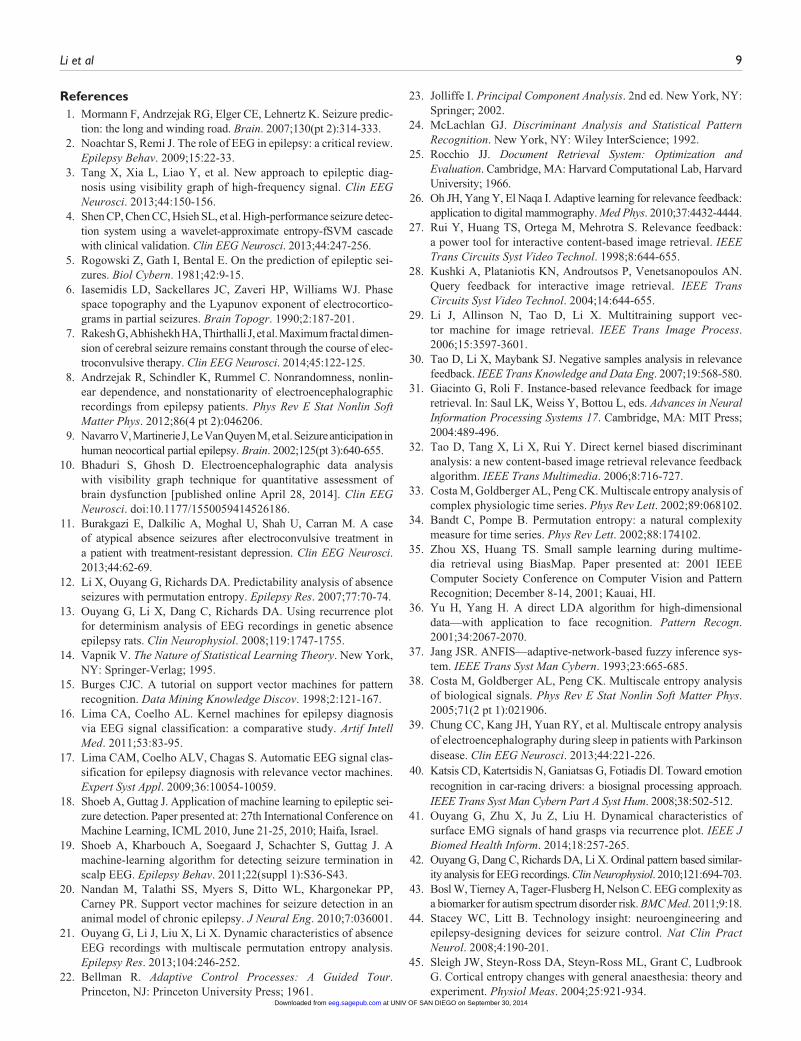
Precision and standard deviation (SD) were used to evaluate the performance. Precision is the percentage of the correctly classified EEG epochs in the top N returned results, describing the effectiveness of the RF algorithm; while SD serves as an error-bar to record its robustness. Both metrics were computed as the average values of the 68 queries. Figure 5 shows the average precision for the 68 experiments for the top 10, 20, 30, and 40 results, which demonstrated the effectiveness of RF in classifying different phases in epilepsy.
The dendrograms in Figure 6 visually represent the correla-tion of data and intuitively express the difference before and after dimensionality reduction by LDA. In a dendrogram, an individual example is arranged along the x-axis of the dendro-gram and referred to as leaf nodes, each of which has a right and left subbranch of clustered examples. The y-axis denotes the rescaled intraclass or interclass distance, and the height of a node can be considered as the distance between the left and right subbranch clusters. In Figure 6, the dendrogram on the left is obtained by calculating raw MPE features for EEG epochs, while the one on the right is obtained by further pro-cessing the MPE features by LDA.
Figure 3. Multiscale permutation entropy (MPE) analysis of EEG recordings during seizure-free, preseizure, and seizure phases for each channel. Bars represent the mean values and standard deviation of permutation entropy (PE) for each group.
Table 1. One-Way Analysis of Variance (ANOVA) Test.
ANOVA Source of Variation
Sums of Squares
Degrees of Freedom
Mean Square F Statistic
Between samples 6.03 2 3.015 274.1 (P < 0.01)Within samples 3.65 333 0.011 Total 9.68 335
at UNIV OF SAN DIEGO on September 30, 2014eeg.sagepub.comDownloaded from
Li et al 7
Furthermore, to explore whether MPE features calculated from multichannel EEG recordings outperform those extracted from a single channel, we only computed the MPE features corresponding to the electrode F3 instead of the 19-channel MPE features. After conducting LDA and DBDA, the classifi-cation results are given in Figure 7. Roughly speaking, single-channel MPE features obtain comparable performance to multichannel MPE features for the top 10, 20, 30, and 40 retrieved results. However, take a deeper look at Figures 5 and 7, at the beginning of RF (the first iteration), the classifica-tion rates of multichannel MPE features for the top 10, 20, 30,
and 40 results are all higher than those of single-channel MPE features, which were 89.5% versus 86.0%, 83.0% versus 74.0%, 80.0% versus 68.0%, and 78.0% versus 65.0%, respec-tively. This shows the robustness of multichannel features and demonstrates they contain more discriminative information for the classification of different phases in epilepsy.
Classification With ANFIS Classifier. At last, the performance of the above measures to discriminate among groups is also eval-uated by means of the ANFIS classifier, and 10-fold cross-val-idations are employed to demonstrate the accuracy of classification.40,41 The MPE features are used as input data in the ANFIS classifier. Classification results of the ANFIS model revealed that, of 336 EEG segments in 3 groups, 299 are clas-sified correctly. The total classification accuracy of ANFIS model is 89.0% by using 10-fold cross-validations, which is 9.6% lower than the average precision in the top 10 results (97.5%) by the proposed RF scheme.
Discussion and Conclusions
In this article, we propose a machine learning scheme to investi-gate the utility of using RF on EEG data to distinguish between different activity states (ie, seizure-free, preseizure, and seizure phases) in human absence epilepsy. To this end, MPE is first cal-culated to analyze the dynamical characteristics of EEG data during different activity states. For an MPE algorithm, the dimension m plays a key role in calculating the MPE. Since there are only very few distinct phases for EEG recordings,42 when m is too small (<3), the scheme of ordinal pattern analysis will not work well. Therefore, a large value of m is generally better for representing a long EEG recording. The scale factor s is another important parameter. For calculating the permutation entropy of each coarse-grained time series in order to allow every possible ordinal pattern of dimension m to occur in a time series of length N, the conditions N m≥ ! and N m ! should be satisfied to avoid undersampling.42 To obtain a more accurate and reliable evaluation of MPE, m = 4 and s = 5 are considered in this study.
Then, the calculated MPE measures are used as the input data in the proposed machine learning scheme. It is found that the proposed scheme yields very promising classification results. As we can see from Figure 4, after 9 iterations, the aver-age precision in the top 10 results was 97.5%, which is 9.6% higher than the results (89.0%) by the ANFIS classifiers. Moreover, it is shown the performance has already been higher than 97.0% after 6 iterations in the case of the top 10 results. The high classification accuracy may be resulted from the fol-lowing reasons. The nonlinear complexity of EEG signals con-tains information about the architecture of the neural networks in the brain at many scales.43 Through extracting features at multiple scales and adopting DBDA as a nonlinear classifier, the intrinsic structure of the complex and nonlinear patterns of EEG data can be modeled, which guarantees high classification per-formance. With regard to the use of dimensionality reduction, we also argue that this is an important factor to be taken into
Figure 4. The values of F statistic from all 19 channels and 5 scales. The mean F statistic is 168.1 (from 95.1 to 286.3), 163.7 (from 89.2 to 268.8), 165.9 (from 83.9 to 263.5), 160.4 (from 74.3 to 263.0), and 159.2 (from 74.0 to 265.7) on scale 1 to 5, respectively.
Figure 5. Average relevance feedback (RF) performance up to 9 iterations for 68 randomly selected queries by extracting 19-channel multiscale permutation entropy (MPE) features. Precision and SD are reported in top 10, 20, 30, and 40 retrieved results, respectively.
at UNIV OF SAN DIEGO on September 30, 2014eeg.sagepub.comDownloaded from

8 Clinical EEG and Neuroscience
account if compact representation is required to pursue. As we can see from Figure 6, the dendrogram of the original MPE fea-tures is in a mess and cannot reveal the true structures of these 3 data sets. On the contrary, after applying LDA on the calculated MPE features, the structures and the relationships among the data sets are much more clearly described.
Through the analysis of multichannel EEG data, experimen-tal results show that relevance feedback is effective for the classification task and EEG signals can serve as a useful tool for predicting seizure onset, which is consistent with the find-ing that EEG recordings provide supportive evidence and help in seizure classification.16,44 In summary, the findings in this study are the following:
1. RF outputs satisfactory results for distinguishing differ-ent seizure phases and should be potential for the future use in predicting human absence epilepsy.
2. Multichannel MPE features are more discriminative than single-channel MPE features for classifying differ-ent phases in absence epilepsy.
3. Instead of the traditional use of LDA as a classifier in epilepsy research, we use LDA as a dimensionality reduction method and found it is helpful to obtain com-pact feature representation, effective performance, and efficient computation.
The interactions between neurons play a crucial role in absence seizure generation, and EEG is a reasonable measure of the summed activity of approximately 1 to 100 million neu-rons lying in the vicinity of the recording electrodes.45 In our current work, EEG signals were collected according to a stan-dard international 10-20 electrode placement. As for future work, we will explore the effectiveness of electrodes selection in order to focus on prominent channels that carry possible effects of medication, and hence the features extracted from those channels are more discriminative. Additionally, we will enlarge the data sets by collecting more EEG recordings of dif-ferent age groups of epilepsy patients. Finally, the complexity difference among EEG data will be investigated.
Declaration of Conflicting InterestsThe author(s) declared no potential conflicts of interest with respect to the research, authorship, and/or publication of this article.
Funding
The author(s) disclosed receipt of the following financial support for the research, authorship, and/or publication of this article: This research was supported by National Natural Science Foundation of China (61025019, 61105027, and 81341042); Beijing Natural Science Foundation (4143063); Peking University People’s Hospital Research and Development Funds (RDB2010-16); and the Fundamental Research Funds for the Central Universities.
Figure 6. The dendrograms intuitively show the structures before and after dimensionality reduction by linear discriminant analysis (LDA).
Figure 7. Average relevance feedback (RF) performance up to 9 iterations for 68 randomly selected queries by extracting single-channel multiscale permutation entropy (MPE) features. Precision and SD are reported in top 10, 20, 30, and 40 retrieved results, respectively.
at UNIV OF SAN DIEGO on September 30, 2014eeg.sagepub.comDownloaded from
Li et al 9
References 1. Mormann F, Andrzejak RG, Elger CE, Lehnertz K. Seizure predic-
tion: the long and winding road. Brain. 2007;130(pt 2):314-333. 2. Noachtar S, Remi J. The role of EEG in epilepsy: a critical review.
Epilepsy Behav. 2009;15:22-33. 3. Tang X, Xia L, Liao Y, et al. New approach to epileptic diag-
nosis using visibility graph of high-frequency signal. Clin EEG Neurosci. 2013;44:150-156.
4. Shen CP, Chen CC, Hsieh SL, et al. High-performance seizure detec-tion system using a wavelet-approximate entropy-fSVM cascade with clinical validation. Clin EEG Neurosci. 2013;44:247-256.
5. Rogowski Z, Gath I, Bental E. On the prediction of epileptic sei-zures. Biol Cybern. 1981;42:9-15.
6. Iasemidis LD, Sackellares JC, Zaveri HP, Williams WJ. Phase space topography and the Lyapunov exponent of electrocortico-grams in partial seizures. Brain Topogr. 1990;2:187-201.
7. Rakesh G, Abhishekh HA, Thirthalli J, et al. Maximum fractal dimen-sion of cerebral seizure remains constant through the course of elec-troconvulsive therapy. Clin EEG Neurosci. 2014;45:122-125.
8. Andrzejak R, Schindler K, Rummel C. Nonrandomness, nonlin-ear dependence, and nonstationarity of electroencephalographic recordings from epilepsy patients. Phys Rev E Stat Nonlin Soft Matter Phys. 2012;86(4 pt 2):046206.
9. Navarro V, Martinerie J, Le Van Quyen M, et al. Seizure anticipation in human neocortical partial epilepsy. Brain. 2002;125(pt 3):640-655.
10. Bhaduri S, Ghosh D. Electroencephalographic data analysis with visibility graph technique for quantitative assessment of brain dysfunction [published online April 28, 2014]. Clin EEG Neurosci. doi:10.1177/1550059414526186.
11. Burakgazi E, Dalkilic A, Moghal U, Shah U, Carran M. A case of atypical absence seizures after electroconvulsive treatment in a patient with treatment-resistant depression. Clin EEG Neurosci. 2013;44:62-69.
12. Li X, Ouyang G, Richards DA. Predictability analysis of absence seizures with permutation entropy. Epilepsy Res. 2007;77:70-74.
13. Ouyang G, Li X, Dang C, Richards DA. Using recurrence plot for determinism analysis of EEG recordings in genetic absence epilepsy rats. Clin Neurophysiol. 2008;119:1747-1755.
14. Vapnik V. The Nature of Statistical Learning Theory. New York, NY: Springer-Verlag; 1995.
15. Burges CJC. A tutorial on support vector machines for pattern recognition. Data Mining Knowledge Discov. 1998;2:121-167.
16. Lima CA, Coelho AL. Kernel machines for epilepsy diagnosis via EEG signal classification: a comparative study. Artif Intell Med. 2011;53:83-95.
17. Lima CAM, Coelho ALV, Chagas S. Automatic EEG signal clas-sification for epilepsy diagnosis with relevance vector machines. Expert Syst Appl. 2009;36:10054-10059.
18. Shoeb A, Guttag J. Application of machine learning to epileptic sei-zure detection. Paper presented at: 27th International Conference on Machine Learning, ICML 2010, June 21-25, 2010; Haifa, Israel.
19. Shoeb A, Kharbouch A, Soegaard J, Schachter S, Guttag J. A machine-learning algorithm for detecting seizure termination in scalp EEG. Epilepsy Behav. 2011;22(suppl 1):S36-S43.
20. Nandan M, Talathi SS, Myers S, Ditto WL, Khargonekar PP, Carney PR. Support vector machines for seizure detection in an animal model of chronic epilepsy. J Neural Eng. 2010;7:036001.
21. Ouyang G, Li J, Liu X, Li X. Dynamic characteristics of absence EEG recordings with multiscale permutation entropy analysis. Epilepsy Res. 2013;104:246-252.
22. Bellman R. Adaptive Control Processes: A Guided Tour. Princeton, NJ: Princeton University Press; 1961.
23. Jolliffe I. Principal Component Analysis. 2nd ed. New York, NY: Springer; 2002.
24. McLachlan GJ. Discriminant Analysis and Statistical Pattern Recognition. New York, NY: Wiley InterScience; 1992.
25. Rocchio JJ. Document Retrieval System: Optimization and Evaluation. Cambridge, MA: Harvard Computational Lab, Harvard University; 1966.
26. Oh JH, Yang Y, El Naqa I. Adaptive learning for relevance feedback: application to digital mammography. Med Phys. 2010;37:4432-4444.
27. Rui Y, Huang TS, Ortega M, Mehrotra S. Relevance feedback: a power tool for interactive content-based image retrieval. IEEE Trans Circuits Syst Video Technol. 1998;8:644-655.
28. Kushki A, Plataniotis KN, Androutsos P, Venetsanopoulos AN. Query feedback for interactive image retrieval. IEEE Trans Circuits Syst Video Technol. 2004;14:644-655.
29. Li J, Allinson N, Tao D, Li X. Multitraining support vec-tor machine for image retrieval. IEEE Trans Image Process. 2006;15:3597-3601.
30. Tao D, Li X, Maybank SJ. Negative samples analysis in relevance feedback. IEEE Trans Knowledge and Data Eng. 2007;19:568-580.
31. Giacinto G, Roli F. Instance-based relevance feedback for image retrieval. In: Saul LK, Weiss Y, Bottou L, eds. Advances in Neural Information Processing Systems 17. Cambridge, MA: MIT Press; 2004:489-496.
32. Tao D, Tang X, Li X, Rui Y. Direct kernel biased discriminant analysis: a new content-based image retrieval relevance feedback algorithm. IEEE Trans Multimedia. 2006;8:716-727.
33. Costa M, Goldberger AL, Peng CK. Multiscale entropy analysis of complex physiologic time series. Phys Rev Lett. 2002;89:068102.
34. Bandt C, Pompe B. Permutation entropy: a natural complexity measure for time series. Phys Rev Lett. 2002;88:174102.
35. Zhou XS, Huang TS. Small sample learning during multime-dia retrieval using BiasMap. Paper presented at: 2001 IEEE Computer Society Conference on Computer Vision and Pattern Recognition; December 8-14, 2001; Kauai, HI.
36. Yu H, Yang H. A direct LDA algorithm for high-dimensional data—with application to face recognition. Pattern Recogn. 2001;34:2067-2070.
37. Jang JSR. ANFIS—adaptive-network-based fuzzy inference sys-tem. IEEE Trans Syst Man Cybern. 1993;23:665-685.
38. Costa M, Goldberger AL, Peng CK. Multiscale entropy analysis of biological signals. Phys Rev E Stat Nonlin Soft Matter Phys. 2005;71(2 pt 1):021906.
39. Chung CC, Kang JH, Yuan RY, et al. Multiscale entropy analysis of electroencephalography during sleep in patients with Parkinson disease. Clin EEG Neurosci. 2013;44:221-226.
40. Katsis CD, Katertsidis N, Ganiatsas G, Fotiadis DI. Toward emotion recognition in car-racing drivers: a biosignal processing approach. IEEE Trans Syst Man Cybern Part A Syst Hum. 2008;38:502-512.
41. Ouyang G, Zhu X, Ju Z, Liu H. Dynamical characteristics of surface EMG signals of hand grasps via recurrence plot. IEEE J Biomed Health Inform. 2014;18:257-265.
42. Ouyang G, Dang C, Richards DA, Li X. Ordinal pattern based similar-ity analysis for EEG recordings. Clin Neurophysiol. 2010;121:694-703.
43. Bosl W, Tierney A, Tager-Flusberg H, Nelson C. EEG complexity as a biomarker for autism spectrum disorder risk. BMC Med. 2011;9:18.
44. Stacey WC, Litt B. Technology insight: neuroengineering and epilepsy-designing devices for seizure control. Nat Clin Pract Neurol. 2008;4:190-201.
45. Sleigh JW, Steyn-Ross DA, Steyn-Ross ML, Grant C, Ludbrook G. Cortical entropy changes with general anaesthesia: theory and experiment. Physiol Meas. 2004;25:921-934.
at UNIV OF SAN DIEGO on September 30, 2014eeg.sagepub.comDownloaded from
Top Related