


Languages
Pages
Legal

Climate Change Impacts on Water Resources in
Prok VDC of Manaslu Conservation Area, Gorkha, Nepal
A dissertation prepared for the partial fulfillment of the requirement for the
completion of Master’s Degree in Environmental Science
Submitted to
Central Department of Environmental Science
Tribhuvan University
Kirtipur, Kathmandu, Nepal
Submitted by
Ram Maya Shrestha
T.U. Reg. No: 5-1-33-420-2001
Symbol No: 6413
July, 2013

i
TRIBHUVAN UNIVERSITY
CENTRAL DEPARTMENT OF ENVIRONMENTAL SCIENCE
Kirtipur, Kathmandu
LETTER OF RECOMMENDATION
We hereby certify that this dissertation entitled “Climate Change Impacts on Water
Resources in Prok VDC of Manaslu Conservation Area, Gorkha, Nepal” submitted
to the Central Department of Environmental Science for partial fulfillment of Master’s
Degree in Environmental Science by Ms. Ram Maya Shrestha is based on scientific
investigations carried out by her under our supervision.
Supervisors
………………………… …………………………..
Asst. Prof. Ramesh Prasad Sapkota Mrs. Tista Prasai Joshi
Central Department of Environmental Science Scientific Officer
Tribhuvan University Nepal Academy of Science and
Kirtipur, Kathmandu Technology, Lalitpur
Date: 14/06/2013
ii
TRIBHUVAN UNIVERSITY
CENTRAL DEPARTMENT OF ENVIRONMENTAL SCIENCE
Kirtipur, Kathmandu
LETTER OF APPROVAL
We hereby certify that this dissertation entitled “Climate Change Impacts on Water
Resources in Prok VDC of Manaslu Conservation Area, Gorkha, Nepal” submitted
by Ms. Ram Maya Shrestha to the Central Department of Environmental Science has
been accepted as requirement for partial fulfillment of Master’s Degree in
Environmental Science.
Evaluation Committee
……………………………
Prof. Kedar Rijal, Ph.D
Head of Department
Central Department of Environmental Science
Tribhuvan University
………………………………. …………………………………
Asst. Prof. Ramesh Prasad Sapkota Prof. Lochan Prasad Devkota Ph.D
Supervisor External Examiner
Central Department of Environmental Science Central Department of Hydrology and
Tribhuvan University, Kirtipur Meteorology, Tribhuvan University
…………………………………. …………………………………
Mrs. Tista Prasai Joshi Prof. Madan Koirala Ph.D
Supervisor Internal Examiner
Scientific Officer Central Department of Environmental
Nepal Academy of Science & Technology Science, Tribhuvan University
Date: 05/07/2013
iii
DECLARATION
I hereby declare that this dissertation entitled “Climate Change Impacts on Water
Resources in Prok VDC of Manaslu Conservation Area, Gorkha, Nepal” is my own
work and all other sources of information used, have been duly acknowledged. This
work has not been published or submitted for any award.
….………………
Ram Maya Shrestha
Central Department of Environmental Science
Tribhuvan University, Kirtipur
Kathmandu, Nepal
iv
Acknowledgements
I would like to express my sincere gratitude to my supervisors Asst. Prof. Ramesh
Prasad Sapkota and Mrs. Tista Prasai Joshi for their continuous guidance, suggestion
and inspiration, without whom, this research wouldn’t take in this shape. I would like to
acknowledge my mentor Mr. Carl Jackson for his suggestion, online mentoring and
invitation for joining to Eldis community.
I am indebted to Prof. Dr. Kedar Rijal, Head of Central Department of Environmental
Science for his words of encouragement and support for conducting the research. I am
grateful to Dr. Dinesh Raj Bhuju, Acamedician of Nepal Academy of Science and
Technology for his valuable comment and suggestion to perform better research. I
would also like to acknowledge Dr. Sujan Lal Shrestha for his guidance during the lab
work. Thanks to Mr. Pawan Neupane for his support on field visit.
I am thankful to my research colleagues Ms. Anju Rana and Mr. Niranjan Phuyal for
their help during the visit to Manaslu Conservation Area. Field assistance provided by
Mr. Dorje Thakuri Lama and Ms. Sanmo Lama is acknowledged. Thanks to my friends
Ms. Nisha Balmiki and Mr. Yubraj Banjade for preparing the map of study area. I
would like to thank my friends Mr. Birendra Gautam, Mrs. Meena Barakoti, Ms.
Sushila Shrestha and Ms. Yashoda Poudel for their moral support. Thanks to the staff of
Nepal Academy of Science and Technology, Central Department of Environmental
Science, Manaslu Conservation Area Project, Philim and Locals of Prok VDC. Last but
not the least, I express my deep sense of gratitude to my parents, family members and
relatives for their moral support in carrying out this study.
This research was supported by NCCKMC/NAST-CDKN project.
Ram Maya Shrestha
July, 2013
v
Abstract Nepal’s temperature is rising faster than the global average, and rainfall is becoming
unpredictable. Water resource is projected to become one of the most pressing
environmental problems with high impacts from climate change in hills and mountains
of Nepal. Drying up of water sources is likely due to dry seasons, irregular rains, and
high intensity rainfall leading to high run-off and less infiltration. Rural communities in
hills and mountains of Nepal are experiencing the impact on water resource due to
climate change. The study was done to identify the climate change impacts on water
resources in Prok VDC of Manaslu Conservation Area, Gorkha, Nepal. The major
elements of this methodology include the use of primary and secondary data, household
questionnaire survey, focus group discussion, key informant interviews and field
observations. Temperature, rainfall and discharge of thirty years data of the nearest
hydro-meteorological station and non-climatic indicators based on community
perceptions of climate variability were documented to assess climatic variability
scenario. The climatic data interpretation showed that temperature has increased whereas
trend of rainfall and discharge has decreased and non climatic indicators on community’s
perception also illustrated on climatic variability in the area. Drying up of the water
resources was the major impact of climate change and decreased in water volume in
stream and river of the study area. Decrease in water sources caused problems for the
water availability and adverse effects on agricultural production, human health and
biodiversity of the area.
The Physico-chemical and microbiological analysis of water samples were taken from
stream, tap and reservoir from the Prok VDC of Manaslu Conservation Area. The
physical and chemical analysis includes the determination of pH, temperature, turbidity,
conductivity, chloride, free carbondioxide, hardness, alkalinity, iron, nitrate and
ammonia using standard methods. Microbiological analysis was done by assessing the
total coliforms from membrane filtration method. The physico-chemical qualities of
these samples make them good and fit for drinking. But the microbial analysis was
found to be the presence of total coliform in all water samples and revealed that climate
change might be responsible for degrading situation of water quality due to increasing
temperature and precipitation variability in the study area.
Key words: Climate change, Water quality, Water resources
vi
Table of Contents
LETTER OF RECOMMENDATION ........................................................................... i
LETTER OF APPROVAL ........................................................................................... ii
DECLARATION .........................................................................................................iii
Acknowledgements ...................................................................................................... iv
Abstract ......................................................................................................................... v
Table of Contents ......................................................................................................... vi
List of Figures .............................................................................................................. ix
List of Tables ................................................................................................................ x
Acronyms and Abbreviations ...................................................................................... xi
CHAPTER I: INTRODUCTION .................................................................................. 1
1.1 Background .............................................................................................................. 1
1.2 Statement of Problem .............................................................................................. 4
1.3 Research Questions ................................................................................................. 4
1.4 Objectives ................................................................................................................ 4
1.5 Scope and Limitations of the Study ......................................................................... 5
CHAPTER II: LITERATURE REVIEW ..................................................................... 6
2.1 Global Climate Change ........................................................................................... 6
2.2 Climate Change in Nepal ......................................................................................... 6
2.3 Impact on Water Resources ..................................................................................... 8
2.3.1 Impact on Water Availability ........................................................................... 8
2.3.2 Impact on River Discharge .............................................................................. 8
2.3.3 Impact on Snow and Glacier ............................................................................ 9
2.3.4 Impact on Agriculture ...................................................................................... 9
2.3.5 Impact on Biodiversity ................................................................................... 10

vii
2.3.6 Impact on Water Quality ................................................................................ 10
2.4 Study on Physico-chemical and Microbial quality of water in Nepal ................... 11
CHAPTER III: STUDY AREA .................................................................................. 13
3.1 Study Area ............................................................................................................. 13
3.1.1 Location of Study Area .................................................................................. 13
3.1.2 Climate ........................................................................................................... 14
3.1.3 Ecology .......................................................................................................... 14
CHAPTER IV: MATERIALS AND METHODS ...................................................... 15
4.1 Research Design .................................................................................................... 15
4.2 Sample Design ....................................................................................................... 16
4.3 Methods of Data Collection ................................................................................... 16
4.3.1 Primary Data Collection ................................................................................. 16
4.3.2 Secondary Data Collection ............................................................................. 16
4.4 Methods for Drinking Water Quality .................................................................... 17
4.4.1 Water Sample Collection ............................................................................... 17
4.4.2 Physico-chemical Analysis of Drinking Water .............................................. 18
4.4.3 Microbiological Analysis of Drinking Water ................................................ 22
4.5 Data Analysis ......................................................................................................... 22
5.1 Temperature ........................................................................................................... 23
5.2 Rainfall .................................................................................................................. 28
5.3 Discharge of Budhi Gandaki River ....................................................................... 33
5.4 General Information about the Respondents ......................................................... 38
5.5.1 Temperature ................................................................................................... 39
5.5.2 Rainfall Pattern .............................................................................................. 40
5.5.3 Snowfall ......................................................................................................... 42
5.5.4 Perception on Climatic Hazards in the Area .................................................. 42
5.5.5 Understanding of Change in Water Resources .............................................. 43
viii
5.6 Impacts of Climate Change ................................................................................... 44
5.6.1 Water Resources ............................................................................................ 45
5.7 Water Quality Analysis ......................................................................................... 49
5.7.1 Physical and Chemical Quality of Water ....................................................... 49
5.7.2 Bacteriological Quality of Water ................................................................... 56
CHAPTER VI: DISCUSSION ................................................................................... 57
6.1 Trend of Climatic Variables .................................................................................. 57
6.1.1 Trend of Temperature .................................................................................... 57
6.1.2 Rainfall Trend ................................................................................................ 58
6.1.3 Discharge ....................................................................................................... 58
6.2 Impact of Climate Change ..................................................................................... 59
6.2.1 Impact on Water Resources ........................................................................... 59
6.2.3 Impact on Human Health ............................................................................... 60
6.2.4 Impact on Biodiversity ................................................................................... 60
6.3 Water Quality ........................................................................................................ 60
CHAPTER VII: CONCLUSION AND RECOMMENDATIONS ............................ 64
7.1 Conclusion ............................................................................................................. 64
7.2 Recommendations ................................................................................................. 65
References ................................................................................................................... 66
ANNEXES ..................................................................................................................... i
Annex I: Questionnaire ................................................................................................. i
Annex II: Climatic Data ................................................................................................ v
Annex III: Results of Water Quality Analysis ...........................................................xiii
Annex IV: Methods and Instruments used for Water Quality Analysis .................... xvi
Annex V: Photo Plates .............................................................................................. xvii
ix
List of Figures
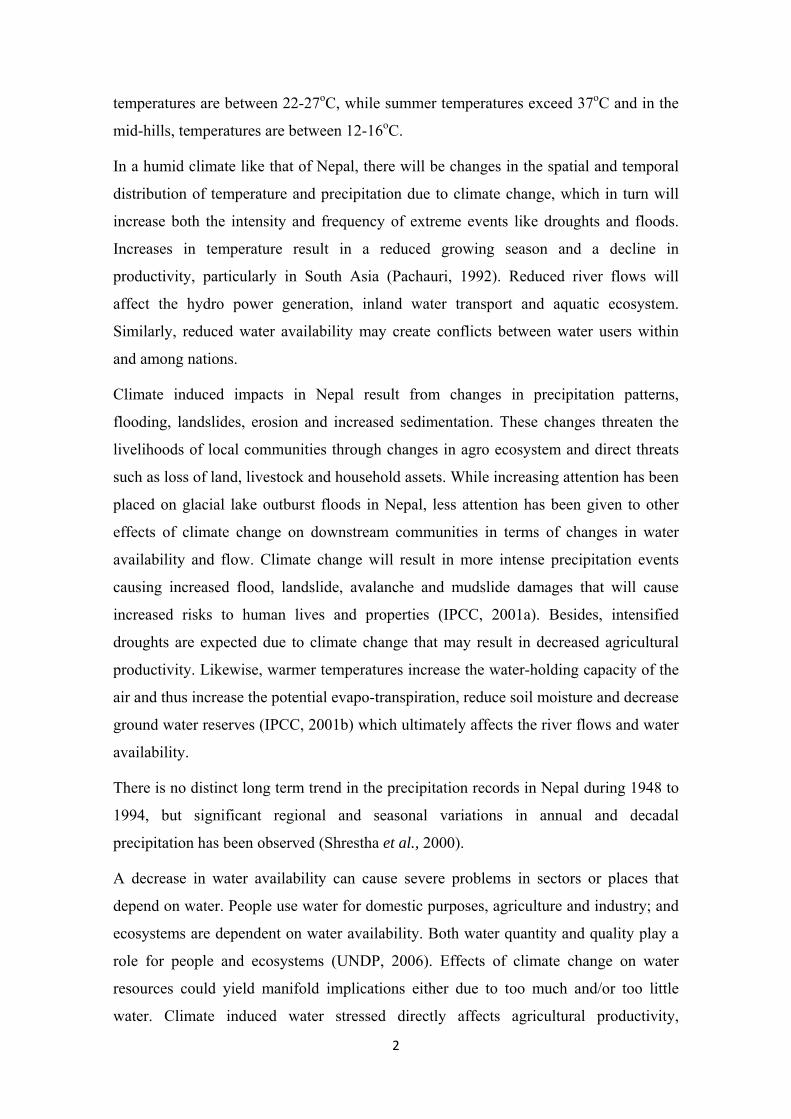
Figure 1: Map of study area .......................................................................................... 13
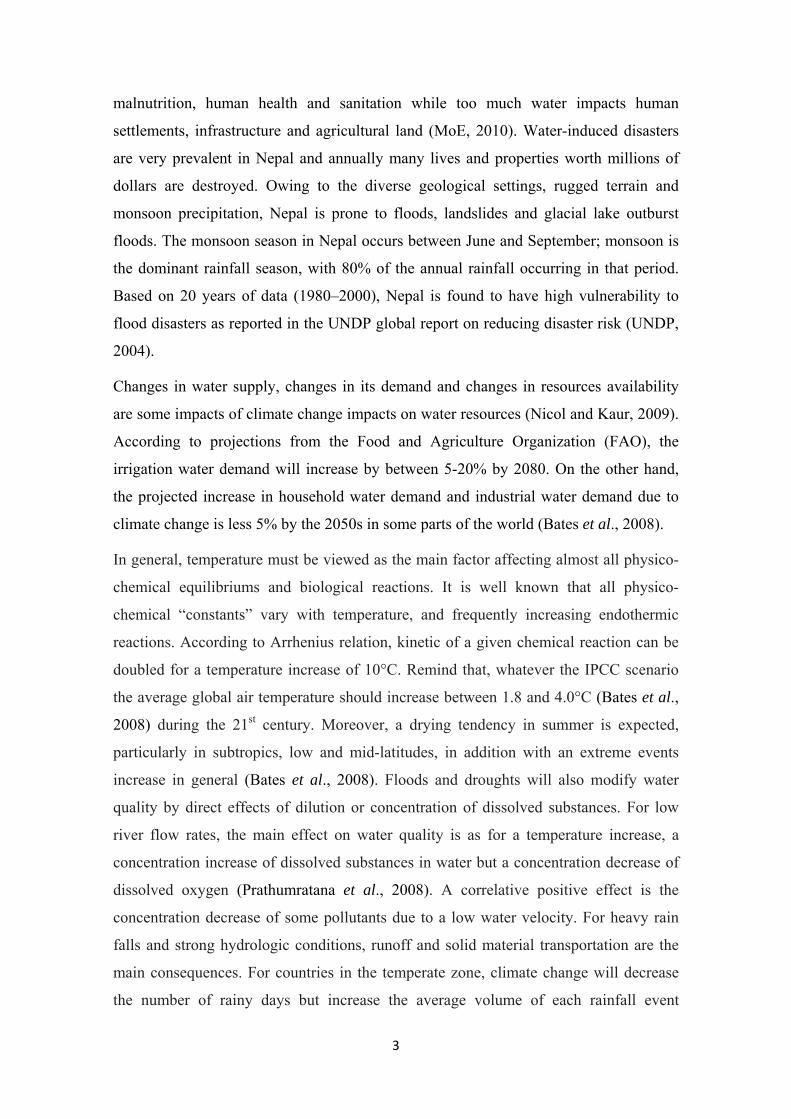
Figure 2: Graph showing seasonal variation of average rainfall (mm) and temperature
(oC) of Gorkha station. ................................................................................................... 14
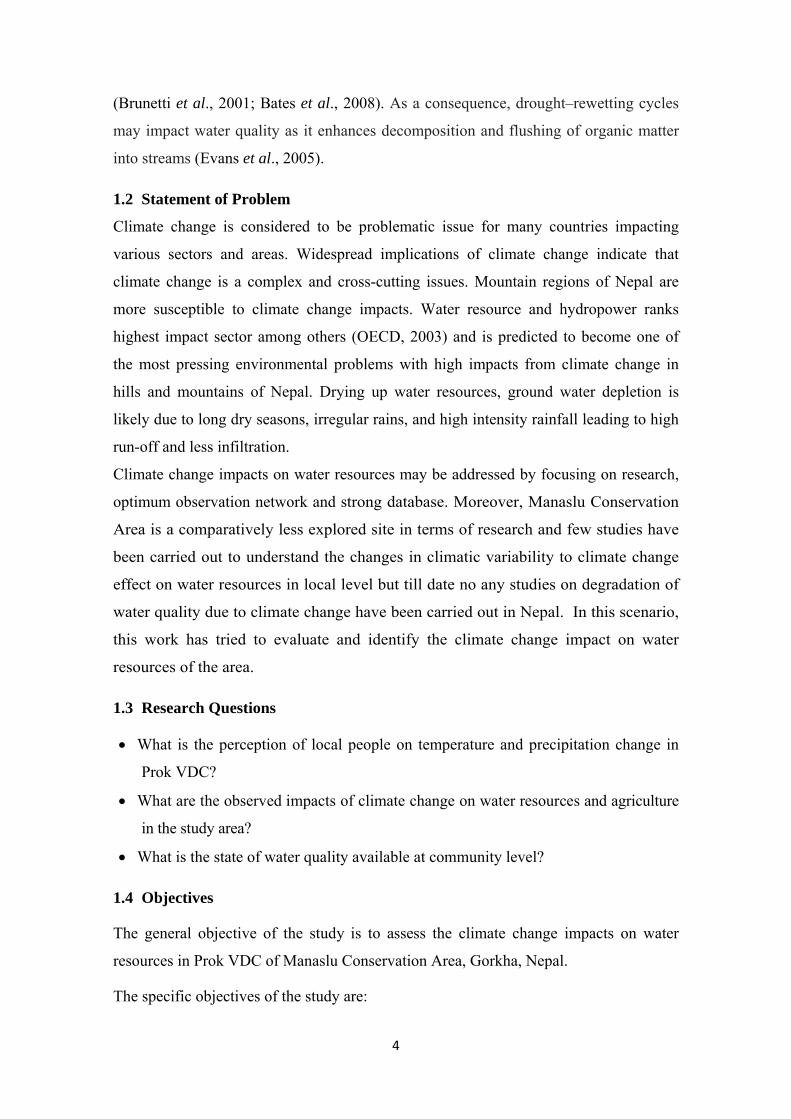
Figure 3: Research Design............................................................................................. 15
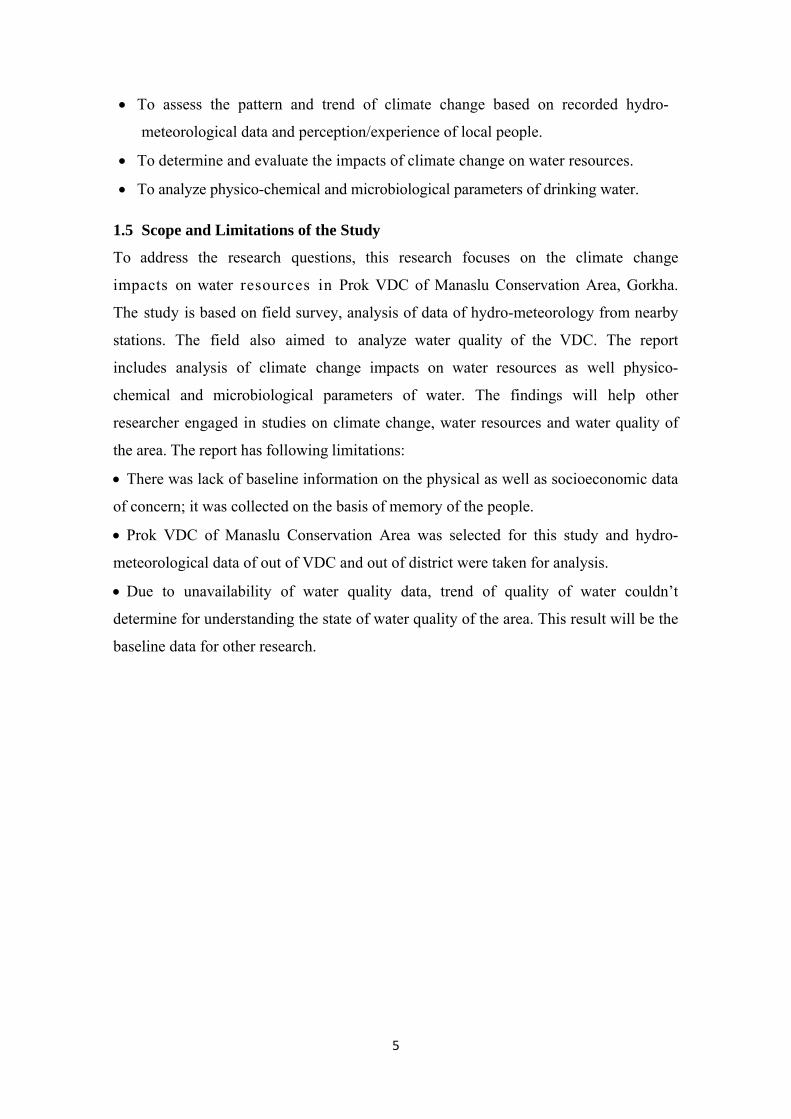
Figure 4: Annual maximum temperature and its trend .................................................. 23
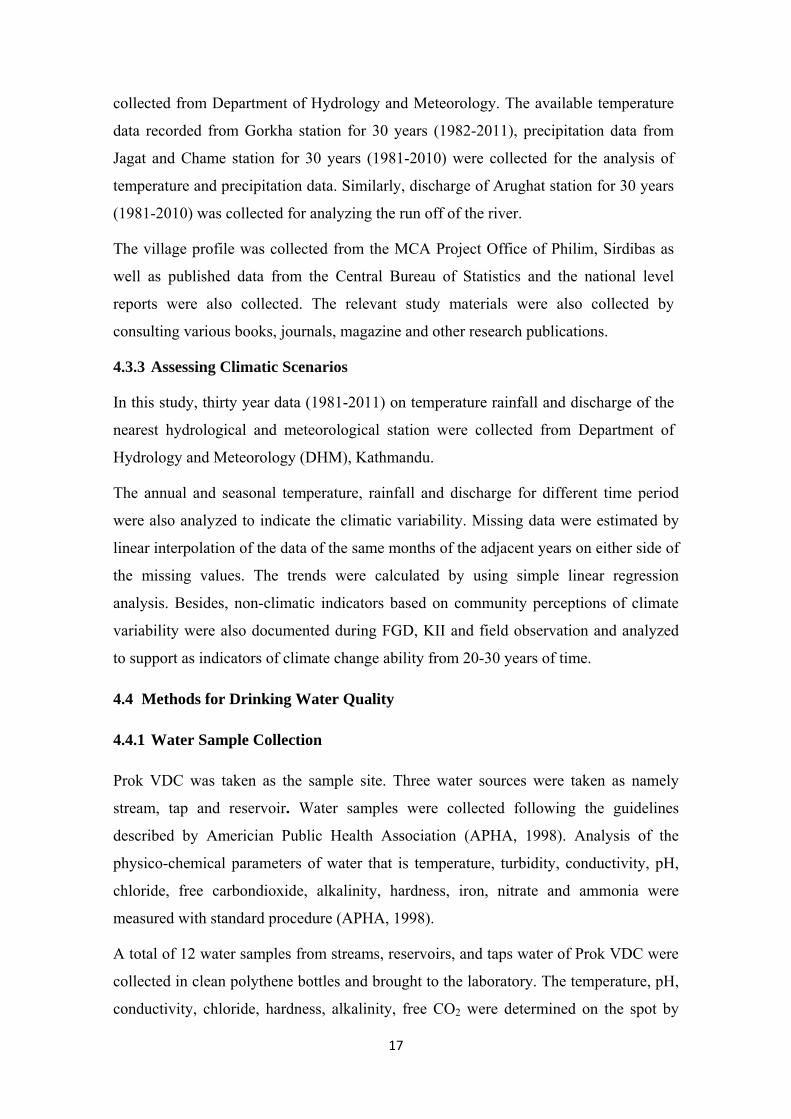
Figure 5: Average seasonal maximum temperature of Gorkha station. a) Pre-
monsoonb) Monsoon c) Post-monsoon d) Winter. ......................................................... 24
Figure 6: Annual mean temperature with trend ............................................................. 25
Figure 7: Mean temperature trend a) Pre-monsoon b) Monsoon c) Post-monsoon d)
Winter season ................................................................................................................. 26
Figure 8: Annual minimum temperature with trend ...................................................... 27
Figure 9: Minimum temperature with trend a) Pre-monsoon b) Monsoon c) Post-
monsoon d) Winter season ............................................................................................. 28
Figure 10: Average annual rainfall of Jagat with trend line .......................................... 29
Figure 11: Seasonal rainfall graph with trend line a) Pre-monsoon b) Monsoon c) Post-
monsoon d) Winter. ........................................................................................................ 30
Figure 12: Rainfall during three decades for Jagat ........................................................ 30
Figure 13: Annual average rainfall for Chame station .................................................. 31
Figure 14: Seasonal rainfall with trend of Chame station a) Pre-monsoon b) Monsoon
c) Post-monsoon d) Winter ............................................................................................. 32
Figure 15: Rainfall during three decades for Chame station ......................................... 33
Figure 16: Annual minimum discharge with trend at Arughat station .......................... 33
Figure 17: Seasonal minimum discharge with trend ..................................................... 34
Figure 18: Annual mean discharge with trend .............................................................. 35
Figure 19: Seasonal mean discharge with trend ............................................................ 36
Figure 20: Annual maximum discharge with trend ....................................................... 36
Figure 21: Seasonal maximum discharge with trend ................................................... 37
Figure 22: Percentage of respondent reporting the direction of change in winter
temperature ..................................................................................................................... 39
Figure 23: Percentage of people reporting in summer temperature .............................. 40
Figure 24: Perception of respondents regarding change in rainfall pattern ................... 41
Figure 25: Perception of respondents regarding change in amount of rain .................. 41
x
Figure 26: Perception of respondents regarding change in rainfall pattern in winter ... 42
Figure 27: Percentage of people reporting on climatic hazards .................................... 43
Figure 28: Perception of respondents regarding on change in water resources ............ 44
Figure 29: Impact on water resources ........................................................................... 45
Figure 30: Responses on impact of climate change on agricultural production. ........... 46
Figure 31: Responses regarding increase in diseases .................................................... 47
Figure 32: Responses regarding change in wildlife population .................................... 48
Figure 33: Temperature of stream, reservoir and tap water .......................................... 50
Figure 34: Conductivity of stream, reservoir and tap water .......................................... 51
Figure 35: Turbidity of stream, reservoir and tap water ................................................ 51
Figure 36: pH of stream, reservoir and tap water .......................................................... 52
Figure 37: Chloride of stream, reservoir and tap water ................................................. 52
Figure 38: Free CO2 of stream, reservoir and tap water ................................................ 53
Figure 39: Hardness of stream, reservoir and tap water ................................................ 53
Figure 40: Alkalinity in stream, reservoir and tap water ............................................... 54
Figure 41: Concentration of ammonia in stream, reservoir and tap water .................... 54
Figure 42: Concentration of iron in stream, reservoir and tap water ............................. 55
Figure 43: Concentration of nitrate of stream, reservoir and tap water ......................... 55
Figure 44: Total coliform in stream, reservoir and tap water ........................................ 56
List of Tables
Table 1: Priority ranking of climate change impacts for Nepal....................................... 8
Table 2: Social characteristics of the sampled respondents/HHs .................................. 38
Table 3: Average result of stream, reservoir and tap water quality ............................... 49
Table 4: The value of maximum, minimum, mean and S.D of measured parameters .. 50
Table 5: Range of Total coliform in stream, reservoir and tap water sample ............... 56
xi
Acronyms and Abbreviations oC Degree Celsius
% Percentage
ADB Asian Development Bank
APHA American Public Health Association
CBS Central Bureau of Statistics
CFU Colony Forming Unit
DHM Department of Hydrology and Meteorology
ENSO El Nino Southern Oscillation
FAO Food and Agriculture Organization
FGD Focus Group Discussion
GEN Glaciological Expedition in Nepal
GHGs Green House Gases
GIS Geographical Information System
ICIMOD International Centre for Integrated Mountain Development
IPCC Intergovernmental Panel on Climate Change
KII Key Informants Interview
MCA Manaslu Conservation Area
MF Membrane Filtration
MFSC Ministry of Forests and Soil Conservation
MoE Ministry of Environment
NAST Nepal Academy of Science and Technology
NDWQS National Drinking Water Quality Standard
MOPE Ministry of Population and Environment
NAPA National Adaptation Program of Action
NCVST Nepal Climate Vulnerability Study Team
xii
OECD Organization for Economic Co-operation and Development
SPSS Statistical Package for Social Science
UNDP United Nations Development Program
UNEP United Nations Environmental Program
UNFCCC United Nations Framework for Climate Change Convention
VDC Village Development Committee
WMO World Meteorological Organization

1
CHAPTER I: INTRODUCTION
1.1 Background
Climate change refers to the variations in the Earth’s global climate or in regional
climate over time. United Nation Framework for Climate Change Convention
(UNFCCC) defines it as “a change of climate which is attributed directly or indirectly to
human activity that alters the composition of the global atmosphere”. The
Intergovernmental panel on Climate Change (IPCC, 2007) concludes that increased
global temperature since the twentieth century is likely due to increased anthropogenic
Green House Gas (GHG) emissions from burning of fossil fuel and forest conversion.
The climate change is real and happening now. The planet is already experiencing its
impact on biodiversity, freshwater resources and local livelihood (WWF, 2006).
The World Meteorological Organization (WMO) reported that the global average
surface temperature has risen about 0.7°C since the beginning of the 20th century; but
this rise has not been purely linear. The global average temperature has risen sharply at
0.18oC per decade from the late 1970s. In the northern and southern hemispheres, the
1990s were the warmest decade with an average of 0.38oC and 0.23oC above the 30
years mean respectively (WMO, 2005). Moreover, according to the 2009 WMO report
regarding the warmest decade, the 2000s was warmer than the decade spanning the
1990s (WMO, 2009). The 10 warmest years for the earth’s surface temperature all occur
after 1990, and 2005 was the warmest year on record (Jones and Palutikof, 2006).
Nepal climate is influenced by the Himalayan mountain range and the South Asian
Monsoon (NCVST, 2009). Pre-monsoon (March to May), Monsoon season (June to
September), Post-monsoon (October to November) and winter (December to February)
are the four distinct characterized in Nepal (MoE, 2010). Average annual rainfall is
approximately 1800mm but there are marked spatial and temporal variations both north-
south and east-west and the monsoon rain is most abundant in the east declines
westwards, while rains are higher in the northwest and declines south-westwards
(Practical Action, 2009). Temperature varies with topographic variations and increases
from north (Mountains) to south (Terai) (MoE, 2010) and the average temperature
decreases by 6oC for every 1000m gain in altitude (Jha, 1992). In Terai, winter
2
temperatures are between 22-27oC, while summer temperatures exceed 37oC and in the
mid-hills, temperatures are between 12-16oC.
In a humid climate like that of Nepal, there will be changes in the spatial and temporal
distribution of temperature and precipitation due to climate change, which in turn will
increase both the intensity and frequency of extreme events like droughts and floods.
Increases in temperature result in a reduced growing season and a decline in
productivity, particularly in South Asia (Pachauri, 1992). Reduced river flows will
affect the hydro power generation, inland water transport and aquatic ecosystem.
Similarly, reduced water availability may create conflicts between water users within
and among nations.
Climate induced impacts in Nepal result from changes in precipitation patterns,
flooding, landslides, erosion and increased sedimentation. These changes threaten the
livelihoods of local communities through changes in agro ecosystem and direct threats
such as loss of land, livestock and household assets. While increasing attention has been
placed on glacial lake outburst floods in Nepal, less attention has been given to other
effects of climate change on downstream communities in terms of changes in water
availability and flow. Climate change will result in more intense precipitation events
causing increased flood, landslide, avalanche and mudslide damages that will cause
increased risks to human lives and properties (IPCC, 2001a). Besides, intensified
droughts are expected due to climate change that may result in decreased agricultural
productivity. Likewise, warmer temperatures increase the water-holding capacity of the
air and thus increase the potential evapo-transpiration, reduce soil moisture and decrease
ground water reserves (IPCC, 2001b) which ultimately affects the river flows and water
availability.
There is no distinct long term trend in the precipitation records in Nepal during 1948 to
1994, but significant regional and seasonal variations in annual and decadal
precipitation has been observed (Shrestha et al., 2000).
A decrease in water availability can cause severe problems in sectors or places that
depend on water. People use water for domestic purposes, agriculture and industry; and
ecosystems are dependent on water availability. Both water quantity and quality play a
role for people and ecosystems (UNDP, 2006). Effects of climate change on water
resources could yield manifold implications either due to too much and/or too little
water. Climate induced water stressed directly affects agricultural productivity,
3
malnutrition, human health and sanitation while too much water impacts human
settlements, infrastructure and agricultural land (MoE, 2010). Water-induced disasters
are very prevalent in Nepal and annually many lives and properties worth millions of
dollars are destroyed. Owing to the diverse geological settings, rugged terrain and
monsoon precipitation, Nepal is prone to floods, landslides and glacial lake outburst
floods. The monsoon season in Nepal occurs between June and September; monsoon is
the dominant rainfall season, with 80% of the annual rainfall occurring in that period.
Based on 20 years of data (1980–2000), Nepal is found to have high vulnerability to
flood disasters as reported in the UNDP global report on reducing disaster risk (UNDP,
2004).
Changes in water supply, changes in its demand and changes in resources availability
are some impacts of climate change impacts on water resources (Nicol and Kaur, 2009).
According to projections from the Food and Agriculture Organization (FAO), the
irrigation water demand will increase by between 5-20% by 2080. On the other hand,
the projected increase in household water demand and industrial water demand due to
climate change is less 5% by the 2050s in some parts of the world (Bates et al., 2008).
In general, temperature must be viewed as the main factor affecting almost all physico-
chemical equilibriums and biological reactions. It is well known that all physico-
chemical “constants” vary with temperature, and frequently increasing endothermic
reactions. According to Arrhenius relation, kinetic of a given chemical reaction can be
doubled for a temperature increase of 10°C. Remind that, whatever the IPCC scenario
the average global air temperature should increase between 1.8 and 4.0°C (Bates et al.,
2008) during the 21st century. Moreover, a drying tendency in summer is expected,
particularly in subtropics, low and mid-latitudes, in addition with an extreme events
increase in general (Bates et al., 2008). Floods and droughts will also modify water
quality by direct effects of dilution or concentration of dissolved substances. For low
river flow rates, the main effect on water quality is as for a temperature increase, a
concentration increase of dissolved substances in water but a concentration decrease of
dissolved oxygen (Prathumratana et al., 2008). A correlative positive effect is the
concentration decrease of some pollutants due to a low water velocity. For heavy rain
falls and strong hydrologic conditions, runoff and solid material transportation are the
main consequences. For countries in the temperate zone, climate change will decrease
the number of rainy days but increase the average volume of each rainfall event
4
(Brunetti et al., 2001; Bates et al., 2008). As a consequence, drought–rewetting cycles
may impact water quality as it enhances decomposition and flushing of organic matter
into streams (Evans et al., 2005).
1.2 Statement of Problem
Climate change is considered to be problematic issue for many countries impacting
various sectors and areas. Widespread implications of climate change indicate that
climate change is a complex and cross-cutting issues. Mountain regions of Nepal are
more susceptible to climate change impacts. Water resource and hydropower ranks
highest impact sector among others (OECD, 2003) and is predicted to become one of
the most pressing environmental problems with high impacts from climate change in
hills and mountains of Nepal. Drying up water resources, ground water depletion is
likely due to long dry seasons, irregular rains, and high intensity rainfall leading to high
run-off and less infiltration.
Climate change impacts on water resources may be addressed by focusing on research,
optimum observation network and strong database. Moreover, Manaslu Conservation
Area is a comparatively less explored site in terms of research and few studies have
been carried out to understand the changes in climatic variability to climate change
effect on water resources in local level but till date no any studies on degradation of
water quality due to climate change have been carried out in Nepal. In this scenario,
this work has tried to evaluate and identify the climate change impact on water
resources of the area.
1.3 Research Questions
• What is the perception of local people on temperature and precipitation change in
Prok VDC?
• What are the observed impacts of climate change on water resources and agriculture
in the study area?
• What is the state of water quality available at community level?
1.4 Objectives
The general objective of the study is to assess the climate change impacts on water
resources in Prok VDC of Manaslu Conservation Area, Gorkha, Nepal.
The specific objectives of the study are:
5
• To assess the pattern and trend of climate change based on recorded hydro-
meteorological data and perception/experience of local people.
• To determine and evaluate the impacts of climate change on water resources.
• To analyze physico-chemical and microbiological parameters of drinking water.
1.5 Scope and Limitations of the Study
To address the research questions, this research focuses on the climate change
impacts on water resources in Prok VDC of Manaslu Conservation Area, Gorkha.
The study is based on field survey, analysis of data of hydro-meteorology from nearby
stations. The field also aimed to analyze water quality of the VDC. The report
includes analysis of climate change impacts on water resources as well physico-
chemical and microbiological parameters of water. The findings will help other
researcher engaged in studies on climate change, water resources and water quality of
the area. The report has following limitations:
• There was lack of baseline information on the physical as well as socioeconomic data
of concern; it was collected on the basis of memory of the people.
• Prok VDC of Manaslu Conservation Area was selected for this study and hydro-
meteorological data of out of VDC and out of district were taken for analysis.
• Due to unavailability of water quality data, trend of quality of water couldn’t
determine for understanding the state of water quality of the area. This result will be the
baseline data for other research.
6
CHAPTER II: LITERATURE REVIEW
2.1 Global Climate Change
UNFCCC (1992) in its Article 1 defined climate change as a change in climate, which is
attributed directly or indirectly to human activity that alters the composition of the
global atmosphere and which is in addition to natural climate variability observed over
comparable time periods.
IPCC (2001) defined climate change as any change in climate over time, whether due
to natural variability or human activities. The updated definition by IPCC (2006) stated
that climate change refers to a statistically significant variation in either the mean state
of the climate or in its variability which may be due to natural internal processes or
external force, or to persistent anthropogenic changes in the composition of the
atmosphere or in land use.
Xiaodong et al. (2000) identified that the global temperature has increased by 0.3oC to
0.6oC since the last 19th century and by 0.2oC to 0.3oC over the last 40 years (1960-
2000) with the indication of more increase in the global temperature in coming days
making earth’s sustainability more vulnerable.
UNFCCC (2007) stated that the atmospheric concentration of CO2 has increased from a
pre industrial value of 278 ppm to 319 ppm in 2005 which leads to increase in global
average temperature by 0.74oC.
Article 17 of Marrakesh Accords UNFCCC (2001) indicated that least developed
countries with the mountainous terrains are among the most vulnerable to extreme
weather events and the adverse effects of climate change. They also have least capacity
to cope with and adapt to the adverse effects of climate change.
2.2 Climate Change in Nepal
Sharma (2004) studied the maximum temperature trends across 39 stations of Nepal and
found that the maximum temperature trend showed a warming rate throughout the
country. Though the warming trend is varied, maximum occurring in the middle
mountains and Himalayan region whereas low warming rate was observed in Terai
region with some exceptional pocket areas. The study also revealed that the warming
7
trend observed in Nepal is as consistent as is observed in the other region but the rate is
greater as compared to global average trend.
Baidya et al. (2008) analyzed both annual mean minimum and maximum temperature
for the years 1981 to 1998 and found that annual mean maximum temperature has
increased at a higher rate (0.057oC/year) than annual mean minimum temperature
(0.025oC/year). While exceptionally in Terai region, decreasing trend in maximum
temperature during winter season (-0.038oC/year) was observed.
Marahatta et al. (2009) concluded the temperature of the years 1976 to 2005 showed
higher increase in maximum temperature (0.05oC/year) than minimum temperature
(0.03oC/year) in the context of whole Nepal. But the temperature increase was found
significantly lower or even lacking in Terai and Siwalik regions (<0.03oC/year). The
rate of temperature increase was less in the lower altitude while high in the higher
altitude.
Sharma et al. (2000) found an increasing trend in observed precipitation data from
Koshi Basin in eastern Nepal but the trend widely varied in seasons and in sites. The
precipitation fluctuation in Nepal is not the same as the all-India precipitation trend.
Pokhrel (2003) found the precipitation pattern in Nepal by considering 77 precipitation
stations distributed across the country for the study period of 1968 to 1998. In this
study, the annual mean precipitation was found to be 1717mm in Nepal. But, owing to
the great variation in topography it ranged from 5098mm along the southern slope of
Annapurna range in the western part of Nepal to 324mm in the western portion near the
Tibetan Plateau.
HMG/MOPE (2004) showed the overall annual average precipitation trend is decreasing
at the rate of 9.8mm per decade for Nepal. The monsoon rain has increased by increase
in number of rainy days and rainfall magnitude.
OECD (2003) ranked different resources of Nepal based on the climate change impact
on them which is shown in table 1. According to OECD, the certainty of climate change
impact is high for water resources and hydropower, medium for agriculture and low for
human health, ecosystem and biodiversity.

8
Table 1: Priority ranking of climate change impacts for Nepal
Resource
Ranking
Certainty
of impact
Timing of
impact
Severity
of impact
Importance
of resource
Water resource High High High High
Agriculture medium-low medium-low Medium High
Human health Low Medium uncertain medium-low
Ecosystem Low Uncertain uncertain medium-low
(Source: OECD, 2003)
2.3 Impact on Water Resources
MoE (2010) studied on assessment of climate change impacts on water resources and
vulnerability in hills of Nepal found about sixty percent of the sources have been dried
up and substantial decrease in the volume of Dhare khola watershed. More than five
small ponds and most of the water holes in the forest areas have been dried up. Human
and production system also were found to be the most impact sectors.
2.3.1 Impact on Water Availability
Agrawal et al. (2003) studied on glacier retreat and found that in turn causes greater
variability (and eventual reduction) in stream flow, and glacial lake outburst floods that
pose significant risk to hydropower facilities, and also to other infrastructure and human
settlements.
Chaulagain (2006) concluded that for a temperature rise of 4ºC and a precipitation increase of
10%, range of flows (i.e. the difference between the highest and the lowest flows) in the
Bagmati River would increase from the present 268 m3/s (i.e. from 7.3 m3/s to 275.3 m3/s)
to 371.6 m3/s (i.e. from 6.9 m3/s to 379.6 m3/s).
2.3.2 Impact on River Discharge
Global El Niño/Southern Oscillation (ENSO) events have directly affected the regional
annual precipitation in the Yellow River Basin and resulted in an approximately 51%
decrease in river discharge to the sea (Wang, 2006).Although many other factors are
involved, the growing incidence and toll of related natural disasters, such as flood and
drought, is of particular concern.
9
Alam and Regmi (2004) the changes in temperature and precipitation alters the
hydrological cycle and water resources. The monthly variability of runoff is quite high
in Nepal, for example, with the Sapta Koshi varying from 400m3/s in February to 4300
m3/sec in August. This could lead to increased flooding and more pronounced variations
in water availability throughout the year.
2.3.3 Impact on Snow and Glacier
IPCC (2008) reported that snow cover has effect on both temperature and precipitation
and it exhibits a strong negative correlation but more with air temperature in most of
areas. As climate warms, snow cover is projected to shrink and decreases, glacier ice
cap to loss mass as a consequence of the increase in summer melting being greater than
the increase in winter rainfall. Widespread increase in thaw depth over much of the
permafrost region is projected to occur in response of warming.
ICIMOD/UNEP (2001) stated that there are 3252 glaciers in Nepal covering a total area
of 5323 sq. km. and found significant glacier retreat has been documented in recent
decades, with a very high likelihood that this is linked to rising temperatures.
Glaciological Expedition in Nepal (GEN), collaboration between Nepal and Japan,
started glacier study in a regular basis in Nepal in several glaciers in Hidden Valley of
Dhaulagiri Region, Langtang Region, Khumbu Region and Kanchenjunga Region since
early 70s.
Asahi and Watanabe (2000) studied that glacier fluctuation in Ghunsa Khola basin of
Kanchenjunga area and a comparison of the 1992 glaciers with those of 1958 in the area
revealed that out of 57 glaciers, 50% of them have retreated in the period from 1958 to
1992. Also, 38% of the glaciers are under stationary conditions and 12% are advancing.
2.3.4 Impact on Agriculture
MOPE (2004) showed that temperature rise had negative effects on maize and gave a
decrease in yield with an increase in temperature. The average potential yield increased
by about 12% in Nepal considering the effect of double CO2 (580ppm) without an
increase in ambient temperature. A double CO2 condition, with a 4ºC rise in
temperature and 20% increase in precipitation, showed 12% to 35% decrease in the
potential maize yield in the hilly and Terai region of Nepal.
Chaulagain (2006) carried out an analysis on the decrease in rice production due to
temperature rise. It was calculated by hypothetically reducing the equivalent land area

10
of increased irrigation water demand (i.e., 1m3 of increased water demand = 1/15000
ha of rice field* 2.67 metric tonnes/ha of rice yield = 0.18 kg of rice). A 5ºC rise in
temperature would cause a decrease in the average per capita supply from 2440
kcal/day to 2264 kcal/ day. Because of the large disparity in consumption patterns
among the population, such a decrease would have different effects on the various
income groups.
Gurung and Bhandari (2009) concluded that the actual monsoon month and the main
rice planting month July is becoming erratic. Farmers from Kabilash VDC in Chitwan,
Nepal could not transplant rice for two consecutive monsoons (2004 and 2005) because
of dry months.
2.3.5 Impact on Biodiversity
ADB (2009) reported that climate is one of the main factors that influence the
distribution and population density of species of flora and fauna on Earth.
LFP (2009) concluded that under all of the climate scenarios, many of the forest types
adapted to cooler temperatures are predicted to migrate northwards or upwards, while
isolated communities of other species may become extinct within their current region.
2.3.6 Impact on Water Quality
Delpla et al. (2009) carried out that study on the impact of climate change on surface
water quality in relation to drinking water production and found that there is a
degradation trend of drinking water quality leading to an increase of at risk situations
with regard to potential health impact, mainly during extreme meteorological events.
Among water quality parameters, dissolved organic matter, micro-pollutants and
pathogens are susceptible to rise in concentration or number as a consequences of
temperature increase (water, air and soli) and heavy rainfall in temperate countries and
concluded that water borne diseases potentially highly linked to climate change impacts.
Peter et al. (2000) carried out study on the potential effects of climate change on surface
water quality in North America and found that water quality in ecological transition
zones and areas of natural climate extremes is vulnerable to climate changes that
increase or decrease temperature and/or precipitation variability.
Mooij et al. (2009) studied and it was found that climate change might be responsible
for the reduction of transparency of water bodies in several ways: it increases matter and
11
nutrient loading (soil erosion) and decreases the critical nutrient threshold value at
which a system switches from clear to a turbid state.
Moatar et al. (2006) found that water temperature is determined by heat exchange with
the atmosphere and also concluded that water temperature increased with air
temperature of the region.
Brody et al. (2008) concluded climate change might lead to increasing frequency and
intensity of floods and deteriorating water quality due to increasing temperature and
decreasing precipitation.
2.4 Study on Physico-chemical and Microbial quality of water in Nepal
Diwakar et al. (2008), studied on the physico-chemical and microbiological analyses of
the 116 water samples from four different sources namely, public tap, well, tube well
and stone spout of Bhaktapur Municipality area in pre-monsoon season and found that
the pH values of all water samples were lie with in Nepal standard. Similarly
57(49.14%), 9(7.76%), 56(48.28%) and 1(0.87%) of water samples were found to
exceed Nepal standard value for conductivity, turbidity, iron and chloride content
respectively. The bacteriological water samples revealed the presence of total coliform
in 96(82.76%) of samples. So the study has pointed out that drinking water quality of
city water supply has not been improved and traditional sources like stone spouts and
tube well water are also not free from contamination.
Jayana et al. (2008) assessed the existing status of drinking water quality of Madhyapur-
Thimi and found that out of 105 water samples comprising 50 (47.61%) wells, 45
(42.82%) tap water and 10 (9.52%) stone spouts analyzed, pH (19%), conductivity
(34.28%), turbidity (16.19%) of samples crossed the permissible guideline values as
prescribed by (WHO, 2007) and national standard. All samples contained nitrate
values within the WHO permissible value as well as standard but hardness (2%), chloride
(2.85%), iron (26.66%), ammonia (11.42%) and arsenic content (1.90%) crossed the
WHO guideline value but none of the water samples crossed the national standards for
arsenic. Similarly total coliform count showed 64.76% of samples crossed the WHO
guideline values. Eleven different kinds of enteric bacteria were isolated from different
source.
Rai et al. (2009) studied the status of drinking water contamination in three mountainous
districts in Nepal. A total of 43 water samples (Sankhuwasabha: 11, Rasuwa: 12 and
12
Dolpa: 20) were tested for the presence of total coliform (TC) and Escherichia coli as
fecal coliform bacilli using commercially available test system called Colilert (Japan).
Of the total, 85.7% (36/43) were positive for TC whereas 67.4% (29/43) were positive for
Esch. coli. The fecal contamination rates (as indicated by the growth of Esch. coli) in
Sankhuwasabha, Rasuwa and Dolpa Districts were 81.8% (9/11), 75.0% (9/12) and
65.0% (13/20), respectively.
Prasai and Lekhak (2007) carried out the microbiologically analysis of drinking water of
Kathmandu valley. A total of 132 drinking water samples were randomly collected
from 49 tube wells, 57 wells, 17 taps and 9 stone spouts in different places of
Kathmandu valley. Total plate and coliform count revealed that 82.6% and 92.4% of
drinking water samples found to cross the WHO guideline value for drinking
water.
Shakya et al. (2012) carried out the evaluation of physico-chemical and
microbiological parameters of drinking water supplied from distribution systems of
Kathmandu municipality and found that there was distinct variation in physico-
chemical parameters and the mean residual chlorine was found 0.24 mg/L. Total
coliforms was found in 61.4% (70/114) of water samples.
13
CHAPTER III: STUDY AREA
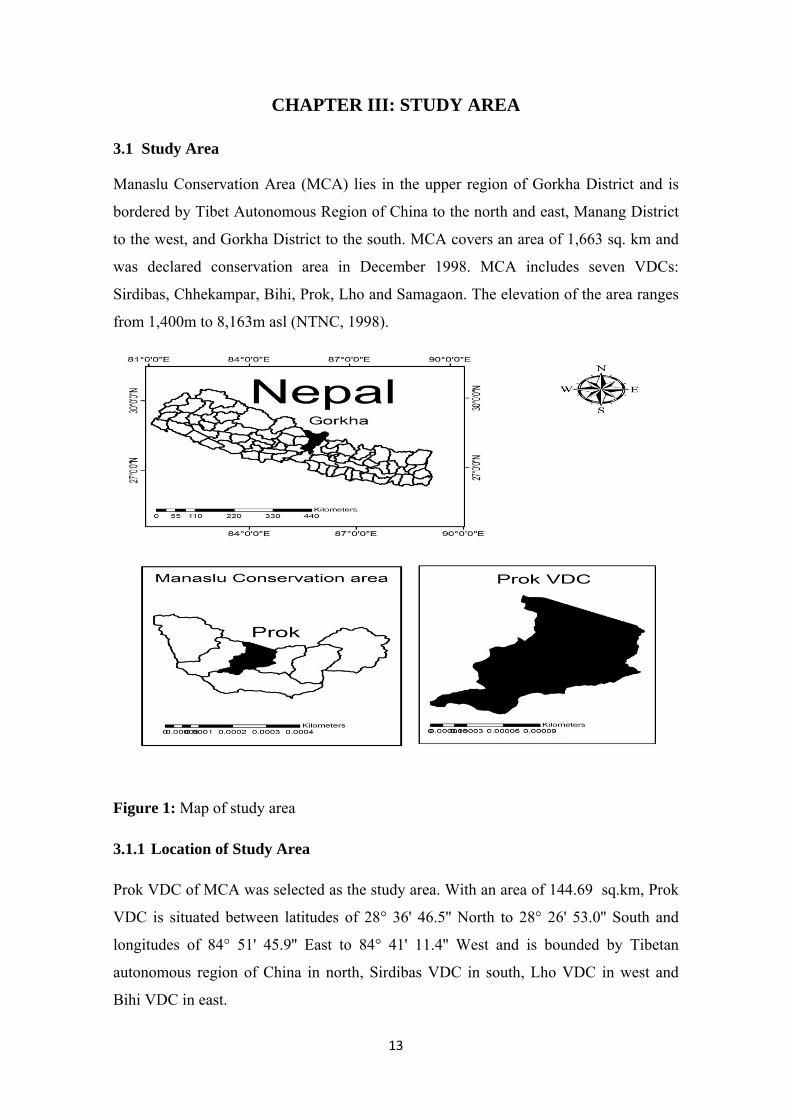
3.1 Study Area
Manaslu Conservation Area (MCA) lies in the upper region of Gorkha District and is
bordered by Tibet Autonomous Region of China to the north and east, Manang District
to the west, and Gorkha District to the south. MCA covers an area of 1,663 sq. km and
was declared conservation area in December 1998. MCA includes seven VDCs:
Sirdibas, Chhekampar, Bihi, Prok, Lho and Samagaon. The elevation of the area ranges
from 1,400m to 8,163m asl (NTNC, 1998).
Figure 1: Map of study area
3.1.1 Location of Study Area
Prok VDC of MCA was selected as the study area. With an area of 144.69 sq.km, Prok
VDC is situated between latitudes of 28° 36' 46.5'' North to 28° 26' 53.0'' South and
longitudes of 84° 51' 45.9'' East to 84° 41' 11.4'' West and is bounded by Tibetan
autonomous region of China in north, Sirdibas VDC in south, Lho VDC in west and
Bihi VDC in east.
14
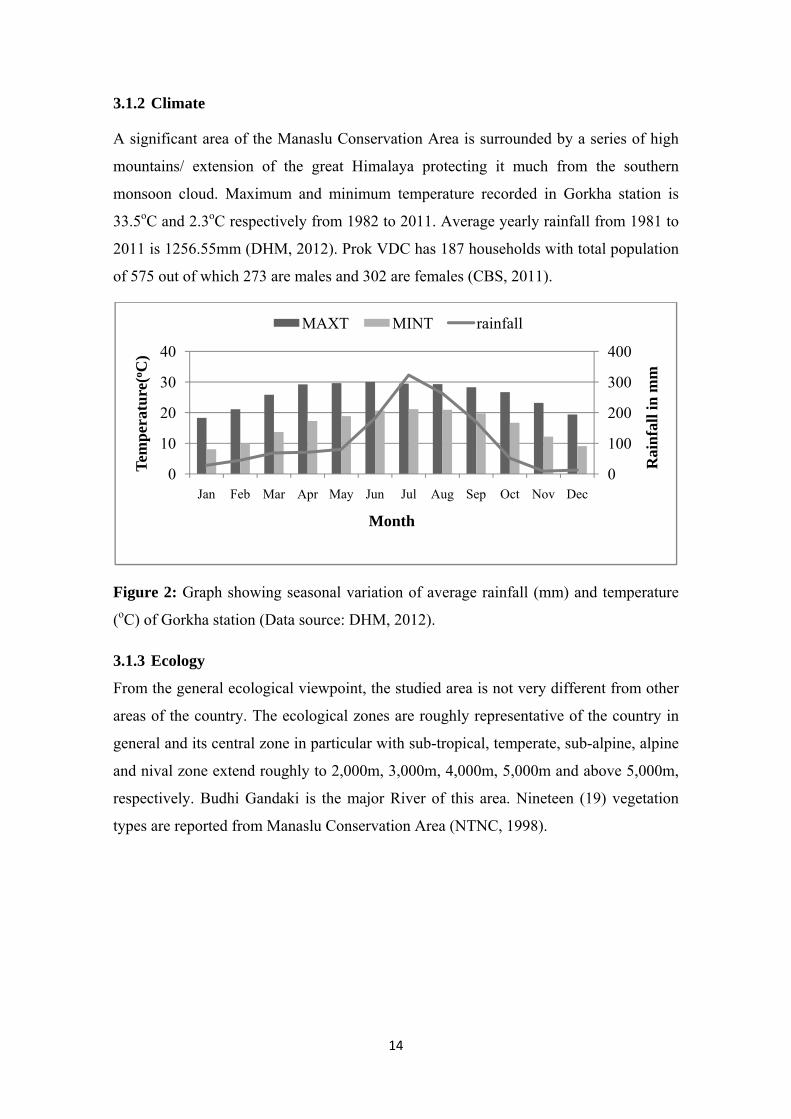
3.1.2 Climate
A significant area of the Manaslu Conservation Area is surrounded by a series of high
mountains/ extension of the great Himalaya protecting it much from the southern
monsoon cloud. Maximum and minimum temperature recorded in Gorkha station is
33.5oC and 2.3oC respectively from 1982 to 2011. Average yearly rainfall from 1981 to
2011 is 1256.55mm (DHM, 2012). Prok VDC has 187 households with total population
of 575 out of which 273 are males and 302 are females (CBS, 2011).
Figure 2: Graph showing seasonal variation of average rainfall (mm) and temperature
(oC) of Gorkha station (Data source: DHM, 2012).
3.1.3 Ecology
From the general ecological viewpoint, the studied area is not very different from other
areas of the country. The ecological zones are roughly representative of the country in
general and its central zone in particular with sub-tropical, temperate, sub-alpine, alpine
and nival zone extend roughly to 2,000m, 3,000m, 4,000m, 5,000m and above 5,000m,
respectively. Budhi Gandaki is the major River of this area. Nineteen (19) vegetation
types are reported from Manaslu Conservation Area (NTNC, 1998).
0
100
200
300
400
0
10
20
30
40
Jan Feb Mar Apr May Jun Jul Aug Sep Oct Nov Dec
Rai
nfal
l in
mm
Tem
pera
ture
(o C)
Month
MAXT MINT rainfall

15
CHAPTER IV: MATERIALS AND METHODS
4.1 Research Design
The field work for the research was carried out on the April and May, 2012.
Participatory tools and methods along empirical field studies were used to collect data
from the field. Both qualitative and quantitative research techniques were applied to
gather the information related to objectives. The major elements of this methodology
include the use of primary and secondary data, household questionnaire survey, focus
group discussion (FGD), key informant interviews (KII) and field observation. Based
on the community water sources, 12 water samples were collected from stream,
reservoir and tap for understanding the condition of water quality in the area.
Figure 3: Research Design
Literature Review
Problem Identifications
Study Area Selection
Data Collection
Primary Data Secondary Data
Household Survey
FGD, KII
Field Observation
Review documents, Paper, Articles,
Journals
Climatic Data
Data Analysis and Assessment
Water Collection
Field Test Lab Test
16
4.2 Sample Design
The detail study was carried out in the month of April and May, 2012. The stratified
random sampling method was adopted for the household survey. The survey was
carried out among the Bhote and Lama’s people. Out of 187 households, 62 households
representing thirty percent samples from each ward and in whole as well were taken
purposively for household survey. The reason behind taking 30% sampling from each
ward is to maintain homogeneity in the data and with the intention of minimizing the
bias between the samples. Based on source distribution, 12 samples were collected
from stream, reservoir and tap of the study area.
4.3 Methods of Data Collection
Primary as well as secondary data were collected for the conduction of this research.
4.3.1 Primary Data Collection
The primary data was collected by using household survey, focus group discussion and
key informants interview while field observation was also made.
Household Survey: Questionnaire containing questions related to climate, water
resources and its utilization, impacts on livelihood was developed and administrated in
the Prok VDC.
Focus Group Discussion: Discussion was conducted by gathering of local residents to
get information about the past and present condition of water quality, quantity and
availability, climatic extremes and the adaptation measures adopted by local to cope
with the changing climate. A focus group discussion was conducted in ward number
three of Prok VDC. The size of group was 8 to 10 members.
Key Informants Interview: Informal interview was carried out with key informants of
the study area that helped to find out the differences between past and present water
availability, quality in the river due to climatic extremes and associated livelihood
security- food, drinking water, health and sanitation etc.
Field Observation: During the field survey, field observation was made carefully to
document climate changes, disasters and its impact on water resources.
4.3.2 Secondary Data Collection
The recorded temperature, rainfall and discharge data of the nearest local stations were
17
collected from Department of Hydrology and Meteorology. The available temperature
data recorded from Gorkha station for 30 years (1982-2011), precipitation data from
Jagat and Chame station for 30 years (1981-2010) were collected for the analysis of
temperature and precipitation data. Similarly, discharge of Arughat station for 30 years
(1981-2010) was collected for analyzing the run off of the river.
The village profile was collected from the MCA Project Office of Philim, Sirdibas as
well as published data from the Central Bureau of Statistics and the national level
reports were also collected. The relevant study materials were also collected by
consulting various books, journals, magazine and other research publications.
4.3.3 Assessing Climatic Scenarios
In this study, thirty year data (1981-2011) on temperature rainfall and discharge of the
nearest hydrological and meteorological station were collected from Department of
Hydrology and Meteorology (DHM), Kathmandu.
The annual and seasonal temperature, rainfall and discharge for different time period
were also analyzed to indicate the climatic variability. Missing data were estimated by
linear interpolation of the data of the same months of the adjacent years on either side of
the missing values. The trends were calculated by using simple linear regression
analysis. Besides, non-climatic indicators based on community perceptions of climate
variability were also documented during FGD, KII and field observation and analyzed
to support as indicators of climate change ability from 20-30 years of time.
4.4 Methods for Drinking Water Quality
4.4.1 Water Sample Collection
Prok VDC was taken as the sample site. Three water sources were taken as namely
stream, tap and reservoir. Water samples were collected following the guidelines
described by Americian Public Health Association (APHA, 1998). Analysis of the
physico-chemical parameters of water that is temperature, turbidity, conductivity, pH,
chloride, free carbondioxide, alkalinity, hardness, iron, nitrate and ammonia were
measured with standard procedure (APHA, 1998).
A total of 12 water samples from streams, reservoirs, and taps water of Prok VDC were
collected in clean polythene bottles and brought to the laboratory. The temperature, pH,
conductivity, chloride, hardness, alkalinity, free CO2 were determined on the spot by
18
using thermometer; pH meter, conductivity meter and chemical analysis. Laboratory
analysis was done at Environmental Research Laboratory of Nepal Academy of Science
and Technology.
4.4.2 Physico-chemical Analysis of Drinking Water
a. Water Temperature
The temperature of water was measured by using a mercury filled Celsius thermometer.
For determination of temperature, the sample water was collected in a beaker. Soon
after the collection of the water sample, the thermometer was dipped into the water
sample keeping the thermometer away from direct sunlight and noted the reading.
While taking the reading, the scale of the thermometer was immersed in the water up to
the level of mercury in the capillary column (APHA, 1998).
b. Turbidity
The turbidity of water was measured by using a Nephelometer. For determination of
turbidity, turbidity tube was washed with distilled water properly. The tube was rinsed
with adequate amount of shake sample solution and introduced into it. The outer part of
tube was wiped with tissue paper and noted the reading from meter (APHA, 1998).
c. pH
For the determination of pH of water, water sample was taken in a clean beaker and
electrode of pH meter was dipped into the water sample. Equilibrium between electrode
and water sample was established by stirring water sample to ensure homogeneity. Then
the reading of pH meter was noted (APHA, 1998).
d. Electric Conductivity
For measuring the conductivity of water, the electrode was rinsed with distilled water
and dipped in the beaker containing the water sample. The reading was noted after the
reading stabilized at a certain point (APHA, 1998).
e. Alkalinity
The alkalinity are determined by titrate the water sample with a strong acid 0.1 N HCl
by using the indicators phenolphthalein at first and methyl orange at the second time.
The volume of acid used with phenolphthalein indicator corresponds to phenolphthalein
and the whole of the acid used with both indicators corresponds to the total alkalinity.

19
For the determination of alkalinity, 100 mL of sample was taken in a conical flask and 2
drops of phenolphthalein was added. When the solution remains color disappeared. This
gives phenolphthalein alkalinity. Then 2-3 drops of methyl orange was added to the
same sample and titrated with a strong acid 0.1 N HCl further until the yellow color
changed to pink at end point. This gives total alkalinity.
Calculation,
PA as CaCO3, mg/L = A x N x 1000 x 50
Volume of sample (mL)
TA as CaCO3, mg/L = B x N x 1000 x 50
Volume of sample (mL)
Where, A = mL of HCl used with only phenolphthalein
B = mL of total HCl used with phenolphthalein and methyl orange
PA = Phenolphthalein Alkalinity
TA = Total Alkalinity
f. Chloride
Chloride content of water was determined by “Argentometric method” in which water
sample is titrated with 0.02 N AgNO3 using K2CrO4 as indicator. 50 mL of water
sample was taken in a conical flask and 2 mL of Potassium chromate was added to it
and stirred well. The content in the flask was titrated against AgNO3 solution until
persistent red tinge appeared. The chloride is calculated by the following equation
(APHA, 1998).
Calculation,
Chloride, mg/L = (mL x N) of AgNO3 x 1000 x 35.5 1000
Volume of sample taken
g. Total Hardness
For the determination of hardness, 50mL of water sample was taken in a conical flask.
Then 1 mL of ammonium buffer solution was added. If the water sample is having
higher amounts of heavy metals, 1 mL of Na2S should be added. Then 100-200 mg of
Eriochrome Black T was added and the solution turned into wine red. The content was

20
titrated against standard 0.01 M EDTA solution until the color changed from wine red
to blue. The hardness is calculated by the following equation (APHA, 1998).
Calculation,
Total Hardness as mg/L CaCO3 = Volume of EDTA used x B x 1000
Volume of sample taken (mL)
= Volume of EDTA used x 1000
Volume of sample (mL)
Where, B = mg of CaCO3 equivalent to 1 mL of 0.01M EDTA = 1
h. Free CO2
For the determination of free carbon-dioxide content of water sample, 100 mL of water
sample was taken in a conical flask and a few drops of phenolphthalein indicator were
added to it. If the color turns pink, free CO2 is absent. If the sample remained colorless,
it was titrated against 0.05 N NaOH. At the end point the color of solution changed into
pink.
Calculation,
Free CO2, mg/L = (mL x N) of NaOH x 1000 x 44
Volume of sample
i. Iron
The iron contained in water is usually determined by Phenonthroline method. 50 mL of
water sample was taken in a conical flask. 2 mL of conc. HCl and 1mL of
hydroxylamine hydrochloride solution was added to the sample. Some glass beads were
added in the flask and heated. The content was boiled to half of the volume for
dissolution of all the iron. 10 mL of ammonium acetate buffer and 2mL of
Phenonthroline were added. An orange red color appeared. The volume was made 100
mL by adding distilled water and the flask was shaken well. The solution was kept for
10 minutes for maximum color development. The reading was taken for the absorbance
at 510 nm on a spectrophotometer. The concentration of iron was directly determined
from the standard curve.
21
Preparation of Standard Curve: Standard solution of 0.5 ppm (0.5mg/L) was
prepared by adding 2 mL conc. HCl, 1 mL hydroxylamine hydrochloride, 10 mL
ammonium acetate buffer and 2 mL phenonthroline to 5 mL standard solution of iron in
a volumetric flask and then diluting the solution to 100 mL. Similarly 1.0 ppm, 2.0 ppm,
3.0 ppm, 4.0 ppm standard solution were prepared by adding 10 mL, 20 mL, 30 mL, 40
mL standard iron solution respectively to the same quantities of all other constitutes
mentioned above and diluting these to 100 mL. The absorbance of all the standard
solutions were measured using spectrophotometer and a standard curve was prepared.
j. Nitrate
Nitrate-Nitrogen is determined by Brucine Absorbtivity method. 10 mL of sample was
taken in 50 mL beaker separately. All the beakers were kept in a wire rack and placed in
cool water bath. 2 mL of NaCl solution was added in the each beaker. 10 mL of H2SO4
solution was added in each sample and shaked properly. Then 0.5 mL brucine reagent
was added and mixed thoroughly. All samples were placed in a hot water bath with
boiling water for 20 minutes. The contents were cooled in a cold water bath and the
reading was taken at 410 nm. The concentration of Nitrate - Nitrogen was calculated
from the standard curve.
Preparation of Standard Curve: The standard curve was prepared between
concentration and absorbance 0.1 to 1.0 mg N/L at the interval of 0.1. The absorbance
of all the standard solutions were measured using spectrophotometer and a standard
curve was prepared.
k. Ammonia
For the determination of Ammonia, Direct Nesslerization method was used. 50 mL of
sample was taken in a volumetric flask. Two drops of Rochelle salt solution and 1 mL
nessler reagent was added to the flask. The mouth of the flask was covered with
aluminum foil and kept for 10 minutes for complete reactions after the addition of
nessler reagent. Reddish brown color appeared after sometime. The reading was taken at
420 nm on a spectrophotometer using a distilled water blank with the same amount of
chemicals. Finally the ammonia concentration of the sample was determined with the
help of standard calibration curve.
Preparation of Standard Curve: The standard calibration curve containing
concentration and absorbance was prepared as follows. 3.819 g of anhydrous NH4Cl

22
was taken and dissolve it into the 1000 mL of distilled water. After that the solution was
dilute for 100 times to prepared the solution containing 10 mg/L ammonia – N. Then
various dilutions at the interval of 0.1 mg/L were made from standard NH3-N solution.
The reading was taken at 420 nm on a spectrophotometer and a standard curve was
made by plotting a graph of absorbance against concentration.
4.4.3 Microbiological Analysis of Drinking Water
Water samples were collected in sterile bottles for microbiological analysis. Sample
bottles in one hand have been hold and removed the cap without touching the neck of
the bottle. Without taking cap on any surface, bottled were filled with water leaving a
small air gap. Flow rate of water did not alter at the time of sample collection. All the
samples were kept in ice box and transported immediately for the lab analysis. Total
coliforms were premeditated by using member filtration technique.
Membrane Filter Technique: Total Coliform was enumerated by the membrane
filtration (MF) technique (APHA 1998). Membrane filtration was done in M-Endo agar
using sterile membrane filter of pore size 0.45μm. The sample of water was well mixed
and then 100mL of water was poured through funnel and filtered under partial vacuum
by using electric vacuum pump. Then the membrane was incubated in M-Endo agar at
37oC for 24 to 48hrs. After incubation period, total colony forming unit (CFU) were
counted. For this, all green metallic sheen-producing colonies were counted (APHA
1998).
4.5 Data Analysis
The information collected from primary and secondary sources were tabulated and were
analyzed. Quantitative information derived from the household survey was analyzed
using Microsoft Excel 2007 and SPSS 15.0 version. The qualitative information
collected through focus group discussions and key informant interview were analyzed
using bar and chart diagrams. Map of Prok VDC has been prepared by using Arc GIS
9.3.

23
CHAPTER V: RESULTS
5.1 Temperature
a. Maximum temperature (Gorkha Station)
The nearest meteorological station taken for temperature is Gorkha station on which the
annual mean maximum monthly temperature is 26.3oC. The highest average
temperature recorded in the station on 2010 which is 33.5oC the lowest temperature
recorded is 17.3oC on the year of 2000. The analysis of mean maximum temperature
shows that the maximum temperature is increasing at the rate of 0.09oC/year. The graph
with trend line is shown in figure 4.
Figure 4: Annual maximum temperature and its trend (Source: DHM, 2012)
Analysis of the seasonal maximum temperature shows increasing trend of temperature
in all the four seasons. Maximum temperature of pre-monsoon season is increasing in
the rate of 0.12oC/year, temperature of monsoon season by 0.087oC/year, that of post-
monsoon season by 0.079oC/year and maximum temperature of winter season by
0.088oC/year. The trend of seasonal maximum temperature is given in figure 5.
y = 0.095x + 24.77R² = 0.624
242526272829
1982 1986 1990 1994 1998 2002 2006 2010
Tem
pera
ture
(o C)
Annual mean maximum temperature
24
Figure 5: Average seasonal maximum temperature of Gorkha station. a) Pre-monsoon
b) Monsoon c) Post-monsoon d) Winter (Source: DHM, 2012).
y = 0.126x + 26.50R² = 0.34022
27
32
1982 1986 1990 1994 1998 2002 2006 2010
Tem
pera
ture
(o C)
Pre-monsoon
y = 0.087x + 28.70R² = 0.586
26
28
30
32
1982 1986 1990 1994 1998 2002 2006 2010Tem
pera
ture
(o C)
Monsoon season
y = 0.079x + 24.22R² = 0.323
2224262830
1982 1986 1990 1994 1998 2002 2006 2010Tem
pera
ture
(o C)
Post -monsoon
y = 0.088x + 18.58R² = 0.370
17
19
21
23
1982 1986 1990 1994 1998 2002 2006 2010Tem
pera
ture
(o C)
Winter season
25
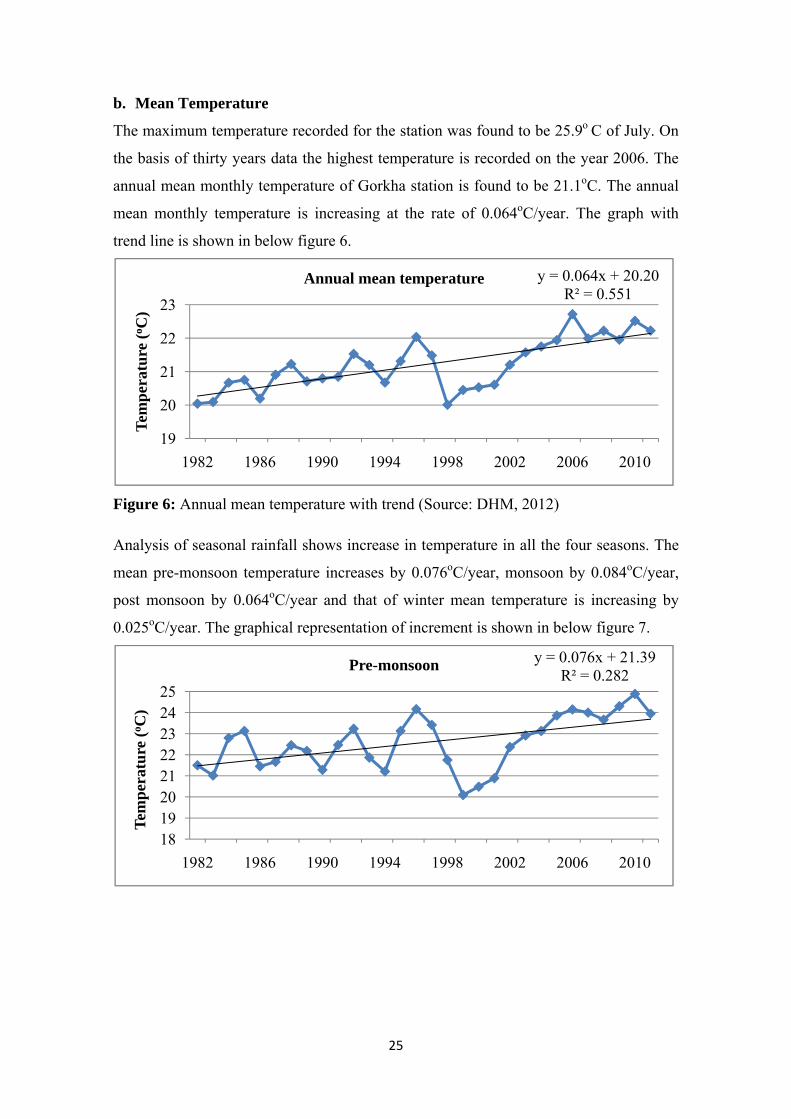
b. Mean Temperature
The maximum temperature recorded for the station was found to be 25.9o C of July. On
the basis of thirty years data the highest temperature is recorded on the year 2006. The
annual mean monthly temperature of Gorkha station is found to be 21.1oC. The annual
mean monthly temperature is increasing at the rate of 0.064oC/year. The graph with
trend line is shown in below figure 6.
Figure 6: Annual mean temperature with trend (Source: DHM, 2012)
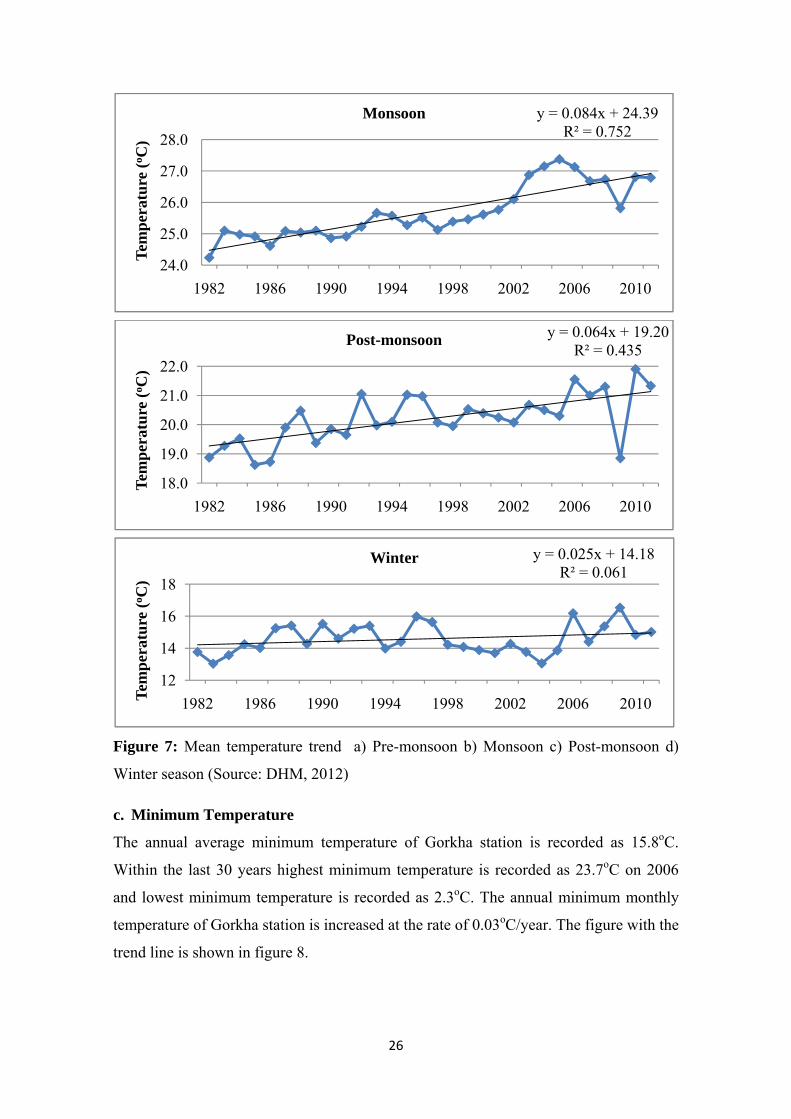
Analysis of seasonal rainfall shows increase in temperature in all the four seasons. The
mean pre-monsoon temperature increases by 0.076oC/year, monsoon by 0.084oC/year,
post monsoon by 0.064oC/year and that of winter mean temperature is increasing by
0.025oC/year. The graphical representation of increment is shown in below figure 7.
y = 0.064x + 20.20R² = 0.551
19
20
21
22
23
1982 1986 1990 1994 1998 2002 2006 2010
Tem
pera
ture
(o C)
Annual mean temperature
y = 0.076x + 21.39R² = 0.282
1819202122232425
1982 1986 1990 1994 1998 2002 2006 2010
Tem
pera
ture
(o C)
Pre-monsoon
26
Figure 7: Mean temperature trend a) Pre-monsoon b) Monsoon c) Post-monsoon d)
Winter season (Source: DHM, 2012)
c. Minimum Temperature
The annual average minimum temperature of Gorkha station is recorded as 15.8oC.
Within the last 30 years highest minimum temperature is recorded as 23.7oC on 2006
and lowest minimum temperature is recorded as 2.3oC. The annual minimum monthly
temperature of Gorkha station is increased at the rate of 0.03oC/year. The figure with the
trend line is shown in figure 8.
y = 0.084x + 24.39R² = 0.752
24.0
25.0
26.0
27.0
28.0
1982 1986 1990 1994 1998 2002 2006 2010
Tem
pera
ture
(o C)
Monsoon
y = 0.064x + 19.20R² = 0.435
18.0
19.0
20.0
21.0
22.0
1982 1986 1990 1994 1998 2002 2006 2010
Tem
pera
ture
(o C)
Post-monsoon
y = 0.025x + 14.18R² = 0.061
12
14
16
18
1982 1986 1990 1994 1998 2002 2006 2010Tem
pera
ture
(o C)
Winter

27
Figure 8: Annual minimum temperature with trend (Source: DHM, 2012)
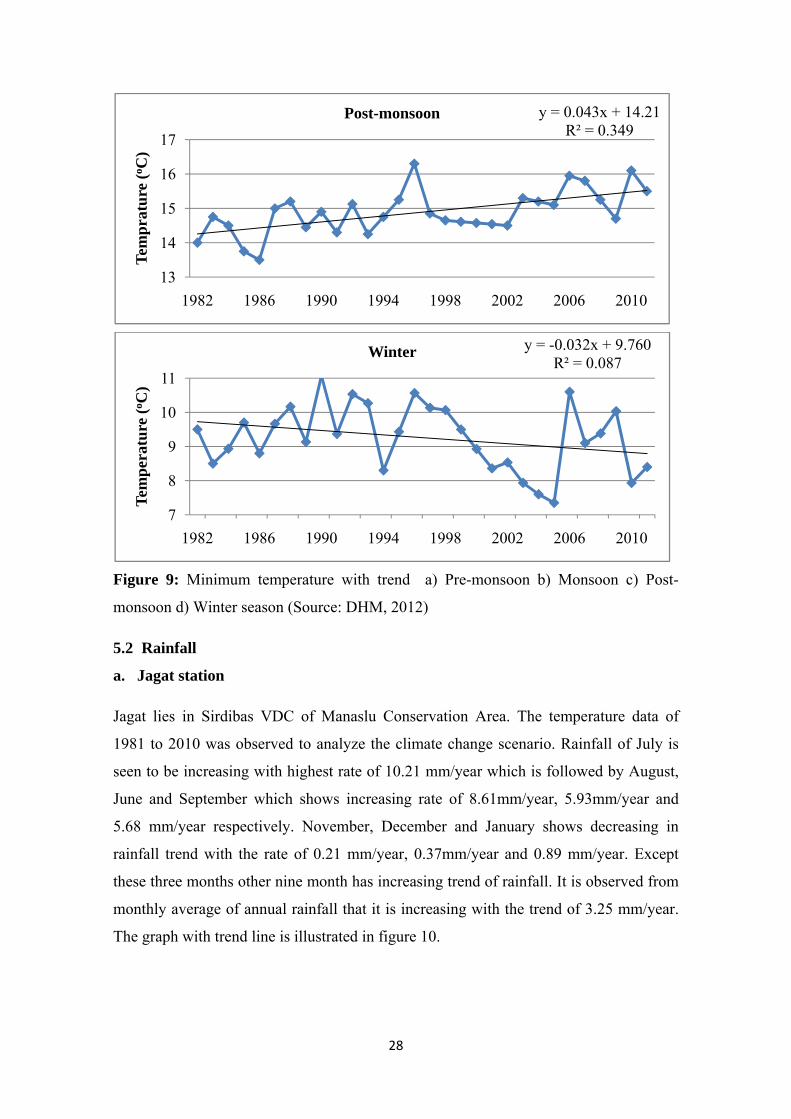
Analysis of the minimum temperature of Gorkha station shows that the minimum
temperature is increasing for pre-monsoon, monsoon and post-monsoon i.e at the rate of
0.022oC, 0.079oC and 0.043oC per year whereas decreasing for winter season at the rate
of -0.032oC per year. The seasonal minimum temperature is given in the following
figure 9.
y = 0.031x + 15.53R² = 0.211
1415161718
1982 1986 1990 1994 1998 2002 2006 2010
Tem
pera
ture
(o C)
Average minimum temperature
y = 0.022x + 16.13R² = 0.025
12
14
16
18
20
1982 1986 1990 1994 1998 2002 2006 2010
Tem
pera
ture
(o C)
Pre-monsoon
y = 0.079x + 20.07R² = 0.493
192021222324
1982 1986 1990 1994 1998 2002 2006 2010
Tem
pera
ture
(o C)
Monsoon
28
Figure 9: Minimum temperature with trend a) Pre-monsoon b) Monsoon c) Post-
monsoon d) Winter season (Source: DHM, 2012)
5.2 Rainfall
a. Jagat station
Jagat lies in Sirdibas VDC of Manaslu Conservation Area. The temperature data of
1981 to 2010 was observed to analyze the climate change scenario. Rainfall of July is
seen to be increasing with highest rate of 10.21 mm/year which is followed by August,
June and September which shows increasing rate of 8.61mm/year, 5.93mm/year and
5.68 mm/year respectively. November, December and January shows decreasing in
rainfall trend with the rate of 0.21 mm/year, 0.37mm/year and 0.89 mm/year. Except
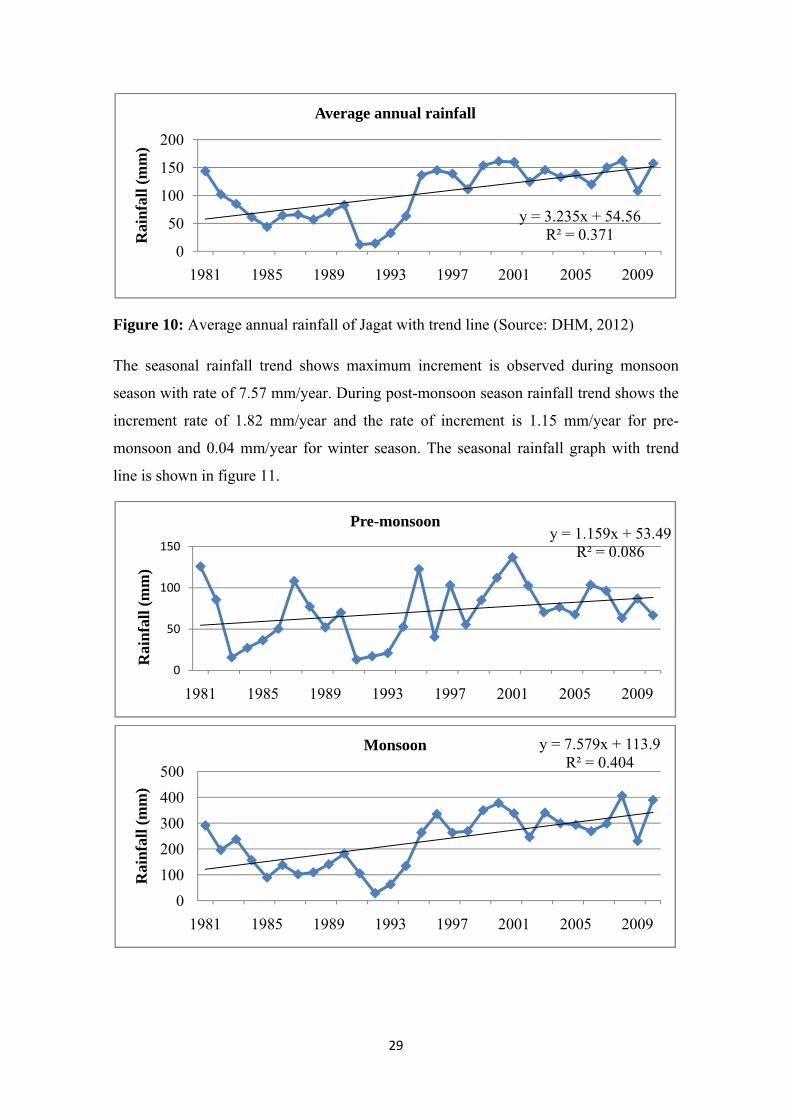
these three months other nine month has increasing trend of rainfall. It is observed from
monthly average of annual rainfall that it is increasing with the trend of 3.25 mm/year.
The graph with trend line is illustrated in figure 10.
y = 0.043x + 14.21R² = 0.349
13
14
15
16
17
1982 1986 1990 1994 1998 2002 2006 2010
Tem
prat
ure
(o C)
Post-monsoon
y = -0.032x + 9.760R² = 0.087
7
8
9
10
11
1982 1986 1990 1994 1998 2002 2006 2010
Tem
pera
ture
(o C)
Winter
29
Figure 10: Average annual rainfall of Jagat with trend line (Source: DHM, 2012)
The seasonal rainfall trend shows maximum increment is observed during monsoon
season with rate of 7.57 mm/year. During post-monsoon season rainfall trend shows the
increment rate of 1.82 mm/year and the rate of increment is 1.15 mm/year for pre-
monsoon and 0.04 mm/year for winter season. The seasonal rainfall graph with trend
line is shown in figure 11.
y = 3.235x + 54.56R² = 0.371
0
50
100
150
200
1981 1985 1989 1993 1997 2001 2005 2009
Rai
nfal
l (m
m)
Average annual rainfall
y = 1.159x + 53.49R² = 0.086
0
50
100
150
1981 1985 1989 1993 1997 2001 2005 2009
Rai
nfal
l (m
m)
Pre-monsoon
y = 7.579x + 113.9R² = 0.404
0100200300400500
1981 1985 1989 1993 1997 2001 2005 2009
Rai
nfal
l (m
m)
Monsoon
30
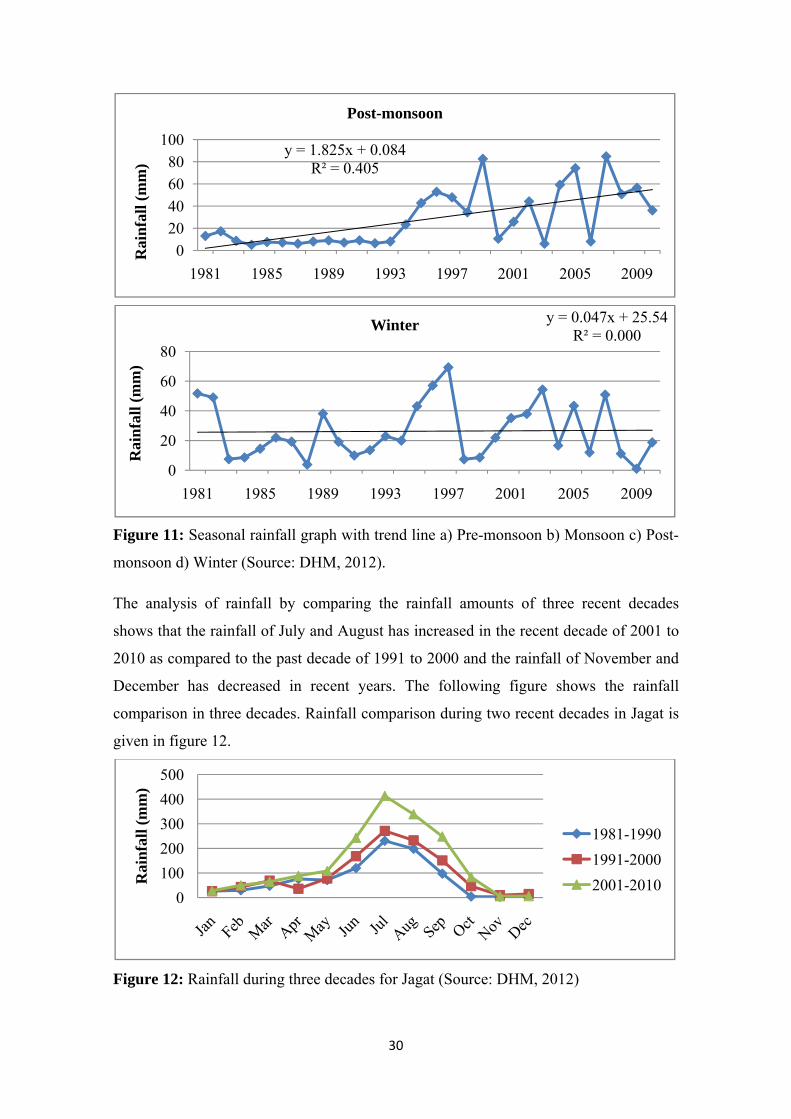
Figure 11: Seasonal rainfall graph with trend line a) Pre-monsoon b) Monsoon c) Post-
monsoon d) Winter (Source: DHM, 2012).
The analysis of rainfall by comparing the rainfall amounts of three recent decades
shows that the rainfall of July and August has increased in the recent decade of 2001 to
2010 as compared to the past decade of 1991 to 2000 and the rainfall of November and
December has decreased in recent years. The following figure shows the rainfall
comparison in three decades. Rainfall comparison during two recent decades in Jagat is
given in figure 12.
Figure 12: Rainfall during three decades for Jagat (Source: DHM, 2012)
y = 1.825x + 0.084R² = 0.405
020406080
100
1981 1985 1989 1993 1997 2001 2005 2009
Rai
nfal
l (m
m)
Post-monsoon
y = 0.047x + 25.54R² = 0.000
0
20
40
60
80
1981 1985 1989 1993 1997 2001 2005 2009
Rai
nfal
l (m
m)
Winter
0100200300400500
Rai
nfal
l (m
m)
1981-19901991-20002001-2010

31
b. Rainfall for Chame staion
Chame station is the nearest hydro-meteorological site taken to analyze the trend of
rainfall of Prok VDC. Average rainfall of Chame station shows the decreasing trend of
rainfall. The annual average rainfall shows the decreasing rate of -0.056 mm/year, the
graph of which with trend line is shown in figure 13.
Figure 13: Annual average rainfall for Chame station (Source: DHM, 2012)
The seasonal rainfall trend shows decrease in rainfall in all three seasons. Decrease rate
is highest in post monsoon followed by pre-monsoon and winter season which become
to be 1.94, 0.65 and 0.22 mm/year respectively. The monsoon rainfall is in increasing
trend with the rate of 1.44 mm/year. The graph of rainfall with trend line is shown in
figure 14.
y = -0.056x + 81.61R² = 0.000
0
50
100
150
1982 1986 1990 1994 1998 2002 2006 2010
Rai
nfal
l (m
m)
Annual average rainfall
y = -0.658x + 73.60R² = 0.065
020406080
100120
1982 1986 1990 1994 1998 2002 2006 2010
Rai
nfal
l (m
m)
Pre-monsoon
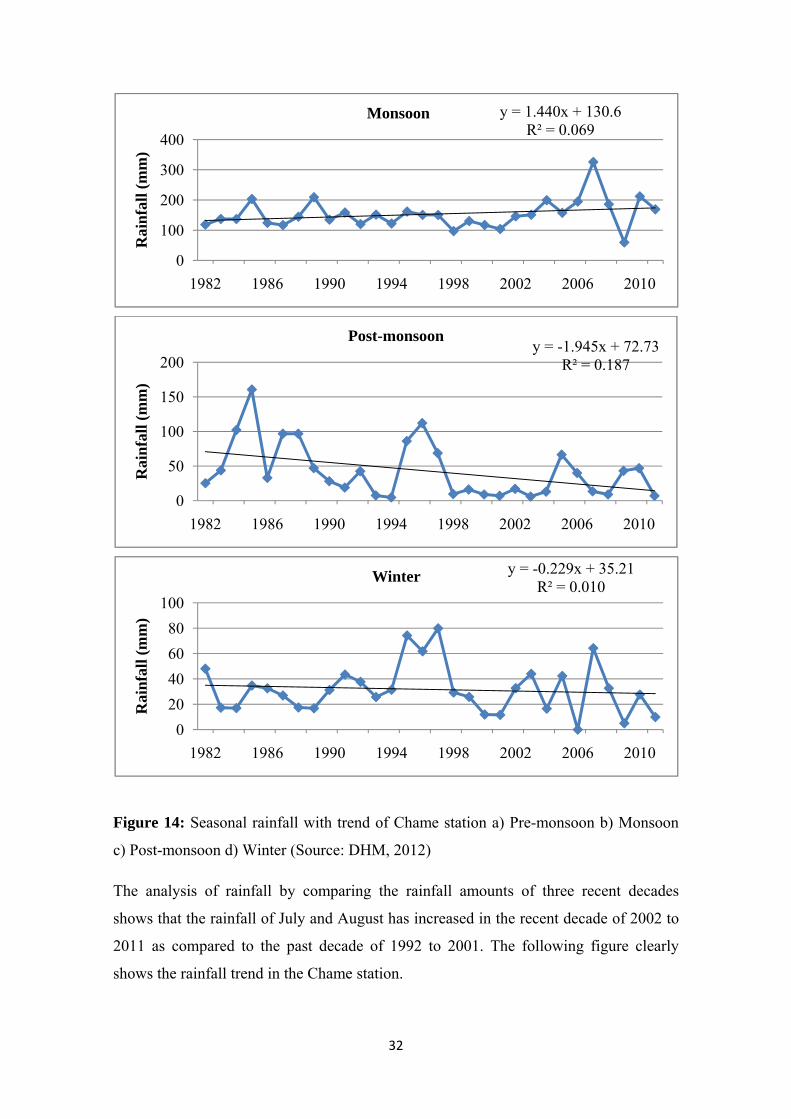
32
Figure 14: Seasonal rainfall with trend of Chame station a) Pre-monsoon b) Monsoon
c) Post-monsoon d) Winter (Source: DHM, 2012)
The analysis of rainfall by comparing the rainfall amounts of three recent decades
shows that the rainfall of July and August has increased in the recent decade of 2002 to
2011 as compared to the past decade of 1992 to 2001. The following figure clearly
shows the rainfall trend in the Chame station.
y = 1.440x + 130.6R² = 0.069
0
100
200
300
400
1982 1986 1990 1994 1998 2002 2006 2010
Rai
nfal
l (m
m)
Monsoon
y = -1.945x + 72.73R² = 0.187
0
50
100
150
200
1982 1986 1990 1994 1998 2002 2006 2010
Rai
nfal
l (m
m)
Post-monsoon
y = -0.229x + 35.21R² = 0.010
020406080
100
1982 1986 1990 1994 1998 2002 2006 2010
Rai
nfal
l (m
m)
Winter

33
Figure 15: Rainfall during three decades for Chame station (Source: DHM, 2012)
5.3 Discharge of Budhi Gandaki River
The discharge data of Budhi Gandaki at Arughat was obtained from the Department of
Hydrology and Meteorology.
a. Minimum Discharge
The analysis of mean minimum discharge shows that the minimum discharge is
decreasing at the rate of -0.39m3/s. The graph with trend line is shown in figure 16.
Figure 16: Annual minimum discharge with trend at Arughat station
The seasonal average minimum discharge trend shows that the discharges of three
seasons are in decreasing trend and whereas one season is in increasing trend. The
discharges of pre-monsoon is increasing at the rate of 0.263m3/sec whereas monsoon,
post-monsoon and winter are decreasing at the rate of 0.318m3/sec, 0.68m3/sec and
0.252m3/sec respectively.
0
50
100
150
200
250
Rai
nfal
l in
mm
1982-19911992-20012002-2011
y = -0.395x + 117.3R² = 0.083
55
75
95
115
135
1981 1985 1989 1993 1997 2001 2005 2009
Dis
char
ge (m
3 /s)

34
Figure 17: Seasonal minimum discharge with trend (Source: DHM, 2012)
y = 0.263x + 1014.R² = 0.243
1010
1015
1020
1025
1030
1981 1985 1989 1993 1997 2001 2005 2009
Dis
char
ge (m
3 /s)
Pre-monsoon
y = -0.318x + 244.1R² = 0.009
100
150
200
250
300
1981 1985 1989 1993 1997 2001 2005 2009
Dis
char
ge (m
3 /s)
Monsoon
y = -0.648x + 87.04R² = 0.242
50
70
90
110
130
1981 1985 1989 1993 1997 2001 2005 2009
Dis
char
ge (m
3 /s)
Post-monsoon
y = -0.252x + 36.36R² = 0.358
25
30
35
40
1981 1985 1989 1993 1997 2001 2005 2009
Dis
char
ge (m
3 /s)
Winter
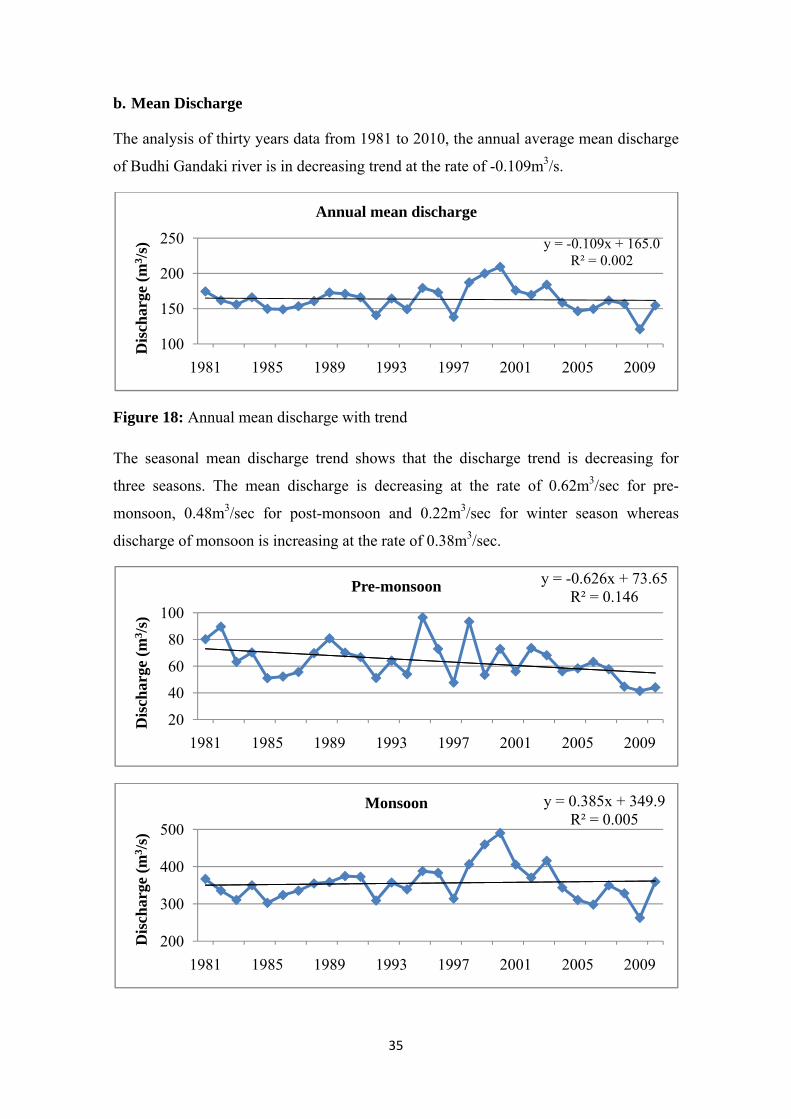
35
b. Mean Discharge
The analysis of thirty years data from 1981 to 2010, the annual average mean discharge
of Budhi Gandaki river is in decreasing trend at the rate of -0.109m3/s.
Figure 18: Annual mean discharge with trend
The seasonal mean discharge trend shows that the discharge trend is decreasing for
three seasons. The mean discharge is decreasing at the rate of 0.62m3/sec for pre-
monsoon, 0.48m3/sec for post-monsoon and 0.22m3/sec for winter season whereas
discharge of monsoon is increasing at the rate of 0.38m3/sec.
y = -0.109x + 165.0R² = 0.002
100
150
200
250
1981 1985 1989 1993 1997 2001 2005 2009
Dis
char
ge (m
3 /s)
Annual mean discharge
y = -0.626x + 73.65R² = 0.146
20
40
60
80
100
1981 1985 1989 1993 1997 2001 2005 2009
Dis
char
ge (m
3 /s)
Pre-monsoon
y = 0.385x + 349.9R² = 0.005
200
300
400
500
1981 1985 1989 1993 1997 2001 2005 2009
Dis
char
ge (m
3 /s)
Monsoon

36
Figure 19: Seasonal mean discharge with trend (Source: DHM, 2012)
c. Maximum Discharge
The analysis of annual maximum discharge shows that the maximum discharge is
increasing at the rate of 0.51m3/s. The graph with trend line is shown in figure 20.
Figure 20:Annual maximum discharge with trend
Analysis of the seasonal trend of maximum discharge shows the decreasing trend for
one season. The discharge is decreasing at the rate of 0.34m3/sec for winter whereas the
y = -0.849x + 124.5R² = 0.144
50
100
150
200
1981 1985 1989 1993 1997 2001 2005 2009
Dis
char
ge (m
3 /s)
Post- monsoon
y = -0.224x + 40.98R² = 0.316
30
35
40
45
50
1981 1985 1989 1993 1997 2001 2005 2009
Dis
char
ge (m
3 /s)
Winter
y = 0.514x + 243.1R² = 0.018
150
200
250
300
350
1981 1985 1989 1993 1997 2001 2005 2009
Dis
char
ge (m
3 /s)
Annual maximum discharge
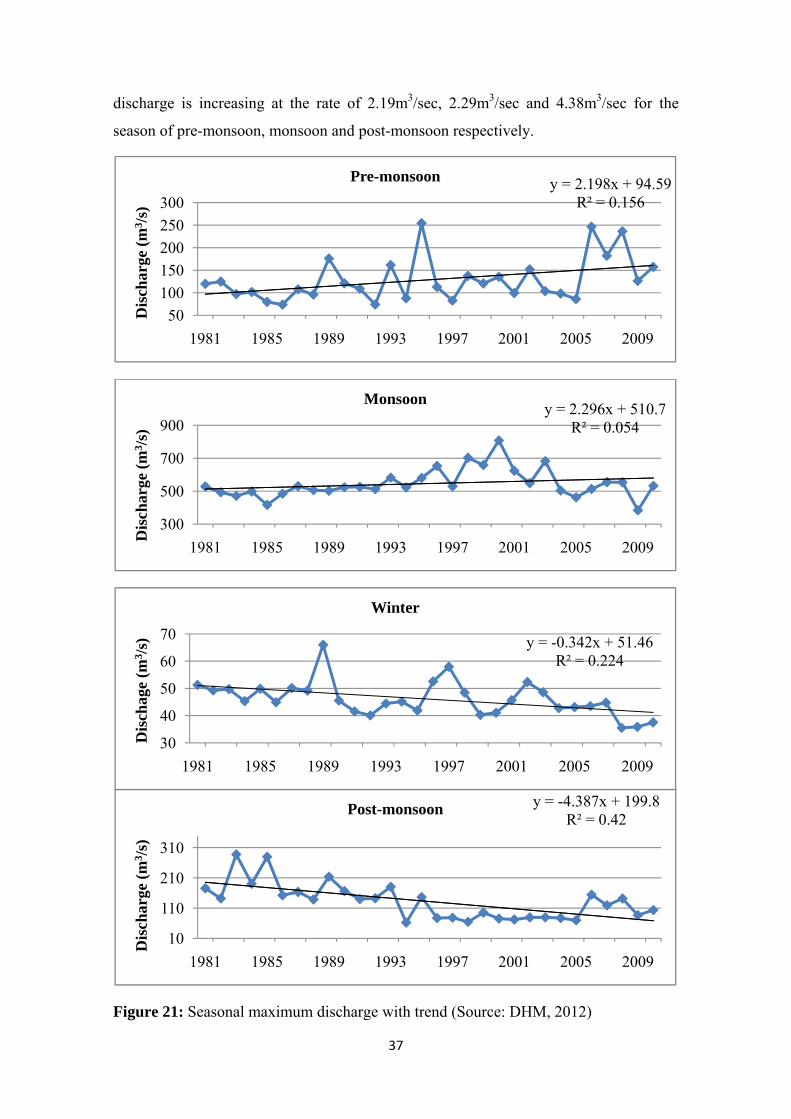
37
discharge is increasing at the rate of 2.19m3/sec, 2.29m3/sec and 4.38m3/sec for the
season of pre-monsoon, monsoon and post-monsoon respectively.
Figure 21: Seasonal maximum discharge with trend (Source: DHM, 2012)
y = 2.198x + 94.59R² = 0.156
50100150200250300
1981 1985 1989 1993 1997 2001 2005 2009
Dis
char
ge (m
3 /s)
Pre-monsoon
y = 2.296x + 510.7R² = 0.054
300
500
700
900
1981 1985 1989 1993 1997 2001 2005 2009
Dis
char
ge (m
3 /s)
Monsoon
y = -4.387x + 199.8R² = 0.42
10
110
210
310
1981 1985 1989 1993 1997 2001 2005 2009
Dis
char
ge (m
3 /s)
Post-monsoon
y = -0.342x + 51.46R² = 0.224
30
40
50
60
70
1981 1985 1989 1993 1997 2001 2005 2009
Dis
chag
e (m
3 /s)
Winter

38
5.4 General Information about the Respondents
According to sex category, out of total, 66.67% of the respondents were male and
33.33% were female. But females were not willing to put their names into the survey in
front of their male counterparts.
The respondents were from 30 to 71 years age group. Only 14% of the respondents were
below 35 years and 67% of them were from the age group of 35-65 years. About 19% of
the respondents were the age of more than 65 years.
As per the education level, the biggest group was of just literate (13%), following
having school education (12%) and totally illiterate (67%). The persons having higher
education were only about 8%.
Agriculture was the main source of income in the area. Majority were farmer
representing 80% of the total. Of the remaining population 5% have their own business
and another 11% were involving in service and 4% were in trekking. It shows that the
majority of the populations are very vulnerable to the effect of climate change in
agricultural sector. Almost all of them, (91%) were living at the village of present
residence since the birth and only 9% were migrated from elsewhere.
Table 2: Social characteristics of the sampled respondents/HHs
Characteristics % Characteristics %
Gender Occupation
Male 67 Agriculture 80%
Female 33 Business 5%
Caste Service 11%
Lama/Bhote 100 Labour 4%

Char
Age
Yout
Adul
Elder
(Sou
5.5 U
Perce
area
5.5.1
a. W
Amo
peop
temp
and 1
had n
Figu
temp
010203040506070
racteristics
group
ths (< 35 ye
lt (35-55 ye
rly (> 55 ye
urce: Field su
Understand
eption or un
is discussed
1 Temperat
Winter Tem
ong the resp
ple commen
perature. Ab
18% didn’t
no idea on t
ure 22: Per
perature
0%0%0%0%0%0%0%0%
Inc
s
ears)
ears)
ears)
urvey, 2012
ding of Peo
nderstandin
d under this
ture
mperature
pondents, 58
nted that the
bout 19% o
felt the diff
this matter.
rcentage of
58%
creasing
%
14%
67%
19%
2)
ople to Clim
ng of people
s section.
8% felt that
ey are expe
of the respo
ference in w
f responden
19
Decre
Wi
39
Charac
Educat
Illiterat
Just lite
Under S
mate Chang
e about ongo
t winter tem
eriencing w
ondents felt
winter tempe
nt reportin
%
easing
inter temper
cteristics
tion
te
erate
S.L.C
ge
oing climate
mperature is
warm and co
that winter
erature as c
g the direc
18%
Same
rature
e change in
s increasing
omfortable
r temperatu
ompared to
ction of ch
%
67%
13%
12%
n the surroun
g and mostl
due to incr
ure is decre
o the past an
hange in w
5%
No idea
nding
ly old
eased
easing
nd 5%
winter

b. Su
Abou
that s
summ
share
Figu
5.5.2
a. C
Almo
rainy
rain
in tim
has c
rainf
they
time
01020304050607080
ummer Tem
ut 70% of th
summer tem
mer temper
ed that they
ure 23: Perc
2 Rainfall P
hange in ra
ost all the r
y season sta
occurred m
me of rainfa
changed, i.e
fall time has
have no an
has change
0%0%0%0%0%0%0%0%0%
In
mperature
he responde
mperature is
rature is sam
have starte
centage of p
Pattern
ainfall patt
respondents
arted from
mostly from
all are differ
e., decrease
s increased
ny idea rega
ed since last
70%
ncreased
ents felt tha
s decreasing
me as befo
ed to grow g
people repor
tern
shared that
second wee
first week o
rent. Most o
ed since fiv
since last s
arding chan
t 5.5 years a
3%
Decre
Sum
40
at summer t
g. About 24
ore. About
green vegeta
rting in sum
t time of rai
ek of June
of July. Ho
of the respo
ve years. Sim
ix years. Re
nge in rainfa
as per the qu
%
eased
mmer tempe
temperature
4% of the re
3% had no
ables as tem
mmer temper
iny season h
in study ar
wever, resp
ondents (65
milarly, 21%
emaining 14
fall pattern.
uestionnaire
24%
Same
erature
e is increasin
espondents
o idea on th
mperature el
rature
have altered
ea. But in r
ponses regar
%) said tha
% responde
4% of respo
On an aver
e survey.
ng. Only 3%
experienced
his matter.
evated.
d. In genera
recent year
rding the ch
at time of ra
ents though
ondents said
rage, the ra
3%
No idea
% felt
d that
They
al, the
s, the
hange
ainfall
ht that
d that
ainfall

Figu
Almo
chan
short
amou
of ra
amou
7% r
25).
on an
Figu
b. CWhil
it has
0
10
20
30
40
50
60
70
010203040506070
ure 24: Perc
ost all resp
nged. Accor
t duration. W
unt and inte
ainfall was
unt and inte
respondents
As per the
n average.
ure 25: Perc
hange in ra
le discussin
s also chang
0%
0%
0%
0%
0%
0%
0%
0%
0%0%0%0%0%0%0%0%
ception of re
pondents h
rding to res
While askin
ensity of rai
short with
ensity of rain
s said that th
responses t
ception of r
ainfall patt
ng on chang
ged. Accord
31%
Increase
21%
Increase
espondents
have percei
spondents, r
ng about the
in, 62% res
high intens
n has chang
hey have no
the rainfall
respondents
tern in wint
ge in rainfal
ding to the r
41
regarding c
ived that i
recent rainf
e numbers o
spondents sh
sity since la
ged, i.e., inc
o any idea a
intensity an
regarding c
ter
l pattern in
respondents
62%
Decrea
65%
Decrea
change in ra
intensity an
fall occurs
of years tha
hared that i
ast six year
creased sinc
about chang
nd amount h
change in am
winter, all
s, in the pas
ase
%
ase
infall patter
nd amount
with high
at the learnt
it has chang
rs. Similarly
ce last five y
ge in amoun
has changed
mount of ra
the respond
st, winter ra
7
Don't
1
Don't
rn
of rainfal
intensity fo
about chan
ged; the dur
y, 31% said
years. Rema
nt of rain (F
d since 5.5
ain
dents agreed
ainfall to occ
%
t know
4%
t know
l has
or the
nge in
ration
d that
aining
Figure
years
d that
cur in
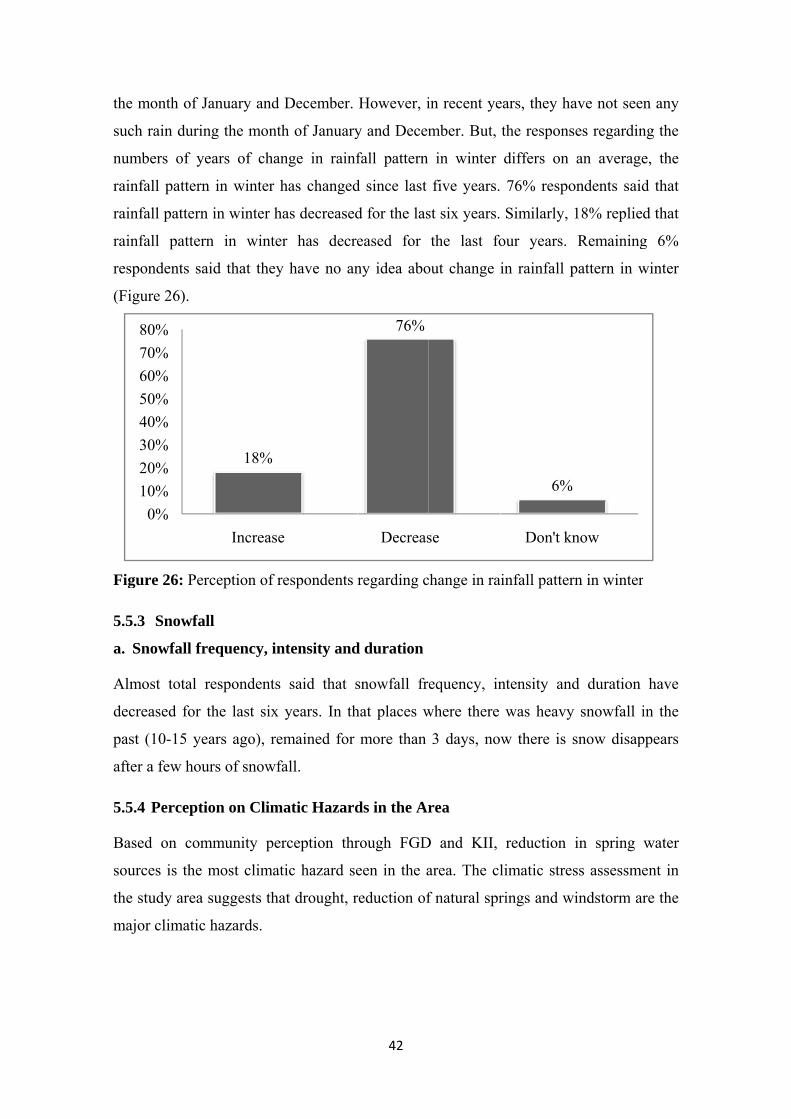
the m
such
numb
rainf
rainf
rainf
respo
(Figu
Figu
5.5.3
a. Sn
Almo
decre
past
after
5.5.4
Base
sourc
the s
majo
12345678
month of Ja
rain during
bers of yea
fall pattern
fall pattern i
fall pattern
ondents said
ure 26).
ure 26: Perc
3 Snowfall
nowfall fre
ost total re
eased for th
(10-15 yea
a few hour
4 Perceptio
ed on comm
ces is the m
tudy area su
or climatic h
0%10%20%30%40%50%60%70%80%
anuary and D
g the month
ars of chan
in winter h
in winter ha
in winter
d that they
ception of re
equency, int
espondents
he last six y
ars ago), rem
rs of snowfa
on on Clima
munity per
most climati
uggests that
hazards.
18%
Increase
December.
h of January
nge in rainf
has changed
as decreased
r has decre
have no an
espondents
tensity and
said that s
years. In th
mained for
all.
atic Hazard
rception thr
ic hazard se
t drought, r
42
However, i
y and Decem
fall pattern
d since last
d for the las
eased for
ny idea abo
regarding c
d duration
snowfall fre
hat places w
more than
ds in the Ar
rough FGD
een in the a
reduction of
76%
Decreas
in recent ye
mber. But,
in winter
five years.
st six years.
the last fo
out change i
change in ra
equency, in
where there
3 days, no
rea
D and KII,
area. The cl
f natural spr
se
ears, they ha
the respons
differs on
76% respo
Similarly,
our years.
in rainfall p
infall patter
ntensity and
was heavy
w there is
reduction
limatic stre
rings and w
6%
Don't kn
ave not seen
ses regardin
an average
ondents said
18% replied
Remaining
pattern in w
rn in winter
d duration
y snowfall i
snow disap
in spring
ss assessme
windstorm ar
%
now
n any
ng the
e, the
d that
d that
g 6%
winter
r
have
in the
ppears
water
ent in
re the
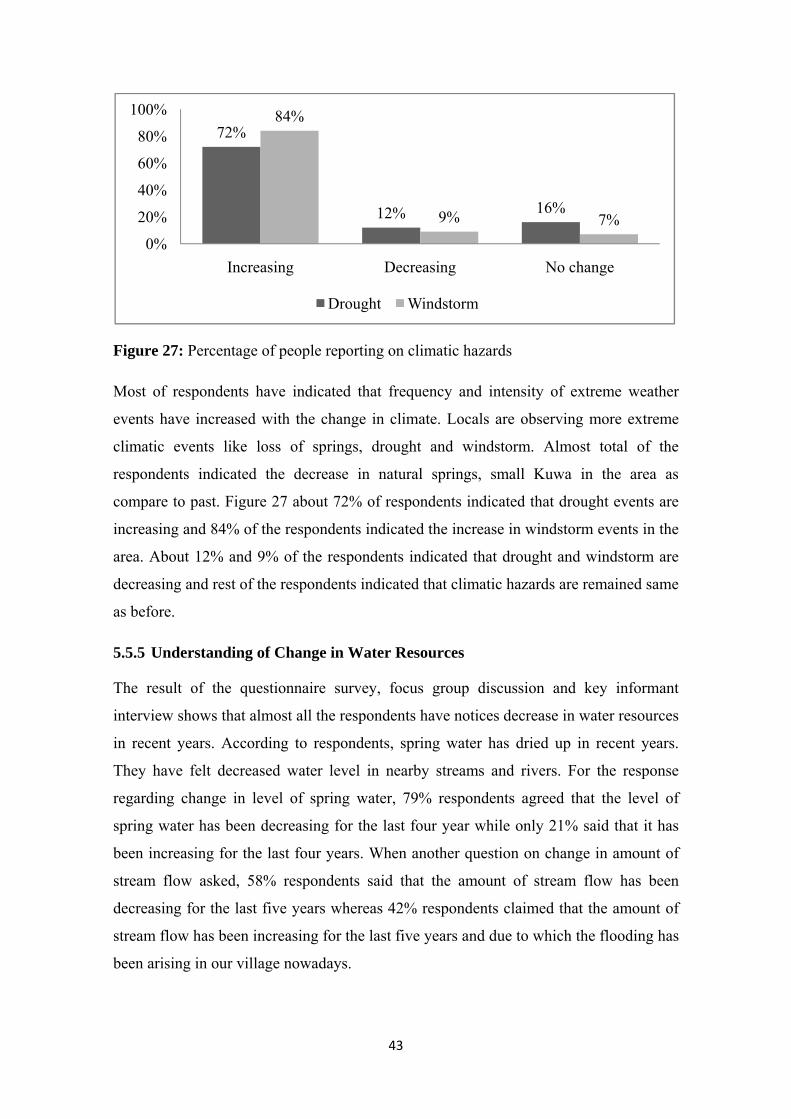
43
Figure 27: Percentage of people reporting on climatic hazards
Most of respondents have indicated that frequency and intensity of extreme weather
events have increased with the change in climate. Locals are observing more extreme
climatic events like loss of springs, drought and windstorm. Almost total of the
respondents indicated the decrease in natural springs, small Kuwa in the area as
compare to past. Figure 27 about 72% of respondents indicated that drought events are
increasing and 84% of the respondents indicated the increase in windstorm events in the
area. About 12% and 9% of the respondents indicated that drought and windstorm are
decreasing and rest of the respondents indicated that climatic hazards are remained same
as before.
5.5.5 Understanding of Change in Water Resources
The result of the questionnaire survey, focus group discussion and key informant
interview shows that almost all the respondents have notices decrease in water resources
in recent years. According to respondents, spring water has dried up in recent years.
They have felt decreased water level in nearby streams and rivers. For the response
regarding change in level of spring water, 79% respondents agreed that the level of
spring water has been decreasing for the last four year while only 21% said that it has
been increasing for the last four years. When another question on change in amount of
stream flow asked, 58% respondents said that the amount of stream flow has been
decreasing for the last five years whereas 42% respondents claimed that the amount of
stream flow has been increasing for the last five years and due to which the flooding has
been arising in our village nowadays.
72%
12% 16%
84%
9% 7%0%
20%
40%
60%
80%
100%
Increasing Decreasing No change
Drought Windstorm

44
Figure 28: Perception of respondents regarding on change in water resources
But on the other hand, there were divided opinions on the reasons for such decreasing of
water sources such as due to deforestation, due to landslides, due to changes climatic
variability etc. When it was tried to analyze the relationship of age group, education and
profession of the respondents with the decrease in springs, it was found that the
responses were strongly dependent on their profession, but independent on age group
and education level. The people with the profession of agriculture were more sensitive
to the decrease in spring water sources.
5.6 Impacts of Climate Change
Climate change is going to be a burning issue in study area. Locals have perceived
changes in their local environment around their surroundings. Most importantly the
impacts have been seen in water resources, agriculture, human health and biodiversity.
Impacts on various factors have been discussed in subsequent paragraphs.
21%
42%
79%
58%
0%10%20%30%40%50%60%70%80%90%
Change in level of spring water Change in amount of stream flow
Increased Decreased
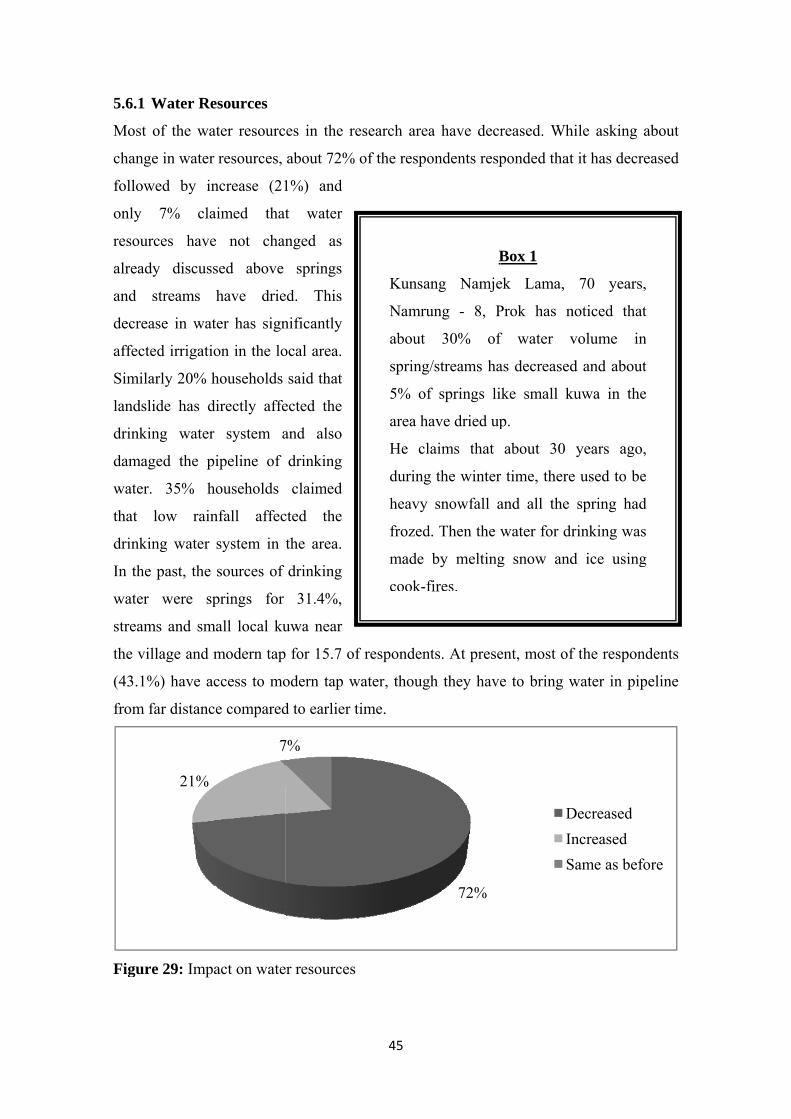
5.6.1
Most
chan
follo
only
resou
alrea
and
decre
affec
Simi
lands
drink
dama
wate
that
drink
In th
wate
strea
the v
(43.1
from
Figu
1 Water Re
t of the wa
nge in water
wed by in
7% cla
urces have
ady discuss
streams
ease in wat
cted irrigatio
larly 20% h
slide has d
king water
aged the p
r. 35% h
low rain
king water
he past, the
r were sp
ams and sm
village and m
1%) have ac
m far distanc
ure 29: Impa
21%
esources
ater resourc
resources,
ncrease (21
aimed that
e not chan
sed above
have drie
ter has sign
on in the lo
households
directly affe
system a
ipeline of
households
nfall affec
system in t
sources of
prings for
mall local ku
modern tap
ccess to mo
ce compared
act on wate
7
es in the re
about 72%
1%) and
t water
nged as
springs
d. This
nificantly
ocal area.
said that
ected the
and also
drinking
claimed
cted the
the area.
drinking
31.4%,
uwa near
for 15.7 of
odern tap w
d to earlier t
r resources
7%
45
esearch area
of the respo
f responden
water, thoug
time.
Kunsa
Namru
about
spring
5% of
area ha
He cl
during
heavy
frozed
made
cook-f
a have decr
ondents resp
nts. At prese
gh they have
72%
B
ang Namje
ung - 8, P
30% of
g/streams ha
f springs li
ave dried up
laims that
g the winter
snowfall a
d. Then the w
by melting
fires.
reased. Wh
ponded that
ent, most of
e to bring w
DInS
Box 1
ek Lama,
Prok has n
f water v
as decreased
ike small k
p.
about 30
r time, there
and all the
water for dr
g snow and
hile asking
t it has decr
f the respon
water in pip
Decreasedncreased
Same as befo
70 years,
noticed that
volume in
d and about
kuwa in the
years ago,
e used to be
spring had
rinking was
d ice using
about
eased
ndents
peline
fore
,
t
n
t
e
,
e
d
s
g

5.6.1
Whil
in ag
respo
produ
them
produ
and r
has r
case
that
vege
reduc
that i
the c
bean
summ
decre
asser
for d
Figu
1.1 Impact
le asking ag
gricultural
ondents sai
uction has
m, 53%
uction has g
remaining 3
reduced hug
for winter
winter cro
tables etc.
ced and r
it is same as
case of sum
ns, etc) 7
mer crops
eased and re
rted that cli
decrease in p
ure 30: Resp
35%
on Agricul
gricultural p
production
id that agri
reduced.
said that
gone down
35% claime
gely. Same
r crops, 82
ops (whea
.) producti
remaining
s before wh
mmer crops
8% claime
s productio
emaining sa
imate chang
production i
ponses on im
12%
lture
productivity
in recent
icultural
Out of
t crop
slightly
ed that it
was the
2% said
t, karu,
ion has
claimed
hereas in
(maize,
ed that
on has
aid that it is
ge has impa
is unevenly
mpact of cli
46
y during fie
years in co
same as be
acted in the
and untime
imate chang
Kimlu
feels t
Increas
uneven
for dec
He cla
occurre
few ye
impact
eld study, lo
omparison
efore. With
agricultura
ely rainfall.
ge on agricu
53%
B
ung Lama,
that the c
sing trend
nly rainfall
creasing ag
aims that l
ed in winte
ears which
on the prod
ocals have n
to the last
these facts
al productio
ultural produ
SlightHighlSame
Box 2
65, Chhak,
climate has
of temper
are the m
gricultural p
little bit ra
er season f
h has mad
duction of c
noticed dec
t 15 years.
in hand it c
on. Main re
uction.
tly decreasey decreasedas before
, Prok – 7
s changed.
rature and
main causes
production.
ainfall also
for the last
de negative
crops.
crease
88%
can be
asons
edd
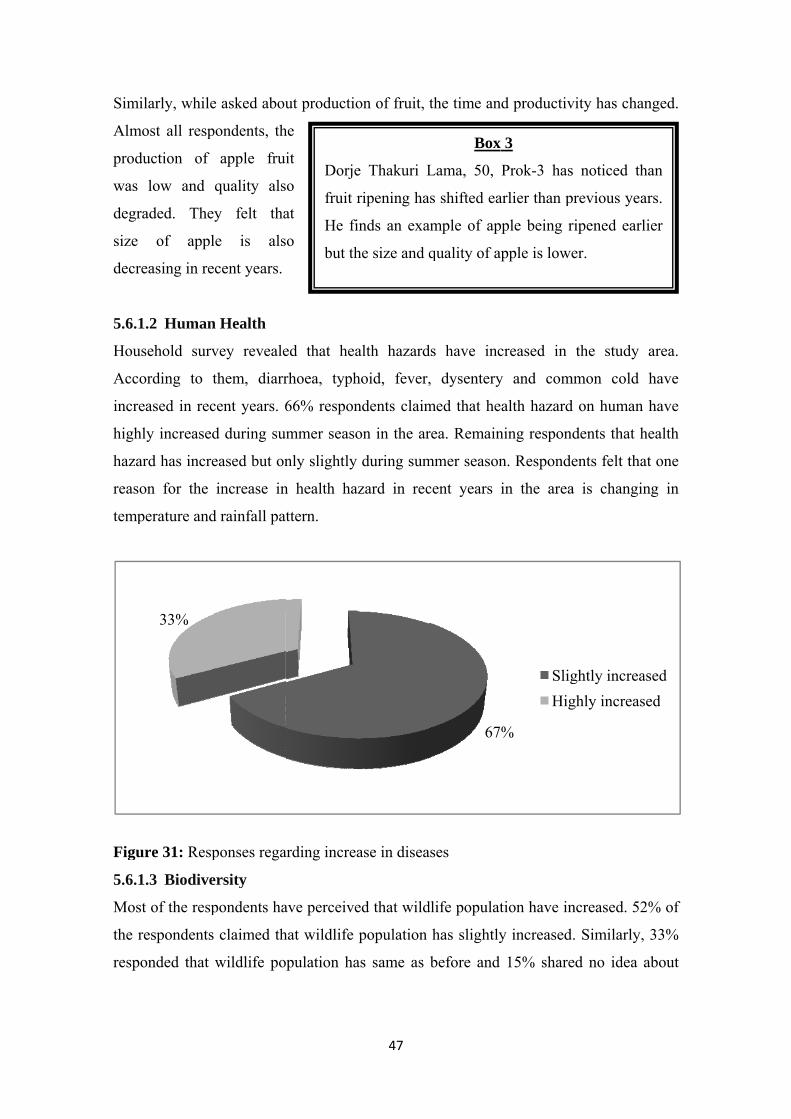
Simi
Almo
produ
was
degra
size
decre
5.6.1
Hous
Acco
incre
highl
hazar
reaso
temp
Figu
5.6.1
Most
the r
respo
larly, while
ost all resp
uction of
low and
aded. They
of appl
easing in re
1.2 Human
sehold surv
ording to t
eased in rec
ly increased
rd has incre
on for the
perature and
ure 31: Resp
1.3 Biodive
t of the resp
respondents
onded that
33%
e asked abou
pondents, th
apple frui
quality als
y felt tha
e is als
cent years.
n Health
vey reveale
them, diarr
cent years. 6
d during sum
eased but on
increase in
d rainfall pat
ponses rega
ersity
pondents ha
claimed th
wildlife po
Dorje
fruit r
He fi
but th
ut productio
he
it
o
at
o
ed that hea
rhoea, typh
66% respon
mmer seaso
nly slightly
n health ha
ttern.
arding increa
ave perceive
hat wildlife
pulation ha
47
e Thakuri L
ripening ha
inds an exa
he size and q
on of fruit,
alth hazard
hoid, fever,
ndents claim
on in the ar
during sum
zard in rec
ase in disea
ed that wild
population
as same as
Box
Lama, 50,
as shifted ea
ample of ap
quality of a
the time an
ds have inc
, dysentery
med that he
rea. Remain
mmer season
cent years
ases
dlife populat
has slightly
before and
67
x 3
Prok-3 has
arlier than p
pple being r
apple is lowe
nd productiv
creased in
y and com
ealth hazard
ning respon
n. Responde
in the area
tion have in
y increased
15% share
%
SligHig
s noticed th
previous yea
ripened earl
er.
vity has cha
the study
mmon cold
d on human
dents that h
ents felt tha
a is changin
ncreased. 52
d. Similarly,
ed no idea
ghtly increaghly increas
han
ars.
lier
anged.
area.
have
have
health
at one
ng in
2% of
, 33%
about
asedsed

that.
have
Figu
Simi
decre
decli
speci
notic
fores
plant
in the
As per the
slightly inc
ure 32: Resp
larly, 55%
eased in re
ined due to
ies has incr
ced differen
st. Banmara
ts with blui
e field.
33%
general obs
creased in re
ponses rega
respondent
cent years.
decrease in
reased and 2
nt types of
a weed; Kan
sh flower h
15%
servation of
ecent years
arding chang
ts said that
They also
n water sour
25% focuse
f invasive w
nde Banma
have found i
48
f local respo
.
ge in wildlif
t the local a
felt that g
ces in the ar
d on no any
weeds in th
ara (Lantana
in the area b
ondents the
fe populatio
and indigen
green vegeta
rea. 20% re
y change in
heir agricul
a camera) a
but before 2
52%
number of l
on
nous wild s
ables such
espondents c
n the area. L
ltural field
and Gandhe
20 years the
SlighSameNo id
lizard, snak
species has
as ‘Simsag
claimed tha
Local people
and comm
e (Ageratum
ey were not
htly increasee as beforedea
ke etc.
been
g’ are
at new
e also
munity
m sp.)
t seen
ed
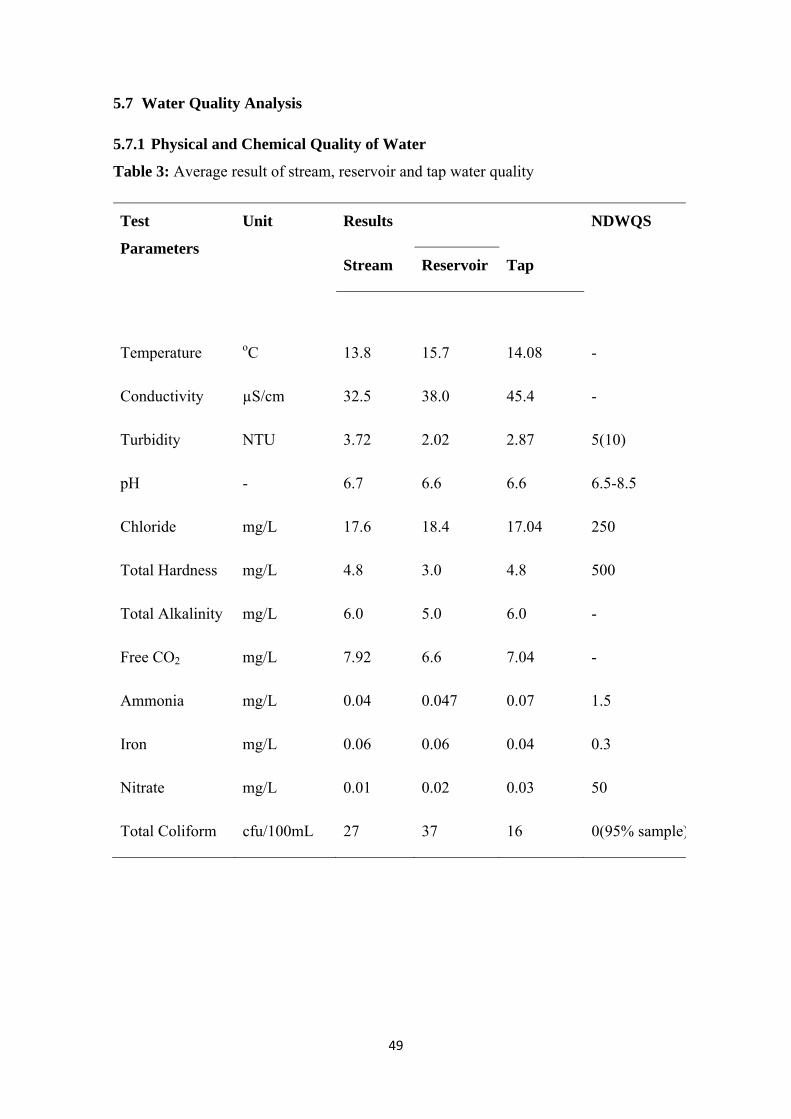
49
5.7 Water Quality Analysis
5.7.1 Physical and Chemical Quality of Water
Table 3: Average result of stream, reservoir and tap water quality
Test
Parameters
Unit Results NDWQS
Stream Reservoir Tap
Temperature oC 13.8 15.7 14.08 -
Conductivity µS/cm 32.5 38.0 45.4 -
Turbidity NTU 3.72 2.02 2.87 5(10)
pH - 6.7 6.6 6.6 6.5-8.5
Chloride mg/L 17.6 18.4 17.04 250
Total Hardness mg/L 4.8 3.0 4.8 500
Total Alkalinity mg/L 6.0 5.0 6.0 -
Free CO2 mg/L 7.92 6.6 7.04 -
Ammonia mg/L 0.04 0.047 0.07 1.5
Iron mg/L 0.06 0.06 0.04 0.3
Nitrate mg/L 0.01 0.02 0.03 50
Total Coliform cfu/100mL 27 37 16 0(95% sample)
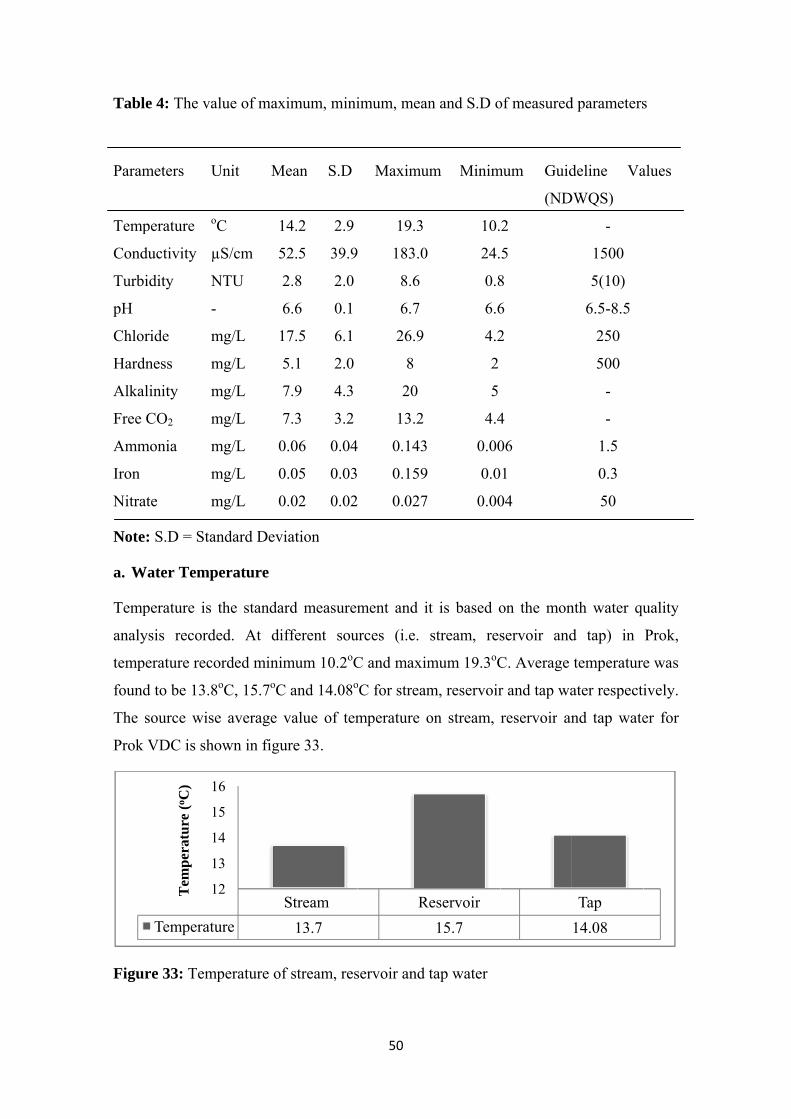
Tabl
Param
Temp
Cond
Turb
pH
Chlo
Hard
Alka
Free
Amm
Iron
Nitra
Note
a. W
Temp
analy
temp
found
The
Prok
Figu
le 4: The va
meters U
perature o
ductivity µ
bidity N
-
oride m
dness m
alinity m
CO2 m
monia m
m
ate m
e: S.D = Sta
Water Temp
perature is
ysis record
perature reco
d to be 13.8
source wis
k VDC is sho
ure 33: Tem
Temperatu
1
1
1
1
1
Tem
pera
ture
(o C)
alue of max
Unit Me
oC 1
µS/cm 5
NTU 2
- 6
mg/L 1
mg/L 5
mg/L 7
mg/L 7
mg/L 0
mg/L 0
mg/L 0
andard Devi
perature
the standar
ded. At dif
orded minim
8oC, 15.7oC
e average v
own in figu
mperature of
Sure
12
13
14
15
16
imum, mini
ean S.D
4.2 2.9
2.5 39.9
2.8 2.0
6.6 0.1
7.5 6.1
5.1 2.0
7.9 4.3
7.3 3.2
.06 0.04
.05 0.03
.02 0.02
iation
rd measurem
fferent sou
mum 10.2oC
and 14.08o
value of tem
ure 33.
f stream, res
Stream 13.7
50
imum, mean
Maximu
19.3
183.0
8.6
6.7
26.9
8
20
13.2
4 0.143
0.159
0.027
ment and it
urces (i.e.
C and maximoC for stream
mperature o
servoir and t
R
n and S.D o
m Minim
10.
24.
0.8
6.6
4.2
2
5
4.4
0.00
0.0
0.00
t is based o
stream, res
mum 19.3oC
m, reservoir
on stream,
tap water
eservoir15.7
of measured
mum Guid
(ND
2
5
8
6
2
4
06
1
04
on the mon
servoir and
C. Average
r and tap wa
reservoir an
d parameters
deline Va
DWQS)
-
1500
5(10)
6.5-8.5
250
500
-
-
1.5
0.3
50
nth water qu
d tap) in
temperature
ater respecti
nd tap wate
Tap14.08
s
alues
uality
Prok,
e was
ively.
er for
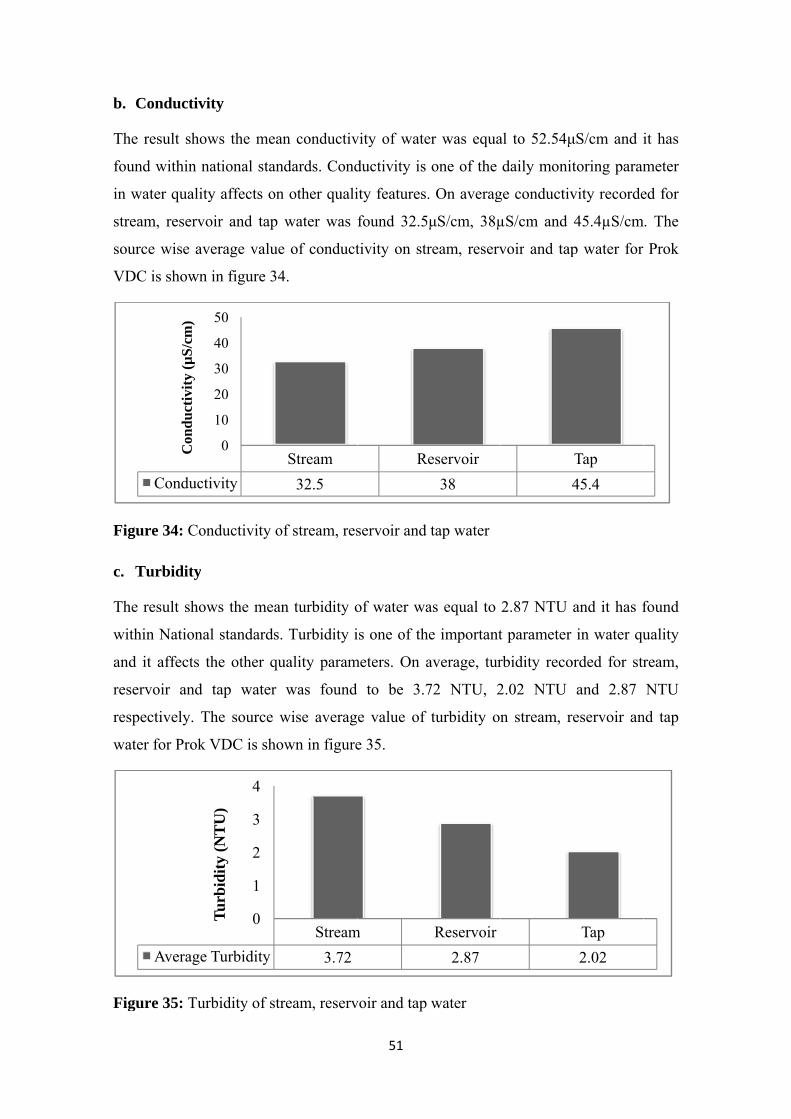
b. C
The
found
in wa
strea
sourc
VDC
Figu
c. T
The
withi
and i
reser
respe
wate
Figu
Conductivit
result show
d within na
ater quality
am, reservoi
ce wise ave
C is shown i
ure 34: Con
Turbidity
result show
in National
it affects th
rvoir and t
ectively. Th
r for Prok V
ure 35: Turb
Conductiv
2
4
Con
duct
ivity
(µS/
cm)
Average T
Tbi
di(N
TU
)
ty
ws the mean
ational stand
y affects on
ir and tap w
erage value
in figure 34
ductivity of
ws the mean
standards.
he other qu
tap water w
he source w
VDC is show
bidity of stre
vity
0
10
20
30
40
50
Turbidity
0
1
2
3
4
Turb
idity
(NT
U)
n conductiv
dards. Cond
other quali
water was
of conduct
.
f stream, res
n turbidity o
Turbidity i
ality param
was found
wise averag
wn in figure
eam, reserv
Stream32.5
Stream3.72
51
vity of wate
ductivity is
ity features.
found 32.5
tivity on str
servoir and
of water wa
is one of the
meters. On a
to be 3.7
e value of
e 35.
voir and tap
Re
m
er was equa
one of the
. On averag
μS/cm, 38µ
ream, reserv
tap water
as equal to
e important
average, tur
72 NTU, 2
turbidity on
water
eservoir38
Reservoir2.87
al to 52.54μ
daily monit
ge conductiv
µS/cm and
voir and tap
2.87 NTU
t parameter
rbidity reco
2.02 NTU
n stream, r
μS/cm and i
toring param
vity recorde
45.4µS/cm
p water for
and it has f
in water qu
orded for str
and 2.87
reservoir an
Tap45.4
Tap2.02
it has
meter
ed for
m. The
Prok
found
uality
ream,
NTU
nd tap
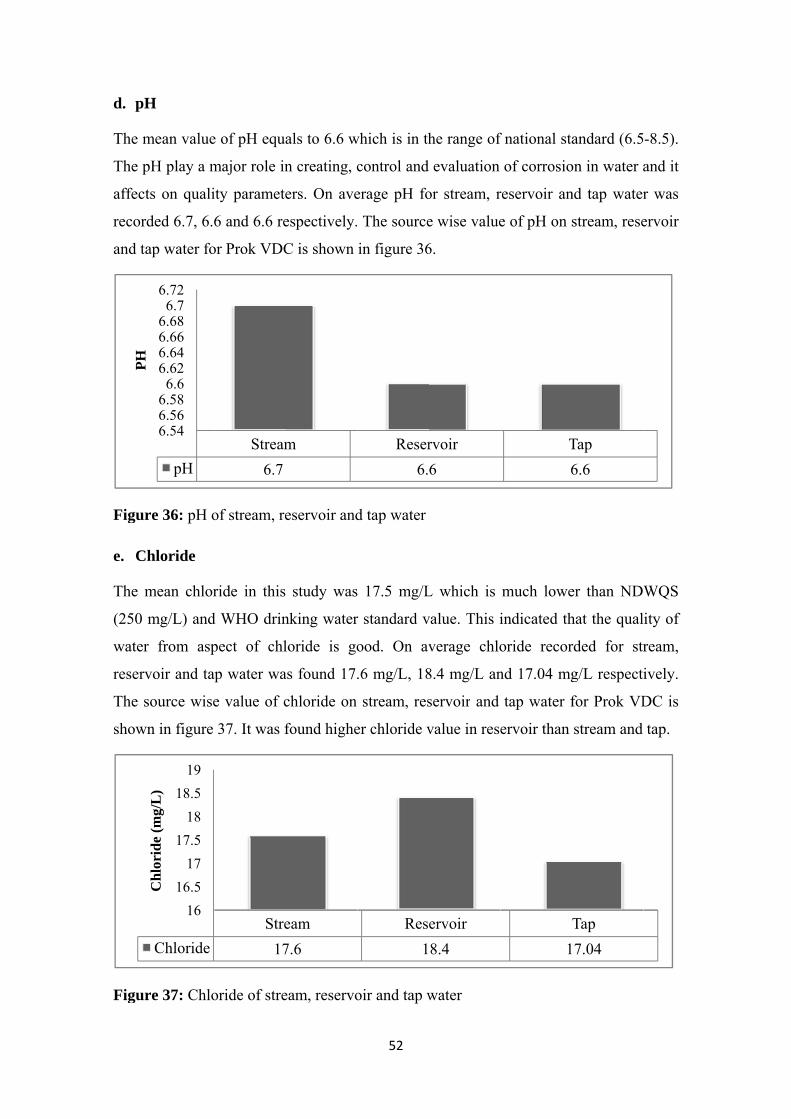
d. p
The m
The p
affec
recor
and t
Figu
e. C
The
(250
wate
reser
The
show
Figu
PH
pH
mean value
pH play a m
cts on quali
rded 6.7, 6.6
tap water fo
ure 36: pH o
Chloride
mean chlor
mg/L) and
r from asp
rvoir and ta
source wise
wn in figure
ure 37: Chlo
pH
6.546.566.58
6.66.626.646.666.68
6.76.72
PH
Chloride
1616.5
1717.5
1818.5
19
Chl
orid
e (m
g/L
)e of pH equa
major role in
ity paramete
6 and 6.6 re
or Prok VDC
of stream, re
ride in this
d WHO drin
pect of chl
ap water wa
e value of c
37. It was f
oride of stre
Stream6.7
Stre17
als to 6.6 w
n creating, c
ers. On ave
espectively.
C is shown
eservoir and
study was
nking water
loride is go
as found 17.
chloride on
found highe
eam, reservo
m
eam7.6
52
which is in th
control and
erage pH fo
The source
in figure 36
d tap water
17.5 mg/L
r standard v
ood. On av
.6 mg/L, 18
stream, res
er chloride v
oir and tap w
Reser6.
Res1
he range of
evaluation
or stream, r
e wise value
6.
L which is
value. This i
verage chlo
8.4 mg/L an
servoir and
value in rese
water
rvoir6
ervoir8.4
f national sta
of corrosio
reservoir an
e of pH on s
much lowe
indicated th
oride recor
nd 17.04 mg
tap water f
ervoir than
T6
1
andard (6.5
on in water a
nd tap water
stream, rese
er than ND
hat the qual
rded for str
g/L respecti
for Prok VD
stream and
Tap6.6
Tap7.04
-8.5).
and it
r was
ervoir
WQS
ity of
ream,
ively.
DC is
tap.

f. F
The
Wate
mg/L
CO2
Figu
g. T
The r
wate
hardn
and 4
and t
Figu
Free Carbon
mean free
er Quality S
L for stream
on stream,
ure 38: Free
Total Hardn
result show
r and the
ness record
4.8 mg/L re
tap water fo
ure 39: Hard
Free CO2
0123456789
Free
CO
2 (m
g/L
)
Hardness
01234567
Har
dnes
s (m
g/L
)
ndioxide (F
CO2 of wat
Standards. O
m, reservoir
reservoir an
e CO2 of stre
ness
ws the mean
National st
ed for strea
espectively.
or Prok VDC
dness of stre
Str2 7
Str6
Free CO2)
ter was 7.3
On average f
r and tap w
nd tap water
eam, reserv
total hardn
tandard for
am, reservoi
The source
C is shown
eam, reserv
ream7.92
ream6.4
53
3 mg/L. Fr
free CO2 wa
water respec
r for Prok V
voir and tap
ness was 5.1
r total hard
ir and tap w
e wise value
in figure 39
voir and tap
Res
Res
ree CO2 has
as found 7.9
ctively. The
VDC is show
water
16 mg/L. Th
dness is 50
water was fo
e of total ha
9.
water
servoir6.6
servoir3
s no any N
92 mg/L, 6.
e source wi
wn in figure
he water is
00 mg/L. O
und to be 6
ardness on s
7
ational Drin
6 mg/L and
ise value of
e 38.
classified a
On average
6.4 mg/L, 3
stream, rese
Tap7.04
Tap4.8
nking
d 7.04
f free
as soft
total
mg/L
ervoir

h. T
The m
natio
500
Ther
and t
was
total
Figu
i. A
Also
stand
of 1.
for s
amm
Figu
Total Alkal
mean of tot
onal drinkin
mg/L and f
re were abs
tap water. O
found 11.0
alkalinity o
ure 40: Alka
mmonia
the mean o
dards. In Pr
5 mg/L. On
stream, rese
monia on stre
ure 41: Con
Alkalinity
02468
1012
Alk
alin
ity (m
g/L
)
Ammonia
00.010.020.030.040.050.060.070.08
Am
mon
ia (m
g/L
)
linity
tal alkalinity
ng water sta
found maxi
ent of phen
On average
mg/L, 5.0
on stream, r
alinity in str
of ammonia
rok, all the
n average am
ervoir and
eam, reserv
centration o
Stry
Stra 0
y of water w
andards but
imum value
nolphthalein
total alkali
mg/L and
eservoir and
ream, reserv
a was 0.062
samples tes
mmonia wa
tap water
oir and tap
of ammonia
ream11
ream0.04
54
was 7.91 m
t it recomm
e of total a
n alkalinity
inity record
6.0 mg/L r
d tap water
voir and tap
mg/L whic
sted for amm
as recorded
respectively
water for P
a in stream,
Res
Res0
mg/L. From v
mended that
alkalinity of
(PPH Alka
ded for strea
respectively
for Prok VD
p water
ch is lower t
monia were
0.04 mg/L,
y. The sou
rok VDC is
reservoir an
servoir5
servoir0.07
view of hea
it must no
f Prok wate
alinity) on s
am, reservo
y. The sourc
DC is show
than nationa
e within the
0.07 mg/L
urce wise a
s shown in f
nd tap water
0
alth it has n
ot be higher
er was 20 m
stream, rese
oir and tap
ce wise val
wn in figure
al drinking
e NDWQS l
and 0.071
average valu
figure 41.
r
Tap6
Tap0.071
o any
r than
mg/L.
ervoir
water
lue of
40.
water
limits
mg/L
ue of
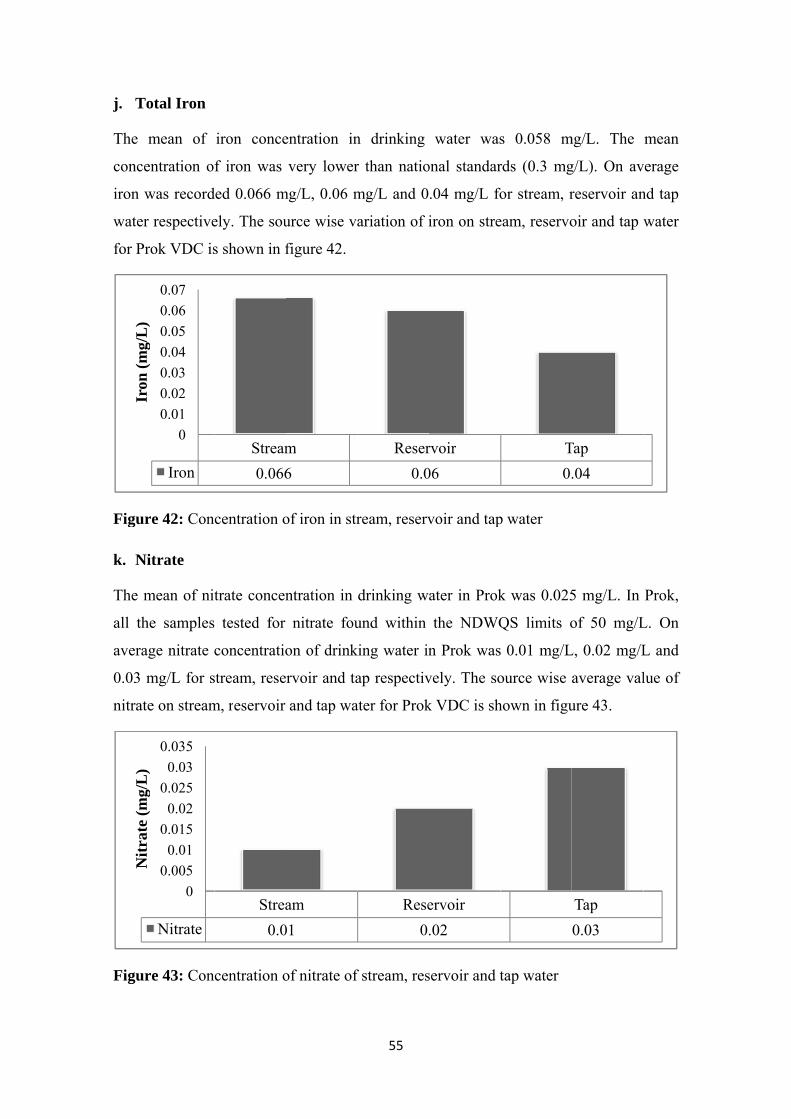
j. T
The
conc
iron
wate
for P
Figu
k. N
The
all th
avera
0.03
nitrat
Figu
Iron
(mg/
L)
Nitr
ate
(mg/
L)
Total Iron
mean of
entration o
was record
r respective
Prok VDC is
ure 42: Con
Nitrate
mean of nit
he samples
age nitrate c
mg/L for s
te on stream
ure 43: Con
Iron
00.010.020.030.040.050.060.07
Iron
(mg/
L)
Nitrate
00.005
0.010.015
0.020.025
0.030.035
Nitr
ate
(mg/
L)
iron conce
f iron was
ded 0.066 m
ely. The sou
s shown in f
centration o
trate concen
tested for
concentratio
stream, rese
m, reservoir
centration o
Stream0.066
Strea0.0
entration in
very lower
mg/L, 0.06 m
urce wise va
figure 42.
of iron in str
ntration in
nitrate fou
on of drink
rvoir and ta
and tap wa
of nitrate of
m6
am01
55
n drinking
r than natio
mg/L and 0
ariation of i
ream, reserv
drinking w
und within
king water in
ap respectiv
ater for Prok
f stream, res
Reser0.0
Rese0.
water was
onal standar
.04 mg/L fo
iron on stre
voir and tap
ater in Prok
the NDWQ
n Prok was
vely. The so
k VDC is sh
servoir and t
rvoir06
ervoir.02
s 0.058 m
rds (0.3 mg
for stream, r
eam, reservo
p water
k was 0.025
QS limits o
s 0.01 mg/L
ource wise a
hown in figu
tap water
T0.
mg/L. The
g/L). On av
reservoir an
oir and tap w
5 mg/L. In
of 50 mg/L
L, 0.02 mg/L
average val
ure 43.
Tap.04
Tap0.03
mean
verage
nd tap
water
Prok,
L. On
L and
lue of
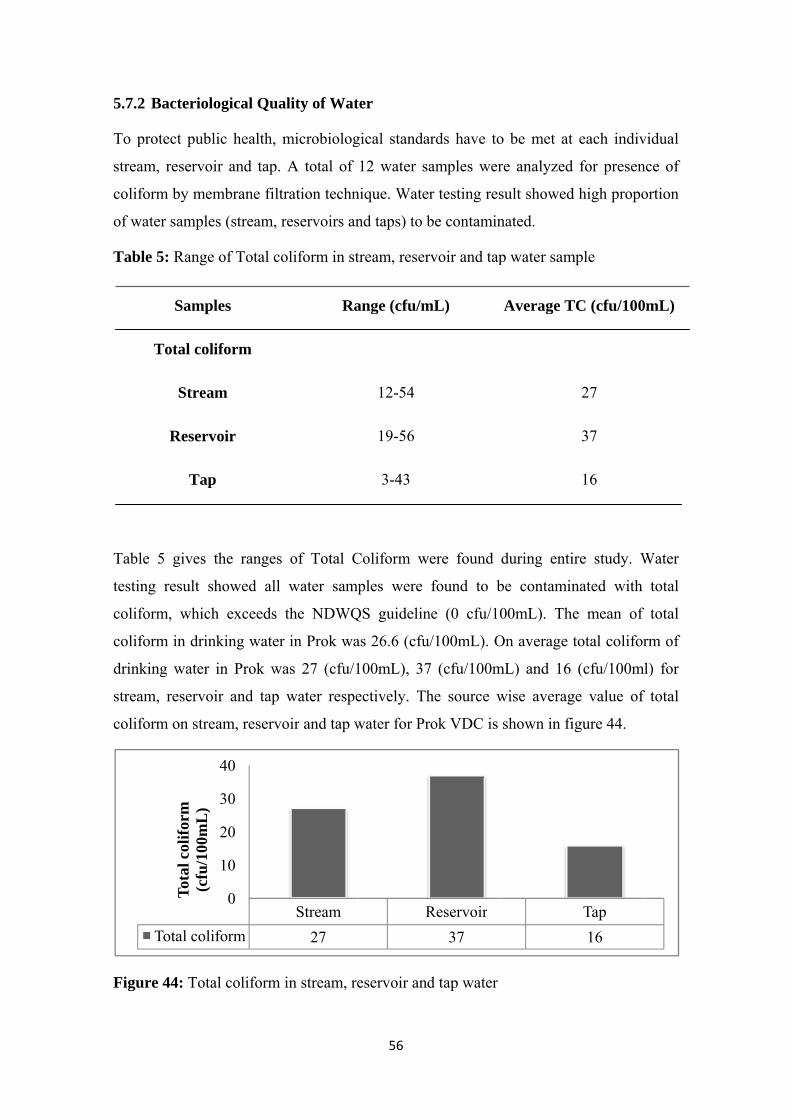
5.7.2
To p
strea
colif
of wa
Tabl
Tabl
testin
colif
colif
drink
strea
colif
Figu
2 Bacteriolo
protect publ
am, reservoi
form by mem
ater sample
le 5: Range
Sampl
Total coli
Strea
Reserv
Tap
e 5 gives t
ng result sh
form, which
form in drin
king water
am, reservoi
form on stre
ure 44: Tota
Total coli
Tota
l col
iform
(c
fu/1
00m
L)
ogical Qua
lic health, m
ir and tap.
mbrane filtr
es (stream, r
of Total co
les
iform
m
voir
p
the ranges
howed all
h exceeds t
nking water
in Prok wa
ir and tap
eam, reservo
al coliform i
form
0
10
20
30
40
lity of Wat
microbiolog
A total of
ration techn
reservoirs an
oliform in st
Ra
of Total C
water sam
the NDWQ
in Prok wa
as 27 (cfu/1
water respe
oir and tap w
in stream, re
Stream27
56
ter
gical standa
12 water sa
nique. Wate
nd taps) to b
tream, reser
ange (cfu/m
12-54
19-56
3-43
Coliform w
mples were
QS guidelin
as 26.6 (cfu
100mL), 37
ectively. Th
water for Pr
eservoir and
R
ards have to
amples wer
r testing res
be contamin
rvoir and tap
mL)
were found
found to b
ne (0 cfu/10
u/100mL). O
7 (cfu/100m
he source w
rok VDC is
d tap water
Reservoir37
o be met at
re analyzed
sult showed
nated.
p water sam
Average T
during enti
be contamin
00mL). Th
On average
mL) and 16
wise averag
shown in fi
t each indiv
d for presen
d high propo
mple
TC (cfu/100
27
37
16
ire study. W
nated with
he mean of
total colifor
(cfu/100m
ge value of
igure 44.
Tap16
vidual
nce of
ortion
0mL)
Water
total
f total
rm of
ml) for
f total

57
CHAPTER VI: DISCUSSION
Prok VDC, which is one of the remotest VDCs of Gorkha and dominated by ethnic
community (Bhote and Lama) has just literacy rate of 13% and the percentage of people
having higher education is very poor. As majority of the farmers do not own irrigated
land, cereal production of the area is insufficient to meet the need of people residing in
the area. The respondents or community observation shared their interesting stories
about climate change and its impact of the diverse aspects of the natural phenomenon.
The frequency, amount, duration of rainfall has been decreased and particularly during
winter monsoon has decreased. The observation also supports the scientific studies in
general (IPCC, 2007). Similarly, the observations also correspond with the estimates of
temperature rise of 0.41oC per decade in Nepal based on long-term meteorological data
on climate change and its impact is visible in the study area.
6.1 Trend of Climatic Variables
6.1.1 Trend of Temperature
Temperature analysis revealed that temperature of the study area is in increasing trend.
Average annual maximum temperature of the area is increased by 0.09oC/year. Annual
mean minimum temperature increased by 0.03oC/year and annual mean temperature
increased by 0.06oC/year. Shrestha et al. (1999) reported the temperature increase of
0.06°C to 0.12°C per year in most of the middle-mountain and Himalayan regions.
Projected temperature increases are lower in Eastern Nepal than Western and Central
Nepal; by the 2090s this difference is about 0.7%. The frequency of hot days in the pre-
monsoon season is projected to increase by 15-55% by the 2060s and 26-69% by the
2090s (NCVST, 2009). Seasonal maximum temperature of the study area was increased
by 0.12oC/year, 0.08oC/year, 0.07oC/year and 0.08oC/year for pre-monsoon, monsoon,
post-monsoon and winter season respectively. According to (NCVST, 2009), pre-
monsoon temperature is projected to increase by 1.7°C by 2030, 3.1°C by 2060s and
5.4°Cby 2090s. The monsoon temperature is projected to increase by 1.4°C by 2030s,
2.5°C by 2060s and 4.5°C by 2090s. The post-monsoon temperature is projected to
increase by 1.2°C by 2030s, 2.6°C by 2060s, and 4.6°C by 2090s. Similarly, winter
temperature is projected to increase by 1.6°C by 2030s, 3.4°C by 2060s and 5.4°C by
2090s relative to mean of 1970 to 1999. Mean temperature of all seasons are in the
increasing trend, which is increasing at the rate of 0.06°C/year. The mean minimum

58
temperature is in increasing trend with 0.03oC/year. This is coincided with respondent
opinion that in recent years both summer and winter days became hotter that previous
years.
The increased temperature will finally accelerate the drying up of spring water and
decreased water availability which directly affect on agricultural productivity of the
area.
6.1.2 Rainfall Trend
Analysis of the 30 years mean annual rainfall of two stations Jagat and Chame shows
the annual rainfall is in increasing trend for Jagat which is at the rate of 3.25mm/year
and decreasing trend for Chame station (-0.056mm/year). Chame station has decreasing
rainfall trend for winter, pre-monsoon and post monsoon season whereas increasing
trend for monsoon season. Respondents reported that the winter rain has decreased in
recent years which are in accordance with the winter rain projections of NCVST, 2009
that winter rain shows a tendency of decreasing trend. This report also resembles to
people's experience of decreased rainfall in winter and slightly increased rainfall in
monsoon. Comparison of rainfall for three recent decades shows that rainfall of Jagat
and Chame station has increased in recent years as compare to past. This trend is in
accordance with the NAPA projection of increasing rainfall intensity and decreased
winter rainfall. Similarly, the overall average trends of climatic conditions in Nepal
indicate that the precipitation is decreasing at the rate of 9.8 millimeter (mm) per decade on
annual basis. But there are variations in perception level in different parts of country, which
matches with the respondents experiences and perceptions on rainfall and its variation. The
local communities have experienced shortened monsoon which is also correlated with
scientific observations.
6.1.3 Discharge
Discharge analysis of nearest river shows that the annual maximum discharge is
increasing at the rate of 0.51m3/s whereas annual mean and minimum discharge is
decreasing trend which is at the rate of -0.109 m3/s and -0.39 m3/s respectively.
Respondents found flow of water in stream and river has changed as compared to past
years. They added that mainly runoff in stream and river decreased mainly in winter
season. Similar result carried out by Parajuli (2011) analyzed the discharge analysis of
Tamur River for the Majhitar hydrological station and found the minimum, maximum

59
and mean discharge is decreasing, which matches with the respondents experiences and
perceptions on river run off and its variation of the study area.
Respondent experienced climatic hazards drought and windstorm are increasing in the
area which might be change in climate and also reported the snowfall frequency and
amount also decreased due to increase in temperature in the area. IPCC (2008) reported
that snow cover has effect on both temperature and precipitation and it exhibits a strong
negative correlation but more with air temperature in most of areas. As climate warms,
snow cover is projected to shrink and decreases, glacier ice cap.
6.2 Impact of Climate Change
6.2.1 ImpactonWaterResources
It was found that water resources are highly affected by climate change mainly
decreasing water resources in the study area. Respondents felt few number of spring
water like small Kuwa has already dried up. Respondents shared that level of spring
water and amount of stream flow has been decreasing for the last five years. Examining
the rainfall trend and community’s perception on climatic scenario in the last 20-30
years, it is clear that the intensity of rainfall was increased whereas frequency and
duration were decreased. This event results in increased flashflood, reduced in soil
moisture and less water infiltration in the area. This might be the reason of drying
water sources and decreased in water availability in the area. Same result was obtained
by the study carried out by Baral et al. (2010) found that low rainfall affected the water
resources in the area. Decrease in water sources in the area has not only the problem of
drinking water sources, agriculture, threats to biodiversity and threats to human life also
major impacts. Dhakal et al. (2011) also found that sixty percent of the water sources
dried up in the last 15 to 20 years. Human and production systems were most affected.
Drying up water sources was the major hazard in the area due to climate change and
caused substantial decrease in water availability.
6.2.2 Impact on Agriculture
It was found that agriculture is also highly affected from climate change especially
reduce in agricultural productivity system. Change in temperature and rainfall pattern is
main causes the decrease in level of spring and stream flow in the study area which
adversely affect in irrigation system. Respondents reported that production of both
summer crops (maize, corn, beans) and winter crops (wheat, karu, vegetables) has
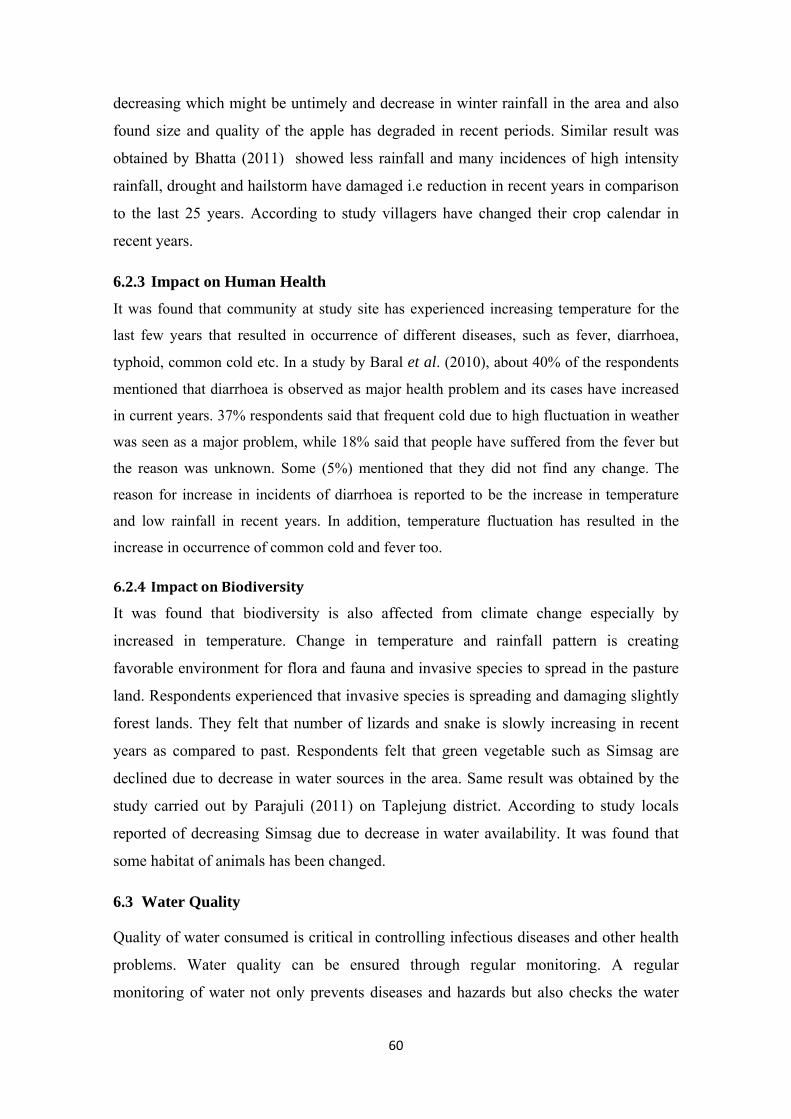
60
decreasing which might be untimely and decrease in winter rainfall in the area and also
found size and quality of the apple has degraded in recent periods. Similar result was
obtained by Bhatta (2011) showed less rainfall and many incidences of high intensity
rainfall, drought and hailstorm have damaged i.e reduction in recent years in comparison
to the last 25 years. According to study villagers have changed their crop calendar in
recent years.
6.2.3 Impact on Human Health
It was found that community at study site has experienced increasing temperature for the
last few years that resulted in occurrence of different diseases, such as fever, diarrhoea,
typhoid, common cold etc. In a study by Baral et al. (2010), about 40% of the respondents
mentioned that diarrhoea is observed as major health problem and its cases have increased
in current years. 37% respondents said that frequent cold due to high fluctuation in weather
was seen as a major problem, while 18% said that people have suffered from the fever but
the reason was unknown. Some (5%) mentioned that they did not find any change. The
reason for increase in incidents of diarrhoea is reported to be the increase in temperature
and low rainfall in recent years. In addition, temperature fluctuation has resulted in the
increase in occurrence of common cold and fever too.
6.2.4 ImpactonBiodiversity
It was found that biodiversity is also affected from climate change especially by
increased in temperature. Change in temperature and rainfall pattern is creating
favorable environment for flora and fauna and invasive species to spread in the pasture
land. Respondents experienced that invasive species is spreading and damaging slightly
forest lands. They felt that number of lizards and snake is slowly increasing in recent
years as compared to past. Respondents felt that green vegetable such as Simsag are
declined due to decrease in water sources in the area. Same result was obtained by the
study carried out by Parajuli (2011) on Taplejung district. According to study locals
reported of decreasing Simsag due to decrease in water availability. It was found that
some habitat of animals has been changed.
6.3 Water Quality
Quality of water consumed is critical in controlling infectious diseases and other health
problems. Water quality can be ensured through regular monitoring. A regular
monitoring of water not only prevents diseases and hazards but also checks the water
61
resource from going further pollution (Jayana, 2008). Physico-chemical parameters of
the drinking water found within Nepal Drinking Water Quality Standard, 2062. The
testing was performed to find out the quality of the water supplied in Prok VDC and for
understanding the degradation of water quality due to climate change. .
Temperature is an important description of the chemical and biological properties of
water. Temperature does not have direct health impact, but, drinking water having high
temperature may impact on its aesthetic quality, lead to the higher rate of chemical
reactions in water, reduce solubility of gases (Flournoy et al., 1999). In the study,
conducted in USA the coliform bacteria increased significantly in drinking water
distribution system when the temperature increased to over 15oC (USEPA, 2006).
Conductivity correlates with the dissolved ions in water. Total dissolve solids is a
measure of the total ions in solution. Water shows significant conductivity when
dissolved salts are present. Over most ranges, the amount of conductivity is directly
proportional to the amount of salts dissolved in the water. Conductivity of drinking
water set by NDWQS has 1500μS/cm and in the study area maximum conductivity for
tested samples was found 183μS/cm.
In the present study water turbidity values ranged from 0.8 to 8.6 NTU. The results
supported by Dagaonkar, A. and Saksena, D.N. (1992) and Garg et al. (2006b) have
also reported high turbidity during rainy season. During rainy season silt, clay and other
suspended particles contribute to the turbidity values, while during winter and summer
seasons settlement of silt, clay results low turbidity.
The pH is the indicator of acidic and alkaline nature of water. The pH of drinking water
has a drastic effect on our health. Not only in the hydration of our bodies, but in the
assimilation of food nutrients through our digestive system. The pH of drinking water
can vary drastically because of its amazing soluble quality. NDWQS guideline value for
pH is 6.5 to 8.5 pH. The pH range of 6.5-6.9 (for stream, tap and reservoir) could be
considered as being within the acceptable range for natural water and within the
NDWQS. According to Medera et al. (1982) the pH of most natural water range from
6.5-8.5 which is a deviation from neutral 7.0 as a result of the CO2/bicarbonate
equilibrium.
Chloride is a component of common salt. It may occur in water naturally, but it may
also be present due to local use of saline intrusion. The guide value is 250 mg/L. In
Prok, Stream, reservoir and tap water recorded a chloride level of 17.6 mg/L, 18.4 mg/L

62
and 17.04 mg/L respectively. Almost all natural waters contain chloride ions even
though its concentrations vary according to the mineral content found in the area,
contributing to the total mineral content overall. Usually chloride was found low which
is the good things since low chloride concentration can add a pleasant taste to the
drinking water. A sudden increase of chloride content indicates probable domestic
organic pollution.
Hardness is caused basically by calcium and magnesium salts. Depending on other
factor such as pH and alkalinity water with hardness above approximately 200 mg/L
may cause scale deposit in the distribution system and results in excessive soap
consumption. Hardness less than 100 mg/L may cause corrosion. As a general rule, a
value less than 60 is considered soft, and values above 200 are considered very hard. All
samples show the hardness less than 100 mg/L is called soft water. The guideline value
for hardness is 250 mg/L and found all samples within the guideline value.
Alkalinity of water may be due to the presence of one or more of a number of ions. The
water contains bicarbonate alkalinity, which does not affect the total hardness.
Alkalinity of the water is to neutralize acid. Moderate concentrations of alkalinity are
desirable in most water supplies to balance the corrosive effects of acidity. No limits
have been set for alkalinity level, although high concentration of bicarbonate could give
rise to a taste problem. Maximum concentration of alkalinity was found 20 mg/L.
Alkalinity in water comes from a high concentration of carbon based minerals. Water
with high alkalinity is said to be hard.
The parameters most commonly linked to aesthetic water quality problem are iron. The
substances may be present naturally in raw water sources. Water used for drinking had
significantly less iron ranges between the limit 0.018 mg/L to 0.159 mg/L. Water tested
for iron concentration was found acceptable level of NDWQS guideline value i.e. 0.3
mg/L.
Nitrate and ammonia were not present in higher concentration based on the April 2012
field data. The maximum concentration of nitrate and ammonia was found 0.027 mg/L
and 0.143 mg/L respectively, where NDWQS guideline value for nitrate and ammonia
is 50 mg/L and 1.5 mg/L respectively. Similar study by Bittner (2000) found the
average concentration of nitrate in rural areas of Nepal was only 1.2 mg/L.

63
Bacteriological pollution is most common and widespread danger associated with
drinking water. Bacteriological contamination of water is the presence of harmful
pathogenic microorganism in water. Microbial analysis performed on water sample is
not safe for bacteriological quality. There are number of coliform present in all water
samples. Stream had a mean contamination of 27 cfu/100mL, reservoir had a mean of
37 cfu/100mL and tap had a mean of 16 cfu/100mL total coliform. All of the tested
waters were found to be contaminated with coliform bacteria. Sample wise variation of
total coliform count showed that stream (100 %), reservoir (100 %) and tap (100 %)
crossed the acceptable limit of NDWQS guideline value (i.e. 0 cfu/100mL). The above
results of water quality show that all the water used by the villagers was contaminated
either at source points or at collection points. Contamination at source points relates to
anthropogenic activities and environmental surroundings near source whereas
contamination at consumption points relate to households.
Shrestha (2008) found all tested tap water samples of Kathmandu valley contaminated
with total Coliform. However Bajracharya et al. (2007) and Aryal (2009) reported
73.7% and 86.2% samples respectively contaminated with total coliform. Though
slightly higher to present study, the recovery rate of the Coliform was found low that is
19.6% (Aryal, 2009) to 23.3% (Shrestha, 2008). Chaidez et al. (2008) detected 46%
Total coliform and 26% faecal coliform in drinking water conducted in Mexico. The
reason for such a high percentage of total coliform in drinking water may be due to the
depletion of the residual chlorine through the pipeline and the water may gets
contaminated due to leakage, rusty pipelines.
The report of Edama (2001) which indicates that the presence of bushes and shrubs
around water bodies makes it likely and possible that some individuals may have been
coming around to drink water thereby passing out faeces into the stream water.
In summary, all the tested samples were found coliforms (pathogens) from stream to tap
water source which leads to decreasing drinking water quality and leads to an increase
of at risk situations with regard to potential health impact mainly due to changing in
extreme meteorological events. Similar studied carried out by Delpla et al. (2009) found
that the degradation trend of drinking water quality in surface water mainly during
extreme meteorological events.
64
CHAPTER VII: CONCLUSION AND RECOMMENDATIONS
7.1 Conclusion
• From result and discussion, it can be concluded that there was change in
precipitation pattern, temperature, river discharge in the study area.
• The hydro-meteorological data analysis was found to be compatible with the
perception of the local people.
• Level of spring water and river/stream flow has changed in the area.
• Rainfall variability and high windstorm has damaged the agricultural production
and decreasing the availability of locally available vegetables (Simsag).
• Occurrence of diseases i.e., diarrhoea, typhoid, dysentery, fever, cholera and
common cold has increased due to meteorological events.
• Number of snakes and lizards has increased. Invasion of unwanted weed species
Lantana camera (Banamara) and Ageratum sp. (Gandhe) were also observed in
the area.
• The physical and chemical parameters of water were found within the NDWQS,
2062.
• The microbial analysis was found to be the presence of total coliform in all
water samples and revealed that climate change might be responsible for
degrading situation of water quality due to increasing temperature and rainfall
variability.
• Hence from above, it can be inferred that climate change has been occurring in
the study area. Locals have perceived about change even though they have not
got any formal information on climate change. Climate change has impacted on
rural community in the factors like water resources, Agriculture, human health,
biodiversity and water quality. From analyzing water quality (stream to tap), it
was found that there was a degradation of drinking water quality leading to an
increase of at risk situations with regard to potential health impact, mainly
during extreme meteorological events. Among water quality parameters,
pathogens (total coliform) are susceptible to rise in concentration or numbers as
a consequence of temperature increase (water and air).
65
7.2 Recommendations
Following recommendations are made based on the research:
• More meteorological stations should be installed in the area to depict the exact
scenario of climate (existing nearby stations only at Jagat and Gorkha).
• Awareness programs on climate change and its impact must be raised for the
rural communities of Namrung, Kawak and Chhak of Prok VDC.
• Further studies should be done to determine the impact of climate change on
water quality in Prok VDC.
• Civil structures and flood protection structures should be designed across the
River of Budhi Gandaki.
• Monitoring of the drinking water quality from stream to tap of Prok VDC is
necessary for health risk assessment.
66
References
ADB, 2009. NEP: Climate Change Assessment, Asian Development Bank, Manila,
Philippines.
Agrawal, S.V., Raksakulthai, M., Aalst, P. and Larsen, J., 2003. Development and
climate change in Nepal: Focus on water resources and hydropower. Organization for
Economic Co-operation and Development, Paris, 64.pp.
Alam, M. and Regmi, B.R., 2004. Adverse impacts of climate change on development of
Nepal: Integrating adaptation into policies and activities. Bangladesh Centre for
Advance Studies (BCAS). Working Paper 3.
APHA, 1998. Standards methods for the examination of water and waste water.
Americian Public Health Association, Washington, DC.
Aryal, S.N., 2009. Isolation and characterization of Escherichia Coli from drinking
water of urban Kathmandu. MSc. Dissertation. Central Department of Microbiology,
Tribhuvan University, kirtipur, Kathmandu, Nepal.
Asahi, K. and Watanabe, T., 2000: Past and recent glacier fluctuations in Kanchanjunga
Himal, Nepal. In: Journal of Nepal Geological Society 22.pp.
Baidya, S.K., Shrestha, M.L., Sheikh, M.M., 2008. Trends in daily climatic extremes of
temperature and precipitation in Nepal. Journal of Hydrology and Meteorology,
SOHAM-Nepal, March 2008, Volume 5, Number 1:38-51.
Bajrachrya, A.M., Yami, K.D., Prasai, T., Basnyat, S.R. and Lekhak, B., 2007.
Assessment of drinking water quality of Kathmandu metropolitan areas. Nepal Journal
of Science and Technology 8: 113-118.
Baral, S., Gauli, K., Paudel, A. and Karna, Y. K., 2010. Vulnerability of Indigenous
Mountainous Communities to Climate Change and Their Coping Strategies. Forest-
people Interaction (Proceedings of a national Conference, 230 pp, Pokhara, Nepal, June
7 and 8, 2010). Institute of Forestry, Pokhara, Nepal.
Bates, B.C., Kundzewicz, Z.W., Palutikof, S.W. and Eds, J.P., 2008. Climate Change
and Water. Technical Paper of the Intergovernmental Panel on Climate Change, IPCC
Secretariat, Geneva, 210pp.
67
Bhatta, R.P., 2011. Climate change impacts and its adaptation strategies of rural
community of Krishnapur VDC of Kanchanpur, MSc Thesis. Institute of Forestry,
Tribhuvan University, Pokhara, Nepal.
Bittner, A., 2000. Nepal Drinking Water Quality Assessment: Nitrates and Ammonia,
M.E. Thesis Massachusetts Institute of Technology, University of Michigan, Ann
Arbor, Michigan.
Brody, A., Demetriades, J. and Esplen, E., 2008. Gender and Climate Change: Mapping
the linkage. A Scoping study on knowledge and gaps. BRIDGE, Institute of
Development Studies (IDS), UK.
Brunetti, M., Maugeri, M., Nanni T., 2001. Decrease in toxicity of microcystins in
drinking water by ozonation. Toxicon, 48: 1054-9.
CBS, 2011. Statistical Year Book Nepal. Central Bureau of Statistics, National Planning
Commission, Kathmandu, Nepal.
Chaidez, C., Soto, M., Martinez, C. and Keswick, B., 2008. Drinking water
microbiological survey of the northwestern state of Sinaloa, Mexico. Journal on Water
and Health 6(1):125-129.
Chaulagain, N.P., 2006. Impact of climate change on water resources of Nepal: The
Physical and Socioeconomic Dimensions. Thesis for the Degree of Doctor Engineer,
University of Flensburg, Germany, 2006.
Dagaonkar, A. and Saksena, D.N., 1992. Physico-chemical and biological
characterization of temple tank, Kaila Sagar, Gwalior, Madhya Pradesh. J. Hydrobiol. 8
(1), pp 11-19.
Dhakal, K., Silwal, S. and Khanal, G., 2011. Case study on understanding climate
change impact in Nepal. Nepal Climate Change Knowledge Managemant Center, Nepal
Academy of Science and Technology, Khumaltar, Lalitpur. pp. 19 – 29.
DHM, 2012. Maximum and minimum temperature of different places of Nepal.
Department of Hydrology and Meteorology, Kathmandu, Nepal.
Diwakar, J., 2008. Assessment of drinking water of Bhaktapur municipality area in pre-
monsoon season: Master thesis submitted to the Central Department of Environmental
science, Tribhuwan University, kirtipur, Kathmandu Nepal.

68
Delpla, A.V., Jung, E., Baures, M., Clement, O., 2009. Impacts of climate change on
surface water quality in relation to drinking water production. Journal on
Environmental International 35:1225-1233.
Edama, M.D., Omemu, A.M. and Fapetu, O.M., 2001. Microbiological and
physicochemical analysis of different sources of drinking water in Abeokuta, Nigeria.
Niger J. Microbial 15(1):57-61.
Evans, C.D., Monteith, D.T., Reynolds, B. and Clark, J., 2005. Long-term increases in
surface water dissolved Organic Carbon: Observations, possible causes and
environmental impacts. Journal on Environmental Pollution; 137:55-71.
Flournoy, R., Monroe, D., Chestnut, N. and Kumar, V., 1999. Health effects from vinyl
chloride monomer leaching from Pre-1977 PVC pipe. AWWA Annual Conference
Proceedings, USA.
Garg, R.K., Saksena, D.N., Rao, R.J., 2006b. Assessment of physico-chemical water
quality of Harsi Reservoir, district Gwalior, Madhya Pradesh, Journal of Ecophysiology
and Occupational Health, 6, pp.33-40.
Gurung, G.B. and Bhandari, D., 2009. Integrated approach to climate change
adaptation. Journal of Forest and Livelihood, Practical Action, Feb 2009, Vol 8(1)
HMG/MOPE, 2004. Initial national communication to the Conference of Parties of
UNFCCC. Kathmandu: Ministry of Population and Environment, Government of
Nepal.
ICIMOD/UNEP, 2001.Trends and potential climate change impacts on glacier
retreat/glacier lakes in Nepal, and potential adaptation. Technical Report. Kathmandu,
Lalitpur.
IPCC, 2001. Inventory of glaciers, glacial lakes and glacial lake outburst Floods,
Kathmandu, ICIMOD.
IPCC, 2001a. Climate Change 2001: Synthesis Report. Contribution of working groups
I, II and III to the third assessment report of the Intergovernmental Panel on Climate
Change [Watson, R.T. and the Core Writing Team (Eds.)]. Cambridge University Press,
Cambridge, 398 pp.
IPCC, 2001b. Climate Change 2001: Impacts, Adaptation and Vulnerability.
Contribution of WG II to TAR of the Intergovernmental Panel on Climate Change
69
[McCarthy, M.C., O.F. Canziani, N.A. Leary D.J. Dokken and K.S White (Eds.).
Cambridge, pp 1031.
IPCC, 2006. Climate Change Synthesis Report, London, Cambridge University Press.
IPCC, 2007. Intergovernmental Panel on Climate Change. Fourth Assessment Report
Climate Change 2007: Synthesis Report for Policymakers. Intergovernmental Panel on
Climate Change.
IPCC, 2008. Technical Paper of Intergovernmental Panel on Climate Change. Climate
change and water [Bates, B.C., Kundzewicz, Z.W. Wu, S. and Palutikof J.P. (Eds.0].
IPCC Secretraint, Geneva, 210 pp.
Jayana, B.L., Prasai, T., Singh, A. and Yami, K.D., 2008. Assessment of drinking water
quality of Madhyapur-Thimi and study of antibiotic sensitivity against bacterial isolates.
Nepal Journal of Science and Technology. 10: 167-172.
Jha, P.K., 1992. Environment and man in Nepal. Craftsman Press, Bangkok.
Jones, P. and Palutikof, P., 2006. Global temperature record. Climate Research Unit,
University of East Angila.
LFP, 2009. Impact of climate change on forests and livelihoods: Issues and options for
Nepal, 13-14 pp. Livelihoods and Forestry Programme (LFP), Kathmandu, Nepal.
Marahatta, S., Dongol, B.S., Gurung., 2009. Temporal and spatial variability of climate
change over Nepal (1976-2005). Practical Action Nepal Office, 2009.
Moatar, F., and Gailhard, J., 2006. Water temperature behaviour in the River Loire
since 1976 and 1881.
MoE, 2010. National Adaptation Programme of Action to Climate Change. Ministry of
Environment, Kathmandu, Nepal.
Mooij, W.M., Dorris, L.N. and Janse J.H., 2009. Linking species- and ecosystem level.
Impacts of climate change in Lakes with a complex and a minimum model. Ecological
modelling, doi: 10. 1016. Journal on Ecological Model. 02.003.
NCVST, 2009. Vulnerability through the eyes of vulnerable: Climate change induced
uncertainties and Nepal’s development predicaments. Nepal climate vulnerability study
team, Institute for Social and Environmental Transition-Nepal (ISET-N), Kathmandu.
70
Nicol, A. and Kaur, N., 2009. Adapting to climate change in the water sector. Overseas
Development Institute, UK.
NTNC, 1998. Project Proposal for Manaslu Conservation Area. National Trust for
Nature Conservation, Nepal.
OECD, 2003. Development and Climate Change in Nepal: Focus on Water Resources
and Hydropower, Paris.
Pachauri, R. K., 1992: Global warming: Impacts and implications for South Asia. In:
The Regions and Global Warming: Impacts and Response Strategies [Schmandt, J. and
J. Clarkson (Eds)], Oxford University Press, New York, pp. 79-90.
Parajuli, A., 2011. Socio-economic vulnerability to climate change and adaptation
strategies Lelep VDC, MSc Thesis. Central Department of Environmental Science,
Tribhuvan University, Kathmandu, Nepal.
Peter, S., Murdoch, S. and Timothy L., 2000. Potential effects of climate change on
surface-water quality in North America. Journal of the American Water Resources
Association. Vol. 36, No 2.
Pokhrel, A., 2003. Precipitation pattern over Nepal. Central Department of Hydrology
and Meteorology, Tribhuvan University, Kathmandu, Nepal.
Practical Action, 2009. Temporal and spatial variability of climate change over Nepal.
Practical Action, Nepal Office, Kathmandu.
Prasai, T. and Lekhak, B., 2007. Assessment of drinking water quality of Kathmandu
metropolitan area. Nepal Journal of Science and Technology 8: 113-118.
Prathumratana, L., Sthiannopkao, S. and Kim K.W., 2008. The relationship of climatic
and hydrological parameters to surface water quality in the lower Mekong River:
Journal on Environmental International; 34:860-6.
Rai, S.K., Ono, K., Yanagida, J.I., Kurokawa, M. and Rai, C.K., 2009. Status of
drinking water contamination in mountain region, Nepal. Med Coll Journal; 11(4): 281-
283.
Shakya, P., Prasai, T., Joshi, D.R. and Bhatta, D.R., 2012. Evaluation of
physicochemical and microbiological parameters of drinking water supplied from
distribution systems of Kathmandu municipality. Nepal Journal of Science and
Technology .Vol 13, No.2:179 – 184.
71
Sharma, K., 2004. Hydrologic extremes of south-west Nepal in 2006. In Proceedings of
International Symposium on Geo-disaster, Infrastructure Management and Protection of
World Heritage Sites. November 2006, Nepal Engineering College, Changunarayan,
Bhaktapur, Nepal, pp 224-230.
Sharma, S., Bajaracharya, R., Sitaula, B.K. and Merg, J., 2000. Water quality in the
Central Himalaya, Current science 89(5):782.
Shrestha, A.B., Wake C.P., Mayewski, P.A. and Dibb, J.E. 1999. Maximum temperature
trends in the Himalaya and its vicinity: An analysis based on temperature records from
Nepal for the period 1971-1994. Journal of Climate, 12:2775-2786.
Shrestha, A.D., Wake, C.P., Dibb, J.E. and Mayewski, P.A., 2000. Precipitation
fluctuations in the Nepal Himalayas and its vicinity and relationship with some large
scale climatological parameters. In: International Journal of Climatology, Vol.20,
Royal Meteorological Society, pp.317-327.
Shrestha, R., 2008. Assessment of drinking water quality of Kathmandu and study of
antibiotics sensitivity pattern and oligodynamic action against bacterial isolates. M.Sc.
Dissertation. National College, Tribhuvan University, Kathmandu, Nepal.
UNDP, 2004. Reducing disaster risk: A Challenge for development. New York: UNDP
Bureau for Crisis Prevention and Recovery, 2004.
UNDP, 2006. Summary human development report, beyond scarcity: Power, Poverty
and the Global water cycle. Summary Human Development Report, Aalgrave
Macmillam, New York, USA.
UNFCCC, 1992. United Nations Framework on Convention on Climate Change. United
Nations.
UNFCCC, 2001. United Nations Framework on Convention on Climate Change.
UNFCCC, 2007. UNFCCC Retrieved September 13, 2007, from United Nations
Framework Convention on Climate Change.
USEPA, 2006. Distribution system indicators of drinking water quality. USEPA,
Washington, DC.
Wang, S., 2006. The impact of the climate change on discharge of Suir River catchment
(Ireland) under different Climate Scenarios. J. on Earth, pp.387–395.
72
WHO, 2007. Guideline for drinking water quality. First edition volume 1, World Health
Organization, Geneva.
WMO, 2005. Statement on the status of the global climate in 2005. World
Meteorological Organization, Jeneva.
WMO, 2009. The warmest decade. Press release No.869. World Meteorological
Organization, Geneva.
WWF, 2006. An overview of glaciers, glacier lakes, and its subsequent impacts in the
Nepal, India and China, Kathmandu: WWF Nepal Program.
Xiaodong C., Baode L., 2000. Climatic warming in the Tibetan Plateau during recent
Decades. International Journal of Climatology. 20: 1729-1742.
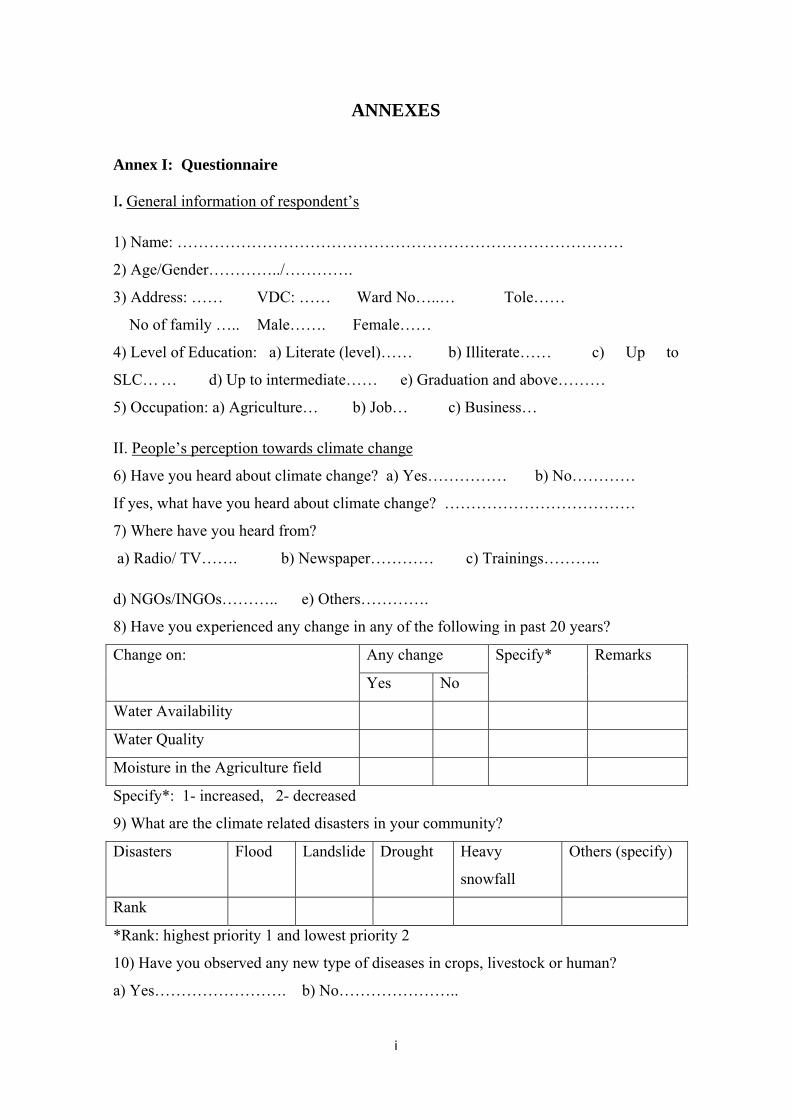
i
ANNEXES
Annex I: Questionnaire
I. General information of respondent’s
1) Name: …………………………………………………………………………
2) Age/Gender…………../………….
3) Address: …… VDC: …… Ward No…..… Tole……
No of family ….. Male……. Female……
4) Level of Education: a) Literate (level)…… b) Illiterate…… c) Up to
SLC… … d) Up to intermediate…… e) Graduation and above………
5) Occupation: a) Agriculture… b) Job… c) Business…
II. People’s perception towards climate change
6) Have you heard about climate change? a) Yes…………… b) No…………
If yes, what have you heard about climate change? ………………………………
7) Where have you heard from?
a) Radio/ TV……. b) Newspaper………… c) Trainings………..
d) NGOs/INGOs……….. e) Others………….
8) Have you experienced any change in any of the following in past 20 years?
Change on: Any change Specify* Remarks
Yes No
Water Availability
Water Quality
Moisture in the Agriculture field
Specify*: 1- increased, 2- decreased
9) What are the climate related disasters in your community?
Disasters Flood Landslide Drought Heavy
snowfall
Others (specify)
Rank
*Rank: highest priority 1 and lowest priority 2
10) Have you observed any new type of diseases in crops, livestock or human?
a) Yes……………………. b) No…………………..
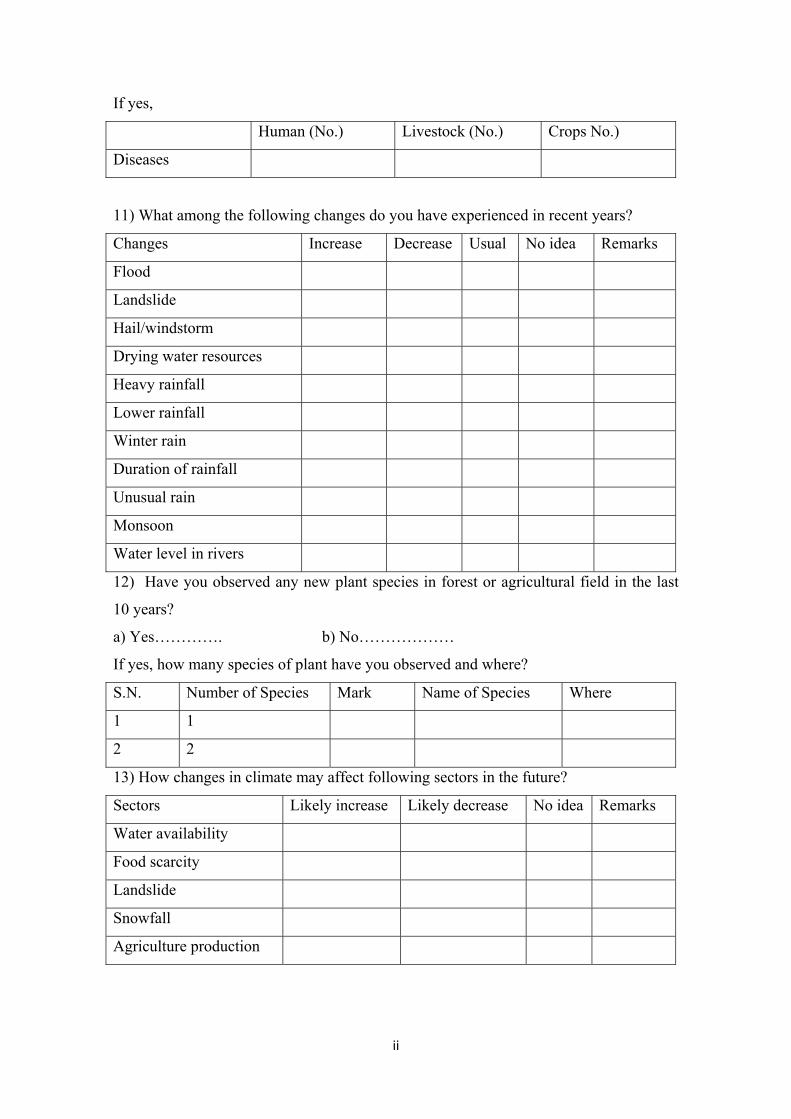
ii
If yes,
Human (No.) Livestock (No.) Crops No.)
Diseases
11) What among the following changes do you have experienced in recent years?
Changes Increase Decrease Usual No idea Remarks
Flood
Landslide
Hail/windstorm
Drying water resources
Heavy rainfall
Lower rainfall
Winter rain
Duration of rainfall
Unusual rain
Monsoon
Water level in rivers
12) Have you observed any new plant species in forest or agricultural field in the last
10 years?
a) Yes…………. b) No………………
If yes, how many species of plant have you observed and where?
S.N. Number of Species Mark Name of Species Where
1 1
2 2
13) How changes in climate may affect following sectors in the future?
Sectors Likely increase Likely decrease No idea Remarks
Water availability
Food scarcity
Landslide
Snowfall
Agriculture production
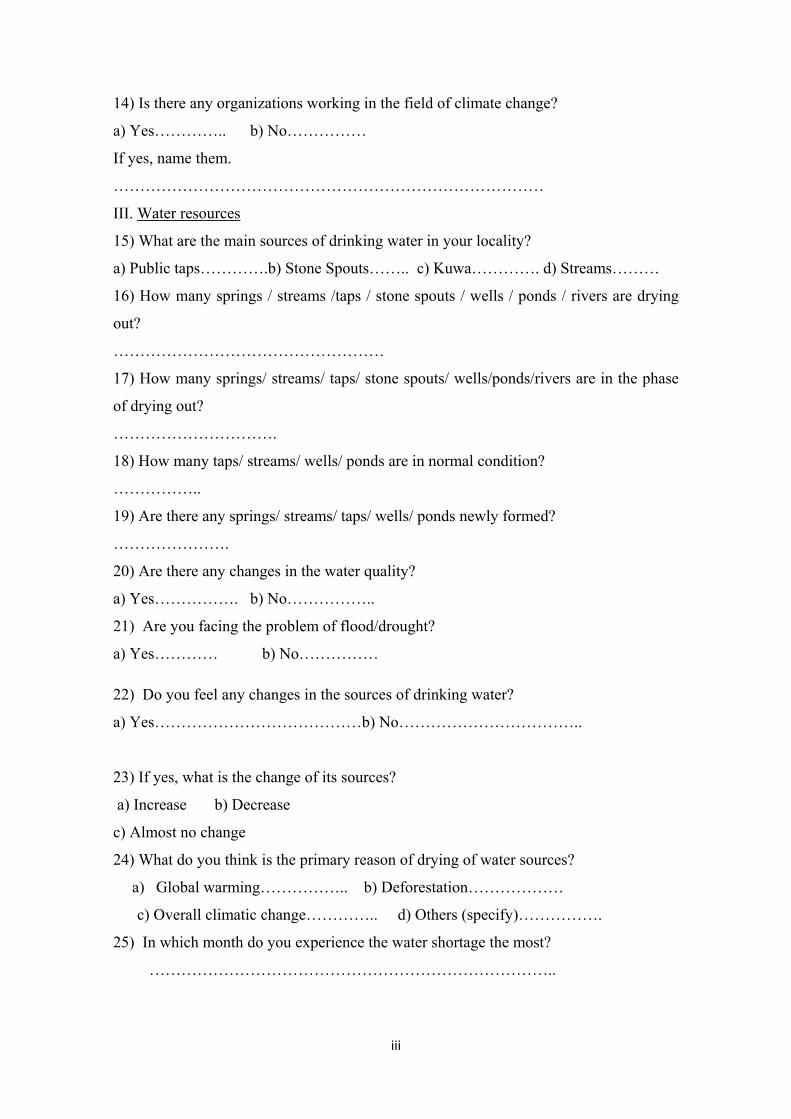
iii
14) Is there any organizations working in the field of climate change?
a) Yes………….. b) No……………
If yes, name them.
………………………………………………………………………
III. Water resources
15) What are the main sources of drinking water in your locality?
a) Public taps………….b) Stone Spouts…….. c) Kuwa…………. d) Streams………
16) How many springs / streams /taps / stone spouts / wells / ponds / rivers are drying
out?
……………………………………………
17) How many springs/ streams/ taps/ stone spouts/ wells/ponds/rivers are in the phase
of drying out?
………………………….
18) How many taps/ streams/ wells/ ponds are in normal condition?
……………..
19) Are there any springs/ streams/ taps/ wells/ ponds newly formed?
………………….
20) Are there any changes in the water quality?
a) Yes……………. b) No……………..
21) Are you facing the problem of flood/drought?
a) Yes………… b) No……………
22) Do you feel any changes in the sources of drinking water?
a) Yes…………………………………b) No……………………………..
23) If yes, what is the change of its sources?
a) Increase b) Decrease
c) Almost no change
24) What do you think is the primary reason of drying of water sources?
a) Global warming…………….. b) Deforestation………………
c) Overall climatic change………….. d) Others (specify)…………….
25) In which month do you experience the water shortage the most?
…………………………………………………………………..
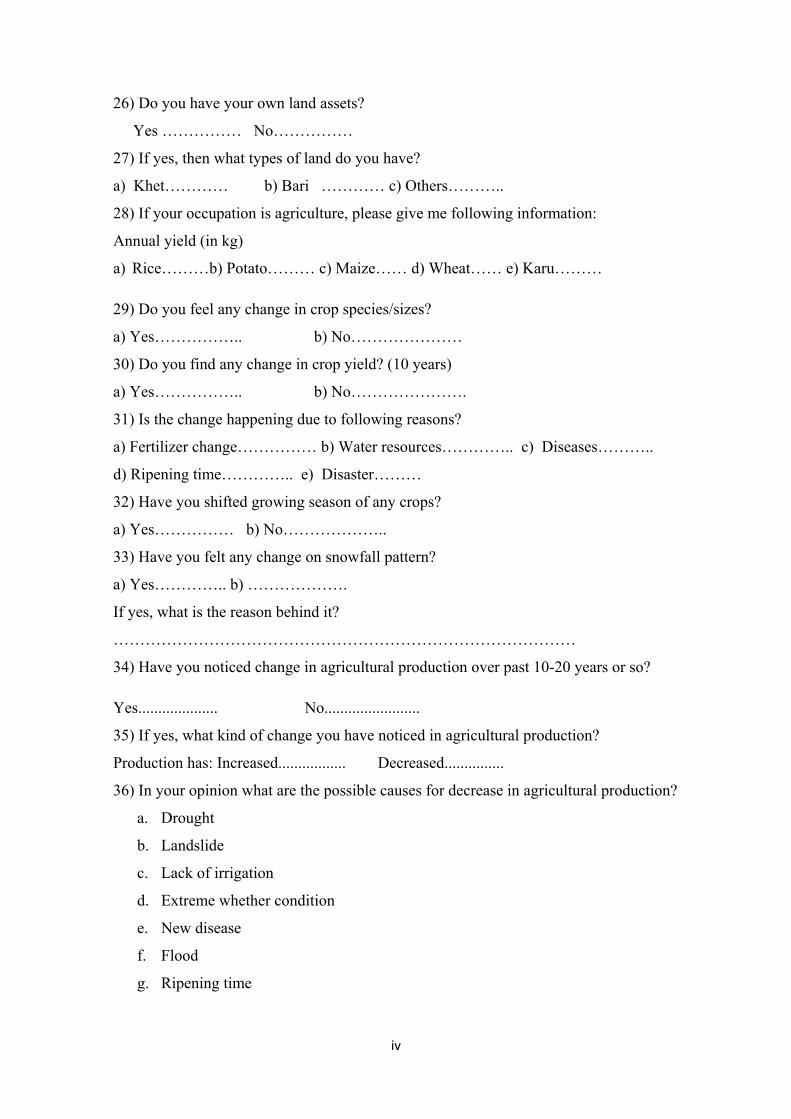
iv
26) Do you have your own land assets?
Yes …………… No……………
27) If yes, then what types of land do you have?
a) Khet………… b) Bari ………… c) Others………..
28) If your occupation is agriculture, please give me following information:
Annual yield (in kg)
a) Rice………b) Potato……… c) Maize…… d) Wheat…… e) Karu………
29) Do you feel any change in crop species/sizes?
a) Yes…………….. b) No…………………
30) Do you find any change in crop yield? (10 years)
a) Yes…………….. b) No………………….
31) Is the change happening due to following reasons?
a) Fertilizer change…………… b) Water resources………….. c) Diseases………..
d) Ripening time………….. e) Disaster………
32) Have you shifted growing season of any crops?
a) Yes…………… b) No………………..
33) Have you felt any change on snowfall pattern?
a) Yes………….. b) ……………….
If yes, what is the reason behind it?
……………………………………………………………………………
34) Have you noticed change in agricultural production over past 10-20 years or so?
Yes.................... No........................
35) If yes, what kind of change you have noticed in agricultural production?
Production has: Increased................. Decreased...............
36) In your opinion what are the possible causes for decrease in agricultural production?
a. Drought
b. Landslide
c. Lack of irrigation
d. Extreme whether condition
e. New disease
f. Flood
g. Ripening time
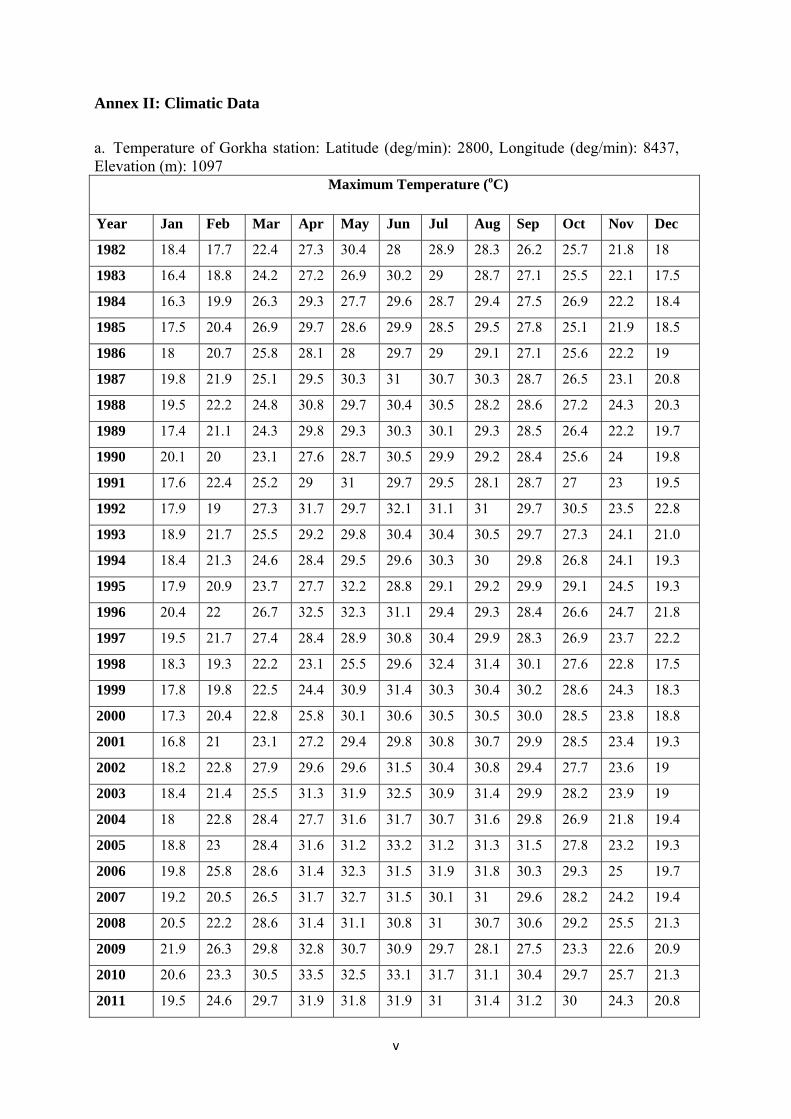
v
Annex II: Climatic Data
a. Temperature of Gorkha station: Latitude (deg/min): 2800, Longitude (deg/min): 8437, Elevation (m): 1097
Maximum Temperature (oC)
Year Jan Feb Mar Apr May Jun Jul Aug Sep Oct Nov Dec
1982 18.4 17.7 22.4 27.3 30.4 28 28.9 28.3 26.2 25.7 21.8 18
1983 16.4 18.8 24.2 27.2 26.9 30.2 29 28.7 27.1 25.5 22.1 17.5
1984 16.3 19.9 26.3 29.3 27.7 29.6 28.7 29.4 27.5 26.9 22.2 18.4
1985 17.5 20.4 26.9 29.7 28.6 29.9 28.5 29.5 27.8 25.1 21.9 18.5
1986 18 20.7 25.8 28.1 28 29.7 29 29.1 27.1 25.6 22.2 19
1987 19.8 21.9 25.1 29.5 30.3 31 30.7 30.3 28.7 26.5 23.1 20.8
1988 19.5 22.2 24.8 30.8 29.7 30.4 30.5 28.2 28.6 27.2 24.3 20.3
1989 17.4 21.1 24.3 29.8 29.3 30.3 30.1 29.3 28.5 26.4 22.2 19.7
1990 20.1 20 23.1 27.6 28.7 30.5 29.9 29.2 28.4 25.6 24 19.8
1991 17.6 22.4 25.2 29 31 29.7 29.5 28.1 28.7 27 23 19.5
1992 17.9 19 27.3 31.7 29.7 32.1 31.1 31 29.7 30.5 23.5 22.8
1993 18.9 21.7 25.5 29.2 29.8 30.4 30.4 30.5 29.7 27.3 24.1 21.0
1994 18.4 21.3 24.6 28.4 29.5 29.6 30.3 30 29.8 26.8 24.1 19.3
1995 17.9 20.9 23.7 27.7 32.2 28.8 29.1 29.2 29.9 29.1 24.5 19.3
1996 20.4 22 26.7 32.5 32.3 31.1 29.4 29.3 28.4 26.6 24.7 21.8
1997 19.5 21.7 27.4 28.4 28.9 30.8 30.4 29.9 28.3 26.9 23.7 22.2
1998 18.3 19.3 22.2 23.1 25.5 29.6 32.4 31.4 30.1 27.6 22.8 17.5
1999 17.8 19.8 22.5 24.4 30.9 31.4 30.3 30.4 30.2 28.6 24.3 18.3
2000 17.3 20.4 22.8 25.8 30.1 30.6 30.5 30.5 30.0 28.5 23.8 18.8
2001 16.8 21 23.1 27.2 29.4 29.8 30.8 30.7 29.9 28.5 23.4 19.3
2002 18.2 22.8 27.9 29.6 29.6 31.5 30.4 30.8 29.4 27.7 23.6 19
2003 18.4 21.4 25.5 31.3 31.9 32.5 30.9 31.4 29.9 28.2 23.9 19
2004 18 22.8 28.4 27.7 31.6 31.7 30.7 31.6 29.8 26.9 21.8 19.4
2005 18.8 23 28.4 31.6 31.2 33.2 31.2 31.3 31.5 27.8 23.2 19.3
2006 19.8 25.8 28.6 31.4 32.3 31.5 31.9 31.8 30.3 29.3 25 19.7
2007 19.2 20.5 26.5 31.7 32.7 31.5 30.1 31 29.6 28.2 24.2 19.4
2008 20.5 22.2 28.6 31.4 31.1 30.8 31 30.7 30.6 29.2 25.5 21.3
2009 21.9 26.3 29.8 32.8 30.7 30.9 29.7 28.1 27.5 23.3 22.6 20.9
2010 20.6 23.3 30.5 33.5 32.5 33.1 31.7 31.1 30.4 29.7 25.7 21.3
2011 19.5 24.6 29.7 31.9 31.8 31.9 31 31.4 31.2 30 24.3 20.8
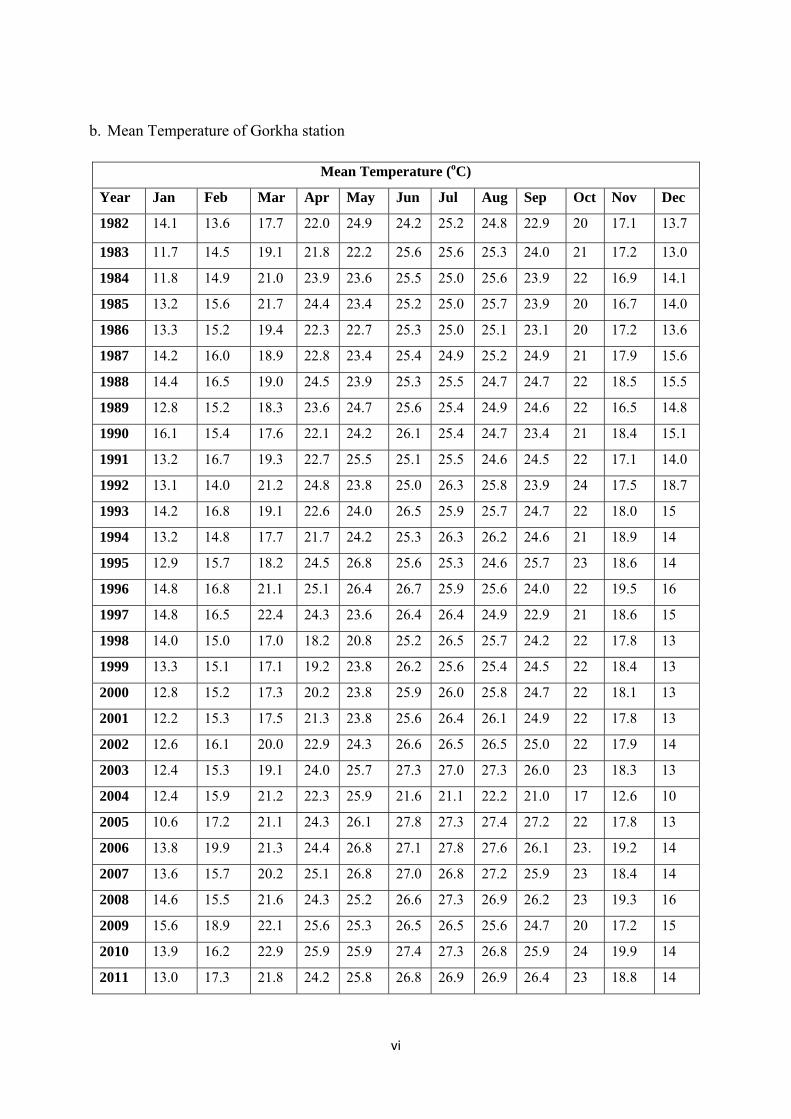
vi
b. Mean Temperature of Gorkha station
Mean Temperature (oC)
Year Jan Feb Mar Apr May Jun Jul Aug Sep Oct Nov Dec
1982 14.1 13.6 17.7 22.0 24.9 24.2 25.2 24.8 22.9 20 17.1 13.7
1983 11.7 14.5 19.1 21.8 22.2 25.6 25.6 25.3 24.0 21 17.2 13.0
1984 11.8 14.9 21.0 23.9 23.6 25.5 25.0 25.6 23.9 22 16.9 14.1
1985 13.2 15.6 21.7 24.4 23.4 25.2 25.0 25.7 23.9 20 16.7 14.0
1986 13.3 15.2 19.4 22.3 22.7 25.3 25.0 25.1 23.1 20 17.2 13.6
1987 14.2 16.0 18.9 22.8 23.4 25.4 24.9 25.2 24.9 21 17.9 15.6
1988 14.4 16.5 19.0 24.5 23.9 25.3 25.5 24.7 24.7 22 18.5 15.5
1989 12.8 15.2 18.3 23.6 24.7 25.6 25.4 24.9 24.6 22 16.5 14.8
1990 16.1 15.4 17.6 22.1 24.2 26.1 25.4 24.7 23.4 21 18.4 15.1
1991 13.2 16.7 19.3 22.7 25.5 25.1 25.5 24.6 24.5 22 17.1 14.0
1992 13.1 14.0 21.2 24.8 23.8 25.0 26.3 25.8 23.9 24 17.5 18.7
1993 14.2 16.8 19.1 22.6 24.0 26.5 25.9 25.7 24.7 22 18.0 15
1994 13.2 14.8 17.7 21.7 24.2 25.3 26.3 26.2 24.6 21 18.9 14
1995 12.9 15.7 18.2 24.5 26.8 25.6 25.3 24.6 25.7 23 18.6 14
1996 14.8 16.8 21.1 25.1 26.4 26.7 25.9 25.6 24.0 22 19.5 16
1997 14.8 16.5 22.4 24.3 23.6 26.4 26.4 24.9 22.9 21 18.6 15
1998 14.0 15.0 17.0 18.2 20.8 25.2 26.5 25.7 24.2 22 17.8 13
1999 13.3 15.1 17.1 19.2 23.8 26.2 25.6 25.4 24.5 22 18.4 13
2000 12.8 15.2 17.3 20.2 23.8 25.9 26.0 25.8 24.7 22 18.1 13
2001 12.2 15.3 17.5 21.3 23.8 25.6 26.4 26.1 24.9 22 17.8 13
2002 12.6 16.1 20.0 22.9 24.3 26.6 26.5 26.5 25.0 22 17.9 14
2003 12.4 15.3 19.1 24.0 25.7 27.3 27.0 27.3 26.0 23 18.3 13
2004 12.4 15.9 21.2 22.3 25.9 21.6 21.1 22.2 21.0 17 12.6 10
2005 10.6 17.2 21.1 24.3 26.1 27.8 27.3 27.4 27.2 22 17.8 13
2006 13.8 19.9 21.3 24.4 26.8 27.1 27.8 27.6 26.1 23. 19.2 14
2007 13.6 15.7 20.2 25.1 26.8 27.0 26.8 27.2 25.9 23 18.4 14
2008 14.6 15.5 21.6 24.3 25.2 26.6 27.3 26.9 26.2 23 19.3 16
2009 15.6 18.9 22.1 25.6 25.3 26.5 26.5 25.6 24.7 20 17.2 15
2010 13.9 16.2 22.9 25.9 25.9 27.4 27.3 26.8 25.9 24 19.9 14
2011 13.0 17.3 21.8 24.2 25.8 26.8 26.9 26.9 26.4 23 18.8 14

vii
c. Minimum Temperature of Gorkha station
Minimum Temperature (oC)
Year Jan Feb Mar Apr May Jun Jul Aug Sep Oct Nov Dec
1982 9.7 9.5 12.9 16.4 19.3 20.3 21.4 21.3 19.3 15.6 12.4 9.3
1983 6.9 10.1 13.8 16.3 17.5 21.1 22.1 21.9 20.8 17.2 12.3 8.5
1984 7.3 9.8 15.7 18.5 19.4 21.4 21.3 21.6 20.2 17.5 11.5 9.7
1985 8.9 10.8 16.5 19 18.1 20.4 21.3 21.9 19.9 16.1 11.4 9.4
1986 8.5 9.7 12.9 16.5 17.4 20.9 21 21 19.1 14.9 12.1 8.2
1987 8.6 10 12.6 16.1 16.4 19.7 19.1 20.1 21.1 17.3 12.7 10.4
1988 9.2 10.7 13.2 18.2 18 20.2 20.5 21.1 20.8 17.8 12.6 10.6
1989 8.2 9.3 12.3 17.3 20.1 20.9 20.6 20.5 20.6 18.1 10.8 9.9
1990 12.1 10.7 12.1 16.6 19.6 21.6 20.9 20.1 18.3 17.1 12.7 10.4
1991 8.8 10.9 13.4 16.3 19.9 20.4 21.5 21.1 20.3 17.4 11.2 8.4
1992 8.2 8.9 15.1 17.8 17.8 17.9 21.5 20.5 18 18.7 11.5 14.5
1993 9.5 11.9 12.6 15.9 18.2 22.5 21.4 20.8 19.6 16.6 11.9 9.4
1994 8 8.3 10.9 15 18.8 20.9 22.2 22.4 19.4 15.9 13.6 8.6
1995 7.8 10.4 12.6 21.2 21.4 22.3 21.4 20 21.5 17.8 12.7 10.1
1996 9.1 11.6 15.4 17.6 20.5 22.1 22.3 21.8 19.6 18.3 14.3 11
1997 10.1 11.3 17.3 20.2 18.3 22 22.4 19.8 17.4 16.3 13.4 9
1998 9.6 10.7 11.8 13.3 16.1 20.8 20.5 20 18.3 16.7 12.6 9.9
1999 8.95 10.3 11.8 14.0 16.8 21 21 20.5 18.8 16.7 12.5 9.17
2000 8.3 10.0 11.9 14.7 17.5 21.2 21.5 21.0 19.4 16.7 12.4 8.43
2001 7.65 9.73 11.9 15.4 18.2 21.4 22 21.5 19.9 16.7 12.3 7.7
2002 7 9.4 12 16.2 18.9 21.6 22.5 22.1 20.5 16.8 12.2 9.2
2003 6.3 9.2 12.6 16.7 19.5 22.1 23 23.2 22 17.9 12.7 8.3
2004 6.7 9 13.9 16.9 20.2 11.5 11.4 12.7 12.1 7.1 3.4 2.4
2005 2.3 11.4 13.9 17.1 20.9 22.3 23.3 23.4 22.8 17.9 12.3 8.3
2006 7.8 13.9 13.9 17.4 21.3 22.6 23.7 23.3 21.9 18.5 13.4 10.1
2007 8 10.8 13.8 18.5 20.8 22.4 23.4 23.3 22.1 19 12.6 8.5
2008 8.65 8.8 14.5 17.1 19.3 22.4 23.5 23.1 21.8 17.5 13 10.7
2009 9.3 11.5 14.3 18.4 19.8 22.1 23.2 23.1 21.9 17.8 11.6 9.3
2010 7.1 9.1 15.3 18.2 19.3 21.6 22.9 22.4 21.3 18.2 14 7.6
2011 6.6 10.1 13.9 16.5 19.9 21.8 22.8 22.5 21.7 17.7 13.3 8.5

viii
d. Rainfall for Chame Station
Latitude (deg/min): 2833, Longitude (deg/min): 8414, Elevation (m): 2680
Rainfall (mm)
Year Jan Feb Mar Apr May Jun Jul Aug Sep Oct Nov Dec
1982 60.9 83.3 158 61.9 48.7 35.6 169 149 119 39.5 11 0
1983 17.8 3.5 129 72 123 98.8 166 91.9 190 87.5 0 30.5
1984 15.5 20.1 62.6 82 18 118 176 65 187 0 0 15
1985 31 35 116 71.9 63.9 89.2 231 173 319 318 3.1 37
1986 3.4 70 72.4 71.9 50.2 105 182 64 144 58 7.8 23
1987 2.2 48 23.9 103. 95.7 22.1 176 36 231 188 5.4 30
1988 21 0 34.6 51.6 66.7 58.6 196 91 231 188 5.4 30
1989 12 24 29.2 77.7 102 206 246 167 216 68 26 14
1990 3.5 79 143 59.6 63.8 69.1 193 109 167 54 2.3 11
1991 40.3 38 98.4 63.2 39.4 132 181 186 133. 2.8 35 51.7
1992 45.5 67 51.4 18 48.9 76.2 161 162 79.5 74 11 0
1993 39.5 37 65.6 0 34.8 100 119 159 226. 15.1 0 0
1994 52.2 39 6 110. 40.3 91.7 127 126 143. 7.3 2 2.3
1995 110 94 159 52.2 65.2 155 184 192 114. 14.2 158 17.6
1996 27.8 157 61.9 32.6 59 129 156 178 138 224 0 0
1997 23.2 60 96.4 74 71.6 70 149 270 110. 64.4 73 156
1998 0 87 166 33 39 73.2 167 108 39 9 10 0.8
1999 16.4 54 7.6 5 108 182 116 133 88 32.2 0 6.4
2000 11 24 19 31 20 116 136 140 76 0 18 0
2001 6.2 28 23.8 23 25.2 112 121 146 34 6.2 2 0
2002 62.8 35 32.8 74 87.2 97.6 80. 152 253. 0 34 0
2003 40 49 115 55.6 40.2 137 113 203 149. 7 0 43
2004 27.6 22 5 49.2 46.6 168 258 186 185 26 0 0
2005 89 38 100 104 80 60 239 309 21 133 0 0
2006 0 0 67 0 101 42 366 287 84 0 0 0
2007 7 174 7 146 6 180 435 438 250 27 0 11.7
2008 56.2 41 50 53 80.6 385 210 88 59.5 9.6 0 0
2009 0 12 49.3 0 94.3 7 68. 141 21 86.2 0 3
2010 16.3 66 55 64.5 184 135 235 263 214. 0 0 0
2011 11.4 18 37 56.6 57.7 184 223 143 124. 0 7.6 0
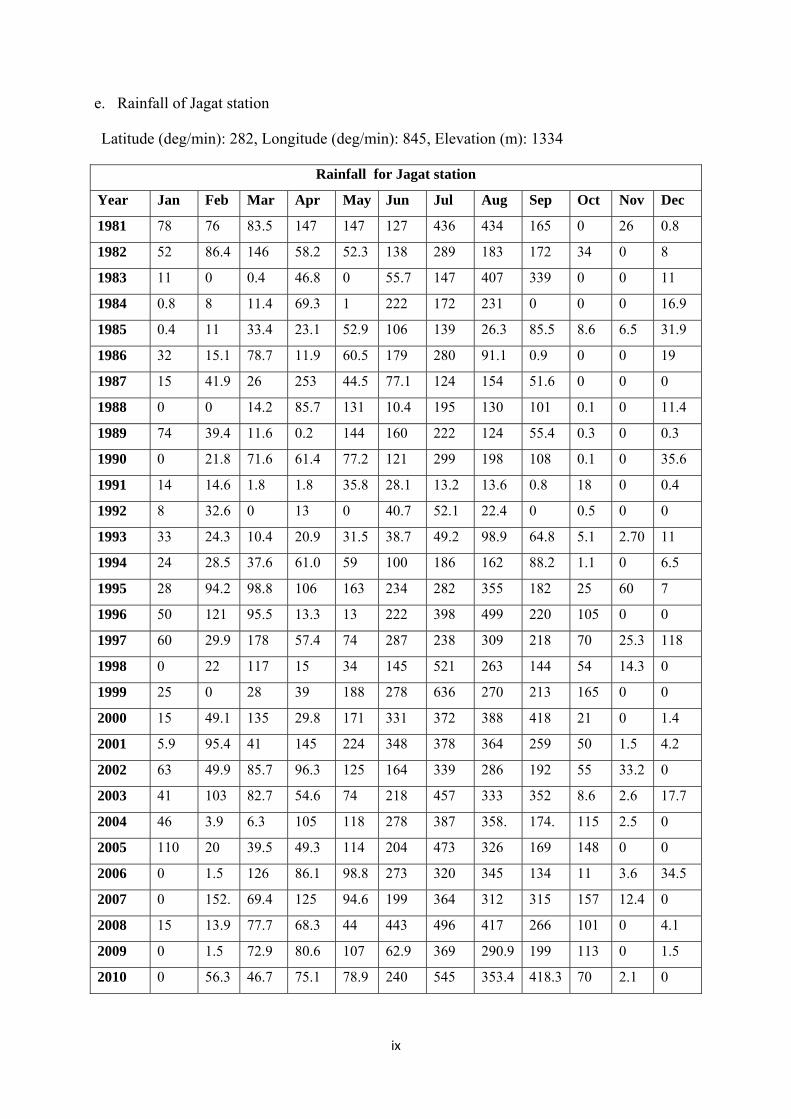
ix
e. Rainfall of Jagat station
Latitude (deg/min): 282, Longitude (deg/min): 845, Elevation (m): 1334
Rainfall for Jagat station
Year Jan Feb Mar Apr May Jun Jul Aug Sep Oct Nov Dec
1981 78 76 83.5 147 147 127 436 434 165 0 26 0.8
1982 52 86.4 146 58.2 52.3 138 289 183 172 34 0 8
1983 11 0 0.4 46.8 0 55.7 147 407 339 0 0 11
1984 0.8 8 11.4 69.3 1 222 172 231 0 0 0 16.9
1985 0.4 11 33.4 23.1 52.9 106 139 26.3 85.5 8.6 6.5 31.9
1986 32 15.1 78.7 11.9 60.5 179 280 91.1 0.9 0 0 19
1987 15 41.9 26 253 44.5 77.1 124 154 51.6 0 0 0
1988 0 0 14.2 85.7 131 10.4 195 130 101 0.1 0 11.4
1989 74 39.4 11.6 0.2 144 160 222 124 55.4 0.3 0 0.3
1990 0 21.8 71.6 61.4 77.2 121 299 198 108 0.1 0 35.6
1991 14 14.6 1.8 1.8 35.8 28.1 13.2 13.6 0.8 18 0 0.4
1992 8 32.6 0 13 0 40.7 52.1 22.4 0 0.5 0 0
1993 33 24.3 10.4 20.9 31.5 38.7 49.2 98.9 64.8 5.1 2.70 11
1994 24 28.5 37.6 61.0 59 100 186 162 88.2 1.1 0 6.5
1995 28 94.2 98.8 106 163 234 282 355 182 25 60 7
1996 50 121 95.5 13.3 13 222 398 499 220 105 0 0
1997 60 29.9 178 57.4 74 287 238 309 218 70 25.3 118
1998 0 22 117 15 34 145 521 263 144 54 14.3 0
1999 25 0 28 39 188 278 636 270 213 165 0 0
2000 15 49.1 135 29.8 171 331 372 388 418 21 0 1.4
2001 5.9 95.4 41 145 224 348 378 364 259 50 1.5 4.2
2002 63 49.9 85.7 96.3 125 164 339 286 192 55 33.2 0
2003 41 103 82.7 54.6 74 218 457 333 352 8.6 2.6 17.7
2004 46 3.9 6.3 105 118 278 387 358. 174. 115 2.5 0
2005 110 20 39.5 49.3 114 204 473 326 169 148 0 0
2006 0 1.5 126 86.1 98.8 273 320 345 134 11 3.6 34.5
2007 0 152. 69.4 125 94.6 199 364 312 315 157 12.4 0
2008 15 13.9 77.7 68.3 44 443 496 417 266 101 0 4.1
2009 0 1.5 72.9 80.6 107 62.9 369 290.9 199 113 0 1.5
2010 0 56.3 46.7 75.1 78.9 240 545 353.4 418.3 70 2.1 0

x
f. Minimum Discharge for Arughat station
Latidude (deg/min): 280237, Longitude (deg/min): 844859
Minimum Discharge (m3/sec)
Year Jan Feb Mar Apr May Jun Jul Aug Sep Oct Nov Dec
1981 38.7 37.8 26 48 102 144 339 375 233 110 61.6 42.3
1982 34.3 30.1 25.2 77 95 162 345 309 199 98.6 60.5 43.2
1983 34.3 28.4 26.9 35.2 63.8 111 196 309 255 132 74.8 47
1984 35.2 30.1 31.8 34.3 54 178 231 281 279 106 55 36.9
1985 39.3 27.4 36.2 37.7 42.1 85.3 219 276 211 154 73.6 48.6
1986 34 28 28 32 53.7 60.9 315 285 206 98.7 55.5 49.1
1987 33.4 29.3 28 35.3 54.6 135 278 321 158 111 59 37.7
1988 28 25.6 25.6 34.7 67.6 117 270 374 189 90.8 52.8 40.6
1989 39.1 33.4 38.4 53.7 64.7 131 272 332 346 102 56.8 39.1
1990 34.3 28 27.5 31.1 62.9 169 296 304 248 98.8 58.5 28.4
1991 21.1 26.3 25.7 37 75.9 101 271 397 204 84 51.9 36.3
1992 28.6 24 28.6 30.5 47.2 84 167 320 192 88.1 51.9 36.3
1993 29.2 24.6 22.4 26.9 79.9 128 246 361 277 98.8 58.5 37
1994 29.4 24 25.3 32.2 36.1 130 269 309 188 80.6 46.9 34
1995 28.1 27 25.1 36.4 94.2 214 333 383 192 84.3 57.7 38.6
1996 32.5 29.9 34.9 43.1 81.6 94.1 263 372 211 96.6 58.4 43.5
1997 31.1 27 30.4 32.8 51.9 77.8 324 343 150 67.6 53.1 37.7
1998 44.1 41 42 49.7 85.7 163 324 369 234 86.3 55.5 31.1
1999 22.5 20.3 21.2 25.6 42.5 51.9 282 389 297 122 59 40
2000 30 27 25.8 49.3 69.7 155 340 432 243 98.4 56.3 41.5
2001 33.3 28.7 26.8 30.3 60.7 106 320 343 190 90.3 55.7 36.3
2002 30.5 27.7 26.8 34.7 60.7 99.9 312 356 213 94.2 65.7 44.5
2003 34.9 30.7 32.7 52.8 54 132 368 379 255 97 56 41
2004 29.6 26.9 26.3 31.5 38.4 95.6 350 342 226 107 56.8 37.7
2005 30.3 26.5 29.4 32.4 53 83.3 272 312 159 95.6 54.4 34.1
2006 28 26.7 26.9 32.4 60.4 137 288 388 187 82.2 62.2 33.7
2007 26.5 25.7 25.9 50 51.1 71.1 306 358 193 108 56 34.3
2008 26.1 21.7 22.9 24 53 71.1 285 374 168 72 47.3 34
2009 27.6 22.7 19.9 24.3 39.4 59.5 168 261 142 72 47.3 33.5
2010 25.6 23.1 23.7 28.8 38.4 62 259 360 225 83 50.3 33.8
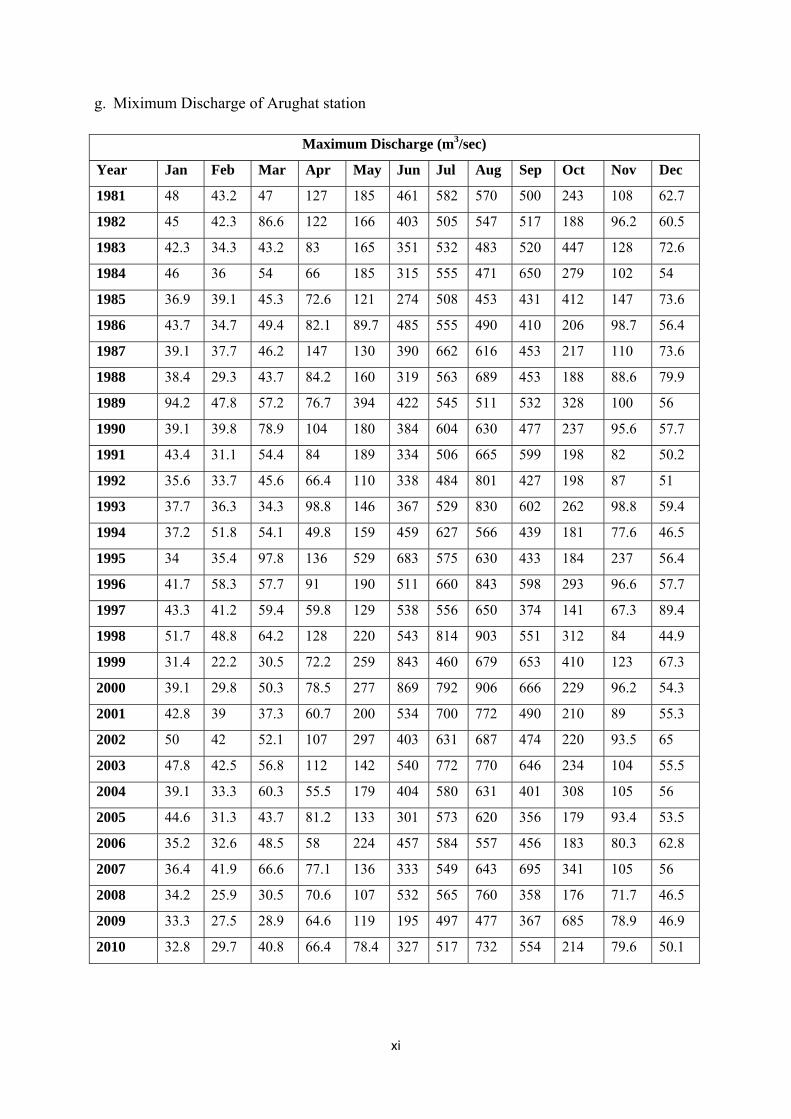
xi
g. Miximum Discharge of Arughat station
Maximum Discharge (m3/sec)
Year Jan Feb Mar Apr May Jun Jul Aug Sep Oct Nov Dec
1981 48 43.2 47 127 185 461 582 570 500 243 108 62.7
1982 45 42.3 86.6 122 166 403 505 547 517 188 96.2 60.5
1983 42.3 34.3 43.2 83 165 351 532 483 520 447 128 72.6
1984 46 36 54 66 185 315 555 471 650 279 102 54
1985 36.9 39.1 45.3 72.6 121 274 508 453 431 412 147 73.6
1986 43.7 34.7 49.4 82.1 89.7 485 555 490 410 206 98.7 56.4
1987 39.1 37.7 46.2 147 130 390 662 616 453 217 110 73.6
1988 38.4 29.3 43.7 84.2 160 319 563 689 453 188 88.6 79.9
1989 94.2 47.8 57.2 76.7 394 422 545 511 532 328 100 56
1990 39.1 39.8 78.9 104 180 384 604 630 477 237 95.6 57.7
1991 43.4 31.1 54.4 84 189 334 506 665 599 198 82 50.2
1992 35.6 33.7 45.6 66.4 110 338 484 801 427 198 87 51
1993 37.7 36.3 34.3 98.8 146 367 529 830 602 262 98.8 59.4
1994 37.2 51.8 54.1 49.8 159 459 627 566 439 181 77.6 46.5
1995 34 35.4 97.8 136 529 683 575 630 433 184 237 56.4
1996 41.7 58.3 57.7 91 190 511 660 843 598 293 96.6 57.7
1997 43.3 41.2 59.4 59.8 129 538 556 650 374 141 67.3 89.4
1998 51.7 48.8 64.2 128 220 543 814 903 551 312 84 44.9
1999 31.4 22.2 30.5 72.2 259 843 460 679 653 410 123 67.3
2000 39.1 29.8 50.3 78.5 277 869 792 906 666 229 96.2 54.3
2001 42.8 39 37.3 60.7 200 534 700 772 490 210 89 55.3
2002 50 42 52.1 107 297 403 631 687 474 220 93.5 65
2003 47.8 42.5 56.8 112 142 540 772 770 646 234 104 55.5
2004 39.1 33.3 60.3 55.5 179 404 580 631 401 308 105 56
2005 44.6 31.3 43.7 81.2 133 301 573 620 356 179 93.4 53.5
2006 35.2 32.6 48.5 58 224 457 584 557 456 183 80.3 62.8
2007 36.4 41.9 66.6 77.1 136 333 549 643 695 341 105 56
2008 34.2 25.9 30.5 70.6 107 532 565 760 358 176 71.7 46.5
2009 33.3 27.5 28.9 64.6 119 195 497 477 367 685 78.9 46.9
2010 32.8 29.7 40.8 66.4 78.4 327 517 732 554 214 79.6 50.1

xii
h. Mean Discharge of Arughat station
Mean Discharge (m3/sec)
Year Jan Feb Mar Apr May Jun Jul Aug Sep Oct Nov Dec
1981 43.1 40.6 40.7 80.9 119 262 457 447 302 168 82.2 51.5
1982 37.9 35.5 49.9 96.7 122 267 385 380 311 132 76.4 49.8
1983 37.8 30.8 35.7 45.9 108 177 320 388 358 215 98.6 55.9
1984 40.8 32.7 39.2 50.5 121 248 415 358 379 193 71.1 44.9
1985 32.7 31.4 40.2 48.6 64.2 152 391 338 330 209 104 55.9
1986 39.3 31.3 33.7 56.7 66.1 247 407 346 295 140 78.9 47.3
1987 35.4 31.8 33.3 55.8 77.7 193 429 432 288 136 84.2 46.6
1988 32.1 27.4 30.4 63.7 115 203 453 484 279 125 67.8 48.4
1989 46.1 38.5 40.3 64 138 221 366 409 438 188 76.9 48.1
1990 36.8 30.9 34.5 63.9 112 260 470 425 344 152 76.3 46.7
1991 34.2 28.4 34.4 49.8 116 236 378 515 362 132 64.9 42.4
1992 31.8 26.5 33.2 50.4 69.7 154 291 483 308 131 68.1 42.4
1993 32.5 30.1 27.3 52.9 112 201 368 496 365 166 76.9 45.4
1994 32.2 27.9 35.4 38 88.5 245 385 422 304 115 58.2 39.7
1995 31.1 29 37.8 62.7 189 344 420 490 299 126 77.7 47.5
1996 35.1 33.4 43.5 55.3 120 244 436 508 345 134 74.7 48.2
1997 35.2 30.1 36.4 44 62.6 189 418 374 276 91.6 54.1 48
1998 48.3 43 47.9 76 156 264 477 570 315 152 60.6 37.2
1999 26 21.2 23.2 46.8 90.4 258 570 597 413 204 97.1 51.7
2000 34.1 28.1 29.4 59.5 130 390 530 581 460 143 78.3 48.4
2001 37.1 31 29 40.4 98.8 290 480 514 338 139 66.3 46.9
2002 33.4 29.8 26.4 67.2 127 234 445 495 308 142 74.4 53.2
2003 38.9 34.2 39.8 74.6 90 255 518 477 414 146 73.3 46.5
2004 33.7 28.9 35.7 43.8 88.8 205 413 468 289 175 73.8 48
2005 34.2 28.7 35.2 52.1 87.6 164 419 459 242 123 70.4 43
2006 31.4 28.7 29.9 42.7 117 225 400 389 282 121 70.8 57.9
2007 29.5 27.6 35.6 61.3 76.1 192 401 457 371 171 74.9 43.5
2008 29.7 24.1 25.9 40.5 67.6 281 436 511 250 117 58.7 40.2
2009 29.8 24.5 22.6 42.7 59 112 304 358 235 153 59.4 49.9
2010 29.3 24.7 29.1 45.3 57.7 127 397 471 437 133 63.7 40.7
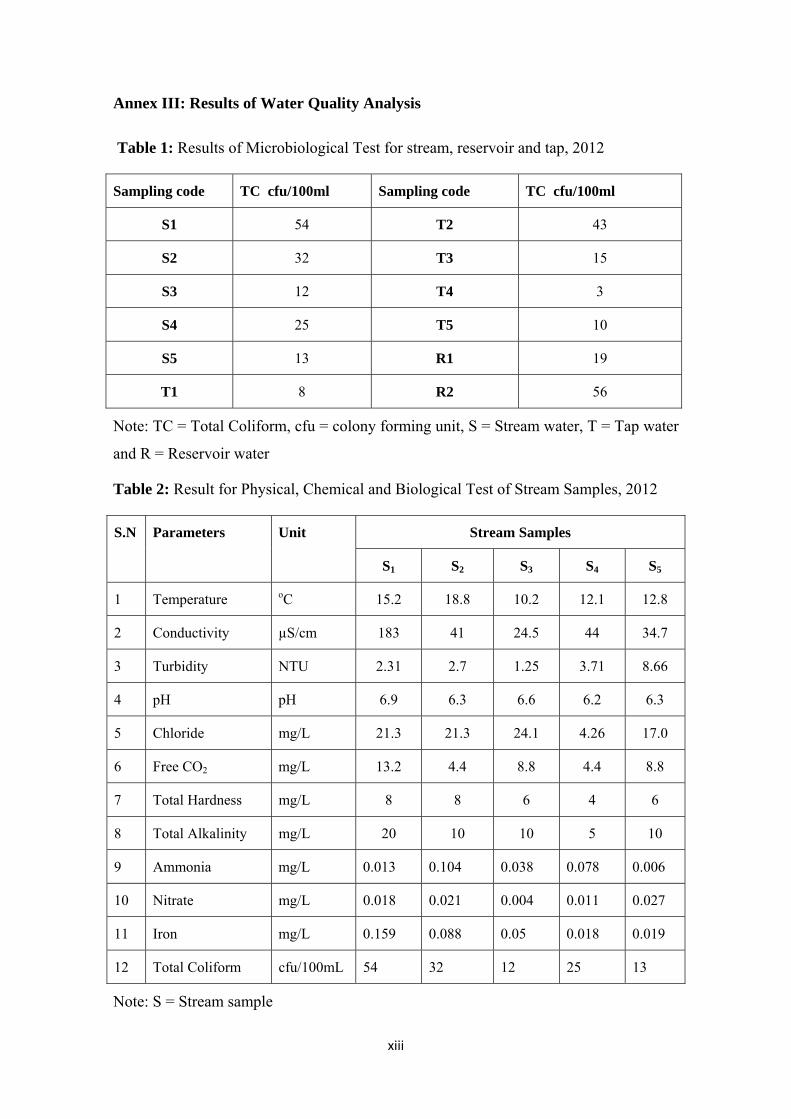
xiii
Annex III: Results of Water Quality Analysis
Table 1: Results of Microbiological Test for stream, reservoir and tap, 2012
Sampling code TC cfu/100ml Sampling code TC cfu/100ml
S1 54 T2 43
S2 32 T3 15
S3 12 T4 3
S4 25 T5 10
S5 13 R1 19
T1 8 R2 56
Note: TC = Total Coliform, cfu = colony forming unit, S = Stream water, T = Tap water
and R = Reservoir water
Table 2: Result for Physical, Chemical and Biological Test of Stream Samples, 2012
S.N Parameters Unit Stream Samples
S1 S2 S3 S4 S5
1 Temperature oC 15.2 18.8 10.2 12.1 12.8
2 Conductivity µS/cm 183 41 24.5 44 34.7
3 Turbidity NTU 2.31 2.7 1.25 3.71 8.66
4 pH pH 6.9 6.3 6.6 6.2 6.3
5 Chloride mg/L 21.3 21.3 24.1 4.26 17.0
6 Free CO2 mg/L 13.2 4.4 8.8 4.4 8.8
7 Total Hardness mg/L 8 8 6 4 6
8 Total Alkalinity mg/L 20 10 10 5 10
9 Ammonia mg/L 0.013 0.104 0.038 0.078 0.006
10 Nitrate mg/L 0.018 0.021 0.004 0.011 0.027
11 Iron mg/L 0.159 0.088 0.05 0.018 0.019
12 Total Coliform cfu/100mL 54 32 12 25 13
Note: S = Stream sample
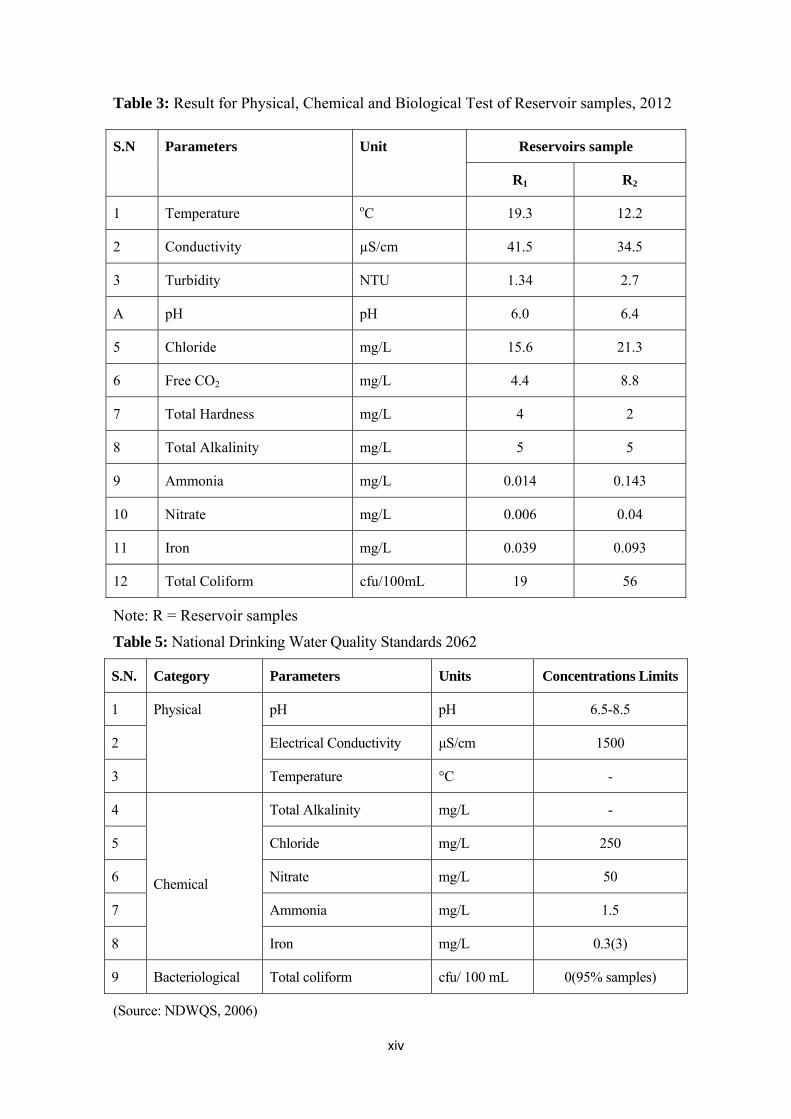
xiv
Table 3: Result for Physical, Chemical and Biological Test of Reservoir samples, 2012
S.N Parameters Unit Reservoirs sample
R1 R2
1 Temperature oC 19.3 12.2
2 Conductivity µS/cm 41.5 34.5
3 Turbidity NTU 1.34 2.7
A pH pH 6.0 6.4
5 Chloride mg/L 15.6 21.3
6 Free CO2 mg/L 4.4 8.8
7 Total Hardness mg/L 4 2
8 Total Alkalinity mg/L 5 5
9 Ammonia mg/L 0.014 0.143
10 Nitrate mg/L 0.006 0.04
11 Iron mg/L 0.039 0.093
12 Total Coliform cfu/100mL 19 56
Note: R = Reservoir samples
Table 5: National Drinking Water Quality Standards 2062
S.N. Category Parameters Units Concentrations Limits
1 Physical
pH pH 6.5-8.5
2 Electrical Conductivity μS/cm 1500
3 Temperature °C -
4
Chemical
Total Alkalinity mg/L -
5 Chloride mg/L 250
6 Nitrate mg/L 50
7 Ammonia mg/L 1.5
8 Iron mg/L 0.3(3)
9 Bacteriological Total coliform cfu/ 100 mL 0(95% samples)
(Source: NDWQS, 2006)
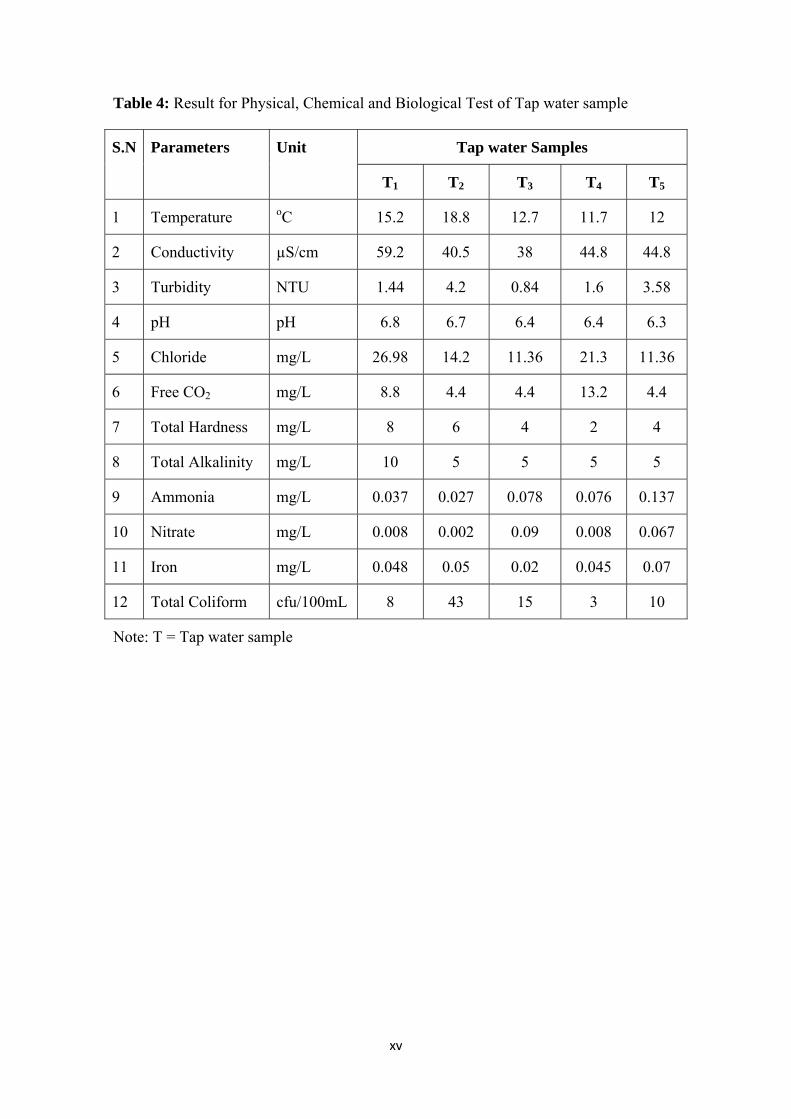
xv
Table 4: Result for Physical, Chemical and Biological Test of Tap water sample
S.N Parameters Unit Tap water Samples
T1 T2 T3 T4 T5
1 Temperature oC 15.2 18.8 12.7 11.7 12
2 Conductivity µS/cm 59.2 40.5 38 44.8 44.8
3 Turbidity NTU 1.44 4.2 0.84 1.6 3.58
4 pH pH 6.8 6.7 6.4 6.4 6.3
5 Chloride mg/L 26.98 14.2 11.36 21.3 11.36
6 Free CO2 mg/L 8.8 4.4 4.4 13.2 4.4
7 Total Hardness mg/L 8 6 4 2 4
8 Total Alkalinity mg/L 10 5 5 5 5
9 Ammonia mg/L 0.037 0.027 0.078 0.076 0.137
10 Nitrate mg/L 0.008 0.002 0.09 0.008 0.067
11 Iron mg/L 0.048 0.05 0.02 0.045 0.07
12 Total Coliform cfu/100mL 8 43 15 3 10
Note: T = Tap water sample
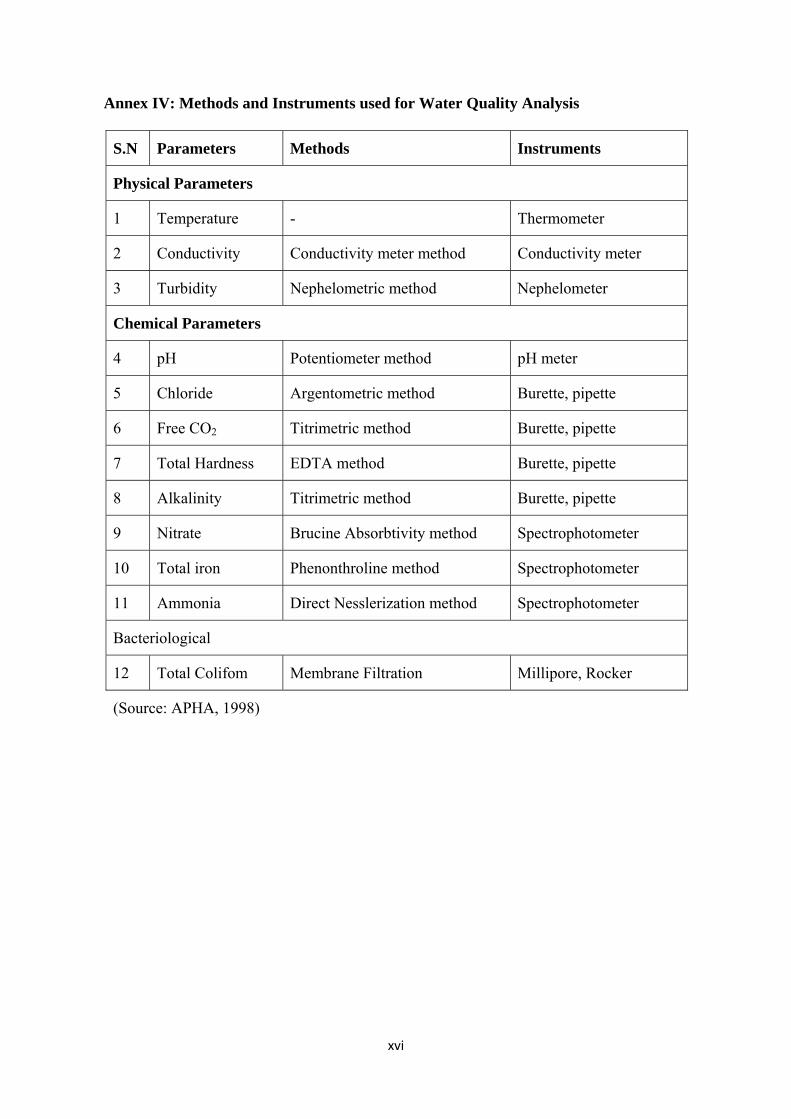
xvi
Annex IV: Methods and Instruments used for Water Quality Analysis
S.N Parameters Methods Instruments
Physical Parameters
1 Temperature - Thermometer
2 Conductivity Conductivity meter method Conductivity meter
3 Turbidity Nephelometric method Nephelometer
Chemical Parameters
4 pH Potentiometer method pH meter
5 Chloride Argentometric method Burette, pipette
6 Free CO2 Titrimetric method Burette, pipette
7 Total Hardness EDTA method Burette, pipette
8 Alkalinity Titrimetric method Burette, pipette
9 Nitrate Brucine Absorbtivity method Spectrophotometer
10 Total iron Phenonthroline method Spectrophotometer
11 Ammonia Direct Nesslerization method Spectrophotometer
Bacteriological
12 Total Colifom Membrane Filtration Millipore, Rocker
(Source: APHA, 1998)
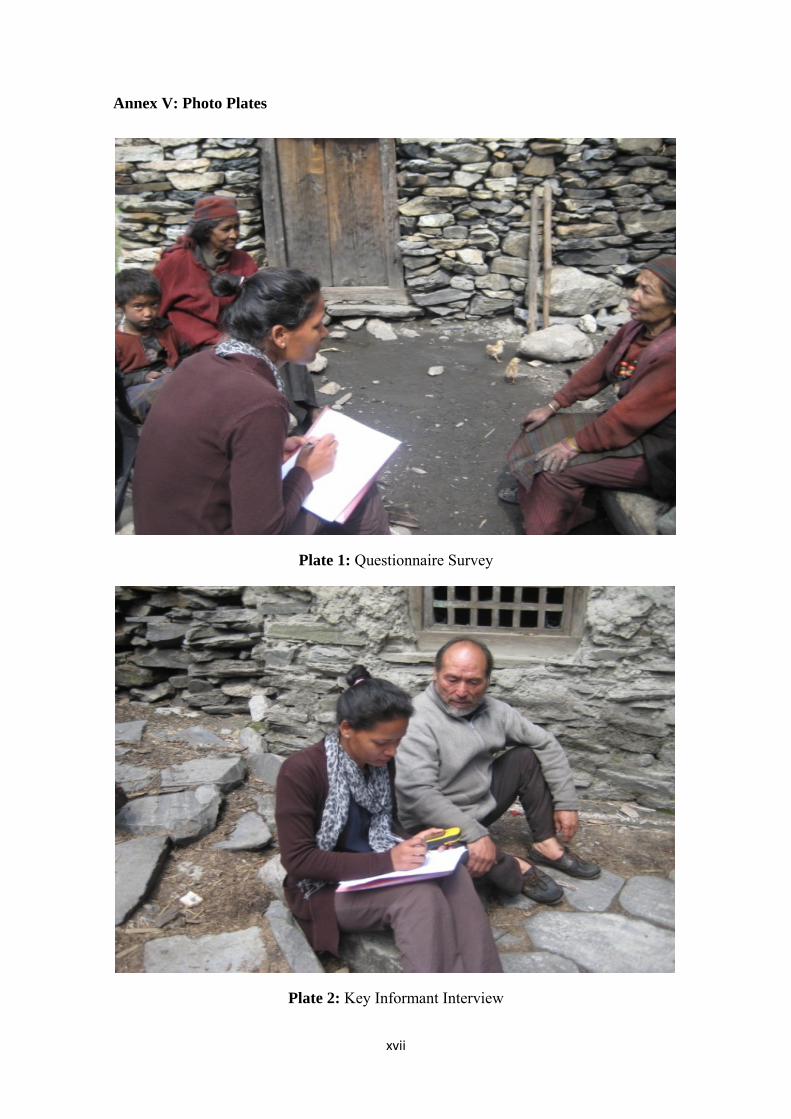
xvii
Annex V: Photo Plates
Plate 1: Questionnaire Survey
Plate 2: Key Informant Interview
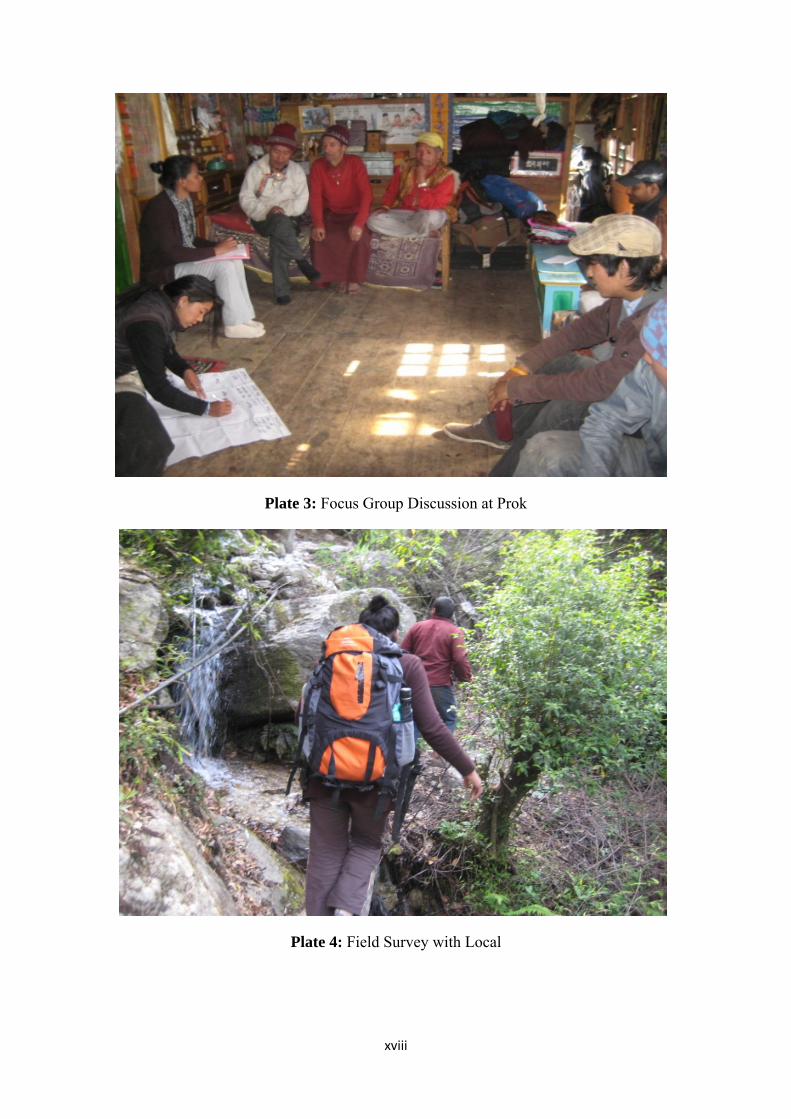
xviii
Plate 3: Focus Group Discussion at Prok
Plate 4: Field Survey with Local
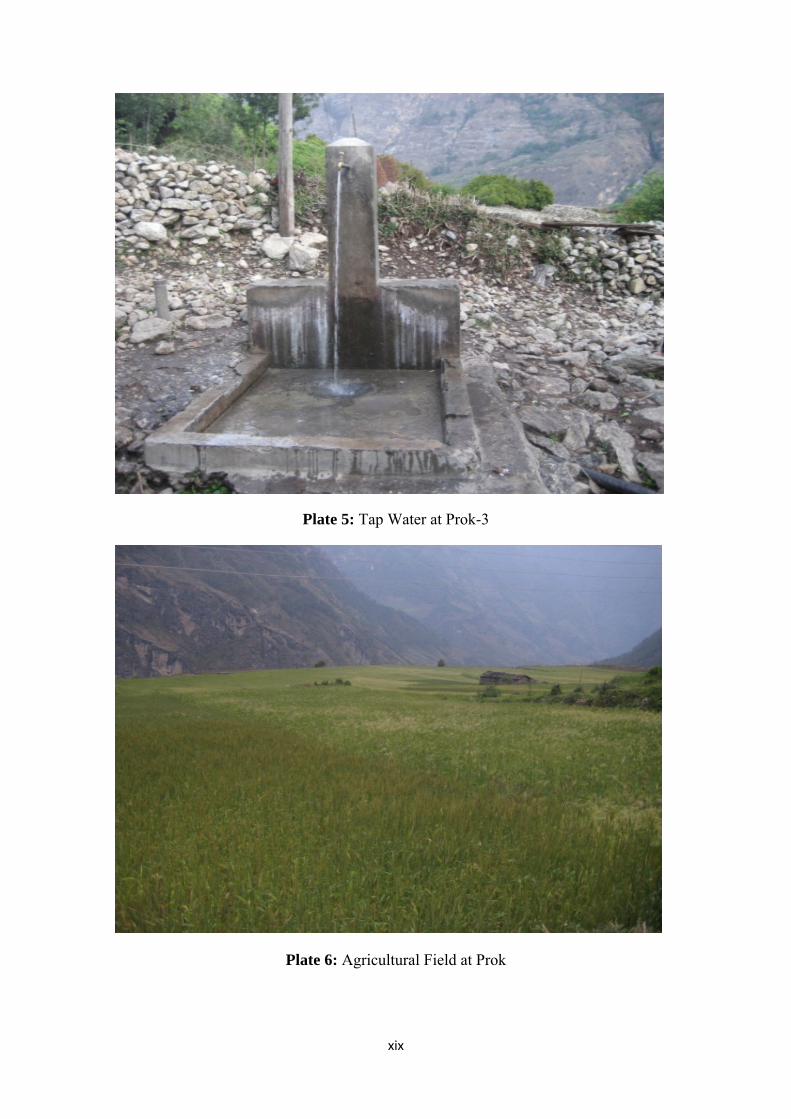
xix
Plate 5: Tap Water at Prok-3
Plate 6: Agricultural Field at Prok
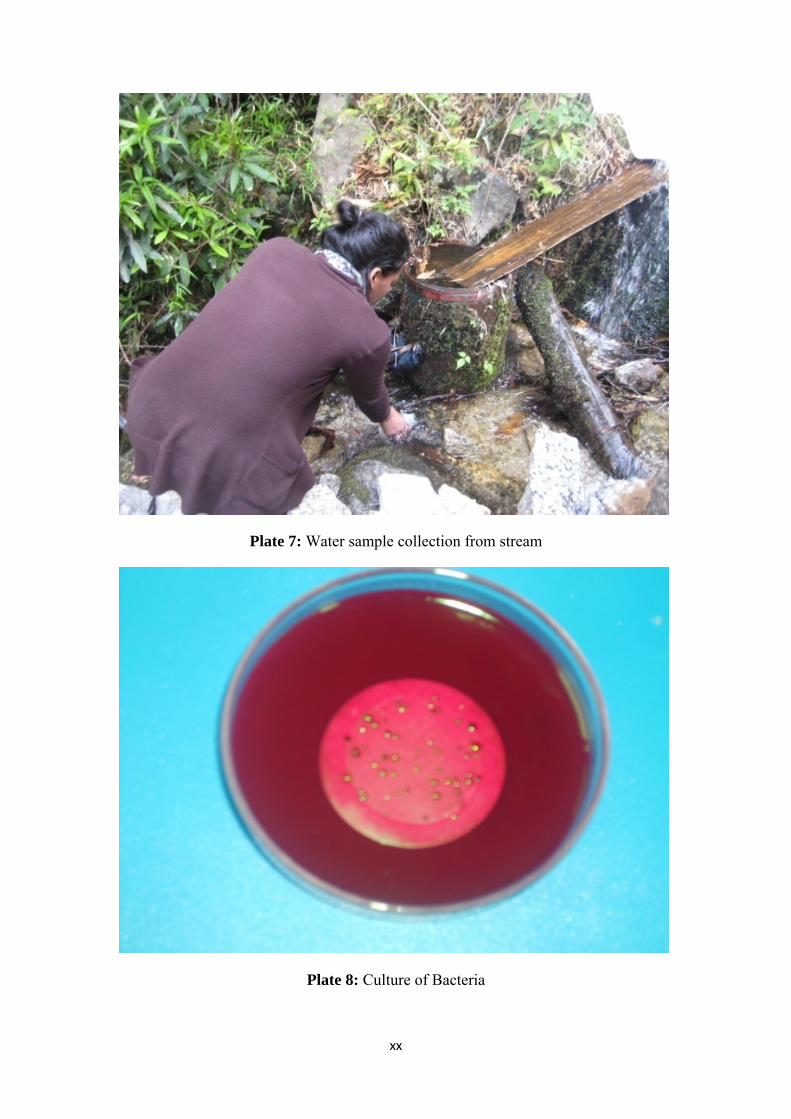
xx
Plate 7: Water sample collection from stream
Plate 8: Culture of Bacteria
Top Related