


![GISS-E2.1: Configurations and Climatologyoceans.mit.edu/JohnMarshall/wp-content/uploads/2020/01/GISS_Kell… · 86 R and GISS-E2-H in CMIP5 [Schmidt et al., 2014], and GISS-E2.1-G](https://static.fdocuments.net/doc/165x107/5f165c6a8b5d166c5d052b56/giss-e21-conigurations-and-86-r-and-giss-e2-h-in-cmip5-schmidt-et-al-2014.jpg)
Languages
Pages
Legal


Responding to Climate Change in New York State The ClimAID Integrated Assessment for
Effec8ve Climate Change Adapta8on Strategies
April 11, 2012
Daniel Bader

ClimAID Goals
To provide New York State with cuBng-‐edge informaFon on its vulnerability to climate change and to facilitate the development of adaptaFon policies informed by both local experience and state-‐of-‐the-‐art scienFfic knowledge.
2

ClimAID in Context Interac9ons of the ClimAID Assessment with other climate change adapta9on ini9a9ves in New York State
Now contribu,ng to the US Na,onal Climate Assessment, including the Northeast and Urban technical reports
3

Sectors -‐ Water Resources -‐ Coastal Zones -‐ Ecosystems -‐ Agriculture -‐ Energy -‐ TransportaFon -‐ TelecommunicaFons -‐ Public health
IntegraFng Themes -‐ Climate -‐ Vulnerability -‐ AdaptaFon -‐ Equity & Environmental JusFce -‐ Economics
Structure
4

ClimAID Case Studies
Sector Case Study Title
Water Resources Susquehanna River Flooding, June 2006
Coastal Zones 1-‐in-‐100-‐Year Flood and Environmental JusFce
Ecosystems Brook Trout – ReducFon in Habitat Due to Warming Summers
Agriculture Dairy Heat Stress
Energy Climate Change-‐Induced Heat Wave in New York City
TransportaFon Future Coastal Strom Impacts on TransportaFon in the New York Metropolitan Region
TelecommunicaFons Winter Storm in Central, Western, and Northern New York
Public Health Heat-‐related Mortality Among People Age 65 and Older
In-‐depth case studies including economic and environmental jus9ce analysis
Addi8onal case studies found in the report 5

New York State Climate Regions
6

IntegraFng Mechanisms Climate
7

IntegraFng Mechanisms Climate
Climate ProjecFons 16 Global Climate Models 3 Greenhouse gas emission scenarios StaFsFcally downscaled to ClimAID regions
Average Annual Temperature Total Annual PrecipitaFon
8

IntegraFng Mechanisms Climate
Modeled Sea Level Rise 2020s 2050s 2080s GCM-‐based +1 to +5 +5 to +12 +8 to +23 Rapid Ice Melt Scenario +4 to +10 +17 to +29 +37 to +55
Projected Sea Level Rise for New York State (inches)
• Projected increase in heat wave occurrence and magnitude • Observed and projected increases in heavy rainfall • Projected increases in short-‐term summer drought
Changes in extreme events
9

IntegraFng Vulnerability and AdaptaFon
ClimAID
NY is HERE 10

IntegraFng Vulnerability and AdaptaFon
Magnitude Area or number of people affected; degree of damage caused
Timing Near term or distant future
Persistence and reversibility Rare events becoming more frequent
Likelihood Confidence in esFmates
DistribuFonal aspects Statewide, within a region or among socio-‐economic groups
RelaFve importance of the at-‐risk systems Livelihood dependence on a system
Thresholds or Fpping/trigger points That could exacerbate change or iniFate policy
Factors Used to Evaluate Vulnerability
11

IntegraFng Vulnerability and AdaptaFon
Categories of AdaptaFon Strategies
Type Behavior; Management/operaFons; Infrastructural/physical component Risk-‐sharing; Policy (including insFtuFonal and legal)
AdministraFve group Public vs. private Governance scale (local/municipal, county, state, naFonal)
Level of effort Incremental acFon, paradigm shij
Timing Years to implementaFon Speed of implementaFon (near-‐term/long-‐term)
Scale Widespread, clustered, isolated/unique
12

IntegraFng Vulnerability and AdaptaFon
Cost EsFmate benefits and costs
Feasibility Any technological, legal or policy hurdles?
Efficacy To what extent will the strategy reduce the risk?
Timing Factors affecFng the implementaFon schedule
Robustness Flexible adaptaFon pathways
Co-‐benefits/unintended consequences MiFgaFon, cross sectors, etc.
Resiliency Able to withstand shocks and stress?
Impacts on environmental jusFce communiFes NegaFve or posiFve impacts for communiFes already stressed by environmental risk exposures?
ConsideraFons for EvaluaFng AdaptaFon Strategies
13
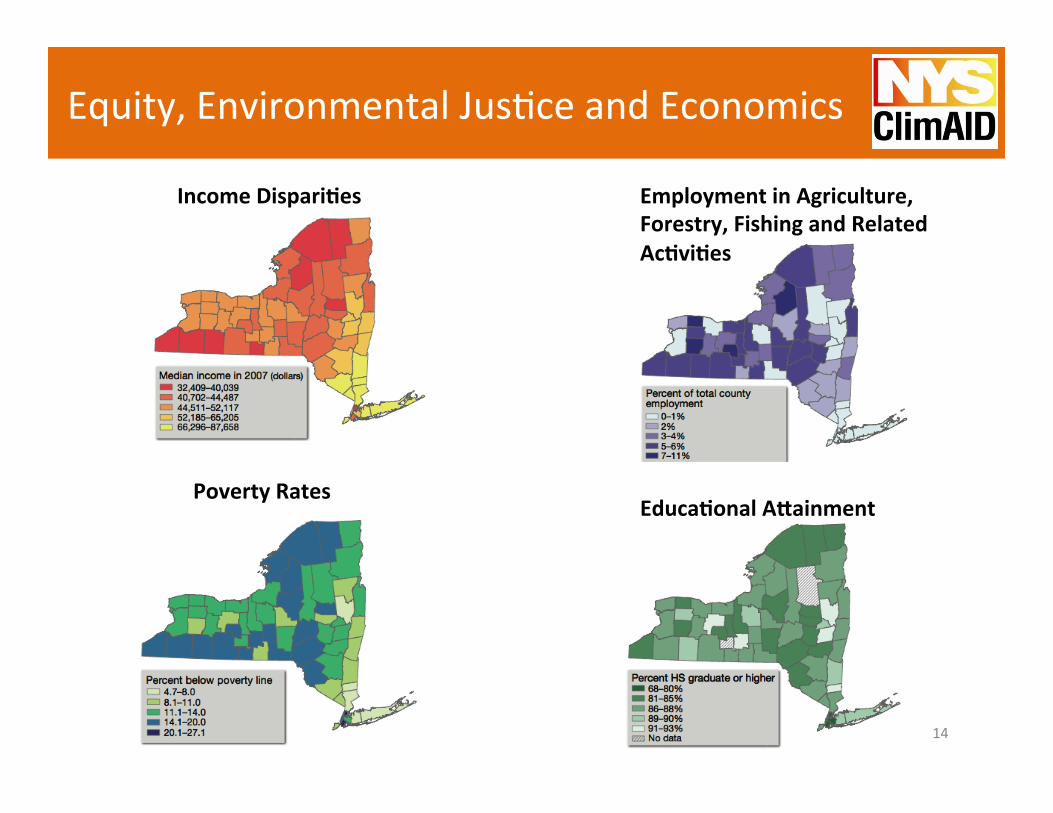
Equity, Environmental JusFce and Economics
Income Dispari9es
Poverty Rates Educa9onal AEainment
Employment in Agriculture, Forestry, Fishing and Related Ac9vi9es
14

Water Resources Key Climate Impacts
Heavy rainfall has increased over the last 50 years
Trend projected to conFnue Localized flash flooding
Flooding has the potenFal to increase water polluFon
Water treatment plants mainly on floodplains
Less frequent summer rainfall may affect water supply
Primarily on smaller water systems and wells
Reduced flows on larger rivers Possible water conflicts (e.g., ag vs domesFc)
Increased water temperatures Affect aquaFc health and ability to assimilate wastewater effluent
15
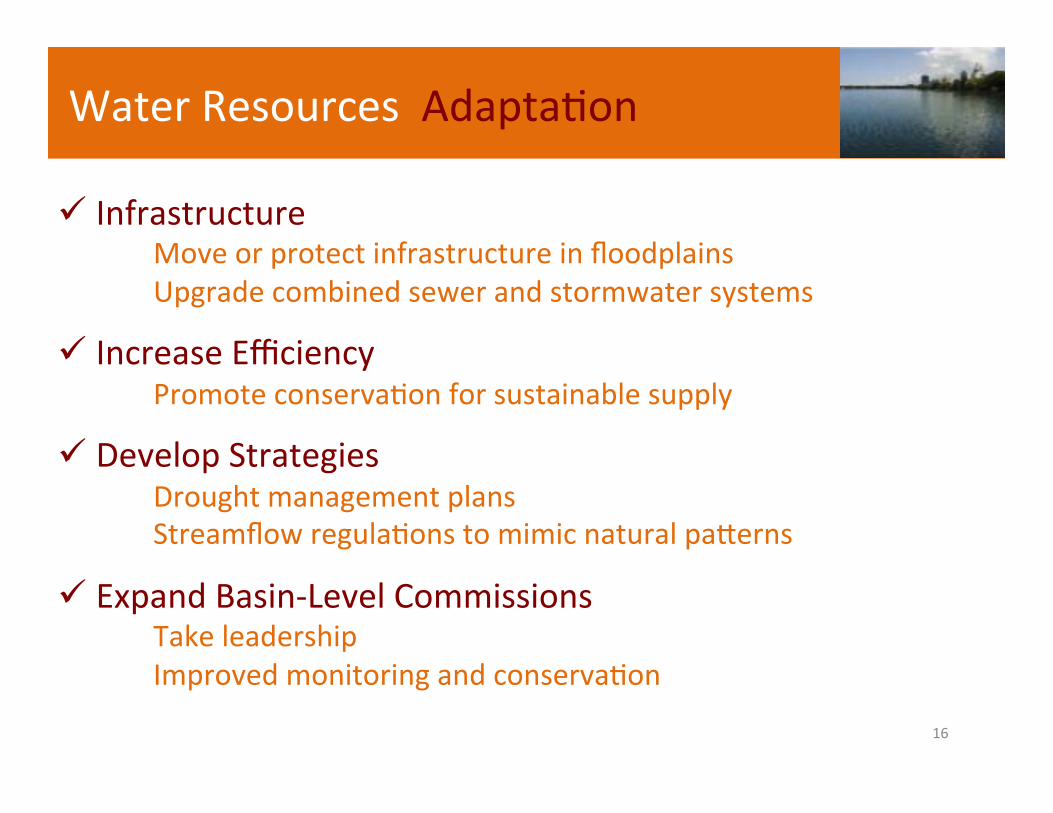
Water Resources AdaptaFon
Infrastructure Move or protect infrastructure in floodplains Upgrade combined sewer and stormwater systems
Increase Efficiency Promote conservaFon for sustainable supply
Develop Strategies Drought management plans Streamflow regulaFons to mimic natural paqerns
Expand Basin-‐Level Commissions Take leadership Improved monitoring and conservaFon
16

Water Resources Vulnerable Groups
Smaller water systems More vulnerable to drought Less closely managed Fewer resources
Elderly and disabled Immediate flood hazard …. less mobile
Rapidly growing exurban communiFes
Increased demand and compeFFon
Low-‐income and non-‐English-‐speaking populaFons
Less aware of programs and warning related to water quality and contaminaFon
17

Coastal Zones Key Climate Impacts
AlteraFon of barrier islands Strong coast storm surge Beach erosion, dune overwash, new inlet creaFon
InundaFon of coastal populaFons due to sea level rise
More frequent flooding in area now near seal level
Loss of coastal wetlands and salt march stress
Reduced species diversity
MigraFon of cold water species Blue claw crabs replace lobster
Salt water intrusion on the Hudson Tides, storm surge and salt water propagate upriver
18

Coastal Zones AdaptaFon
Infrastructure Move or protect infrastructure in zones Upgrade combined sewer and stormwater systems
Engineering strategies Build or raise sea walls Move sand to beaches …. temporary soluFon Construct arFficial wetlands
Develop strategies Buy out or swap land to encourage exit from flood zones Balance wetland protecFon and coastal development Improve building codes Reevaluate shoreline setback rules
19

Coastal Zones Vulnerable Groups
Elderly and disabled Immediate flood hazard …. less mobile
Racial and ethnic minoriFes Significant populaFons in New York City flood zone
Low-‐income and non-‐English-‐speaking populaFons Less able to recover from flooding than wealthier populaFons
Fresh water ecosystems in estuaries and cold water marine species Saltwater intrusion Warming water temperatures
Popula9on in FEMA’s 100-‐year floodplain living below the poverty line
20

Ecosystems Key Climate Impacts
Changes will favor the expansion of invasive species
Generalists such as white-‐tail deer benefit
Longer growing season and possible CO2 ferFlizaFon
Increased hardwood producFvity Drought and nutrient availability may limit
Fast growing plant species see greater benefits
Weeds do beqer!
Altered hydrology on streams rivers and lakes
Timing and amount of snowmelt change Less ice cover
Increased temperature detrimental to brook trout
Also species adapted to snow
21

Ecosytems AdaptaFon
Management Reduce vulnerability of high-‐priority species and communiFes
Maintain healthy ecosystems More resilient to change and stress from invasives
Facilitate natural adaptaFon Protect riparian zones and migraFon corridors
Comprehensive and coordinated monitoring Track range shijs PrioriFzaFon of what to monitor
22

Ecosystems Vulnerable Groups
CommuniFes reliant on winter sports Less snow for skiing and snow mobiling
CommuniFes reliant on cold water fisheries Increases in species such as bass may offset
Species that Are adapted to cold and high elevaFons Have specialized food requirements Are suscepFble to new compeFtors Have poor dispersal ability
Examples Spruce…Hemlock….Brook trout…. Snowshoe hare…. Fox (winter predator)… BalFmore oriole 23

Agriculture Key Climate Impacts
Increased heat stress Crop yield/quality and livestock producFvity suffer
Increased weed and pest pressure Earlier emergence Greater overwintering potenFal
OpportuniFes to explore new crops
Higher temperatures and longer growing seasons
Short-‐term summer drought risk Also pressures due to rainfall increases (e.g., spring planFng)
24

Agriculture AdaptaFon
Infrastructure Increase cooling capacity in dairy faciliFes Expand supplemental irrigaFon Improve soil drainage via increase soil organics or Fles
OperaFons Alter planFng dates, varieFes, crops Diversify Increase pest control… Use new approaches
Develop new crop varieFes and decision tools Capitalize on climate and market opportuniFes Tools for adaptaFon Fming & daily operaFons (e.g., IPM)
25

Agriculture Vulnerable Groups
Dairy and cool-‐season crops Apples, cabbage, potatoes State favorite apple varieFes (Macs and Empires)
Small farms Less capital for adaptaFon Increase trends toward larger farms (dairy)
The environment Due to increased pesFcide and ferFlizer use
Loca9on of dairy opera9ons in New York State
26

Energy Key Climate Impacts More heat waves
Increased A/C …. increased peak energy loads
Increased water and air temperature and sea level rise
Decreased efficiency and cooling capacity Vulnerable infrastructure
Higher winter temperatures Decreased heaFng demand Perhaps affecFng natural gas markets
Increased challenges for renewables Hydropower…. Summer drought Solar and wind …. Uncertainty in clouds/wind Biomass depends on growing season condiFons 27
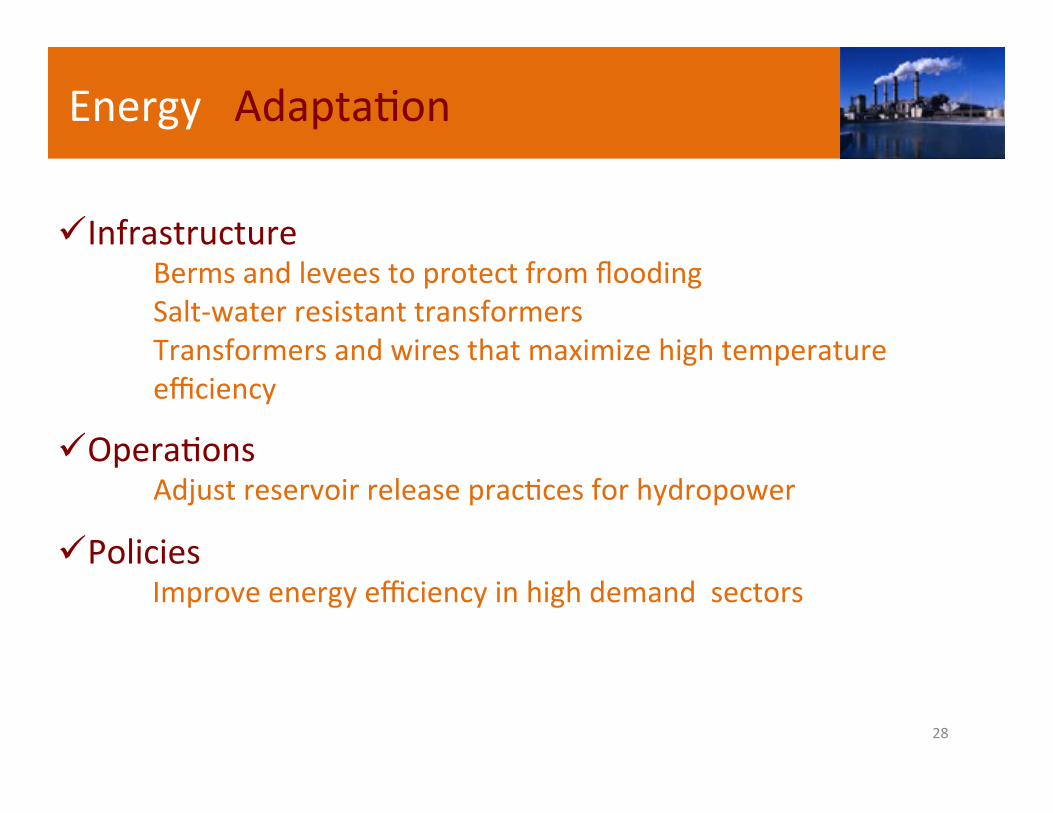
Energy AdaptaFon
Infrastructure Berms and levees to protect from flooding Salt-‐water resistant transformers Transformers and wires that maximize high temperature efficiency
OperaFons Adjust reservoir release pracFces for hydropower
Policies Improve energy efficiency in high demand sectors
28

Energy Vulnerable Groups
Lower-‐income residents Increased energy costs with AC Especially in urban areas (heat island effects)
CommuniFes New energy faciliFes will place burdens on nearby towns
Elderly and disabled More vulnerable to energy outages
29

TransportaFon Key Climate Impacts
Heavy precipitaFon Street flooding and mass transit delays
Sea level rise Subways and tunnels at risk of flooding Railways along Hudson vulnerable to flooding Coastal roadways and interstates
High temperatures Increased AC needs on mass transit Longer runways Asphalt and train rail stresses
Great Lakes ice cover Longer shipping season More lake effect snow
30

TransportaFon AdaptaFon
Infrastructure Sea walls and levees to protect from flooding Pumping faciliFes Elevate roads, bridges, etc. Relocate out of flood zones Lengthen runways
OperaFons Engineering-‐based risk assessments of operaFons
Policies Changes in engineering design
specificaFons Form alliances to reduce risks Mutual insurance pools to spread
risks
100-‐year flood zones in New York City (i.e., with a probability of being flooded of 1 percent per year) for current and two different ClimAID sea level rise scenarios
31

TransportaFon Vulnerable Groups
Urban low-‐income and elderly populaFons Vulnerable to public transportaFon disrupFons Limited abiliFes to evacuate
Working women TransportaFon interrupFons affect child and family care Fme
Hourly workers TransportaFon-‐related work loss affects income
Lower-‐income neighborhoods – rural, suburban, urban Poor transportaFon opFons liqle redundancy
32

TelecommunicaFons Climate Impacts
Heat waves TelecommunicaFons systems vulnerable to power outages
Heavy rain, flooding and sea level rise
Increased vulnerability of infrastructure
33

TelecommunicaFons AdaptaFon
Infrastructure Backup power for cell towers RelocaFon from flood zones Use underground cabling Standardize car charging interfaces for cell phones
Policy Beqer regulaFon enforcement (e.g., reporFng of outages) High-‐speed broadband in rural and low populaFon areas Decouple communicaFons from electric grid Expand alternaFve communicaFons technologies
34

TelecommunicaFons Vulnerable Groups
Customers in rural, remote areas Fewer backup opFons Lack wireless and broadband services Typically last to have service restored
Lower-‐income populaFons Limited communicaFon opFons (cell, landline, etc.)
Varia9on in popula9on density in New York State
35

Public Health Key Climate Impacts
Increased temperature Heat-‐related illness and death will increase Cold-‐related deaths decrease, but do not compensate
Worsening air quality (smog, wildfires, pollen)
Increased cardiovascular and respiratory illness and death
Vector-‐borne disease spread For example, West Nile Virus and Lyme disease
Flooding from heavy rain Water and food-‐borne disease risk Increased stress and mental health problems RecreaFonal water quality compromised
Projected temperature-‐related deaths in NY county
36

Public Health AdaptaFon
OperaFons Extend surveillance of climate and heath indicators Statewide monitoring of pollen and mold Plant low-‐pollen urban trees
Management Evaluate heat response plans Expand cooling center access
Policy Tie environment and human health iniFaFves, as they are ojen related
37

Public Health Vulnerable Groups
Urban elderly, children, immune-‐impaired, low-‐income
ParFcularly vulnerable to heat-‐related risks
Northern populaFons Less accustomed to extreme heat
Asthma suffers Vulnerable to increased ozone and other pollutants
Children, athletes, outdoor laborers Greater exposure to heat and respiratory disease
Coastal and floodplain residents EvacuaFon stress Mold and toxic exposure post-‐flood
Prevalence of current asthma among adults, by region
38
Conclusions
Success of NY’s response will depend on effecFve adaptaFon strategies
Climate change brings opportuniFes and challenges Climate interacts with (exacerbates) exisFng stressors
Sea level rise and coastal flooding greatest challenge Affect mulFple sectors and large populaFons
Many adaptaFon needs can occur near term and at modest cost
Presents opportuniFes for co-‐benefits Infrastructure investment already needed
ScienFst-‐policy maker dialogue imperaFve 39

RecommendaFons NY Decision-‐makers
Improve climate change awareness Public and private stakeholders General public
Consider regional, federal, internaFonal adaptaFon opFons
NY will be affected by these policies Address environmental jusFce issues related to climate
Promote incremental and flexible adaptaFon strategies
IdenFfy miFgaFon and adaptaFon synergies
40

RecommendaFons Stakeholders
Integrate adaptaFon with everyday operaFons Assess potenFal for complementary effects Be aware of unintended consequences
Evaluate design and performance standards and regulaFons
Consider up-‐to-‐date climate projecFons
IdenFfy partnership opportuniFes Within New York State and more broadly
41

RecommendaFons Science & Research
Develop miFgaFon and adaptaFon decision tools Database of risk and adaptaFon informaFon Targeted impacts research
Refine climate change scenarios New model runs and downscaled products
Implement indicators and monitoring programs Improved mapping and spaFal tools
Research “Tipping points” Climate variability, extreme events, wind paqerns, etc.
Advance cost-‐benefit analysis
42
Top Related