


Languages
Pages
Legal


Citation metrics versus peer review:
Google Scholar, Scopus andthe Web of Science:
A longitudinal and cross-disciplinary comparison
Anne-Wil Harzing, Middlesex University, LondonSatu Alakangas, University of Melbourne, Australia

An “amateur” in bibliometrics (1):Journal Quality 1993: Conversation with Head of Department: “How do I know which
journals are the best journals, I have no clue?” Jan 2000: Bradford Management Centre, UK:
“Why on earth are we using this “stupid” VSNU journal ranking list that ranks my JIBS publication C and all other IB journals D (just like Brickworks, magazine for the building trade). I am sure there are better journal rankings lists around”
July 2000: The first incarnation of my JQL is published on www.harzing.com 2015: The 56th edition of the JQL with18 rankings, >100 ISI cites + 50,000
page visits/year
2009: AMLE Outstanding article of the year award for “When Knowledge Wins: Transcending the Sense and Nonsense of Academic Rankings” [most highly cited article in management in 2009]
2015: AMLE “Disseminating knowledge: from potential to reality – New open-access journals collide with convention” How predatory Open Access journals completely distorted Thomson
Reuters Highly Cited Academics ranking (see also http://www.harzing.com/esi_highcite.htm)
3

An “amateur” in bibliometrics (1):Citation analysis May 2006: University of Melbourne: Promotion application to
professor rejected: “you haven’t published enough in A-journals”
Oct 2006: Publish or Perish v1.0 released Jan 2007: Reapplied for promotion showing my work had more
citation impact than that any of the other professors, recent or longstanding
2010: The Publish or Perish Book, self-published through Amazon Createspace, reviewed in Nature, Scientometrics and JASIST
2015: 80th or so release of Publish or Perish, >180 ISI cites, 1.7 million page visits to date
26 April 2015: Wharton Research Data Services distributes the Publish or Perish Book at the AACSB conference
4

5
An “amateur” in bibliometrics (3): publishing in the field Published a range of papers relating to Google Scholar and WoS
Harzing, A.W.; Wal, R. van der (2008) Google Scholar as a new source for citation analysis?, Ethics in Science and Environmental Politics, 8(1): 62-71
Harzing, A.W.; Wal, R. van der (2009) A Google Scholar h-index for Journals: An alternative metric to measure journal impact in Economics & Business?, Journal of the American Society for Information Science and Technology, 60(1): 41-46.
Harzing, A.W. (2013) A preliminary test of Google Scholar as a source for citation data: A longitudinal study of Nobel Prize winners, Scientometrics, 93(3): 1057-1075.
Harzing, A.W. (2013) Document categories in the ISI Web of Knowledge: Misunderstanding the Social Sciences?, Scientometrics, 93(1): 23-34.
Harzing, A.W.; Alakangas, S.; Adams, D. (2014) hIa: An individual annual h-index to accommodate disciplinary and career length differences, Scientometrics, 99(3): 811-821.
Harzing, A.W. (2014) A longitudinal study of Google Scholar coverage between 2012 and 2013, Scientometrics, 98(1): 565-575.
Harzing, A.W.; Mijnhardt, W. (2015) Proof over promise: Towards a more inclusive ranking of Dutch academics in Economics & Business, Scientometrics, 102(1):727-749.
Harzing, A.W. (2015) Health warning: Might contain multiple personalities. The problem of homonyms in Thomson Reuters Essential Science Indicators, 105(3):2259-2270 Scientometrics.

The lesson for academic careers? If you want something changed: take initiative, you can change things, even
as an individual Being generous can sometimes bring unexpected benefits
I provide many resources for free on my website and spend many hours every week responding to requests for assistance from all over the world
Many academics now know my name, even though they don’t know my research Be prepared for the inevitable confusion and downright nasty reactions
“It doesn’t work” support requests (no internet connection, wrong searches etc.) Enter my publications in your “Harzing system” now! CV attached; you have ruined
my career by not including my publication in “your database” We are going on strike tomorrow because of the Harzing index, everyone hates you You are discriminating against me because I am not white, your website should be
taken down instantly; I don’t understand why you still have a job (I refused personal telephone support after giving extensive email support to an academic who kept maintaining I was wrong and he knew better how Google Scholar worked than I did)
Accept that your “research hobby” can overpower your “real research” Publishing in another field can be great fun and liberating
6

7
Increasing audit culture: Metrics vs. peer review Increasing “audit culture” in academia, where universities,
departments and individuals are constantly monitored and ranked
National research assessment exercises, such as the ERA (Australia) and the REF (UK), are becoming increasingly important
Publications in these national exercises are normally assessed by peer review for Humanities and Social Sciences
Citations metrics are used in the (Life) Sciences and Engineering as additional input for decision-making
The argument for not using citation metrics in SSH is that coverage for these disciplines is deemed insufficient in WoS and Scopus

8
The danger of peer review? (1)Peer review might lead to harsher verdicts than
bibliometric evidence, especially for disciplines that do not have unified paradigms, such as the Social Sciences and Humanities In Australia (ERA 2010) the average rating for the Social
Sciences was only about 60% of that of the (Life) Sciences This is despite the fact that on a citations per paper
basis Australia’s worldwide rank is similar in all disciplines
The low ERA-ranking led to widespread popular commentary that government funding for the Social Sciences should be reduced or removed altogether
Similarly negative assessment of the credibility of SSH can be found in the UK (and no doubt in many other countries)
9
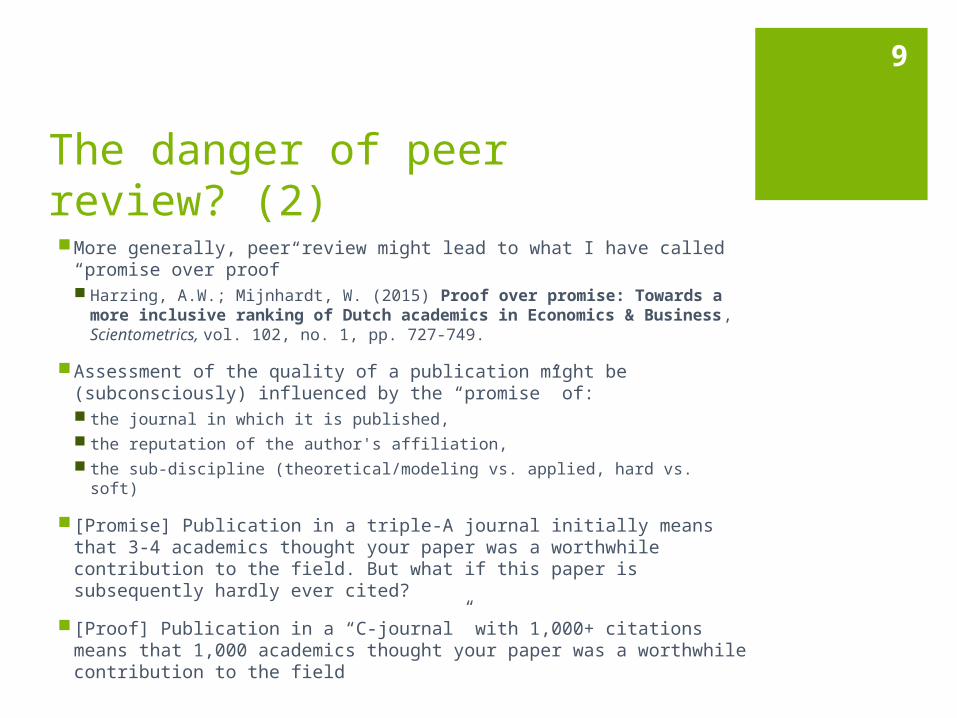
The danger of peer review? (2) More generally, peer review might lead to what I have called
“promise over proof” Harzing, A.W.; Mijnhardt, W. (2015) Proof over promise: Towards a
more inclusive ranking of Dutch academics in Economics & Business, Scientometrics, vol. 102, no. 1, pp. 727-749.
Assessment of the quality of a publication might be (subconsciously) influenced by the “promise” of: the journal in which it is published, the reputation of the author's affiliation, the sub-discipline (theoretical/modeling vs. applied, hard vs. soft)
[Promise] Publication in a triple-A journal initially means that 3-4 academics thought your paper was a worthwhile contribution to the field. But what if this paper is subsequently hardly ever cited?
[Proof] Publication in a “C-journal” with 1,000+ citations means that 1,000 academics thought your paper was a worthwhile contribution to the field

10
What can we do? Be critical about the increasing audit culture
Adler, N.; Harzing, A.W. (2009) When Knowledge Wins: Transcending the sense and nonsense of academic rankings, The Academy of Management Learning & Education, vol. 8, no. 1, pp. 72-95.
But: be realistic, we are unlikely to see a reversal of this trend. Hence in order to “emancipate” the Social Sciences and Humanities, an inclusion of citation metrics might help. However, we need to: Raise awareness about:
Alternative data sources for citation analysis that are more inclusive (e.g. including books, local and regional journals, reports, working papers)
Difficulty of comparing metrics across disciplines because of different publication and citation practices Life Science and Science academics in particular write more (and shorter) papers
with more authors each; 10-15 authors not unusual, some >1000 authors Suggest alternative data sources and metrics
Google Scholar or Scopus instead of WoS/ISI hIa (Individual annualised h-index), i.e. h-index corrected for career length and number
of co-authors measures the average number of single-author equivalent impactful publications an
academic publishes a year (usually well below 1.0)

11
Need for comprehensive empirical work Dozens of studies comparing two or even three databases.
However: Focused on a single or small groups of journals or a small group of
academics Only covered a small number of disciplines Largest study was Delgado-López-Cózar &Repiso-Caballero (2013), but
only included a single discipline
Very few studies doing longitudinal comparisons De Winter et al. (2014): WoS and GS 2005 & 2013 for 56 classic articles Harzing (2014): 2012-2013 for 20 Nobel Prize winners (GS only)
Hence our study provides: 2-year longitudinal comparison (2013-2015) with quarterly data-points Cross-disciplinary comparison across all major disciplinary areas Comparison of 4 different metrics:
publications, citations, h-index hI,annual (h-index corrected for career length and number of co-
authors)

12
The bibliometric study (1):The basics Sample of 146 Associate and Full Professors at the University of Melbourne
All main disciplines (Humanities, Social Sciences, Engineering, Sciences, Life Sciences) were represented, 37 sub-disciplines
Two full professors (1 male, 1 female) and two associate professors (1 male, 1 female) in each sub-discipline (e.g. management, marketing, accounting, economics)
Collected data on education, career trajectory, international experience, internal/external promotion, and career interruptions through survey (not reported here)
Citation metrics in WoS/ISI, Scopus and Google Scholar Collected citation data every 3 months for 2 years Google Scholar data collected with Publish or Perish
(http://www.harzing.com/pop.htm) WoS/ISI and Scopus collected in the respective databases and imported into
Publish or Perish to calculate metrics
The final conclusion: with appropriate metrics and data sources, citation metrics can be applied in the Social Sciences ISI H-index: Life Sciences average lies 200% above Social Sciences average GS hIa index: Life Sciences average lies 8% below Social Sciences average

13
The bibliometric study (2):Details on the sample Sample: 37 disciplines were subsequently grouped into five major
disciplinary fields: Humanities: Architecture, Building & Planning; Culture & Communication,
History; Languages & Linguistics, Law (19 observations), Social Sciences: Accounting & Finance; Economics; Education; Management
& Marketing; Psychology; Social & Political Sciences (24 observations), Engineering: Chemical & Biomolecular Engineering; Computing & Information
Systems; Electrical & Electronic Engineering, Infrastructure Engineering, Mechanical Engineering (20 observations),
Sciences: Botany; Chemistry, Earth Sciences; Genetics; Land & Environment; Mathematics; Optometry; Physics; Veterinary Sciences; Zoology (44 observations),
Life Sciences: Anatomy & Neurosciece; Audiology; Biochemistry & Molecular Biology; Dentistry; Obstetrics & Gynaecology; Ophthalmology; Microbiology; Pathology; Physiology; Population Health (39 observations).
Discipline structure followed Department/School structure at the University of Melbourne Overrepresentation of the (Life) Sciences and underrepresentation of Social
Sciences beyond Business & Economics Overall, sufficiently varied coverage across the five major disciplinary fields

14
The bibliometric study (3): Descriptive statistics

15

16Longitudinal results:
quarterly % increase in papers per academic in different databases

17
Longitudinal results:quarterly % increase in citations per academic in different databases

18Different data-sources
between disciplines:number of papers
Humanities Social Sciences Engineering Sciences Life Sciences0
20
40
60
80
100
120
140
160
180
200
Num
ber
of p
aper
s
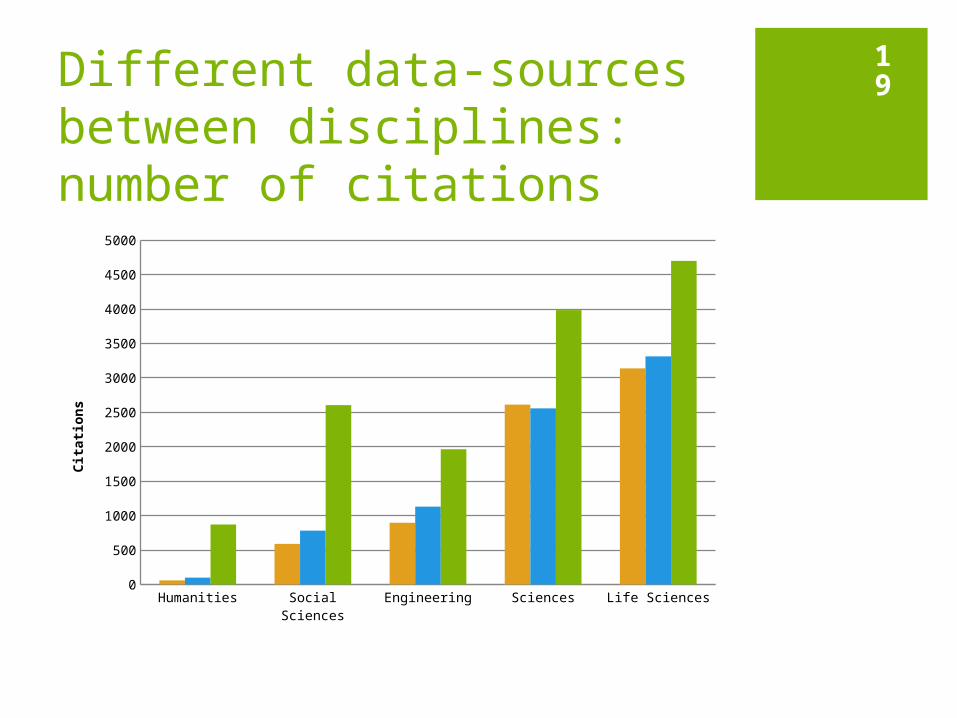
19Different data-sources
between disciplines:number of citations
Humanities Social Sciences Engineering Sciences Life Sciences0
500
1000
1500
2000
2500
3000
3500
4000
4500
5000
Cita
tions

20Different data-sources
between disciplines:number of citations
Web of Science Scopus Google Scholar 0
1000
2000
3000
4000
5000
Cita
tions
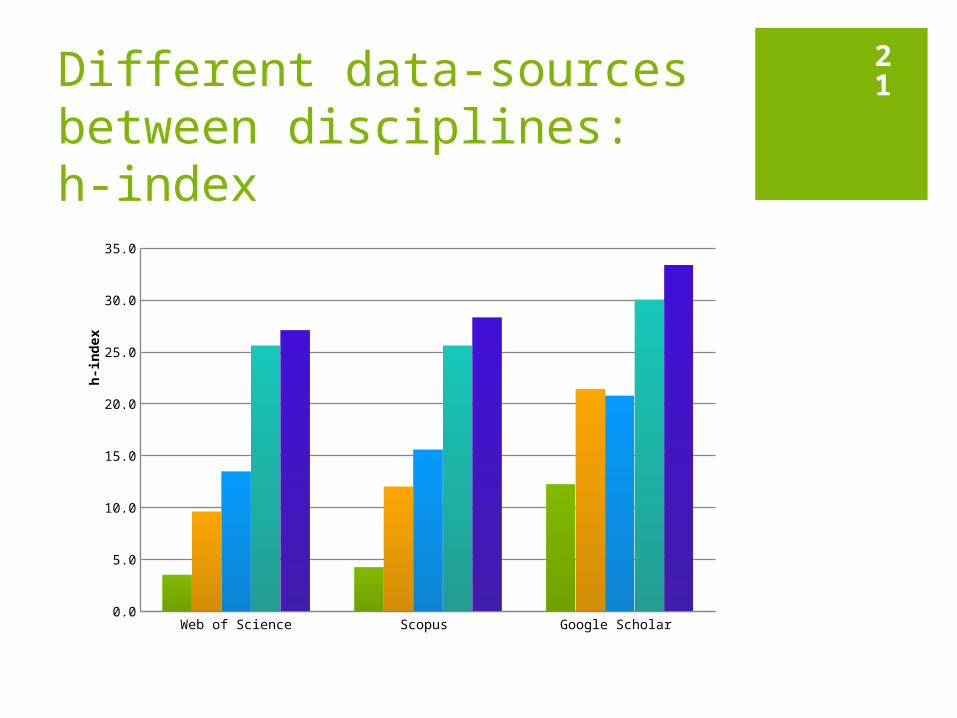
21Different data-sources
between disciplines:h-index
Web of Science Scopus Google Scholar 0.0
5.0
10.0
15.0
20.0
25.0
30.0
35.0
h-in
dex

22Different data-sources
between disciplines:hIa index
Web of Science Scopus Google Scholar 0.00
0.10
0.20
0.30
0.40
0.50
0.60
0.70
hIa
inde
x
hIa: h-index corrected for academic age (to accommodate differences in career length) and number of co-authors (to remove discipline bias)

23
Comparing WoS h-index with Scopus or GS hIa

24
Different data-sources between disciplines: Statistics For the ISI h-index gender, rank and discipline differences
explain nearly 60% of the variance For GS hIa, the explained variance is only 14%
Reduction of differences across levels of appointment Reduction of differences across disciplines
ISI h-index Google Scholar hIa Stand. Beta Significance Stand. Beta SignificanceGender = Female -0.066 0.222 -0.017 0.822
Rank Professor 0.361 0.000 0.217 0.006Humanities -0.591 0.000 -0.356 0.000Social Sciences -0.491 0.000 0.020 0.816
Engineering -0.357 0.000 -0.149 0.087
Sciences -0.045 0.468 -0.123 0.178
Adjusted R-square 0.591 0.139

25
Quick comparison across disciplinesH-index ISI data
Life Sciences vs. Humanities: 27 vs. 3.5 i.e. nearly 8 times as high
Life Sciences vs. Social Sciences: 27 vs. 9.5 i.e. nearly 3 times as high
hIa-index GS data Life Sciences vs. Humanities: 0.61 vs. 0.34
i.e. nearly 2 times as high Life Sciences vs. Social Sciences: 0.61 vs. 0.66
i.e. 8% lower

26
Individual comparisons for the three databases
27
Conclusion Will the use of citation metrics disadvantage the Social Sciences and
Humanities? Not, if you use a database that includes publications important in those
disciplines (e.g. books, national journals) Not, if you correct for differences in co-authorships
Is peer review better than metrics (in large scale research evaluation)? Yes, in a way…. The ideal version of peer review (informed, dedicated,
and unbiased experts) is better than a reductionist version of metrics (ISI h-index or citations)
However, the inclusive version of metrics (GS hIa or even Scopus hIa) is probably better than the likely reality of peer review (hurried semi-experts, potentially influenced by journal outlet and affiliation)
In research evaluation at any level use a combination of peer review and metrics wherever possible, but: If reviewers are not experts, metrics might be a better alternative If metrics are used, use an inclusive database (GS or Scopus) and career
and discipline adjusted metrics

28
Want to know more?Harzing, A.W.; Alakangas, S. (2016) Google
Scholar, Scopus and the Web of Science: A longitudinal and cross-disciplinary comparison, Scientometrics, 106(2): 787-804.
For more details see: http://www.harzing.com/research/quality-and-impact-of-academic-research
Any questions?

29Further reading on Google
Scholar as a source for citation data Harzing, A.W.; Wal, R. van der (2008) Google Scholar as a new
source for citation analysis?, Ethics in Science and Environmental Politics, 8(1): 62-71 [edited by Howard Browman!]
Harzing, A.W.; Wal, R. van der (2009) A Google Scholar h-index for Journals: An alternative metric to measure journal impact in Economics & Business?, Journal of the American Society for Information Science and Technology, 60(1): 41-46.
Harzing, A.W. (2013) A preliminary test of Google Scholar as a source for citation data: A longitudinal study of Nobel Prize winners, Scientometrics, 93(3): 1057-1075.
Harzing, A.W. (2014) A longitudinal study of Google Scholar coverage between 2012 and 2013, Scientometrics, 98(1): 565-575.
Harzing, A.W.; Alakangas, S. (2016) Google Scholar, Scopus and the Web of Science: A longitudinal and cross-disciplinary comparison, Scientometrics,106(2): 787-804.

30Further reading on
problems with the Web of Science and new metrics Harzing, A.W. (2013) Document categories in the ISI Web of
Knowledge: Misunderstanding the Social Sciences?, Scientometrics, 93(1): 23-34.
Harzing, A.W.; Alakangas, S.; Adams, D. (2014) hIa: An individual annual h-index to accommodate disciplinary and career length differences, Scientometrics, 99(3): 811-821.
Harzing, A.W.; Mijnhardt, W. (2015) Proof over promise: Towards a more inclusive ranking of Dutch academics in Economics & Business, Scientometrics, 102(1):727-749.
Harzing, A.W. (2015) Health warning: Might contain multiple personalities. The problem of homonyms in Thomson Reuters Essential Science Indicators, Scientometrics,105(3):2259-2270.
Harzing, A.W. (2017) Microsoft Academic (Search): a Phoenix arisen from the ashes?, in press for Scientometrics
Top Related