


Languages
Pages
Legal


ASIAN INSIGHTS VICKERS SECURITIESed-TH / sa- JY
Auto dealerships: Shiny year ahead for BMW
• Switch to BMW auto dealership sector • Luxury car demand and GP margin expansion to
support 2017/18F earnings • Luxury auto dealerships at the early stage of
recovery cycle • Initiate coverage on China Yongda (3669 HK)
Golden opportunity starts for BMW auto dealerships. The Chinese auto dealership sector has finally bottomed out and is heading for better growth prospects. The BMW auto dealerships are entering a high-growth phase which is yet to be fully reflected in their valuations. These dealerships had reported decent FY16 results despite an aged product portfolio. Growing luxury car demand (especially with new model launches and consumer upgrades) and improvement on new car sales' GP margins should support valuation appreciation. More importantly, these auto dealerships are growing their auto financing/leasing and auto insurance agency business to strengthen their earnings base. FY16 saw a sharp increase in commission income from these activities. The BMW auto dealership sector's FY17F total earnings (based on our and consensus estimates) are projected to grow 122% y-o-y. Sector recovery begins, room for further upside. BMW's peak revamp cycle should be better reflected in 2018. Therefore, we believe the full earnings potential will be realised in 2018, and current valuations have yet to reflect this favourable earnings outlook, despite the recent run-up in share prices. The dealership sector is trading at average FY17F PE of 10x. Go for large BMW dealerships. We recommend investors to consolidate their holdings in large BMW dealerships to maximise the investment returns. Baoxin, China Yongda and China ZhengTong are the top three dealerships with a large exposure to the BMW brand (in terms of 4S stores). We initiate coverage on China Yongda with a BUY rating and a TP of HK$9.20, pegged to 11x FY17F PE. The company is one of the cheapest among the listed luxury auto dealerships with FY16-18F earnings CAGR estimated at c.32%.
HSI: 24,139
ANALYST Rachel MIU +852 2863 8843 [email protected]
Recommendation & valuation
F Y 17PE
HK $ HK $ x US$m
BM W aut o dealersh ip compan ies
Baoxin Auto Group(1293 HK)^
3.79 n.a. NR 9.8 1,246
China Harmony Auto(3836 HK)^
2.88 n.a. NR 5.9 583
China Yongda(3669 HK)
7.42 9.20 Buy 8.1 1,421
China ZhengTong(1728 HK)
4.37 5.20 Buy 11.0 1,245
M ercedes- Benz au t o dealersh ip c ompan iesZhongSheng(881 HK)
10.84 12.50 Buy 9.4 2,999
Company Pric e T argetPric e
Rec om M k tCap
^ Consensus
Source: Thomson Reuters, DBS Vickers
Zhongsheng: Mercedes Benz, Lexus, Toyota, Honda, Nissan
China Yongda: BMW/MINI, Audi, JLR, Porsche, Volvo, Volkswagen
China ZhengTong: BMW/MINI, Audi, JLR, Volvo, Nissan
Baoxin Auto: BMWMINI, JLR, Ferrari, Maserati
China Rundong: BMW/MINI, JLR, Maserati
China Meidong: BMW, Lexus, Porsche, Toyota, Hyundai
China Harmony: BMW,/MINI, JLR, Audi, Lexus, Maserati
Based on closing prices as at 24 Apr 17
DBS Group Research . Equity
China / Hong Kong Industry Focus
China Auto Sector
25 Apr 2017
Refer to important disclosures at the end of this report

Industry Focus
China Auto Sector
Page 2
Table of Contents
Strong fundamentals 3
Risk factors 9
Valuation and recommendation 9
China Yongda (3669 HK) Initiation 13
Appendix 41

Industry Focus
China Auto Sector
Page 3
Strong fundamentals
Industry turnaround. The auto dealerships' 2016 financial results clearly show that the sector is trending up. Rising demand, low inventory pressure and firmer GP margins on new car sales are the important catalysts on earnings and share price performance. China’s economy is finally trending up, which bolsters the consumer sentiment.
China Quarterly GDP Performance
6.0
6.2
6.4
6.6
6.8
7.0
7.2
7.4
7.6
7.8
8.0
Mar
-13
Jun-
13
Sep-
13
Dec
-13
Mar
-14
Jun-
14
Sep-
14
Dec
-14
Mar
-15
Jun-
15
Sep-
15
Dec
-15
Mar
-16
Jun-
16
Sep-
16
Dec
-16
Mar
-17
%
Source: CEIC
Mercedes-Benz auto dealerships have benefitted from the brand’s robust volume sales. Although we expect its momentum to continue into 2017, we reiterate our call to rotate into the BMW auto dealerships, as we anticipate their earnings growth to heighten. Latest automobile policy positive on long-term development of the sector. The Chinese authorities have finally approved the amendments on the auto dealerships sector and these regulations will become effective on 1 July 2017. Some of the key items that are positive to the dealers are highlighted in the table below.
Key highlights of auto dealerships amendment policy
1 Promote the div ersification of business model. Singlebrand authorizations are no longer mandatory forv ehicle sales operations, allowing dealers to sell v ehiclesfrom multi-brands.
2 Suppliers (automakers) shall not unilaterally specify theminimum v ehicles sales v olume, spare parts inv entoryv olume and restrict dealers from selling spare parts fromother suppliers.
3 Suppliers shall not require dealers to carry out all thebusiness functions like v ehicle sales, after-sales serv iceetc. and shall not restrict dealers from prov iding spareparts and after-sales serv ices to other suppliers
4 Prohibit the requirements for the dealers to bear theadv ertising and marketing costs on behalf of thesuppliers.
5 Prohibit unreasonable requirements from the supplierslike floor area, store lay out, renov ation materials andother general facilities.
Source: Ministry of Commerce
Expect the favourable factors to continue into 2017. Most dealerships reported higher FY16 earnings, driven by several favourable factors which will continue to drive 2017’s earnings as well. These include the following: 1. Strong luxury model pipelines. Among the top earnings growth winners was Zhongsheng, at c.304% y-o-y expansion. The peak of Mercedes-Benz's new product cycle, as well as strong demand for Lexus, lifted the company's FY16 earnings. BMW dealerships also report decent earnings growth (ranging 35%-90%), although the brand only started its entry-model revamp last year. In fact, these dealerships are getting excited over the next 1-2 years' prospects as this luxury brand will introduce several new models to boost sales.

Industry Focus
China Auto Sector
Page 4
Premium brand volume sales
0
10
20
30
40
50
60
70
Feb/
10M
ay/1
0A
ug/1
0N
ov/1
0Fe
b/11
May
/11
Aug
/11
Nov
/11
Feb/
12M
ay/1
2A
ug/1
2N
ov/1
2Fe
b/13
May
/13
Aug
/13
Nov
/13
Feb/
14M
ay/1
4A
ug/1
4N
ov/1
4Fe
b/15
May
/15
Aug
/15
Nov
/15
Feb/
16M
ay/1
6A
ug/1
6N
ov/1
6Fe
b/17
BMW Audi Mercedes Benz
'000 units
Source: Companies
To succeed, automakers need to introduce new model line-ups, rather than upgrade their existing models. Judging from Mercedes-Benz dealerships' past strong performance, we expect BMW dealerships to achieve similar results as well.
Premium brands new models line-up impact on sales
0
100
200
300
400
500
600
2006
2007
2008
2009
2010
2011
2012
2013
2014
2015
2016
Mercedes-Benz BMW
'000 units Benz C-class, E-class, GLA, GLC
BMW 5-series
BMW 3-series
Source: Companies
The chart below shows that the premium car market is bottoming out. Demand for premium cars finally accelerated in 2016. The average industry growth was approximately 16% last year, compared to 4% recorded in 2015. With the new models in the pipeline, we forecast the premium car market to remain strong in the next 2 years.
Premium car sales growth
21%
21%7%
8%20%
1%30%
0 10,000 20,000 30,000 40,000 50,000 60,000 70,000 80,000
Zhon
gshe
ng
Chi
na Y
ongd
a
Chi
na Z
heng
Tong
Baox
in A
uto
Chi
na R
undo
ng
Chi
na H
arm
ony
Chi
na M
eido
ng
2015 2016units
Source: Companies, DBS Vickers
2. Upward migration of consumer buying interests. We noticed that luxury entry models are gaining the interests of younger car buyers. This explains why BMW dealers have recorded decent volumes on smaller models such as the new BMW X1 (y-o-y +33%) and BMW 2 series (launched in March 2016). This year, BMW Brilliance is expected to record over 20% volume sales expansion, and we anticipate the smaller models (BMW X1, 1 & 2 series) to account for about 30% of total volume. Also, upgrading will contribute to the growing demand. Given the all the Tier 1 and certain Tier 2 cities have auto sales restriction policies in place, car buyers will prefer expensive cars compared to the local brands. Overall, the luxury car industry's sales exceeded 2.1m units last year, a y-o-y growth of c.16%, compared with the overall passenger vehicle market growth of c.15%. China’s luxury car sales accounted for <10% of total PV volume sales in 2016.

Industry Focus
China Auto Sector
Page 5
Internet search frequency for BMW models
(0.2)(0.1)0.0 0.1 0.2 0.3 0.4 0.5 0.6 0.7 0.8
(1.0)(0.5)0.0 0.5 1.0 1.5 2.0 2.5 3.0 3.5
Apr
-12
Oct
-12
Apr
-13
Oct
-13
Apr
-14
Oct
-14
Apr
-15
Oct
-15
Apr
-16
Oct
-16
Apr
-17
Baidu Index : BMW (LHS)BMW sales (RHS)
% %
Source: Baidu, DBS Vickers
Internet search frequency for Mercedes-Benz models
(0.6)
(0.4)
(0.2)
0.0
0.2
0.4
0.6
0.8
(1.0)(0.5)0.0 0.5 1.0 1.5 2.0 2.5 3.0 3.5
Apr
-12
Oct
-12
Apr
-13
Oct
-13
Apr
-14
Oct
-14
Apr
-15
Oct
-15
Apr
-16
Oct
-16
Apr
-17
Baidu Index : Benz (LHS)Benz sales (RHS)
% %
Source: Baidu, DBS Vickers
3. Better demand-supply equilibrium. Automakers are controlling their production much better than two years ago and hence there is less pressure on inventory. Overall, the dealerships’ average inventory days ranged from 1.0-1.5 months at end-December 2016, down by about 10 days from 2015. The lower inventory has reduced the financing costs of the dealerships.
Industry average inventory days (Sino-foreign & imported cars)
0.6
1.1
1.6
2.1
2.6
3.1
3.6
4.1
May
-12
Aug
-12
Nov
-12
Feb-
13M
ay-1
3A
ug-1
3N
ov-1
3Fe
b-14
May
-14
Aug
-14
Nov
-14
Feb-
15M
ay-1
5A
ug-1
5N
ov-1
5Fe
b-16
May
-16
Aug
-16
Nov
-16
Feb-
17
Sino-Foreign JV brands Imports
months
Source: CADA, DBS Vickers
4. Healthy demand should lead to improvement in gross margins on new car sales. Following the recovery in premium car demand, the downward pressure on new car sales GP margins has eased. The auto dealerships had suffered in the past years from pricing pressure but profit margins had started to pick up in 4Q16. Hence, the GP margins on premium car sales stabilised last year. We believe the better inventory management strategy and healthy demand growth should continue, and the trend should remain positive. BMW dealerships are expected to see some margin improvement this year, arising from the new models (BMW 5 series and BMW X3, in 2H17 and 1H18 respectively and more in 2019).
Industry Focus
China Auto Sector
Page 6
Premium car sales' gross margins
0
1
2
3
4
5
6
7
Chi
na M
eido
ng
Chi
na
Rund
ong
Zhon
gshe
ng
Baox
in A
uto
Chi
na Y
ongd
a
Chi
na
Zhen
gTon
g
Chi
na H
arm
ony
2015 2016(%)
Source: Companies, DBS Vickers
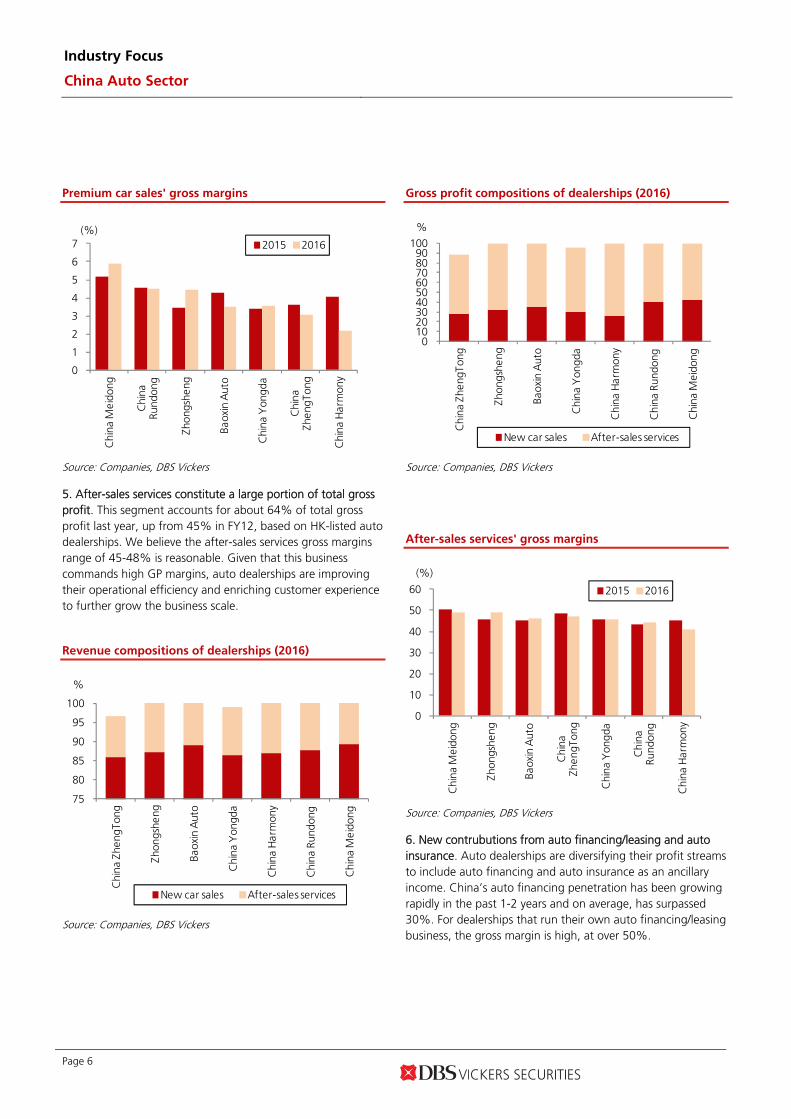
5. After-sales services constitute a large portion of total gross profit. This segment accounts for about 64% of total gross profit last year, up from 45% in FY12, based on HK-listed auto dealerships. We believe the after-sales services gross margins range of 45-48% is reasonable. Given that this business commands high GP margins, auto dealerships are improving their operational efficiency and enriching customer experience to further grow the business scale.
Revenue compositions of dealerships (2016)
75
80
85
90
95
100
Chi
na Z
heng
Tong
Zhon
gshe
ng
Baox
in A
uto
Chi
na Y
ongd
a
Chi
na H
arm
ony
Chi
na R
undo
ng
Chi
na M
eido
ng
New car sales After-sales services
%
Source: Companies, DBS Vickers
Gross profit compositions of dealerships (2016)
0 10 20 30 40 50 60 70 80 90
100
Chi
na Z
heng
Tong
Zhon
gshe
ng
Baox
in A
uto
Chi
na Y
ongd
a
Chi
na H
arm
ony
Chi
na R
undo
ng
Chi
na M
eido
ng
New car sales After-sales services
%
Source: Companies, DBS Vickers
After-sales services' gross margins
0
10
20
30
40
50
60
Chi
na M
eido
ng
Zhon
gshe
ng
Baox
in A
uto
Chi
na
Zhen
gTon
g
Chi
na Y
ongd
a
Chi
na
Rund
ong
Chi
na H
arm
ony
2015 2016
(%)
Source: Companies, DBS Vickers
6. New contrubutions from auto financing/leasing and auto insurance. Auto dealerships are diversifying their profit streams to include auto financing and auto insurance as an ancillary income. China’s auto financing penetration has been growing rapidly in the past 1-2 years and on average, has surpassed 30%. For dealerships that run their own auto financing/leasing business, the gross margin is high, at over 50%.

Industry Focus
China Auto Sector
Page 7
7. Used-car market is growing. China’s total vehicle population size is around 200m units, and has spurred the development of the used-car market. In 2016, a total of 10.4m units of used cars changed hands, y-o-y growth of 10.3%. The China automobile dealership association forecast the pre-owned car sales to exceed 12.5m units this year. Several auto dealerships have started used-car sales, but the volume is still small. Several major cities that have a huge car population are good for replacement potentials.
Top 10 cities vehicle population size (March 2017)
0
1,000
2,000
3,000
4,000
5,000
6,000
Beijin
g
Che
ngdu
Cho
ngqi
ng
Shan
ghai
Suzh
ou
Shen
zhen
Tian
jin
Zhen
gzho
u
Xia
n
Wuh
an
'000 units
Source: Ministry of Transport
8. Improving financial health. Due to lower inventory pressure, the operating cashflows of auto dealerships improved last year, as working capital needs started to normalise. Also, in the past 1-2 years, these dealerships have been prudent in expanding their networks and keeping their capex levels relatively low, excluding those which engaged in M&A activities. Overall, excluding the auto financing/leasing gearing, their core net gearing ratios have improved.
Average net gearing ratio of dealerships
(0.4)(0.2)0.0 0.2 0.4 0.6 0.8 1.0 1.2 1.4
Chi
na Y
ongd
a
Zhon
gshe
ng
Chi
na Z
heng
Tong
Chi
na R
undo
ng
Baox
in A
uto
Chi
na M
eido
ng
Chi
na H
arm
ony
2015 2016
(x)
Source: Companies, DBS Vickers
Operating cash flows
(1,000)
0
1,000
2,000
3,000
4,000
5,000
Zhon
gshe
ng
Baox
in A
uto
Chi
na R
undo
ng
Chi
na Z
heng
Tong
Chi
na Y
ongd
a
Chi
na M
eido
ng
Chi
na H
arm
ony
2015 2016
Rmb m
Source: Companies, DBS Vickers
FY16 results clearly show that the auto dealership sector has been turning around since 4Q16. We are confident that the BMW dealerships’ prospect will further improve. The important point is despite the weaker BMW product cycle last year, the related auto dealerships had performed fairly well. Therefore, these companies are expected to excel in 2017.
Industry Focus
China Auto Sector
Page 8
Net profits
(500)
0
500
1,000
1,500
2,000
Zhon
gshe
ng
Chi
na Y
ongd
a
Chi
na Z
heng
Tong
Baox
in A
uto
Chi
na R
undo
ng
Chi
na M
eido
ng
Chi
na H
arm
ony
2015 2016
Rmb m
Source: Companies, DBS Vickers
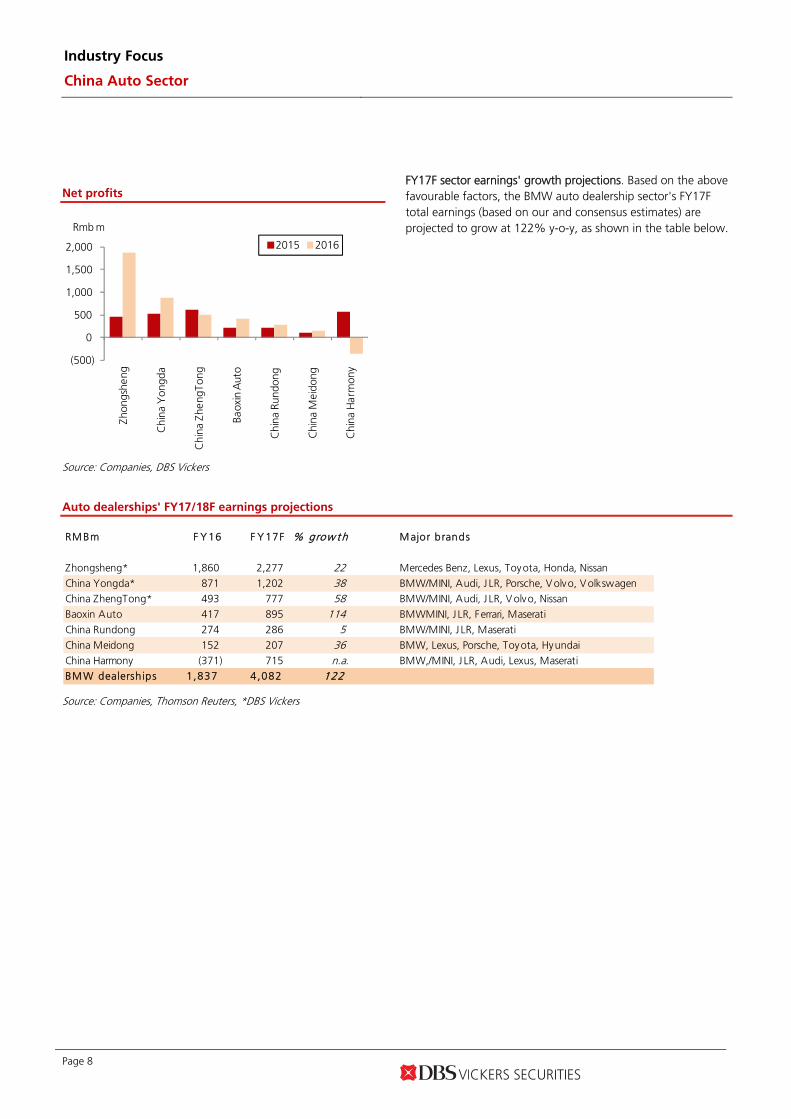
FY17F sector earnings' growth projections. Based on the above favourable factors, the BMW auto dealership sector's FY17F total earnings (based on our and consensus estimates) are projected to grow at 122% y-o-y, as shown in the table below.
Auto dealerships' FY17/18F earnings projections
RM Bm F Y 16 F Y 17F % grow t h M ajor brands
Zhongsheng* 1,860 2,277 22 Mercedes Benz, Lexus, Toyota, Honda, Nissan
China Yongda* 871 1,202 38 BMW/MINI, Audi, J LR, Porsche, V olvo, V olkswagenChina ZhengTong* 493 777 58 BMW/MINI, Audi, J LR, V olvo, Nissan
Baoxin Auto 417 895 114 BMWMINI, J LR, Ferrari, Maserati
China Rundong 274 286 5 BMW/MINI, J LR, Maserati
China Meidong 152 207 36 BMW, Lexus, Porsche, Toyota, Hyundai
China Harmony (371) 715 n.a. BMW,/MINI, J LR, Audi, Lexus, MaseratiBM W dealersh ips 1,837 4,082 122
Source: Companies, Thomson Reuters, *DBS Vickers

Industry Focus
China Auto Sector
Page 9
Risk factors
Major slowdown of economy. The health of the Chinese economy plays a key crucial factor in determining luxury car sales. Any external shock could shake consumer confidence and luxury car demand could be affected. Negative government policies. Any unfavourable policy could stunt the luxury car sales growth. For instance, other local governments may introduce auto sales restrictions as a measure to control car population growth. Weak vehicle product cycle. Car buyers prefer new models. As demonstrated, an ageing product profile could lead to slowing sales growth, until the new car model cycle starts. The cyclicality of products could affect auto dealerships’ earnings outlook. Over-supply could pressure profit margins. The auto dealerships had been previously affected by over-supply in the past few years. If this situation happens again, it could result in margin compression. However, we believe this situation is unlikely in the foreseeable future.
Valuation and recommendation
Underlying strong earnings support valuation upside. YTD, the luxury auto dealerships have gained 39-89% in share price. The luxury auto dealership sector is trading at average 10x FY17F PE, after the recent appreciation in share prices. In our view, there is still further upside, as BMW's full revamp cycle has more to be realised from 2018 onwards. Therefore, the underlying robust earnings should be more evident in 2018.
Share price performance (YTD)
88.7 83.6 80.5
46.7 39.0
0.8
(6.1)(20)
0
20
40
60
80
100
Baox
in A
uto
Chi
na Z
heng
Tong
Chi
na Y
ongd
a
Zhon
gshe
ng
Chi
na M
eido
ng
Dah
Cho
ng H
ong
Chi
na H
arm
ony
Rel to HSI (%)
Source: Thomson Reuters
The following chart shows how volume sales growth has driven the auto dealership sector's share price performance in the past.

Industry Focus
China Auto Sector
Page 10
Auto dealer index vs luxury car sales growth
(40)
(20)
0
20
40
60
80
100
120
140
0
100
200
300
400
500
600
700
800
900
1,000
Jan-09 Jan-10 Jan-11 Jan-12 Jan-13 Jan-14 Jan-15 Jan-16 Jan-17
Auto dealer index (LHS) Luxury car sales (RHS)
Index (1 Jan 09 = 100) %
• Strong demand for luxury cars, dealers raised ASP
• Margin compression due to demand slowdown and inventory pressure
• Anti corruption• Anti-trust investingation on automakers & dealers
• HK-SH connect
• Collapse of A-share market
Source: Companies, Thomson Reuters, DBS Vickers
Valuation. At the peak of the cycle, the sector had traded at 28x PE in 2012. The recent trough valuation was 6x PE in late 2016. The luxury auto dealership sector is currently trading at 10x PE FY17F, which represents 1SD below mean valuation.
Auto dealership sector's PE band
0
100
200
300
400
500
600
700
Jan-
10
Jan-
11
Jan-
12
Jan-
13
Jan-
14
Jan-
15
Jan-
16
Jan-
17
Index (1 Jan 10 = 100)
28x
22x
16x
10x
4x
Source: Thomson Reuters, DBS Vickers

Industry Focus
China Auto Sector
Page 11
Auto dealership sector's PE chart
0
5
10
15
20
25
30
Jan-
10
Jan-
11
Jan-
12
Jan-
13
Jan-
14
Jan-
15
Jan-
16
Jan-
17
x
Average :16.2x
+2SD :27.3x
+1SD :21.7x
-1SD :10.7x
-2SD :5.1x
Source: Thomson Reuters, DBS Vickers
Recommendation. BMW dealerships to rise. Within the sector, we prefer BMW dealerships for their encouraging growth prospects in the coming years. The BMW auto dealership valuations are still attractive despite their recent share price rally. We initiate coverage on China Yongda with BUY rating and a TP of HK$9.20, pegged to 11x PE FY17F. China Yongda is one of the largest BMW auto dealerships in China and provides investors with good exposure to BMW’s growth. The company had over 30 BMW 4S stores last year and is still on the lookout for more acquisitions and greenfield projects to grow its premium dealership operations.

Industry Focus
China Auto Sector
Page 12
Peers valuation
M k t PE PE Y ield Y ield P/Bk P/Bk EV /EBIT DA ROE ROE
Currency Price Cap F iscal 17F 18F 17F 18F 17F 18F 17F 18F 17F 18FCompany Name Code Local$ US$m Y r x x % % x x x x % %
Hong K ong
Dah Chong Hong* 1828 HK HKD 3.27 770 Dec 11.3 9.2 2.7 3.3 0.7 0.6 7.6 6.6 6.0 6.9
ZhongSheng* 881 HK HKD 10.84 2,999 Dec 9.4 8.3 2.1 2.4 1.4 1.3 6.1 5.3 16.6 16.0
China ZhengTong* 1728 HK HKD 4.37 1,245 Dec 11.0 9.4 2.9 3.2 0.9 0.8 9.7 8.7 8.4 9.1
Baoxin Auto Group 1293 HK HKD 3.79 1,246 Dec 9.8 8.8 1.9 2.3 1.3 1.3 5.3 5.6 14.8 14.7
China Yongda* 3669 HK HKD 7.42 1,421 Dec 8.1 6.4 3.6 4.5 1.6 1.4 7.1 5.6 22.1 23.3China Meidong Auto 1268 HK HKD 1.68 235 Dec 7.4 5.3 n.a. 7.4 n.a. n.a. n.a. n.a. n.a. n.a.
China Harmony Auto 3836 HK HKD 2.88 583 Dec 5.9 5.5 4.2 4.4 0.6 0.6 2.9 2.5 9.9 10.5
Sparkle Roll Group 970 HK HKD 0.59 314 Mar n.a. n.a. n.a. n.a. n.a. n.a. n.a. n.a. n.a. n.a.
Auto Italia Holdings 720 HK HKD 0.099 66 Dec n.a. n.a. n.a. n.a. n.a. n.a. n.a. n.a. n.a. n.a.
New Focus Auto 360 HK HKD 0.37 218 Dec n.a. n.a. n.a. n.a. n.a. n.a. n.a. n.a. n.a. n.a.
China Rundong Auto 1365 HK HKD 4.04 492 Dec 19.8 n.a. 0.0 n.a. n.a. n.a. n.a. n.a. n.a. n.a.
Sunfonda Group 1771 HK HKD 1.82 140 Dec n.a. n.a. n.a. n.a. n.a. n.a. n.a. n.a. n.a. n.a.A v erage 10.3 7.6 2.5 3.9 1.1 1.0 6.4 5.8 13.0 13.4
Ot her A sia
Tan Chong Intl TCM MK HKD 2.45 634 Dec n.a. n.a. n.a. n.a. n.a. n.a. n.a. n.a. n.a. n.a.
Zhejiang Material 600704 CH CNY 10.75 4,488 Dec 30.7 n.a. 0.9 n.a. 3.3 n.a. n.a. n.a. n.a. n.a.
Power Diversity Auto 601258 CH CNY 3.35 3,252 Dec n.a. 55.8 n.a. 0.6 n.a. 1.7 n.a. n.a. n.a. n.a.
Wuhu Yaxia Auto 002607 CH CNY 8.93 592 Dec 30.3 23.3 0.6 n.a. 3.4 2.8 n.a. n.a. 10.4 11.9
Sinomach Auto 600335 CH CNY 12.95 1,939 Dec 12.8 n.a. 2.3 n.a. 1.3 n.a. n.a. n.a. n.a. n.a.China Grand Auto 600297 CH CNY 9.46 7,567 Dec 14.3 11.8 0.0 0.0 1.9 1.7 11.2 9.9 13.5 14.1
Wuxi Coml.Mansion 600327 CH CNY 8.52 703 Dec 18.7 16.1 1.1 1.3 1.5 1.4 n.a. n.a. 7.9 8.8
Shanghai Shenhua 600653 CH CNY 3.36 951 Dec n.a. n.a. n.a. n.a. n.a. n.a. n.a. n.a. n.a. n.a.
Fujian Zhangzhou 000753 CH CNY 5 721 Dec n.a. n.a. n.a. n.a. n.a. n.a. n.a. n.a. n.a. n.a.
Yulon Motor 2201 TT TWD 26.75 1,393 Dec 14.7 13.4 3.0 3.1 0.6 0.6 5.1 4.5 3.9 4.2
Hotai Motor 2207 TT TWD 346.5 6,267 Dec 17.2 14.6 3.8 3.8 4.1 3.0 10.2 9.2 26.8 23.2
A v erage 19.3 21.3 1.8 1.9 2.3 1.9 8.2 7.3 12.9 12.8
US
Autonation AN US USD 44.06 4,447 Dec 11.0 9.9 0.0 0.0 1.7 1.5 6.9 6.5 16.4 16.1
Group 1 Auto GPI US USD 72.81 1,564 Dec 9.4 8.9 1.3 1.3 1.4 1.2 6.8 6.7 16.2 15.3
Asbury Auto ABG US USD 63.1 1,334 Dec 9.9 9.2 0.0 0.0 3.5 2.6 6.9 6.9 39.8 33.5
Carmax KMX US USD 59.69 11,085 Feb 17.0 15.5 0.0 0.0 3.4 2.9 11.9 11.3 19.3 19.0
Lentuo Intl LASLY US USD 1E-04 0.00 Dec n.a. n.a. n.a. n.a. n.a. n.a. n.a. n.a. n.a. n.a.A v erage 11.8 10.9 0.3 0.3 2.5 2.1 8.1 7.9 22.9 21.0
Source: Thomson Reuters, *DBS Vickers

ASIAN INSIGHTS VICKERS SECURITIESed-JS/ sa- CW
BUY (Initiate)
Last Traded Price ( 24 Apr 2017):HK$7.42 (HSI : 24,139) Price Target 12-mth: HK$9.20 (24% upside) Potential Catalyst: Strong new model line-up from OEMs Where we differ: Our FY17/18F EPS is above consensus Analyst Rachel MIU +852 2863 8843 [email protected] Price Relative
Forecasts and Valuation FY Dec (RMB m) 2015A 2016A 2017F 2018FTurnover 35,658 43,033 51,068 59,119 EBITDA 1,602 2,091 2,472 3,085 Pre-tax Profit 777 1,152 1,636 2,134 Net Profit 524 871 1,202 1,511 Net Pft (Pre Ex) (core profit)
524 871 1,202 1,511
EPS (RMB) 0.35 0.59 0.81 1.02 EPS (HK$) 0.40 0.67 0.92 1.16 Core EPS (HK$) 0.40 0.67 0.92 1.16 Core EPS (RMB) 0.35 0.59 0.81 1.02 EPS Gth (%) 4.7 66.1 37.9 25.8 Core EPS Gth (%) 4.7 66.1 37.9 25.8 Diluted EPS (HK$) 0.36 0.60 0.83 1.04 DPS (HK$) 0.12 0.19 0.27 0.33 BV Per Share (HK$) 3.24 3.79 4.52 5.41 PE (X) 18.6 11.2 8.1 6.4 Core PE (X) 18.6 11.2 8.1 6.4 P/Cash Flow (X) 4.9 17.0 4.4 3.6 P/Free CF (X) 8.2 nm 7.5 5.5 EV/EBITDA (X) 9.7 8.4 7.1 5.6 Net Div Yield (%) 1.6 2.6 3.6 4.5 P/Book Value (X) 2.3 2.0 1.6 1.4 Net Debt/Equity (X) 1.2 1.4 1.1 0.9 ROAE (%) 13.0 18.9 22.1 23.3 Earnings Rev (%): New New Consensus diluted EPS (RMB)
0.74 0.91
Other Broker Recs: B: 8 S: 0 H: 0
Source of all data on this page: Company, DBSV, Thomson Reuters, HKEX
Riding out the rough tides • High exposure to BMW brand • Anticipate strong earnings ahead • Valuation yet to fully reflect strong earnings potential • Initiate with BUY; HK$9.20 TP pegged to FY17F 11x PE
One of the largest BMW dealerships. China Yongda (Yongda) is a premium auto dealership operator based in Shanghai. It has 35 BMW stores as at end of Dec 2016, making it one of the largest BMW dealerships in China. This gives it huge leverage on BMW’s new models in 2017-2018. In terms of revenue, BMW exposure accounts for about 30-40% of total revenue. Recovery underway; strong earnings in sight. The auto dealership sector is poised for strong growth. Both demand of luxury cars and gross profit (GP) margins are expected to trend up, led by the new model pipeline. We estimate FY16-18F earnings CAGR of 32%. High margins from auto rental and leasing. The auto leasing segment recorded GP margins of c.78% last year. The business is still small and growth potential is huge. This explains the high net gearing of c.1.2x in FY16. The debts are backed by c.Rmb1.1bn worth of finance lease receivables. Revenue from auto rental services has been climbing steadily with strong returns so far, following the expanding customer base. Valuation: Our TP of HK$9.20 is pegged to 11x FY17F PE, benchmarked to auto dealership sector and company’s historical PE band. Current valuation of 8x PE has yet to fully reflect its strong earnings ability. Initiate with BUY rating on industry recovery, improvement in earnings and undemanding valuation. Key Risks to Our View: Oversupply could pressure GP margins on new cars sales and cause inventory to rise, resulting in greater market competition.
At A Glance Issued Capital (m shrs) 1,486 Mkt. Cap (HK$m/US$m) 11,055 / 1,421
Major Shareholders Cheung Tak On (%) 44.1 Cai Yingjie (%) 7.4 Gu Mingchang (%) 6.8 Salata Jean Eric (%) 6.4 Runda Holdings Limited (%) 5.2
Free Float (%) 30.2 3m Avg. Daily Val. (US$m) 4.1 ICB Industry : Consumer Services / General Retailers
DBS Group Research . Equity 25 Apr 2017
China / Hong Kong Company Guide
China Yongda Automobiles Version 1 | Bloomberg: 3669 HK Equity | Reuters: 3669.HK
Refer to important disclosures at the end of this report

Company Guide
China Yongda Automobiles
Page 14
A leading BMW auto brand dealership
The Business Model
Background on the company. China Yongda Automobiles (Yongda) is a leading premium car 4S dealership operator in China. Its principle business is largely located along the eastern coastal regions (Shanghai, Zhejiang, Jiangsu provinces), which include (i) passenger vehicle sales and after-sales services, (ii) auto rental services, (iii) automobile finance leasing services; and (iv) pre-owned vehicle sales. The company was founded by Cheung Tak On (Chairman) in 1992. Operations started off with sales of passenger vehicle and spare parts business, and its first 4S dealership was launched
in 1999. Later, the company commenced automobile rental services and second-hand vehicle business in 2000 and 2003, respectively. After a successful IPO in Hong Kong in July 2012, Yongda Finance Holdings Group was launched in 2014 to take advantage of the rapid demand for auto financing At the end of December 2016, Yongda has 132 4S shops, comprised 90 luxury/ultra luxury and 42 mid-to-high brands. Authorised 4S stores undertake four key business functions – selling, spare parts, servicing and survey. These dealerships provide critical links between consumers and the automakers, providing valuable feedbacks on consumers’ preferences and sales demand.
Organisation chart
Chairman/Founder: Cheung Tak On (44.11%)-Palace Wonder 26.00%-Asset Link 18.05%-Benificia l owner 0.06%
CEO: Cai Yingjie(7.36%)-Ample Glory 7.30%-Benificial owner 0.06%
Gu Mingchang (6.80%)-Sun Moon 6.8%
Salata Jean Eric (6.36%)
Runda Holdings (5.20%)
Others / Public(30.17%)
The Company
Passenger vehicle sa les and comprehensive service (4S dealerships)-Luxury/ultra-luxury brands: BMW, Bentley, Jaguar Land Rover, Audi, Infiniti, Volvo, Cadillac, Lexus, Lincoln, Aston Martin-Mid- to high-end brands: Buick, Toyota , Honda, Ford, VW etc.
Automobile rental services(Yongda Automobile Rental Group)-Auto rental services for enterprises, institutions, social groups and individuals
Finance service(Yongda Finance Holdings)-huimaiche"惠買車"-huiyangche "惠養車"-huihuanche"惠換車"
New energy vehicle industry investment company
Source: DBS Vickers

Company Guide
China Yongda Automobiles
Page 15
Gross Profit Breakdown
0
2,000
4,000
6,000
8,000
FY12 FY13 FY14 FY15 FY16 FY17F FY18F
Luxury & ultra luxury car sales Mid-high end cae salesAfter-sales services Automobile rental servicesFinance leasing
RMB m
Source: Company, DBS Vickers
Revenue Breakdown
0
20,000
40,000
60,000
80,000
FY12 FY13 FY14 FY15 FY16 FY17F FY18F
Luxury & ultra luxury car sales Mid-high end cae salesAfter-sales services Automobile rental servicesFinance leasing
RMB m
Source: Company, DBS Vickers
Premium and mid-market car sales
Vehicle brands portfolio. The company’s auto sales business mainly focuses on luxury/ultra-luxury brands and mid- to high-end brands. Its portfolio has 13 luxury/ultra-luxury brands, covering BMW/MINI, Jaguar Land Rover (JLR), Audi, Porsche, Infiniti, Volvo, Cadillac, Lexus, Lincoln, Aston Martin etc, while for mid- to high-end brands, it has Toyota, Volkswagen, Ford, Honda, Buick, Chevrolet, Roewe, Skoda, etc.
Passenger vehicle sales and after-sales services through the 4S dealership stores. The company provides sales of vehicles and after-sales services (including spare parts and accessories) to
car buyers. As at the end of 2016, the company has 105 luxury/ultra-luxury stores (of which 90 are 4S stores) and 42 mid-high end branded 4S stores. Yongda also operates 108 self-owned stores that provide maintenance and repair services as well as auto rental, leasing and pre-owned vehicle services.
Stores profile (FY16)
Luxury and ultra-luxury brands (115
outlets)42%
Mid-high end brands (48
outlets)18%
Outlets that not required
to obtain authorization
from the manufactures (108 outlets)
40%
Source: Company
In the past five years, the company has expanded its 4S dealerships. Its luxury/ultra-luxury and mid- to high-end branded 4S dealerships have increased from 25 and 26 in 2012 to 90 and 42 as at end-2016 respectively. It has another 16 stores that have been authorised by the automakers which have yet to be opened. Generally, the company expands its sales network through greenfield projects and acquisitions. In 2016, the company acquired 18 stores, largely dealerships for luxury/ultra-luxury brands.
Yongda is one of the largest BMW dealerships in China (FY16: 35 stores) and a relatively large JLR player as well (FY16: 15 stores).
Company Guide
China Yongda Automobiles
Page 16
Number of dealership stores (FY16)
O ut let s inoperat ion in
2015
Out let s inoperat ion
A ut horized t obe opened
T ot al
Luxury and ultra-luxury brands 4S dealerships 77 90 7 97
Mid-high end brands 4S dealerships 30 42 6 48
Luxury brands city showrooms 10 9 3 12Luxury brands authorized serv ice centers 4 4 0 4
Luxury brands authorized certified pre-owned vehicle centers 2 2 0 2
T ot al manuf ac t urer aut horized out let s 123 147 16 163
"Auto Repair" luxury automobile maintenance and repair center 15 17 - 17Automobile rental outlets 30 28 - 28
F inance leasing outlets 30 39 - 39
Passenger v ehicle comprehensive showrooms 5 8 - 8Pre-owned vehicle comprehensive showrooms 10 16 - 16
T ot al out let s not requ ired t o obt ain aut horizat ionf rom t he manuf ac t urers
90 108 0 108
T ot al 213 255 16 271
Source: Company
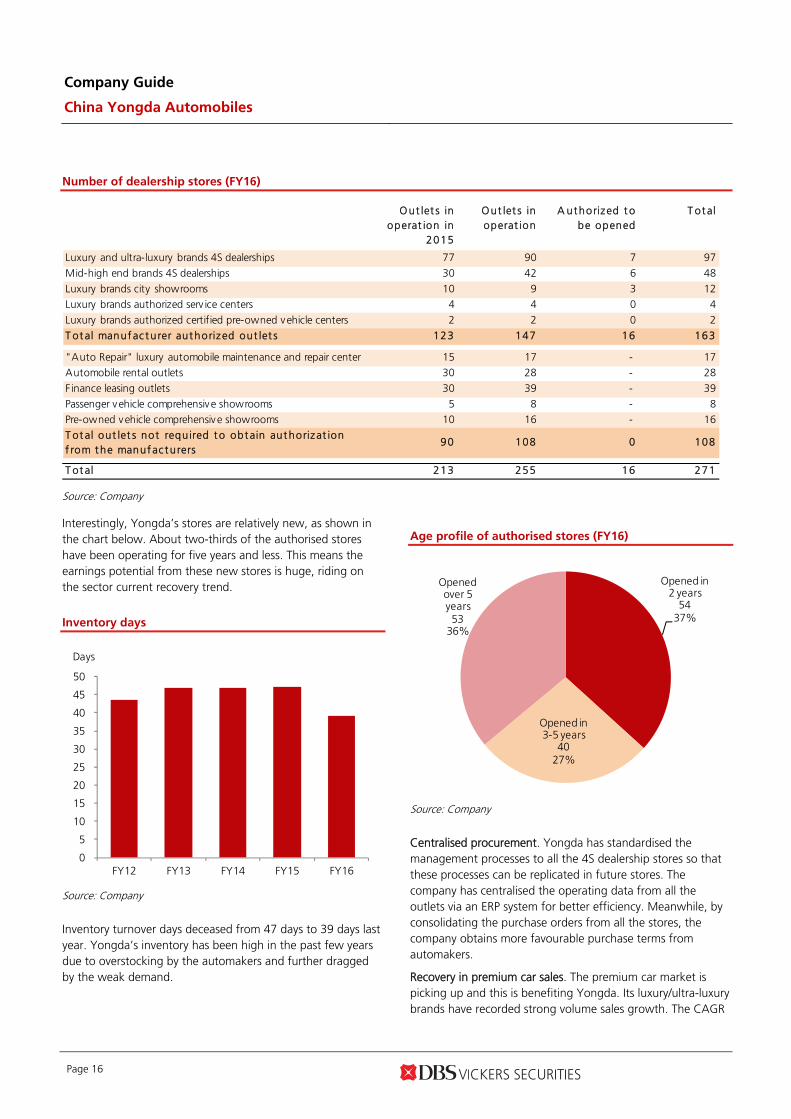
Interestingly, Yongda’s stores are relatively new, as shown in the chart below. About two-thirds of the authorised stores have been operating for five years and less. This means the earnings potential from these new stores is huge, riding on the sector current recovery trend.
Inventory days
0
5
10
15
20
25
30
35
40
45
50
FY12 FY13 FY14 FY15 FY16
Days
Source: Company
Inventory turnover days deceased from 47 days to 39 days last year. Yongda’s inventory has been high in the past few years due to overstocking by the automakers and further dragged by the weak demand.
Age profile of authorised stores (FY16)
Opened in 2 years
5437%
Opened in 3-5 years
4027%
Opened over 5 years53
36%
Source: Company
Centralised procurement. Yongda has standardised the management processes to all the 4S dealership stores so that these processes can be replicated in future stores. The company has centralised the operating data from all the outlets via an ERP system for better efficiency. Meanwhile, by consolidating the purchase orders from all the stores, the company obtains more favourable purchase terms from automakers.
Recovery in premium car sales. The premium car market is picking up and this is benefiting Yongda. Its luxury/ultra-luxury brands have recorded strong volume sales growth. The CAGR
Company Guide
China Yongda Automobiles
Page 17
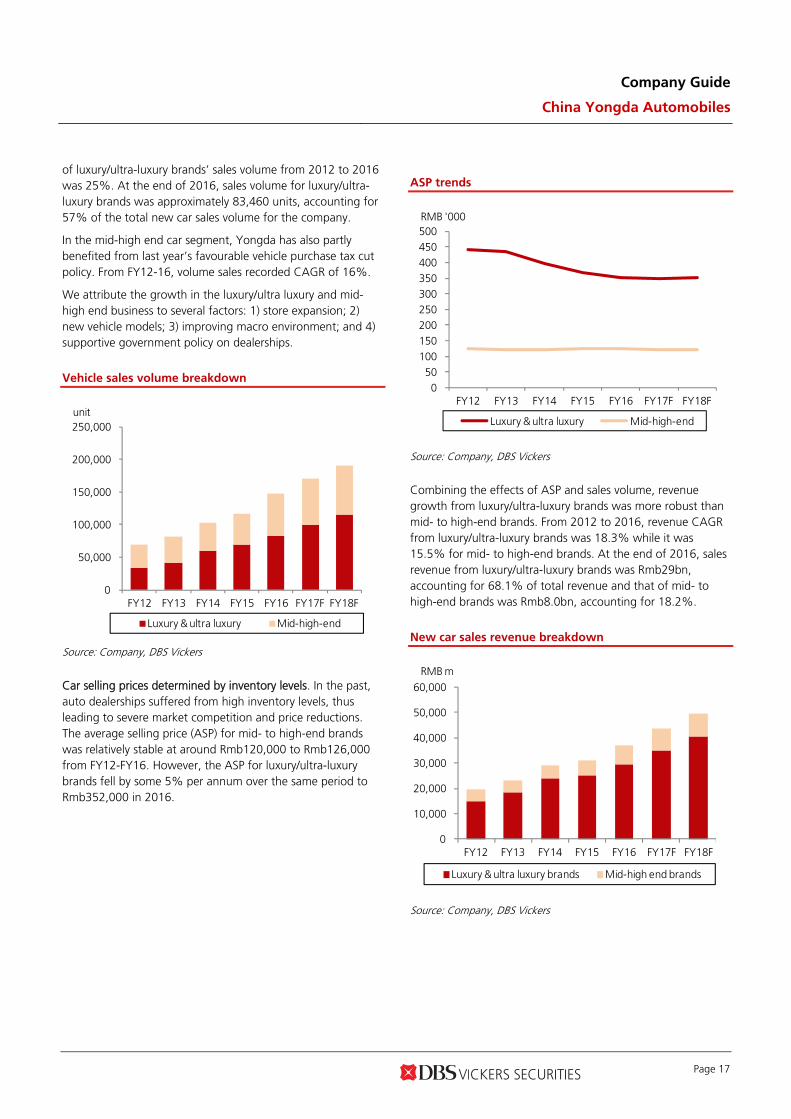
of luxury/ultra-luxury brands’ sales volume from 2012 to 2016 was 25%. At the end of 2016, sales volume for luxury/ultra-luxury brands was approximately 83,460 units, accounting for 57% of the total new car sales volume for the company.
In the mid-high end car segment, Yongda has also partly benefited from last year’s favourable vehicle purchase tax cut policy. From FY12-16, volume sales recorded CAGR of 16%.
We attribute the growth in the luxury/ultra luxury and mid-high end business to several factors: 1) store expansion; 2) new vehicle models; 3) improving macro environment; and 4) supportive government policy on dealerships.
Vehicle sales volume breakdown
0
50,000
100,000
150,000
200,000
250,000
FY12 FY13 FY14 FY15 FY16 FY17F FY18F
Luxury & ultra luxury Mid-high-end
unit
Source: Company, DBS Vickers
Car selling prices determined by inventory levels. In the past, auto dealerships suffered from high inventory levels, thus leading to severe market competition and price reductions. The average selling price (ASP) for mid- to high-end brands was relatively stable at around Rmb120,000 to Rmb126,000 from FY12-FY16. However, the ASP for luxury/ultra-luxury brands fell by some 5% per annum over the same period to Rmb352,000 in 2016.
ASP trends
0 50
100 150 200 250 300 350 400 450 500
FY12 FY13 FY14 FY15 FY16 FY17F FY18F
Luxury & ultra luxury Mid-high-end
RMB '000
Source: Company, DBS Vickers
Combining the effects of ASP and sales volume, revenue growth from luxury/ultra-luxury brands was more robust than mid- to high-end brands. From 2012 to 2016, revenue CAGR from luxury/ultra-luxury brands was 18.3% while it was 15.5% for mid- to high-end brands. At the end of 2016, sales revenue from luxury/ultra-luxury brands was Rmb29bn, accounting for 68.1% of total revenue and that of mid- to high-end brands was Rmb8.0bn, accounting for 18.2%.
New car sales revenue breakdown
0
10,000
20,000
30,000
40,000
50,000
60,000
FY12 FY13 FY14 FY15 FY16 FY17F FY18F
Luxury & ultra luxury brands Mid-high end brands
RMB m
Source: Company, DBS Vickers
Company Guide
China Yongda Automobiles
Page 18
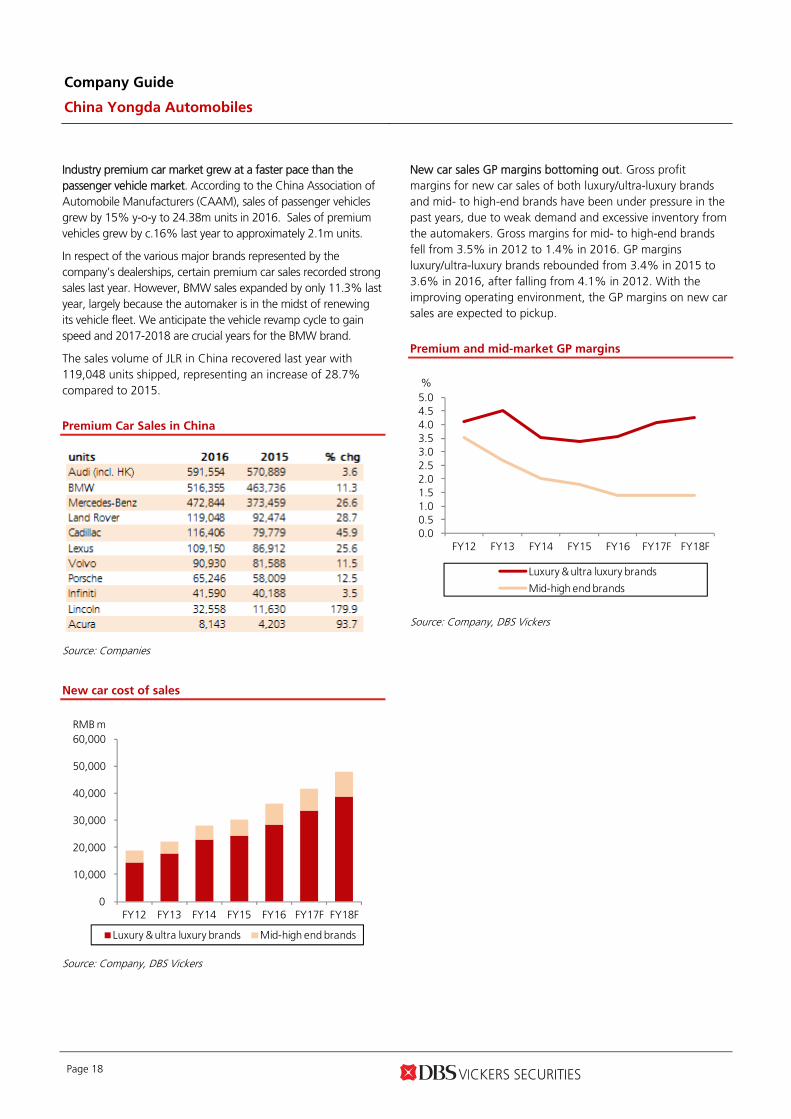
Industry premium car market grew at a faster pace than the passenger vehicle market. According to the China Association of Automobile Manufacturers (CAAM), sales of passenger vehicles grew by 15% y-o-y to 24.38m units in 2016. Sales of premium vehicles grew by c.16% last year to approximately 2.1m units.
In respect of the various major brands represented by the company’s dealerships, certain premium car sales recorded strong sales last year. However, BMW sales expanded by only 11.3% last year, largely because the automaker is in the midst of renewing its vehicle fleet. We anticipate the vehicle revamp cycle to gain speed and 2017-2018 are crucial years for the BMW brand.
The sales volume of JLR in China recovered last year with 119,048 units shipped, representing an increase of 28.7% compared to 2015.
Premium Car Sales in China
Source: Companies
New car cost of sales
0
10,000
20,000
30,000
40,000
50,000
60,000
FY12 FY13 FY14 FY15 FY16 FY17F FY18F
Luxury & ultra luxury brands Mid-high end brands
RMB m
Source: Company, DBS Vickers
New car sales GP margins bottoming out. Gross profit margins for new car sales of both luxury/ultra-luxury brands and mid- to high-end brands have been under pressure in the past years, due to weak demand and excessive inventory from the automakers. Gross margins for mid- to high-end brands fell from 3.5% in 2012 to 1.4% in 2016. GP margins luxury/ultra-luxury brands rebounded from 3.4% in 2015 to 3.6% in 2016, after falling from 4.1% in 2012. With the improving operating environment, the GP margins on new car sales are expected to pickup.
Premium and mid-market GP margins
0.0 0.5 1.0 1.5 2.0 2.5 3.0 3.5 4.0 4.5 5.0
FY12 FY13 FY14 FY15 FY16 FY17F FY18F
Luxury & ultra luxury brands
Mid-high end brands
%
Source: Company, DBS Vickers

Company Guide
China Yongda Automobiles
Page 19
After-sales services
After-sales revenues
0
1,000
2,000
3,000
4,000
5,000
6,000
7,000
8,000
9,000
FY12 FY13 FY14 FY15 FY16 FY17F FY18F
RMB m
Source: Company, DBS Vickers
After-sales services contribute bulk of profits. After-sales services have been the main earnings driver because of its rapid business expansion and high GP margins. The CAGR of after-sales revenue from 2012 to 2016 was 28%, significantly higher than the company’s revenue CAGR of 19%. Percentage of after-sales services to total revenue increased from 9.4% in 2012 to 12.7% in 2016. Gross margins of after-sales services are lucrative at around 45%. The gross profit from after-sales services contributed 65.4% to total gross profit in 2016, up from 51.5% in 2012.
After-sales services gross profit & margins
43.0
43.5
44.0
44.5
45.0
45.5
46.0
46.5
47.0
0
500
1,000
1,500
2,000
2,500
3,000
3,500
4,000
FY12 FY13 FY14 FY15 FY16 FY17F FY18F
Gross profit (LHS) Gross margin (RHS)
RMB m %
Source: Company, DBS Vickers

Company Guide
China Yongda Automobiles
Page 20
Cost structure
Cost of sales breakdown (FY16)
Luxury & ultra luxury
brands72.0%
Mid-high end brands
19.8% After-sales services7.5%
Automobile rental services0.7%
Finance leasing0.1%
Source: Company
Cost of purchase of new cars from automakers contributes the most to total cost of sales, accounting for 91.7% in FY16. Cost of after-sales services, automobile rental services and finance leasing made up 7.5%, 0.7% and 0.1%, respectively.
Operating cost as % of total revenues
0
1
2
3
4
5
6
FY12 FY13 FY14 FY15 FY16 FY17F FY18F
Dist & selling expense Admin expense
Finance cost
%
Source: Company, DBS Vickers
Operating cost rose in tandem with business expansion. The ratio of distribution and selling expense to revenue increased from 3.4% in 2012 to 4.5% in 2016. One of the key items is staff cost, which increased by 17% y-o-y to about Rmb1bn in 2016, accounting for 2.4% of total revenue. This is mainly because the company has opened more new stores and they
are still in the early growth stage. Administrative expense to revenue also showed the same trend for the same reason. In 2012, administrative expense to revenue was 1.7% and increased to 2.4% in 2016.
However, the finance cost to revenue ratio has been easing, as the company had raised some low cost debts to finance its business expansion. In July 2014, it issued USD convertible bonds (CBs; Rmb1bn principal amount) at 1.5% to finance growth. The CBs are due in July 2019.
Company Guide
China Yongda Automobiles
Page 21
Auto related services
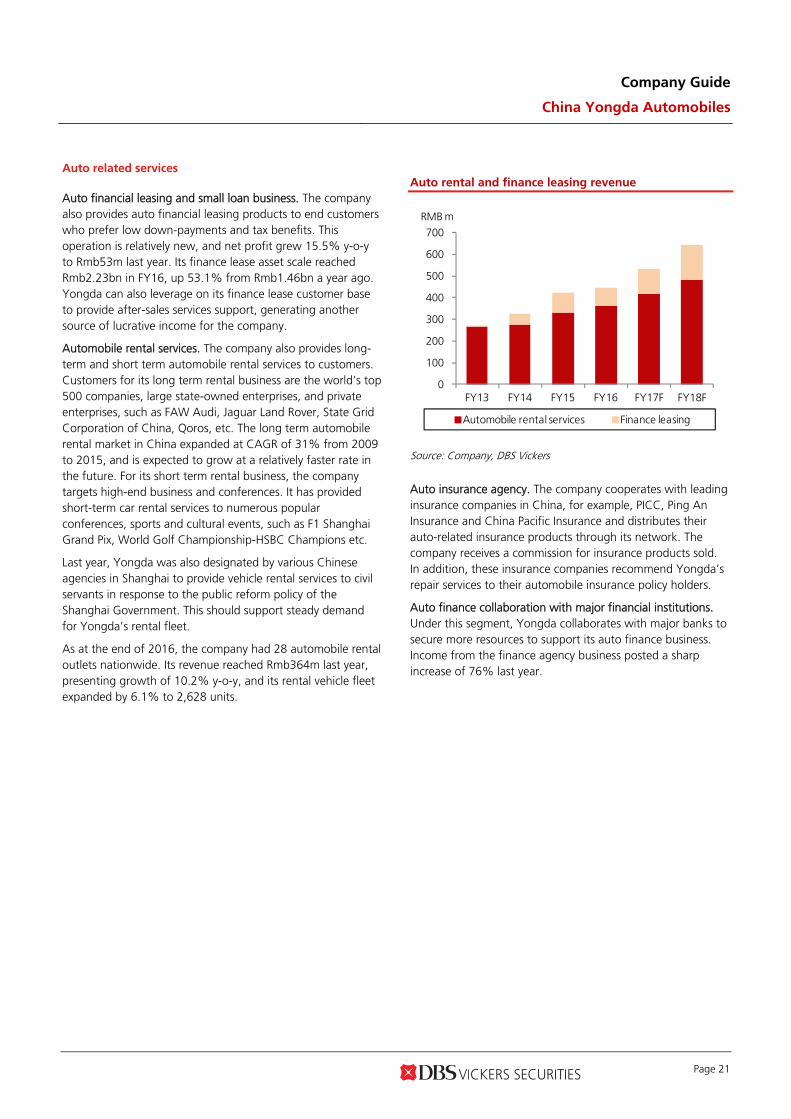
Auto financial leasing and small loan business. The company also provides auto financial leasing products to end customers who prefer low down-payments and tax benefits. This operation is relatively new, and net profit grew 15.5% y-o-y to Rmb53m last year. Its finance lease asset scale reached Rmb2.23bn in FY16, up 53.1% from Rmb1.46bn a year ago. Yongda can also leverage on its finance lease customer base to provide after-sales services support, generating another source of lucrative income for the company.
Automobile rental services. The company also provides long-term and short term automobile rental services to customers. Customers for its long term rental business are the world’s top 500 companies, large state-owned enterprises, and private enterprises, such as FAW Audi, Jaguar Land Rover, State Grid Corporation of China, Qoros, etc. The long term automobile rental market in China expanded at CAGR of 31% from 2009 to 2015, and is expected to grow at a relatively faster rate in the future. For its short term rental business, the company targets high-end business and conferences. It has provided short-term car rental services to numerous popular conferences, sports and cultural events, such as F1 Shanghai Grand Pix, World Golf Championship-HSBC Champions etc.
Last year, Yongda was also designated by various Chinese agencies in Shanghai to provide vehicle rental services to civil servants in response to the public reform policy of the Shanghai Government. This should support steady demand for Yongda’s rental fleet.
As at the end of 2016, the company had 28 automobile rental outlets nationwide. Its revenue reached Rmb364m last year, presenting growth of 10.2% y-o-y, and its rental vehicle fleet expanded by 6.1% to 2,628 units.
Auto rental and finance leasing revenue
0
100
200
300
400
500
600
700
FY13 FY14 FY15 FY16 FY17F FY18F
Automobile rental services Finance leasing
RMB m
Source: Company, DBS Vickers
Auto insurance agency. The company cooperates with leading insurance companies in China, for example, PICC, Ping An Insurance and China Pacific Insurance and distributes their auto-related insurance products through its network. The company receives a commission for insurance products sold. In addition, these insurance companies recommend Yongda’s repair services to their automobile insurance policy holders.
Auto finance collaboration with major financial institutions. Under this segment, Yongda collaborates with major banks to secure more resources to support its auto finance business. Income from the finance agency business posted a sharp increase of 76% last year.

Company Guide
China Yongda Automobiles
Page 22
Commission income
0
50
100
150
200
250
300
350
400
450
FY14 FY15 FY16
Finance agency Insurance agency
RMB m
Source: Company
Second hand car business The company also has a second hand car business to complement its new car sales operation. With the increase in vehicle ownership in China and upgrading trend, the pre-owned car market is rapidly expanding. In 2016, total transaction volume of pre-owned vehicles crossed 10m units and it is estimated to exceed 12.5m units in 2017, representing c.20% growth, based on CAAM’s projections. For Yongda, sales at its pre-owned vehicle unit rose 41% y-o-y in FY16 to 25,384 units. This business generated income of Rmb129m for the company, about 42% increase from FY15.
Opportunity in new energy vehicle (NEV) industry. The company is exploring the opportunity to enter the NEV market. It has secured authorisations from certain automakers such as BMW, Audi, Nissan, Toyota, Jianghuai Auto, and BAIC to sell their NEVs in Shanghai, Guangdong and Shenzhen. The company will also explore timeshare rentals of NEVs as well investments into the charging station network.

Company Guide
China Yongda Automobiles
Page 23
Growth prospects
New models and upgrading to support premium car market expansion. The Chinese car buyers prefer new vehicle models. Starting this year, BMW will introduce some exciting new models, including the new BMW 5 series, BMW X3 and BMW 3 series from 2017-2019. The premium car segment accounted for about 9% of the total passenger vehicle market last year and growth outlook is exciting.
Besides, replacement and upgrading is another important volume driver. In tier 1 cities, existing car plate holders tend to trade up to the more expensive vehicles. Based on vehicles sold in tier 1 and major tier 2 cities during the previous boom cycle (2008-2010) and accumulated vehicle population size as at March 2017, a 10% replacement ratio would translate to about 6m units ripe for replacement. This provides a good stream of car buyers for the 4S dealerships such as Yongda. Besides, the tier 1 cities have auto sales restriction policies and car owners would tend to trade up for the more expensive cars.
Automakers more realistic on production output; positive on inventory. The automakers’ attitude towards production output has changed in recent years. Overall, they are pushing less inventories to the auto dealers, which is positive for GP margins on new car sales as well as inventory funding cost. Previously, auto dealerships had suffered from severe price competition when demand eased and inventory build-up reached an alarming level.
GP margin expansion. The GP margins have room to expand further as most of the stores are relatively new. Of the 147 authorised 4S stores, 53% have been opened for over 5 years, 40% for 3-5 years, and 37% for 2 years. This young age profile should support GP margin expansion on new car sales (as volume scale increases).
China total passenger vehicle sales
0.0
2.0
4.0
6.0
8.0
10.0
12.0
14.0
16.0
0
5
10
15
20
25
30
2012
2013
2014
2015
2016
Sales volume (LHS) YoY growth (RHS)
m units %
Source: CEIC
China premium car sales
0
10
20
30
40
50
60
70
Feb/
10M
ay/1
0A
ug/1
0N
ov/1
0Fe
b/11
May
/11
Aug
/11
Nov
/11
Feb/
12M
ay/1
2A
ug/1
2N
ov/1
2Fe
b/13
May
/13
Aug
/13
Nov
/13
Feb/
14M
ay/1
4A
ug/1
4N
ov/1
4Fe
b/15
May
/15
Aug
/15
Nov
/15
Feb/
16M
ay/1
6A
ug/1
6N
ov/1
6Fe
b/17
BMW Audi Mercedes Benz
'000 units
Source: Companies
Growth in car financing loan market to accelerate. The Chinese car loan market is underdeveloped compared to the western markets. Auto financing penetration rate in 2015 was about 30%+, compared to 80-90% in Europe and the US. The potential is hug as China is the largest auto market in the world.

Company Guide
China Yongda Automobiles
Page 24
China auto finance market size
0
20
40
60
80
100
120
140
160
180
2007 2008 2009 2010 2011 2012 2013 2014 2015
RMB bn
Source: CBRC
China auto loans NPL
Source: CBRC, Wind
Competition landscape
Highly fragmented market. The Chinese auto dealership industry is highly fragmented. Many smaller players are exiting the market due to the intense competition in the past few years. The top ten dealership groups controlled about 10-12% of total passenger vehicles sold in 2015. In 2016, the consolidation continued and we believe the share held by the top ten players in the passenger vehicle market should inch up by 1-2ppts.
Peers of Yongda. Among the BMW/MINI dealership players, the top three players are Yongda, Baoxin and China ZhengTong. It is estimated that Yongda derived about 40% of its FY16 revenue from the BMW brand, up from c. 30% in FY15. At the end of 2016, it has 35 BMW 4S stores. Hence, Yongda is a relatively significant player for the BMW brand in China.

Company Guide
China Yongda Automobiles
Page 25
Management & strategy
Management Composition. CHEUNG Tak On, the Chairman and founder of the company, is responsible for the development of the overall strategic vision, direction and goals of the group. CAI Yingjie, the CEO, is responsible for operations and exploring new business opportunities. WANG Zhigao, the Vice Chairman, is responsible for finance
management and investor relations of the group. XU Yue, the President, is responsible for overseeing the development of marketing strategies and the establishment of new 4S dealerships. CHEN Yi, the Vice President, is responsible for financial innovation, funds management and financial leasing. All of them have many years of auto dealer experience behind them.
Management Profiles Name A ge Curren t
A ppo in t men tRo les
CHEUNG Tak On(張德安 )
50 Chairman >Appointed as executiv e director in 2012>Responsible for the dev elopment of the ov erall strategic v ision, direction and goals of the
group>Possesses ov er 20 y ears of auto dealer experience
>A current committee member of the Shanghai Municipal Committee of the Chinese People'sPolitical Consultativ e Conference
> V ice president of the Shanghai F ederation of Industry and Commerce in ChinaCA I Yingjie(蔡英傑 )
49 V ice-chairman/CEO
>Appointed as executiv e director in 2012>Responsible for operations and exploration of new business opportunities
>Owns many y ears of auto dealer experience>V ice Chairman of Shanghai Association of Automobile Manufacturers
WANG Zhigao(王志高 )
48 V ice-chairman >Appointed as executiv e director in 2015>Responsible for finance management and inv estor relations of the Group
>Experienced in finance and legal sectorXU Yue(徐悅 )
41 President >Appointed as executiv e director in 2015>Responsible for ov erseeing the dev elopment of marketing strategies and the establishment of
new 4S dealership>Possesses many y ears of related work experience.
CHEN Yi(陳昳 )
44 V ice-president >Appointed as executiv e director in 2015>Responsible for financial innov ation, funds management and financial leasing
>More than 18 y ears of banking business related work experienceYE Ming(葉明 )
39 V ice-President >Responsible for managing the internal operation of our Group> Possesses many y ears of related work experience
DONG Ying(董穎 )
47 V ice-president/CF O
>Responsible for financial management> Possesses many y ears of related work experience
TANG Hua(唐華 )
44 V ice-President >Responsible for ov erseeing brand management, public relations and the marketingmanagement of our Group
> Possesses many y ears of related work experienceWEI Dong(衛東 )
47 V ice-president >Responsible for managing the sales, after-sale serv ices, insurance and clients' relationship ofthe Group
> Possesses many y ears of related work experience
Source: Company, DBS Vickers

Company Guide
China Yongda Automobiles
Page 26
Focus on premium car brands. The management believes the long-term outlook of the premium car market is strong in China, given the rising income levels and car buyers’ appetite to upgrade to more expensive cars. Therefore, in terms of network expansion, it will focus on the premium car segment, via greenfield developments or M&A. The key brands that Yongda will focus on are BMW, Audi and Porsche.
Network expansion through greenfield developments and M&A. The auto dealership industry is highly fragmented and is in a consolidation phase. The less competitive players are likely to either exit the industry or being acquired by other operators. Yongda purchased 18 stores last year (nil in FY15). Acquisitions allow Yongda to expansion its network faster. On hand, it also has 16 authorisations from automakers to open new stores in the coming quarters.
Comprehensive pre-owned vehicle business. Yongda intends to leverage on the internet platform to grow its pre-owned vehicle resources. The target is to achieve 100,000 units of sales by 2020 (with 200 outlets nationwide), up from 25,384 units in 2016. China’s pre-owned vehicle market is expected to exceed 12.5m units this year, representing 20% y-o-y growth, according to China Automobile Dealers Association forecast.

Company Guide
China Yongda Automobiles
Page 27
Valuation
Price-earnings multiple to value the company. We have valued the company based on price-earnings multiple, benchmarked to sector peers as well as the company’s historical trading band. The auto dealership sector historical average PE was 11.2x. In fact, the sector valuation has only started to appreciation in recent months when the outlook shows signs of improvement. For Yongda, its valuation has also moved with the sector trend. The auto dealership sector is trading at 10x FY17F PE while Yongda is currently trading at 8x PE.
China auto dealership sector PE band
0
100
200
300
400
500
600
700
Jan-
10
Jan-
11
Jan-
12
Jan-
13
Jan-
14
Jan-
15
Jan-
16
Jan-
17
Index (1 Jan 10 = 100)
28x
22x
16x
10x
4x
Source: Thomson Reuters, DBS Vickers
Valuation well supported by strong earnings growth. Our target PE is 11x, a slight discount to its historical average of 11.3x PE and based on fully diluted EPS (assuming full conversion of CBs) to arrive at HK$9.20 TP. We believe the valuation is fair given Yongda’s strong earnings outlook. Based on our earnings projections, FY16-18F earnings CAGR is 32%.
We initiate coverage on Yongda with a BUY rating as the current valuation has yet to fully reflect its strong earnings potential. Besides, the strong management track record would drive the long-term development of the company under the company’s mid-term development plans.

Company Guide
China Yongda Automobiles
Page 28
PE chart
PB chart
0
4
8
12
16
20
24
Jul-1
2
Aug
-13
Sep-
14
Oct
-15
Nov
-16
Dec
-17
x
Avg: 11.2x
+1SD: 16x
-1SD: 6.3x
+2SD: 20.9x
-2SD: 1.5x
0.0
0.5
1.0
1.5
2.0
2.5
3.0
3.5
Jul-1
2
Aug
-13
Sep-
14
Oct
-15
Nov
-16
Dec
-17
x
Avg: 1.7x
+1SD: 2.4x
-1SD: 1x
+2SD: 3x
-2SD: 0.4x
Source: Thomson Reuters, DBS Vickers Source: Thomson Reuters, DBS Vickers
PE band chart
PB band chart
0
5
10
15
20
25
Jul-1
2O
ct-1
2Ja
n-13
Apr
-13
Jul-1
3O
ct-1
3Ja
n-14
Apr
-14
Jul-1
4O
ct-1
4Ja
n-15
Apr
-15
Jul-1
5O
ct-1
5Ja
n-16
Apr
-16
Jul-1
6O
ct-1
6Ja
n-17
Apr
-17
Jul -1
7
Share Price (HK$)
18.8x
15.0x
11.2x
7.4x
3.5x
0
2
4
6
8
10
12
14
16
18
Jul-1
2O
ct-1
2Ja
n-13
Apr
-13
Jul -1
3O
ct-1
3Ja
n-14
Apr
-14
Jul -1
4O
ct-1
4Ja
n-15
Apr
-15
Jul-1
5O
ct-1
5Ja
n-16
Apr
-16
Jul-1
6O
ct-1
6Ja
n-17
Apr
-17
Jul -1
7
Share Price (HK$)
3.0x
2.4x
1.8x
1.3x
0.7x
Source: Thomson Reuters, DBS Vickers Source: Thomson Reuters, DBS Vickers

Company Guide
China Yongda Automobiles
Page 29
Peers valuation
M k t PE PE Y ield Y ield P/Bk P/Bk EV /EBIT DA ROE ROECurrency Price Cap F iscal 17F 18F 17F 18F 17F 18F 17F 18F 17F 18F
Company Name Code Local$ US$m Y r x x % % x x x x % %Hong K ong
Dah Chong Hong* 1828 HK HKD 3.27 770 Dec 11.3 9.2 2.7 3.3 0.7 0.6 7.6 6.6 6.0 6.9ZhongSheng* 881 HK HKD 10.84 2,999 Dec 9.4 8.3 2.1 2.4 1.4 1.3 6.1 5.3 16.6 16.0
China ZhengTong* 1728 HK HKD 4.37 1,245 Dec 11.0 9.4 2.9 3.2 0.9 0.8 9.7 8.7 8.4 9.1Baoxin Auto Group 1293 HK HKD 3.79 1,246 Dec 9.8 8.8 1.9 2.3 1.3 1.3 5.3 5.6 14.8 14.7
China Yongda* 3669 HK HKD 7.42 1,421 Dec 8.1 6.4 3.6 4.5 1.6 1.4 7.1 5.6 22.1 23.3China Meidong Auto 1268 HK HKD 1.68 235 Dec 7.4 5.3 n.a. 7.4 n.a. n.a. n.a. n.a. n.a. n.a.
China Harmony Auto 3836 HK HKD 2.88 583 Dec 5.9 5.5 4.2 4.4 0.6 0.6 2.9 2.5 9.9 10.5Sparkle Roll Group 970 HK HKD 0.59 314 Mar n.a. n.a. n.a. n.a. n.a. n.a. n.a. n.a. n.a. n.a.Auto Italia Holdings 720 HK HKD 0.099 66 Dec n.a. n.a. n.a. n.a. n.a. n.a. n.a. n.a. n.a. n.a.
New Focus Auto 360 HK HKD 0.37 218 Dec n.a. n.a. n.a. n.a. n.a. n.a. n.a. n.a. n.a. n.a.China Rundong Auto 1365 HK HKD 4.04 492 Dec 19.8 n.a. 0.0 n.a. n.a. n.a. n.a. n.a. n.a. n.a.
Sunfonda Group 1771 HK HKD 1.82 140 Dec n.a. n.a. n.a. n.a. n.a. n.a. n.a. n.a. n.a. n.a.A v erage 10.3 7.6 2.5 3.9 1.1 1.0 6.4 5.8 13.0 13.4
Other A sia
Tan Chong Intl TCM MK HKD 2.45 634 Dec n.a. n.a. n.a. n.a. n.a. n.a. n.a. n.a. n.a. n.a.Zhejiang Material 600704 CH CNY 10.75 4,488 Dec 30.7 n.a. 0.9 n.a. 3.3 n.a. n.a. n.a. n.a. n.a.
Power Diversity Auto 601258 CH CNY 3.35 3,252 Dec n.a. 55.8 n.a. 0.6 n.a. 1.7 n.a. n.a. n.a. n.a.Wuhu Yaxia Auto 002607 CH CNY 8.93 592 Dec 30.3 23.3 0.6 n.a. 3.4 2.8 n.a. n.a. 10.4 11.9
Sinomach Auto 600335 CH CNY 12.95 1,939 Dec 12.8 n.a. 2.3 n.a. 1.3 n.a. n.a. n.a. n.a. n.a.China Grand Auto 600297 CH CNY 9.46 7,567 Dec 14.3 11.8 0.0 0.0 1.9 1.7 11.2 9.9 13.5 14.1
Wuxi Coml.Mansion 600327 CH CNY 8.52 703 Dec 18.7 16.1 1.1 1.3 1.5 1.4 n.a. n.a. 7.9 8.8Shanghai Shenhua 600653 CH CNY 3.36 951 Dec n.a. n.a. n.a. n.a. n.a. n.a. n.a. n.a. n.a. n.a.
Fujian Zhangzhou 000753 CH CNY 5 721 Dec n.a. n.a. n.a. n.a. n.a. n.a. n.a. n.a. n.a. n.a.Yulon Motor 2201 TT TWD 26.75 1,393 Dec 14.7 13.4 3.0 3.1 0.6 0.6 5.1 4.5 3.9 4.2
Hotai Motor 2207 TT TWD 346.5 6,267 Dec 17.2 14.6 3.8 3.8 4.1 3.0 10.2 9.2 26.8 23.2A v erage 19.3 21.3 1.8 1.9 2.3 1.9 8.2 7.3 12.9 12.8
US
Autonation AN US USD 44.06 4,447 Dec 11.0 9.9 0.0 0.0 1.7 1.5 6.9 6.5 16.4 16.1Group 1 Auto GPI US USD 72.81 1,564 Dec 9.4 8.9 1.3 1.3 1.4 1.2 6.8 6.7 16.2 15.3Asbury Auto ABG US USD 63.1 1,334 Dec 9.9 9.2 0.0 0.0 3.5 2.6 6.9 6.9 39.8 33.5
Carmax KMX US USD 59.69 11,085 Feb 17.0 15.5 0.0 0.0 3.4 2.9 11.9 11.3 19.3 19.0Lentuo Intl LASLY US USD 1E-04 0.00 Dec n.a. n.a. n.a. n.a. n.a. n.a. n.a. n.a. n.a. n.a.
A v erage 11.8 10.9 0.3 0.3 2.5 2.1 8.1 7.9 22.9 21.0
Source: Thomson Reuters, *DBS Vickers

Company Guide
China Yongda Automobiles
Page 30
Risk factors
Slowdown of luxury car sales due to weakness in macro economy. Concerns on a deceleration in economic growth could dampen luxury car sales. The premium car market may turn south as it did in 2014-2015, resulting in severe competition.
Inventory build-up leading to margin compression. The automakers may restock dealers with huge inventories, leading to high holding cost and margin compression risk to clear old inventories, as price competition intensifies.
Balance sheet could deteriorate due to rising NPL. The auto finance leasing business could lead to deteriorating financials, as weak credit control could result in rising non-performing loans (NPLs).
Product defects and vehicle recalls. Automobile manufacturers conduct vehicle recalls because of product defects from time
to time. Although the company is not liable for any costs caused by recalls according to the regulations, it could affect the customer’s confidence. This may reduce the company’s sales and profitability.
Unable to identify suitable acquisition targets. The company intends to expand its operations through both organic growth and strategic acquisitions. When acquiring dealership stores, the company competes with other dealership groups and may not succeed in identifying suitable acquisition targets, thus slowing its earnings growth.
High fuel prices could reduce demand for passenger vehicles. The fluctuation in global crude oil prices will affect the retail price of petrol and diesel in China. Any increase or increasing volatility in fuel costs may cause consumers to shift to other transportation means, such as NEV, buses, subways and so on.
Business model
4 S D ealershipO u tletsER P SystemA u tomakers
Products
Orders Operation data
Centralized management
Products & Service
RevenueC u stomers
R ental Outlets
h u imaiche(惠買車 )h u ihuanche(惠換車)h u iyangche(惠養車 ) C u stomers
C u stomers
Auto FinanceServices
Revenue
Revenue
Yongda Automobile R ental Group
Yo ngda Finance H o ldings
Auto+Finance+Internet
Long/Short Term Rental
Model Business Management
System
Th e Company
Source: Company, DBS Vickers

Company Guide
China Yongda Automobiles
Page 31
CRITICAL DATA POINTS TO WATCH Earnings Drivers: BMW’s new models to drive car buying interests. As at the end of 2016, the company owned 90 luxury 4S stores, of which BMW brand accounted for 35 stores, or c.39%. With the increasing demand to upgrade passenger vehicles (PV), luxury auto sector is steering towards a new era in 2017. BMW has many new models in the pipeline, including BMW 1 Series and 5 Series, the 2018 upgraded BMW X3 and X5, and the brand new 2018 BMW X7, X2 and 8 Series. Moreover, the adjustment in BMW manufacturers’ strategy related to its dealers at the beginning of 2017 should help BMW dealers improve profits and reduce capital costs. As the company is one of the largest luxury auto dealer companies in China, it should benefit from these positive developments. Store expansion to drive volume sales. During 2016, the company acquired 18 stores and opened 10 new stores. As at the end of 2016, it has 13 4S dealership outlets and 3 showrooms that were authorised by the automakers. This year, the company plans to open 15-20 new stores to boost sales. About half of its existing stores are relatively young (aged five and below). This should support good volume sales growth of 20% in the premium segment in FY17. GP margins for new car sales have room to expand. With the bottoming out of the auto dealership sector and inventory levels coming down, as well as demand is well supported by new model launches ahead, we expect GP margins on new car sales to rise. In 2H16, new car sales’ GP margins have started to improve and we believe the trend will continue. Robust GP margins from after-sale business. The after-sales business share of total gross profit has risen from c.52% in FY12 to c.65% in FY16. Given the importance of this business and high GP margins it commands (45.7% in FY16), increase in repair throughput (especially with expansion in customer base) and efficiency would have a large impact on earnings. Compared to peers, the company’s GP margin in after-sale business is about 1-3ppts lower, indicating a potential growth if the operation is better managed. Sustainable commission income growth from agency business. In 2016, revenue from auto finance and insurance agency related services amounted to Rmb711.8m, a 64.7% increase from 2015. This business is highly correlated to volume sales and revenue expansion.
Volume Sales (units)
Luxury & ultra luxury brands (units)
Mid-high end brands (units)
Source: Company, DBS Vickers
0
50,000
100,000
150,000
200,000
250,000
FY2014A FY2015A FY2016A FY2017F FY2018F
0
20,000
40,000
60,000
80,000
100,000
120,000
140,000
FY2014A FY2015A FY2016A FY2017F FY2018F
0 10,000 20,000 30,000 40,000 50,000 60,000 70,000 80,000
FY2014A FY2015A FY2016A FY2017F FY2018F
Company Guide
China Yongda Automobiles
Page 32
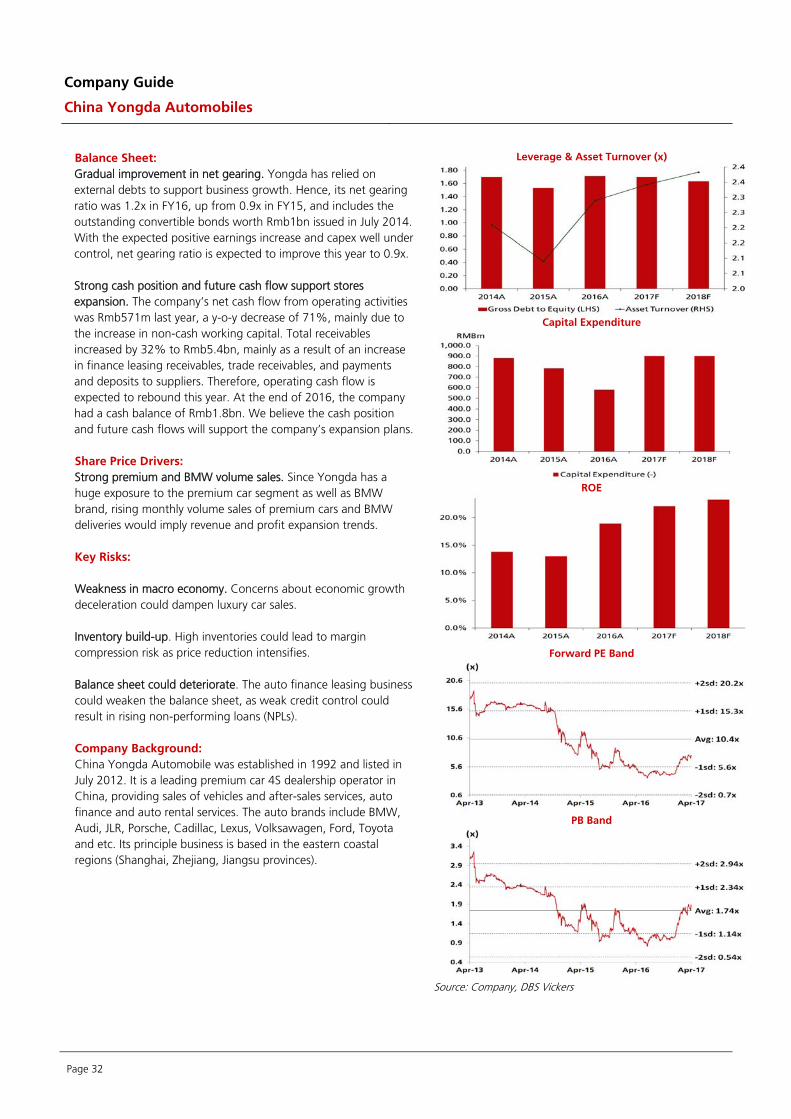
Balance Sheet: Gradual improvement in net gearing. Yongda has relied on external debts to support business growth. Hence, its net gearing ratio was 1.2x in FY16, up from 0.9x in FY15, and includes the outstanding convertible bonds worth Rmb1bn issued in July 2014. With the expected positive earnings increase and capex well under control, net gearing ratio is expected to improve this year to 0.9x. Strong cash position and future cash flow support stores expansion. The company’s net cash flow from operating activities was Rmb571m last year, a y-o-y decrease of 71%, mainly due to the increase in non-cash working capital. Total receivables increased by 32% to Rmb5.4bn, mainly as a result of an increase in finance leasing receivables, trade receivables, and payments and deposits to suppliers. Therefore, operating cash flow is expected to rebound this year. At the end of 2016, the company had a cash balance of Rmb1.8bn. We believe the cash position and future cash flows will support the company’s expansion plans. Share Price Drivers: Strong premium and BMW volume sales. Since Yongda has a huge exposure to the premium car segment as well as BMW brand, rising monthly volume sales of premium cars and BMW deliveries would imply revenue and profit expansion trends.
Key Risks:
Weakness in macro economy. Concerns about economic growth deceleration could dampen luxury car sales. Inventory build-up. High inventories could lead to margin compression risk as price reduction intensifies. Balance sheet could deteriorate. The auto finance leasing business could weaken the balance sheet, as weak credit control could result in rising non-performing loans (NPLs). Company Background: China Yongda Automobile was established in 1992 and listed in July 2012. It is a leading premium car 4S dealership operator in China, providing sales of vehicles and after-sales services, auto finance and auto rental services. The auto brands include BMW, Audi, JLR, Porsche, Cadillac, Lexus, Volksawagen, Ford, Toyota and etc. Its principle business is based in the eastern coastal regions (Shanghai, Zhejiang, Jiangsu provinces).
Leverage & Asset Turnover (x)
Capital Expenditure
ROE
Forward PE Band
PB Band
Source: Company, DBS Vickers

Company Guide
China Yongda Automobiles
Page 33
Key Assumptions
FY Dec 2013A 2014A 2015A 2016A 2017F 2018F Volume Sales (units) 81,882 103,602 116,439 147,262 170,334 190,971 Luxury & ultra luxury brands
42,324 60,237 68,664 83,456 100,147 115,169 Mid-high end brands 39,558 43,365 47,775 63,806 70,187 75,802
Segmental Breakdown (RMB m)
FY Dec 2013A 2014A 2015A 2016A 2017F 2018F Revenues (RMB m) Luxury & ultra luxury car
l 18,392 23,831 25,128 29,298 34,899 40,536
Mid-high end cae sales 4,851 5,243 5,977 7,850 8,565 9,103 After-sales services 2,584 3,537 4,130 5,439 7,070 8,838 Automobile rental services 266 274 330 364 419 481 Finance leasing 4 53 92 82 115 161 Total 26,097 32,938 35,658 43,033 51,068 59,119 Gross Profit (RMB m) Luxury & ultra luxury car
l 836 841 847 1,045 1,350 1,649
Mid-high end cae sales 129 106 108 110 121 128 After-sales services 1,209 1,620 1,884 2,490 3,237 4,021 Automobile rental services 89 75 109 104 120 137 Finance leasing 3 38 91 96 81 105 Total 2,267 2,679 3,027 3,805 4,907 6,041 Gross Profit Margins (%) Luxury & ultra luxury car
l 4.5 3.5 3.4 3.6 3.9 4.1
Mid-high end cae sales 2.7 2.0 1.8 1.4 1.4 1.4 After-sales services 46.8 45.8 45.6 45.8 45.8 45.5 Automobile rental services 33.5 27.3 32.9 28.6 28.6 28.6 Finance leasing 85.0 71.7 98.5 116.5 70.0 65.0 Total 8.7 8.1 8.5 8.8 9.6 10.2 Source: Company, DBS Vickers

Company Guide
China Yongda Automobiles
Page 34
Income Statement (RMB m)
FY Dec 2013A 2014A 2015A 2016A 2017F 2018F Revenue 26,097 32,938 35,658 43,033 51,068 59,119 Cost of Goods Sold (23,830
) (30,259
) (32,631
) (39,227
) (46,161
) (53,079
)
Gross Profit 2,267 2,679 3,027 3,805 4,907 6,041 Other Opng (Exp)/Inc (1,186) (1,560) (1,819) (2,207) (2,759) (3,310) Operating Profit 1,081 1,119 1,208 1,599 2,149 2,731 Other Non Opg (Exp)/Inc 0 0 0 0 0 0 Associates & JV Inc 10 9 16 33 34 35 Net Interest (Exp)/Inc (239) (422) (447) (479) (547) (632)
Dividend Income 0 0 0 0 0 0 Exceptional Gain/(Loss) 0 0 0 0 0 0 Pre-tax Profit 853 705 777 1,152 1,636 2,134 Tax (211) (166) (209) (224) (343) (491) Minority Interest (54) (38) (43) (57) (90) (131) Preference Dividend 0 0 0 0 0 0 Net Profit 588 501 524 871 1,202 1,511 Net Profit before Except. 588 501 524 871 1,202 1,511 EBITDA 1,290 1,427 1,602 2,091 2,472 3,085 Growth Revenue Gth (%) 20.2 26.2 8.3 20.7 18.7 15.8 EBITDA Gth (%) 17.1 10.7 12.3 30.5 18.2 24.8 Opg Profit Gth (%) 16.9 3.5 8.0 32.3 34.4 27.1 Net Profit Gth (%) 25.2 (14.8) 4.7 66.1 37.9 25.8 Margins & Ratio Gross Margins (%) 8.7 8.1 8.5 8.8 9.6 10.2 Opg Profit Margin (%) 4.1 3.4 3.4 3.7 4.2 4.6 Net Profit Margin (%) 2.3 1.5 1.5 2.0 2.4 2.6 ROAE (%) 18.1 13.8 13.0 18.9 22.1 23.3 ROA (%) 5.1 3.4 3.1 4.6 5.5 6.1
ROCE (%) 10.3 8.4 7.5 9.5 10.3 10.9
Div Payout Ratio (%) 30.2 29.5 29.6 28.9 28.9 28.9
Net Interest Cover (x) 4.5 2.6 2.7 3.3 3.9 4.3 Source: Company, DBS Vickers

Company Guide
China Yongda Automobiles
Page 35
Interim Income Statement (RMB m) FY Dec 1H2014 2H2014 1H2015 2H2015 1H2016 2H2016
Revenue 14,902 18,036 16,628 19,029 18,710 24,323 Cost of Goods Sold (13,597) (16,662) (15,161) (17,470) (16,977) (22,250) Gross Profit 1,305 1,374 1,467 1,560 1,733 2,073 Other Oper. (Exp)/Inc (676) (884) (783) (1,036) (997) (1,210) Operating Profit 628 490 684 524 736 863 Other Non Opg (Exp)/Inc 0 0 0 0 0 0 Associates & JV Inc 6 3 4 12 12 20 Net Interest (Exp)/Inc (192) (230) (207) (241) (223) (256) Exceptional Gain/(Loss) 0 0 0 0 0 0 Pre-tax Profit 443 263 482 295 525 627 Tax (105) (61) (126) (84) (120) (104) Minority Interest (28) (11) (26) (17) (22) (35) Net Profit 310 191 330 194 383 488 Net profit bef Except. 310 191 330 194 383 488 Growth Revenue Gth (%) 26.1 26.3 11.6 5.5 12.5 27.8 Opg Profit Gth (%) 41.8 (23.1) 8.9 6.8 7.5 64.8 Net Profit Gth (%) 34.8 (46.7) 6.3 2.0 16.1 151.1 Margins Gross Margins (%) 8.8 7.6 8.8 8.2 9.3 8.5 Opg Profit Margins (%) 4.2 2.7 4.1 2.8 3.9 3.5 Net Profit Margins (%) 2.1 1.1 2.0 1.0 2.0 2.0 Source: Company, DBS Vickers

Company Guide
China Yongda Automobiles
Page 36
Balance Sheet (RMB m)
FY Dec 2013A 2014A 2015A 2016A 2017F 2018F
Net Fixed Assets 2,513 3,353 3,721 3,987 4,659 5,311 Invts in Associates & JVs 94 91 246 454 488 523 Other LT Assets 836 1,926 2,187 2,942 3,247 3,568 Cash & ST Invts 1,418 1,874 1,532 1,772 3,575 5,691 Inventory 3,448 4,324 4,083 4,317 4,317 4,317 Debtors 3,444 3,353 3,534 4,638 4,638 4,638 Other Current Assets 1,145 1,997 1,904 2,264 2,308 2,326 Total Assets 12,898 16,919 17,207 20,375 23,233 26,374 ST Debt
3,887 4,856 5,857 7,097 7,097 7,097 Creditors 3,667 4,986 4,683 5,201 5,201 5,201 Other Current Liab 373 439 445 131 251 398 LT Debt 1,201 2,236 1,180 2,148 3,846 5,544 Other LT Liabilities 78 226 442 394 394 394 Shareholder’s Equity 3,424 3,844 4,237 4,962 5,912 7,076 Minority Interests 267 332 363 441 532 663 Total Cap. & Liab. 12,898 16,919 17,207 20,375 23,233 26,374 Non-Cash Wkg. Capital 3,997 4,250 4,392 5,887 5,812 5,682 Net Cash/(Debt) (3,670) (5,218) (5,505) (7,473) (7,368) (6,950) Debtors Turn (avg days) 41.4 37.7 35.2 34.7 33.2 28.6 Creditors Turn (avg days) 49.9 52.7 54.7 46.5 41.4 36.0 Inventory Turn (avg days) 47.3 47.3 47.6 39.5 34.4 29.9 Asset Turnover (x) 2.3 2.2 2.1 2.3 2.3 2.4 Current Ratio (x) 1.2 1.1 1.0 1.0 1.2 1.3 Quick Ratio (x) 0.6 0.5 0.5 0.5 0.7 0.8 Net Debt/Equity (X) 1.0 1.2 1.2 1.4 1.1 0.9 Net Debt/Equity ex MI (X) 1.1 1.4 1.3 1.5 1.2 1.0 Capex to Debt (%) 14.1 12.4 11.1 6.3 8.2 7.1 Z-Score (X) NA NA NA NA NA NA Source: Company, DBS Vickers

Company Guide
China Yongda Automobiles
Page 37
Cash Flow Statement (RMB m) FY Dec 2013A 2014A 2015A 2016A 2017F 2018F
Pre-Tax Profit 853 705 777 1,152 1,636 2,134 Dep. & Amort. 198 300 379 459 290 320 Tax Paid (103) (146) (188) (541) (224) (343) Assoc. & JV Inc/(loss) (10) (9) (16) (33) (34) (35) (Pft)/ Loss on disposal of FAs 0 0 0 0 0 0 Chg in Wkg.Cap. (1,087) (556) 519 (996) 0 0 Other Operating CF 219 426 497 530 532 601 Net Operating CF 70 719 1,968 571 2,199 2,676 Capital Exp.(net) (716) (881) (783) (581) (900) (900) Other Invts.(net) (490) (365) (142) (515) 0 0 Invts in Assoc. & JV (26) (8) (151) (186) 0 0 Div from Assoc & JV 0 0 0 0 0 0 Other Investing CF (285) (55) (496) (30) (394) (379) Net Investing CF (1,518) (1,310) (1,571) (1,311) (1,294) (1,279) Div Paid (200) (214) (191) (211) (252) (347) Chg in Gross Debt 1,355 1,739 (101) 1,738 1,698 1,698 Capital Issues 41 0 0 (39) 0 0 Other Financing CF (225) (479) (447) (508) (547) (632) Net Financing CF 971 1,046 (739) 980 899 719 Currency Adjustments 0 0 0 0 0 0 Chg in Cash (477) 456 (342) 240 1,803 2,116 Opg CFPS (RMB) 0.78 0.86 0.98 1.06 1.49 1.81 Free CFPS (RMB) (0.44) (0.11) 0.80 (0.01) 0.88 1.20 Source: Company, DBS Vickers

Industry Focus
China Auto Sector
Page 38
China ZhengTong Auto (1728 HK Equity, HK$4.37, BUY, Target Price 12-mth HK$ 5.20) Forecast & Valuation General Data
FY Dec (RMB m) 2015A 2016A 2017F 2018F At A Glance Issued Capital (m shrs) 2,210 Mkt. Cap (HK$m/US$m) 9,684 / 1,245
Major Shareholders Wang Muqing (%) 62.1
Free Float (%) 37.9 3m Avg. Daily Val. (US$m) 7.5
Turnover 29,361 31,519 35,029 40,283 EBITDA 1,710 1,656 1,903 2,106 Pre-tax Profit 922 791 1,133 1,333 Net Profit 619 493 777 915 Net Pft (Pre Ex) (core profit) 619 493 777 915 Net Profit Gth (Pre-ex) (%) (23.0) (20.2) 57.6 17.6 EPS (RMB) 0.28 0.22 0.35 0.41 EPS (HK$) 0.32 0.25 0.40 0.47 Core EPS (HK$) 0.32 0.25 0.40 0.47 Core EPS (RMB) 0.28 0.22 0.35 0.41 EPS Gth (%) (23.0) (20.3) 57.6 17.6 Core EPS Gth (%) (23.0) (20.3) 57.6 17.6 Diluted EPS (HK$) 0.32 0.25 0.40 0.47 DPS (HK$) 0.09 0.10 0.13 0.14 BV Per Share (HK$) 4.40 4.53 4.93 5.40 PE (X) 13.8 17.4 11.0 9.4 Core PE (X) 13.8 17.4 11.0 9.4 P/Cash Flow (X) 5.6 13.2 8.6 8.0 P/Free CF (X) 12.0 nm 21.9 18.2 EV/EBITDA (X) 8.8 11.1 9.7 8.7 Net Div Yield (%) 2.2 2.3 2.9 3.2 P/Book Value (X) 1.0 1.0 0.9 0.8 Net Debt/Equity (X) 0.7 1.1 1.0 0.9 ROAE (%) 7.4 5.7 8.4 9.1 Earnings Rev (%): Nil Nil Consensus EPS (RMB) 0.40 0.48 Other Broker Recs: B: 11 S: 0 H: 2 Income Statement (RMB m) Balance Sheet (RMB m)
FY Dec 2015A 2016A 2017F 2018F FY Dec 2015A 2016A 2017F 2018F Turnover 29,361 31,519 35,029 40,283 Net Fixed Assets 3,428 3,913 4,374 4,816 Cost of Goods Sold (26,775) (28,783) (31,835) (36,541) Invts in Assocs & JVs 925 2,198 2,224 2,250 Gross Profit 2,587 2,736 3,194 3,742 Other LT Assets 6,924 7,025 6,907 6,789 Other Opg (Exp)/Inc (1,267) (1,509) (1,574) (1,939) Cash & ST Invts 1,599 1,625 1,347 1,168 Operating Profit 1,320 1,227 1,620 1,803 Inventory 3,194 3,019 3,170 3,328 Other Non Opg (Exp)/Inc 0 0 0 0 Debtors 5,294 6,384 6,420 6,474 Associates & JV Inc 31 25 26 27 Other Current Assets 2,316 3,565 3,966 4,439 Net Interest (Exp)/Inc (428) (462) (513) (497) Total Assets 23,680 27,729 28,408 29,265 Dividend Income 0 0 0 0 Exceptional Gain/(Loss) 0 0 0 0 ST Debt 5,651 8,747 8,547 8,347 Pre-tax Profit 922 791 1,133 1,333 Other Current Liab 6,105 6,631 6,717 6,841 Tax (293) (282) (340) (400) LT Debt 2,346 2,539 2,539 2,539 Minority Interest (10) (15) (16) (19) Other LT Liabilities 888 870 870 870 Preference Dividend 0 0 0 0 Shareholder’s Equity 8,589 8,858 9,636 10,550 Net Profit 619 493 777 915 Minority Interests 101 84 100 118 Net profit before Except. 619 493 777 915 Total Cap. & Liab. 23,680 27,729 28,408 29,265 EBITDA 1,710 1,656 1,903 2,106 Sales Gth (%) (5.0) 7.3 11.1 15.0 Non-Cash Wkg. Cap 4,699 6,337 6,839 7,401 EBITDA Gth (%) (13.4) (3.1) 14.9 10.6 Net Cash/(Debt) (6,398) (9,661) (9,739) (9,718) Opg Profit Gth (%) (17.8) (7.0) 32.0 11.3 Effective Tax Rate (%) 31.8 35.7 30.0 30.0 Cash Flow Statement (RMB m) Segmental Breakdown (RMB m) / Key Assumptions
FY Dec 2015A 2016A 2017F 2018F FY Dec 2015A 2016A 2017F 2018F Pre-Tax Profit 922 791 1,133 1,333 Revenues (RMB m) Dep. & Amort. 360 184 257 276 New car sales 25,302 27,042 29,973 34,425 Tax Paid (159) (293) (282) (340) After-sales services 3,376 3,422 3,764 4,329 Assoc. & JV Inc/(loss) (31) (25) (26) (27) Logistics services & lubricant oil
trading 615 657 707 768
(Pft)/ Loss on disposal of FAs 0 0 0 0 Chg in Wkg.Cap. (88) (1,795) (560) (622) Interest from financial services 68 398 585 761 Other Operating CF 522 1,786 468 451 Total 29,361 31,519 35,029 40,283 Net Operating CF 1,526 647 990 1,071 Gross Profit (RMB m) Capital Exp.(net) (814) (800) (600) (600) New car sales 839 782 982 1,196 Other Invts.(net) 0 0 0 0 After-sales services 1,636 929 1,769 2,035 Invts in Assoc. & JV 0 0 0 0 Logistics services & lubricant oil
trading 84 112 121 131
Div from Assoc & JV 0 0 0 0 Other Investing CF 45 (279) 24 34 Interest from financial services 27 221 322 380 Net Investing CF (769) (1,079) (576) (566) Total 2,587 2,045 3,194 3,742 Div Paid (198) 0 0 0 Gross Profit Margins (%) Chg in Gross Debt 128 300 (200) (200) New car sales 3.3 2.9 3.3 3.5 Capital Issues 0 0 0 0 After-sales services 48.5 27.2 47.0 47.0 Other Financing CF (534) (438) (492) (483) Logistics services & lubricant oil
trading 13.7 17.1 17.1 17.1
Net Financing CF (605) (138) (692) (683) Currency Adjustments 11 597 0 0 Interest from financial services 40.0 55.5 55.0 50.0 Chg in Cash 164 26 (278) (179) Total 8.8 6.5 9.1 9.3 Key Assumptions Premium brands (units) 61,017.0 67,972.9 76,809.4 88,330.8 Source: Company, DBS Vickers Middle market brands (units) 27,438.0 28,910.0 30,355.5 31,873.3
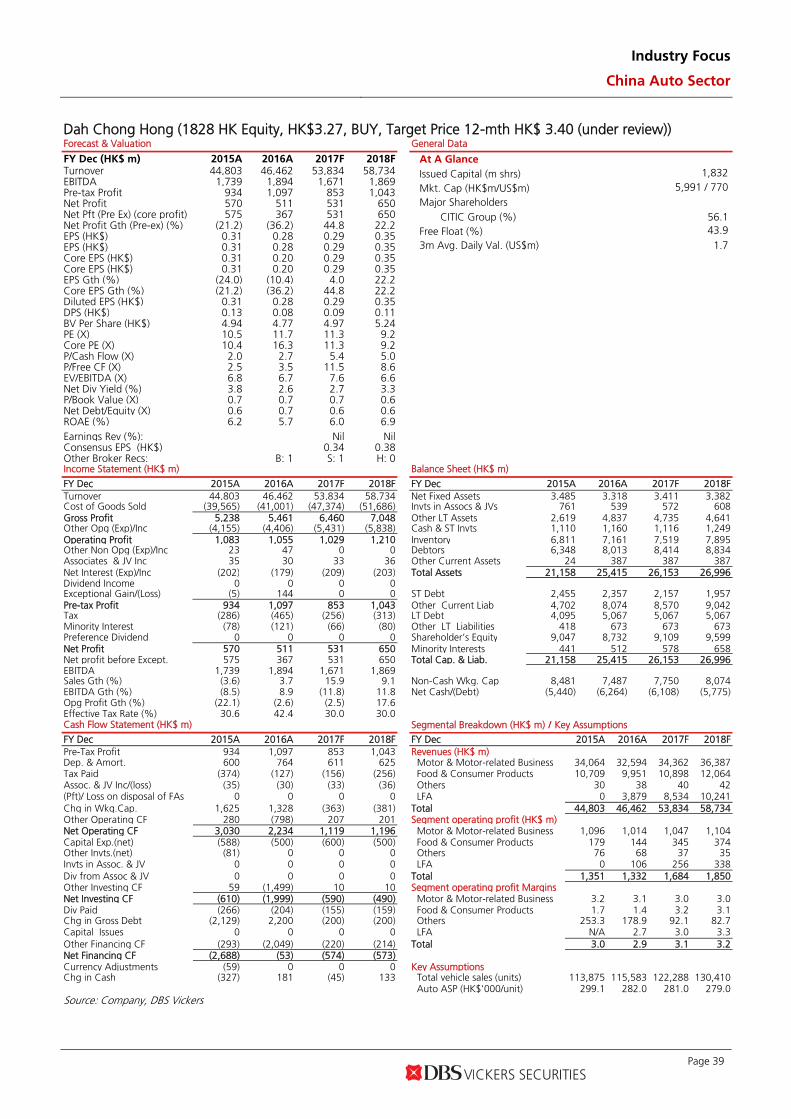
Industry Focus
China Auto Sector
Page 39
Dah Chong Hong (1828 HK Equity, HK$3.27, BUY, Target Price 12-mth HK$ 3.40 (under review)) Forecast & Valuation General Data
FY Dec (HK$ m) 2015A 2016A 2017F 2018F At A Glance Issued Capital (m shrs) 1,832 Mkt. Cap (HK$m/US$m) 5,991 / 770
Major Shareholders CITIC Group (%) 56.1
Free Float (%) 43.9 3m Avg. Daily Val. (US$m) 1.7
Turnover 44,803 46,462 53,834 58,734 EBITDA 1,739 1,894 1,671 1,869 Pre-tax Profit 934 1,097 853 1,043 Net Profit 570 511 531 650 Net Pft (Pre Ex) (core profit) 575 367 531 650 Net Profit Gth (Pre-ex) (%) (21.2) (36.2) 44.8 22.2 EPS (HK$) 0.31 0.28 0.29 0.35 EPS (HK$) 0.31 0.28 0.29 0.35 Core EPS (HK$) 0.31 0.20 0.29 0.35 Core EPS (HK$) 0.31 0.20 0.29 0.35 EPS Gth (%) (24.0) (10.4) 4.0 22.2 Core EPS Gth (%) (21.2) (36.2) 44.8 22.2 Diluted EPS (HK$) 0.31 0.28 0.29 0.35 DPS (HK$) 0.13 0.08 0.09 0.11 BV Per Share (HK$) 4.94 4.77 4.97 5.24 PE (X) 10.5 11.7 11.3 9.2 Core PE (X) 10.4 16.3 11.3 9.2 P/Cash Flow (X) 2.0 2.7 5.4 5.0 P/Free CF (X) 2.5 3.5 11.5 8.6 EV/EBITDA (X) 6.8 6.7 7.6 6.6 Net Div Yield (%) 3.8 2.6 2.7 3.3 P/Book Value (X) 0.7 0.7 0.7 0.6 Net Debt/Equity (X) 0.6 0.7 0.6 0.6 ROAE (%) 6.2 5.7 6.0 6.9 Earnings Rev (%): Nil Nil Consensus EPS (HK$) 0.34 0.38 Other Broker Recs: B: 1 S: 1 H: 0 Income Statement (HK$ m) Balance Sheet (HK$ m)
FY Dec 2015A 2016A 2017F 2018F FY Dec 2015A 2016A 2017F 2018F Turnover 44,803 46,462 53,834 58,734 Net Fixed Assets 3,485 3,318 3,411 3,382 Cost of Goods Sold (39,565) (41,001) (47,374) (51,686) Invts in Assocs & JVs 761 539 572 608 Gross Profit 5,238 5,461 6,460 7,048 Other LT Assets 2,619 4,837 4,735 4,641 Other Opg (Exp)/Inc (4,155) (4,406) (5,431) (5,838) Cash & ST Invts 1,110 1,160 1,116 1,249 Operating Profit 1,083 1,055 1,029 1,210 Inventory 6,811 7,161 7,519 7,895 Other Non Opg (Exp)/Inc 23 47 0 0 Debtors 6,348 8,013 8,414 8,834 Associates & JV Inc 35 30 33 36 Other Current Assets 24 387 387 387 Net Interest (Exp)/Inc (202) (179) (209) (203) Total Assets 21,158 25,415 26,153 26,996 Dividend Income 0 0 0 0 Exceptional Gain/(Loss) (5) 144 0 0 ST Debt 2,455 2,357 2,157 1,957 Pre-tax Profit 934 1,097 853 1,043 Other Current Liab 4,702 8,074 8,570 9,042 Tax (286) (465) (256) (313) LT Debt 4,095 5,067 5,067 5,067 Minority Interest (78) (121) (66) (80) Other LT Liabilities 418 673 673 673 Preference Dividend 0 0 0 0 Shareholder’s Equity 9,047 8,732 9,109 9,599 Net Profit 570 511 531 650 Minority Interests 441 512 578 658 Net profit before Except. 575 367 531 650 Total Cap. & Liab. 21,158 25,415 26,153 26,996 EBITDA 1,739 1,894 1,671 1,869 Sales Gth (%) (3.6) 3.7 15.9 9.1 Non-Cash Wkg. Cap 8,481 7,487 7,750 8,074 EBITDA Gth (%) (8.5) 8.9 (11.8) 11.8 Net Cash/(Debt) (5,440) (6,264) (6,108) (5,775) Opg Profit Gth (%) (22.1) (2.6) (2.5) 17.6 Effective Tax Rate (%) 30.6 42.4 30.0 30.0 Cash Flow Statement (HK$ m) Segmental Breakdown (HK$ m) / Key Assumptions
FY Dec 2015A 2016A 2017F 2018F FY Dec 2015A 2016A 2017F 2018F Pre-Tax Profit 934 1,097 853 1,043 Revenues (HK$ m) Dep. & Amort. 600 764 611 625 Motor & Motor-related Business 34,064 32,594 34,362 36,387 Tax Paid (374) (127) (156) (256) Food & Consumer Products 10,709 9,951 10,898 12,064 Assoc. & JV Inc/(loss) (35) (30) (33) (36) Others 30 38 40 42 (Pft)/ Loss on disposal of FAs 0 0 0 0 LFA 0 3,879 8,534 10,241 Chg in Wkg.Cap. 1,625 1,328 (363) (381) Total 44,803 46,462 53,834 58,734 Other Operating CF 280 (798) 207 201 Segment operating profit (HK$ m) Net Operating CF 3,030 2,234 1,119 1,196 Motor & Motor-related Business 1,096 1,014 1,047 1,104 Capital Exp.(net) (588) (500) (600) (500) Food & Consumer Products 179 144 345 374 Other Invts.(net) (81) 0 0 0 Others 76 68 37 35 Invts in Assoc. & JV 0 0 0 0 LFA 0 106 256 338 Div from Assoc & JV 0 0 0 0 Total 1,351 1,332 1,684 1,850 Other Investing CF 59 (1,499) 10 10 Segment operating profit Margins Net Investing CF (610) (1,999) (590) (490) Motor & Motor-related Business 3.2 3.1 3.0 3.0 Div Paid (266) (204) (155) (159) Food & Consumer Products 1.7 1.4 3.2 3.1 Chg in Gross Debt (2,129) 2,200 (200) (200) Others 253.3 178.9 92.1 82.7 Capital Issues 0 0 0 0 LFA N/A 2.7 3.0 3.3 Other Financing CF (293) (2,049) (220) (214) Total 3.0 2.9 3.1 3.2 Net Financing CF (2,688) (53) (574) (573) Currency Adjustments (59) 0 0 0 Key Assumptions Chg in Cash (327) 181 (45) 133 Total vehicle sales (units) 113,875 115,583 122,288 130,410 Auto ASP (HK$'000/unit) 299.1 282.0 281.0 279.0 Source: Company, DBS Vickers

Industry Focus
China Auto Sector
Page 40
ZhongSheng Group (881 HK EQUITY, HK$10.84, BUY, Target Price 12-mth HK$ 12.50) Forecast & Valuation General Data
FY Dec (RMB m) 2015A 2016A 2017F 2018F At A Glance Issued Capital (m shrs) 2,147 Mkt. Cap (HK$m/US$m) 23,329 / 2,999
Major Shareholders Li Guoqiang & Huang Yi (%) 60.9 Jardine Strategic (%) 21.1
Free Float (%) 18.0 3m Avg. Daily Val. (US$m) 6.5
Turnover 59,143 71,599 80,266 87,700 EBITDA 2,754 4,775 5,356 5,849 Pre-tax Profit 716 2,878 3,793 4,343 Net Profit 461 1,860 2,277 2,607 Net Pft (Pre Ex) (core profit) 461 1,860 2,277 2,607 Net Profit Gth (Pre-ex) (%) (38.6) 303.6 22.4 14.5 EPS (RMB) 0.21 0.87 1.02 1.15 EPS (HK$) 0.24 0.98 1.16 1.30 Core EPS (HK$) 0.24 0.98 1.16 1.30 Core EPS (RMB) 0.21 0.87 1.02 1.15 EPS Gth (%) (39.0) 303.6 18.0 12.5 Core EPS Gth (%) (39.0) 303.6 18.0 12.5 Diluted EPS (HK$) 0.24 0.98 1.16 1.30 DPS (HK$) 0.05 0.30 0.23 0.26 BV Per Share (HK$) 5.94 6.44 7.76 8.69 PE (X) 44.7 11.1 9.4 8.4 Core PE (X) 44.7 11.1 9.4 8.4 P/Cash Flow (X) 4.4 4.6 6.3 5.5 P/Free CF (X) 6.7 6.6 8.2 6.5 EV/EBITDA (X) 12.8 7.1 6.1 5.3 Net Div Yield (%) 0.4 2.8 2.1 2.4 P/Book Value (X) 1.8 1.7 1.4 1.3 Net Debt/Equity (X) 1.1 0.9 0.6 0.4 ROAE (%) 4.1 15.8 16.6 16.0 Earnings Rev (%): Nil Nil Consensus EPS (RMB) 1.00 1.15 Other Broker Recs: B: 10 S: 1 H: 3 Income Statement (RMB m) Balance Sheet (RMB m)
FY Dec 2015A 2016A 2017F 2018F FY Dec 2015A 2016A 2017F 2018F Turnover 59,143 71,599 80,266 87,700 Net Fixed Assets 8,140 8,810 9,136 9,240 Cost of Goods Sold (54,473) (65,047) (72,806) (79,279) Invts in Assocs & JVs 44 48 53 58 Gross Profit 4,669 6,552 7,460 8,421 Other LT Assets 9,337 9,299 9,161 9,030 Other Opg (Exp)/Inc (3,763) (3,985) (4,371) (5,087) Cash & ST Invts 5,971 5,719 4,567 6,076 Operating Profit 906 2,567 3,089 3,334 Inventory 6,289 6,530 7,340 7,997 Other Non Opg (Exp)/Inc 1,036 1,294 1,551 1,782 Debtors 936 1,149 1,288 1,408 Associates & JV Inc 1 4 5 5 Other Current Assets 8,007 8,089 8,331 8,580 Net Interest (Exp)/Inc (1,228) (987) (851) (778) Total Assets 38,725 39,645 39,876 42,389 Dividend Income 0 0 0 0 Exceptional Gain/(Loss) 0 0 0 0 ST Debt 14,785 16,135 12,544 12,044 Pre-tax Profit 716 2,878 3,793 4,343 Other Current Liab 5,868 7,449 7,881 8,353 Tax (234) (837) (1,176) (1,346) LT Debt 4,476 1,893 1,893 1,893 Minority Interest (20) (182) (340) (390) Other LT Liabilities 980 1,069 1,069 1,069 Preference Dividend 0 0 0 0 Shareholder’s Equity 11,269 12,218 15,268 17,419 Net Profit 461 1,860 2,277 2,607 Minority Interests 1,347 881 1,221 1,610 Net profit before Except. 461 1,860 2,277 2,607 Total Cap. & Liab. 38,725 39,645 39,876 42,389 EBITDA 2,754 4,775 5,356 5,849 Sales Gth (%) 8.0 21.1 12.1 9.3 Non-Cash Wkg. Cap 9,365 8,320 9,078 9,632 EBITDA Gth (%) (8.5) 73.4 12.2 9.2 Net Cash/(Debt) (13,290) (12,309) (9,871) (7,861) Opg Profit Gth (%) (36.2) 183.4 20.3 7.9 Effective Tax Rate (%) 32.7 29.1 31.0 31.0 Cash Flow Statement (RMB m) Segmental Breakdown (RMB m) / Key Assumptions
FY Dec 2015A 2016A 2017F 2018F FY Dec 2015A 2016A 2017F 2018F Pre-Tax Profit 716 2,878 3,793 4,343 Revenues (RMB m) Dep. & Amort. 811 909 712 728 New car sales (after sales tax) 51,843 62,459 69,299 75,087 Tax Paid (246) (714) (1,134) (1,176) After-sales business 7,300 9,140 10,968 12,613 Assoc. & JV Inc/(loss) (1) (4) (5) (5) Total 59,143 71,599 80,266 87,700 (Pft)/ Loss on disposal of FAs 0 0 0 0 Gross Profit (RMB m) Chg in Wkg.Cap. 2,042 577 (801) (725) New car sales (after sales tax) 1,349 2,089 2,141 2,329 Other Operating CF 1,331 866 851 778 After-sales business 3,320 4,463 5,319 6,092 Net Operating CF 4,652 4,513 3,417 3,943 Total 4,669 6,552 7,460 8,421 Capital Exp.(net) (1,596) (1,400) (800) (600) Gross Profit Margins (%) Other Invts.(net) 0 0 0 0 New car sales (after sales tax) 2.6 3.3 3.1 3.1 Invts in Assoc. & JV (487) 0 0 0 After-sales business 45.5 48.8 48.5 48.3 Div from Assoc & JV 0 0 0 0 Total 7.9 9.2 9.3 9.6 Other Investing CF 393 (1,393) (58) (70) Key Assumptions Net Investing CF (1,690) (2,793) (858) (670) New car sales vol - Mid-high 147,248. 183,459. 198,136. 213,987.Div Paid (167) (90) (572) (455) New car sales vol - Luxury 96,433.0 117,293. 131,368. 141,878.Chg in Gross Debt (1,500) (800) (3,592) (500) Capital Issues 0 0 1,344 0 Other Financing CF (931) (1,158) (892) (808) Net Financing CF (2,598) (2,048) (3,712) (1,764) Currency Adjustments 9 22 0 0 Chg in Cash 373 (307) (1,153) 1,510 Source: Company, DBS Vickers

Industry Focus
China Auto Sector
Page 41
Appendix
Premium car volume sales ranking
Inventory day ranking
0 10,000 20,000 30,000 40,000 50,000 60,000 70,000 80,000
Zhon
gshe
ng
Chi
na Y
ongd
a
Chi
na
Zhen
gTon
g
Baox
in A
uto
Chi
na
Rund
ong
Chi
na H
arm
ony
Chi
na M
eido
ng
2015 2016
units
0
10
20
30
40
50
60
Chi
na
Rund
ong
Baox
in A
uto
Chi
na H
arm
ony
Chi
na
Zhen
gTon
g
Chi
na Y
ongd
a
Zhon
gshe
ng
Chi
na M
eido
ng
2015 2016days
New car sales' GP margin ranking
After-sales services' GP margin ranking
0
1
2
3
4
5
6
7
Chi
na M
eido
ng
Chi
na
Rund
ong
Zhon
gshe
ng
Baox
in A
uto
Chi
na Y
ongd
a
Chi
na
Zhen
gTon
g
Chi
na H
arm
ony
2015 2016(%)
0
10
20
30
40
50
60
Chi
na M
eido
ng
Zhon
gshe
ng
Baox
in A
uto
Chi
na
Zhen
gTon
g
Chi
na Y
ongd
a
Chi
na
Rund
ong
Chi
na H
arm
ony
2015 2016
(%)
Net gearing ratio ranking
Net profit ranking
(0.4)(0.2)0.0 0.2 0.4 0.6 0.8 1.0 1.2 1.4
Chi
na Y
ongd
a
Zhon
gshe
ng
Chi
na Z
heng
Tong
Chi
na R
undo
ng
Baox
in A
uto
Chi
na M
eido
ng
Chi
na H
arm
ony
2015 2016
(x)
(500)
0
500
1,000
1,500
2,000
Zhon
gshe
ng
Chi
na Y
ongd
a
Chi
na Z
heng
Tong
Baox
in A
uto
Chi
na R
undo
ng
Chi
na M
eido
ng
Chi
na H
arm
ony
2015 2016
Rmb m
Source: Companies
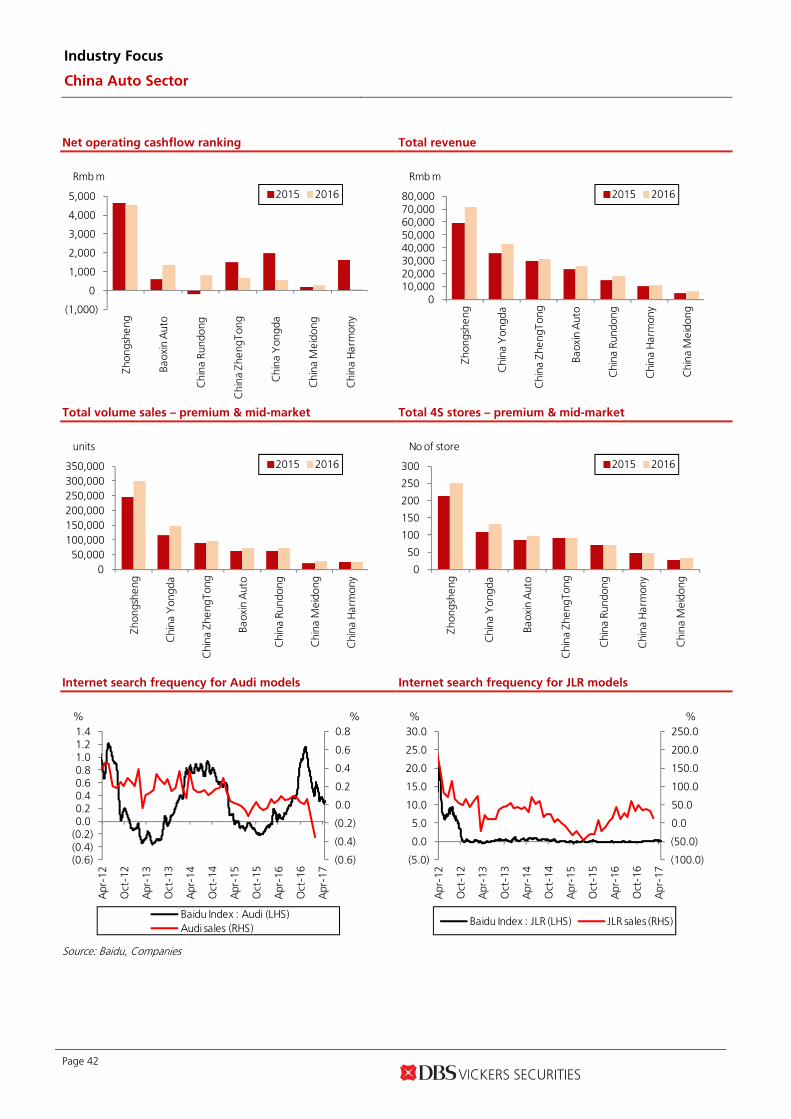
Industry Focus
China Auto Sector
Page 42
Net operating cashflow ranking
Total revenue
(1,000)
0
1,000
2,000
3,000
4,000
5,000
Zhon
gshe
ng
Baox
in A
uto
Chi
na R
undo
ng
Chi
na Z
heng
Tong
Chi
na Y
ongd
a
Chi
na M
eido
ng
Chi
na H
arm
ony
2015 2016
Rmb m
0 10,000 20,000 30,000 40,000 50,000 60,000 70,000 80,000
Zhon
gshe
ng
Chi
na Y
ongd
a
Chi
na Z
heng
Tong
Baox
in A
uto
Chi
na R
undo
ng
Chi
na H
arm
ony
Chi
na M
eido
ng
2015 2016
Rmb m
Total volume sales – premium & mid-market
Total 4S stores – premium & mid-market
0 50,000
100,000 150,000 200,000 250,000 300,000 350,000
Zhon
gshe
ng
Chi
na Y
ongd
a
Chi
na Z
heng
Tong
Baox
in A
uto
Chi
na R
undo
ng
Chi
na M
eido
ng
Chi
na H
arm
ony
2015 2016
units
0
50
100
150
200
250
300
Zhon
gshe
ng
Chi
na Y
ongd
a
Baox
in A
uto
Chi
na Z
heng
Tong
Chi
na R
undo
ng
Chi
na H
arm
ony
Chi
na M
eido
ng
2015 2016
No of store
Internet search frequency for Audi models
Internet search frequency for JLR models
(0.6)
(0.4)
(0.2)
0.0
0.2
0.4
0.6
0.8
(0.6)(0.4)(0.2)0.0 0.2 0.4 0.6 0.8 1.0 1.2 1.4
Apr
-12
Oct
-12
Apr
-13
Oct
-13
Apr
-14
Oct
-14
Apr
-15
Oct
-15
Apr
-16
Oct
-16
Apr
-17
Baidu Index : Audi (LHS)Audi sales (RHS)
% %
(100.0)
(50.0)
0.0
50.0
100.0
150.0
200.0
250.0
(5.0)
0.0
5.0
10.0
15.0
20.0
25.0
30.0
Apr
-12
Oct
-12
Apr
-13
Oct
-13
Apr
-14
Oct
-14
Apr
-15
Oct
-15
Apr
-16
Oct
-16
Apr
-17
Baidu Index : JLR (LHS) JLR sales (RHS)
% %
Source: Baidu, Companies

Industry Focus
China Auto Sector
Page 43
PE & PB charts
China Yongda (3669 HK) PE chart China Yongda (3669 HK) PB chart
0
4
8
12
16
20
24
Jul-
12
Au
g-1
3
Sep
-14
Oct
-15
No
v-1
6
Dec
-17
x
Avg: 11.2x
+1SD: 16x
-1SD: 6.3x
+2SD: 20.9x
-2SD: 1.5x0.0
0.5
1.0
1.5
2.0
2.5
3.0
3.5
Jul-
12
Au
g-1
3
Sep
-14
Oct
-15
No
v-1
6
Dec
-17
x
Avg: 1.7x
+1SD: 2.4x
-1SD: 1x
+2SD: 3x
-2SD: 0.4x
China ZhengTong (1728 HK) PE chart China ZhengTong (1728 HK) PB chart
Source: Thomson Reuters, DBS Vickers
0
5
10
15
20
25
30
35
40
Dec
-10
May
-12
Oct
-13
Mar
-15
Jul-
16
Dec
-17
x
Avg: 15.3x
+1SD: 23.1x
-1SD: 7.5x
0.0
0.5
1.0
1.5
2.0
2.5
3.0
3.5
Dec
-10
May
-12
Oct
-13
Mar
-15
Jul-
16
Dec
-17
x
Avg: 1.2x
+1SD: 2.1x
-1SD: 0.9x

Industry Focus
China Auto Sector
Page 44
PE & PB charts (continuous)
Dah Chong Hong (1828 HK) PE chart Dah Chong Hong (1828 HK) PB chart
0
5
10
15
20
25
Dec
-09
Jul-
11
Mar
-13
Oct
-14
May
-16
Dec
-17
x
+1SD: 15.7x
Avg: 12.8x
-1SD: 9.8x
0.0
0.5
1.0
1.5
2.0
2.5
3.0
Dec
-09
Jul-
11
Mar
-13
Oct
-14
May
-16
Dec
-17
x
+1SD: 1.8x
Avg: 1.3x
-1SD: 0.7x
ZhongSheng (881 HK) PE chart ZhongSheng (881 HK) PB chart
-5
0
5
10
15
20
25
30
35
40
Mar
-10
Oct
-10
Jun
-11
Jan
-12
Au
g-1
2
Mar
-13
Oct
-13
May
-14
Jan
-15
Au
g-1
5
Mar
-16
Oct
-16
May
-17
Dec
-17
x
Avg: 17.2x
+1SD: 25.9x
-1SD: 8.5x
+2SD: 34.6x
-2SD: -0.2x-1.0
0.0
1.0
2.0
3.0
4.0
5.0
6.0
Mar
-10
Oct
-10
Jun
-11
Jan
-12
Au
g-1
2
Mar
-13
Oct
-13
May
-14
Jan
-15
Au
g-1
5
Mar
-16
Oct
-16
May
-17
Dec
-17
x
Avg: 1.8x
+1SD: 2.8x
-1SD: 0.9x
+2SD: 3.7x
-2SD: 0x
Source: Thomson Reuters, DBS Vickers

Industry Focus
China Auto Sector
Page 45
DBSVHK recommendations are based an Absolute Total Return* Rating system, defined as follows:
STRONG BUY (>20% total return over the next 3 months, with identifiable share price catalysts within this time frame)
BUY (>15% total return over the next 12 months for small caps, >10% for large caps)
HOLD (-10% to +15% total return over the next 12 months for small caps, -10% to +10% for large caps)
FULLY VALUED (negative total return i.e. > -10% over the next 12 months)
SELL (negative total return of > -20% over the next 3 months, with identifiable catalysts within this time frame)
Share price appreciation + dividends Completed Date: 25 Apr 2017 17:23:54 (HKT) Dissemination Date: 25 Apr 2017 19:54:59 (HKT)
Sources for all charts and tables are DBS Vickers unless otherwise specified.
GENERAL DISCLOSURE/DISCLAIMER This report is prepared by DBS Vickers (Hong Kong) Limited (“DBSVHK”). This report is solely intended for the clients of DBS Bank Ltd., DBS Vickers Securities (Singapore) Pte Ltd. (“DBSVS”) and DBSVHK, its respective connected and associated corporations and affiliates only and no part of this document may be (i) copied, photocopied or duplicated in any form or by any means or (ii) redistributed without the prior written consent of DBSVHK. The research set out in this report is based on information obtained from sources believed to be reliable, but we (which collectively refers to DBS Bank Ltd., DBSVS and DBSVHK, its respective connected and associated corporations, affiliates and their respective directors, officers, employees and agents (collectively, the “DBS Group”)) have not conducted due diligence on any of the companies, verified any information or sources or taken into account any other factors which we may consider to be relevant or appropriate in preparing the research. Accordingly, we do not make any representation or warranty as to the accuracy, completeness or correctness of the research set out in this report. Opinions expressed are subject to change without notice. This research is prepared for general circulation. Any recommendation contained in this document does not have regard to the specific investment objectives, financial situation and the particular needs of any specific addressee. This document is for the information of addressees only and is not to be taken in substitution for the exercise of judgement by addressees, who should obtain separate independent legal or financial advice. The DBS Group accepts no liability whatsoever for any direct, indirect and/or consequential loss (including any claims for loss of profit) arising from any use of and/or reliance upon this document and/or further communication given in relation to this document. This document is not to be construed as an offer or a solicitation of an offer to buy or sell any securities. The DBS Group, along with its affiliates and/or persons associated with any of them may from time to time have interests in the securities mentioned in this document. The DBS Group, may have positions in, and may effect transactions in securities mentioned herein and may also perform or seek to perform broking, investment banking and other banking services for these companies. Any valuations, opinions, estimates, forecasts, ratings or risk assessments herein constitutes a judgment as of the date of this report, and there can be no assurance that future results or events will be consistent with any such valuations, opinions, estimates, forecasts, ratings or risk assessments. The information in this document is subject to change without notice, its accuracy is not guaranteed, it may be incomplete or condensed, it may not contain all material information concerning the company (or companies) referred to in this report and the DBS Group is under no obligation to update the information in this report. This publication has not been reviewed or authorized by any regulatory authority in Singapore, Hong Kong or elsewhere. There is no planned schedule or frequency for updating research publication relating to any issuer. The valuations, opinions, estimates, forecasts, ratings or risk assessments described in this report were based upon a number of estimates and assumptions and are inherently subject to significant uncertainties and contingencies. It can be expected that one or more of the estimates on which the valuations, opinions, estimates, forecasts, ratings or risk assessments were based will not materialize or will vary significantly from actual results. Therefore, the inclusion of the valuations, opinions, estimates, forecasts, ratings or risk assessments described herein IS NOT TO BE RELIED UPON as a representation and/or warranty by the DBS Group (and/or any persons associated with the aforesaid entities), that: (a) such valuations, opinions, estimates, forecasts, ratings or risk assessments or their underlying assumptions will be achieved, and (b) there is any assurance that future results or events will be consistent with any such valuations, opinions, estimates, forecasts, ratings or risk
assessments stated therein. Please contact the primary analyst for valuation methodologies and assumptions associated with the covered companies or price targets. Any assumptions made in this report that refers to commodities, are for the purposes of making forecasts for the company (or companies) mentioned herein. They are not to be construed as recommendations to trade in the physical commodity or in the futures contract relating to the commodity referred to in this report. DBSVUSA, a US-registered broker-dealer, does not have its own investment banking or research department, has not participated in any public offering of securities as a manager or co-manager or in any other investment banking transaction in the past twelve months and does not engage in market-making.

Industry Focus
China Auto Sector
Page 46
ANALYST CERTIFICATION
The research analyst(s) primarily responsible for the content of this research report, in part or in whole, certifies that the views about the
companies and their securities expressed in this report accurately reflect his/her personal views. The analyst(s) also certifies that no part of his/her
compensation was, is, or will be, directly or indirectly, related to specific recommendations or views expressed in the report. The research analyst (s)
primarily responsible for the content of this research report, in part or in whole, certifies that he or his associate1 does not serve as an officer of the
issuer or the new listing applicant (which includes in the case of a real estate investment trust, an officer of the management company of the real
estate investment trust; and in the case of any other entity, an officer or its equivalent counterparty of the entity who is responsible for the
management of the issuer or the new listing applicant) and the research analyst(s) primarily responsible for the content of this research report or
his associate does not have financial interests2 in relation to an issuer or a new listing applicant that the analyst reviews. DBS Group has
procedures in place to eliminate, avoid and manage any potential conflicts of interests that may arise in connection with the production of
research reports. The research analyst(s) responsible for this report operates as part of a separate and independent team to the investment
banking function of the DBS Group and procedures are in place to ensure that confidential information held by either the research or investment
banking function is handled appropriately. There is no direct link of DBS Group's compensation to any specific investment banking function of the
DBS Group. COMPANY-SPECIFIC / REGULATORY DISCLOSURES 1. DBSVHK and its subsidiaries do not have a proprietary position in the securities recommended/mentioned in this report as of 24 Apr
2017.
2. Neither DBS Bank Ltd, DBS HK nor DBSV HK market makes in equity securities of the issuer(s) or company(ies) mentioned in this Research Report.
3. Compensation for investment banking services: DBS Bank Ltd., DBSVS, DBSVHK, their subsidiaries and/or other affiliates of DBSVUSA have received compensation, within the past 12 months for investment banking services from Dah Chong Hong Holdings Limited (1828 HK) as of 31 Mar 2017. DBSVUSA does not have its own investment banking or research department, nor has it participated in any public offering of securities as a manager or co-manager or in any other investment banking transaction in the past twelve months. Any US persons wishing to obtain further information, including any clarification on disclosures in this disclaimer, or to effect a transaction in any security discussed in this document should contact DBSVUSA exclusively.
4. Disclosure of previous investment recommendation produced: DBS Bank Ltd, DBSVS, DBSVHK, their subsidiaries and/or other affiliates of DBSVUSA may have published other investment recommendations in respect of the same securities / instruments recommended in this research report during the preceding 12 months. Please contact the primary analyst listed in the first page of this report to view previous investment recommendations published by DBS Bank Ltd, DBSVHK, their subsidiaries and/or other affiliates of DBSVUSA in the preceding 12 months.
1 An associate is defined as (i) the spouse, or any minor child (natural or adopted) or minor step-child, of the analyst; (ii) the
trustee of a trust of which the analyst, his spouse, minor child (natural or adopted) or minor step-child, is a beneficiary or discretionary object; or (iii) another person accustomed or obliged to act in accordance with the directions or instructions of the analyst.
2 Financial interest is defined as interests that are commonly known financial interest, such as investment in the securities in respect of an issuer or a new listing applicant, or financial accommodation arrangement between the issuer or the new listing applicant and the firm or analysis. This term does not include commercial lending conducted at arm's length, or investments in any collective investment scheme other than an issuer or new listing applicant notwithstanding the fact that the scheme has investments in securities in respect of an issuer or a new listing applicant.

Industry Focus
China Auto Sector
Page 47
RESTRICTIONS ON DISTRIBUTION
General This report is not directed to, or intended for distribution to or use by, any person or entity who is a citizen or resident of or located in any locality, state, country or other jurisdiction where such distribution, publication, availability or use would be contrary to law or regulation.
Australia This report is being distributed in Australia by DBS Bank Ltd. (“DBS”) or DBS Vickers Securities (Singapore) Pte Ltd (“DBSVS”) or DBS Vickers (Hong Kong) Limited (“DBSVHK”), which are exempted from the requirement to hold an Australian Financial Services Licence under the Corporation Act 2001 (“CA”) in respect of financial services provided to the recipients. Both DBS and DBSVS are regulated by the Monetary Authority of Singapore under the laws of Singapore, and DBSVHK is regulated by the Securities and Futures Commission of Hong Kong under the laws of Hong Kong, which differ from Australian laws. Distribution of this report is intended only for “wholesale investors” within the meaning of the CA.
Hong Kong This report is being distributed in Hong Kong by DBSVHK which is licensed and regulated by the Hong Kong Securities and Futures Commission.
Indonesia This report is being distributed in Indonesia by PT DBS Vickers Sekuritas Indonesia.
Malaysia This report is distributed in Malaysia by AllianceDBS Research Sdn Bhd ("ADBSR"). Recipients of this report, received from ADBSR are to contact the undersigned at 603-2604 3333 in respect of any matters arising from or in connection with this report. In addition to the General Disclosure/Disclaimer found at the preceding page, recipients of this report are advised that ADBSR (the preparer of this report), its holding company Alliance Investment Bank Berhad, their respective connected and associated corporations, affiliates, their directors, officers, employees, agents and parties related or associated with any of them may have positions in, and may effect transactions in the securities mentioned herein and may also perform or seek to perform broking, investment banking/corporate advisory and other services for the subject companies. They may also have received compensation and/or seek to obtain compensation for broking, investment banking/corporate advisory and other services from the subject companies.
Wong Ming Tek, Executive Director, ADBSR
Singapore This report is distributed in Singapore by DBS Bank Ltd (Company Regn. No. 196800306E) or DBSVS (Company Regn No. 198600294G), both of which are Exempt Financial Advisers as defined in the Financial Advisers Act and regulated by the Monetary Authority of Singapore. DBS Bank Ltd and/or DBSVS, may distribute reports produced by its respective foreign entities, affiliates or other foreign research houses pursuant to an arrangement under Regulation 32C of the Financial Advisers Regulations. Where the report is distributed in Singapore to a person who is not an Accredited Investor, Expert Investor or an Institutional Investor, DBS Bank Ltd accepts legal responsibility for the contents of the report to such persons only to the extent required by law. Singapore recipients should contact DBS Bank Ltd at 6327 2288 for matters arising from, or in connection with the report.
Thailand This report is being distributed in Thailand by DBS Vickers Securities (Thailand) Co Ltd. Research reports distributed are only intended for institutional clients only and no other person may act upon it.
United Kingdom
This report is produced by DBSVHK which is regulated by the Securities and Futures Commission of Hong Kong. This report is disseminated in the United Kingdom by DBS Vickers Securities (UK) Ltd (“DBSVUK”). DBSVUK is authorised and regulated by the Financial Conduct Authority in the United Kingdom. In respect of the United Kingdom, this report is solely intended for the clients of DBSVUK, its respective connected and associated corporations and affiliates only and no part of this document may be (i) copied, photocopied or duplicated in any form or by any means or (ii) redistributed without the prior written consent of DBSVUK. This communication is directed at persons having professional experience in matters relating to investments. Any investment activity following from this communication will only be engaged in with such persons. Persons who do not have professional experience in matters relating to investments should not rely on this communication.
Dubai
This research report is being distributed in The Dubai International Financial Centre (“DIFC”) by DBS Bank Ltd., (DIFC Branch) having its office at PO Box 506538, 3rd Floor, Building 3, East Wing, Gate Precinct, Dubai International Financial Centre (DIFC), Dubai, United Arab Emirates. DBS Bank Ltd., (DIFC Branch) is regulated by The Dubai Financial Services Authority. This research report is intended only for professional clients (as defined in the DFSA rulebook) and no other person may act upon it.
United States This report was prepared by DBSVHK. DBSVUSA did not participate in its preparation. The research analyst(s) named on this report are not registered as research analysts with FINRA and are not associated persons of DBSVUSA. The research analyst(s) are not subject to FINRA Rule 2241 restrictions on analyst compensation, communications with a subject company, public appearances and trading securities held by a research analyst. This report is being distributed in the United States by DBSVUSA, which accepts responsibility for its contents. This report may only be distributed to Major U.S. Institutional Investors (as defined in SEC Rule 15a-6) and to such other institutional investors and qualified persons as DBSVUSA may authorize. Any U.S. person receiving this report who wishes to effect transactions in any securities referred to herein should contact DBSVUSA directly and not its affiliate.
Other jurisdictions
In any other jurisdictions, except if otherwise restricted by laws or regulations, this report is intended only for qualified, professional, institutional or sophisticated investors as defined in the laws and regulations of such jurisdictions.
DBS Vickers (Hong Kong) Limited
18th Floor Man Yee building, 68 Des Voeux Road Central, Central, Hong Kong
Tel: (852) 2820-4888, Fax: (852) 2868-1523
Company Regn. No. 31758
Top Related