


Languages
Pages
Legal

University of San Diego University of San Diego
Digital USD Digital USD
Center for Health Law Policy and Bioethics Law School Centers
2020
Child Maltreatment Reporting Statistics During the Covid-19 Child Maltreatment Reporting Statistics During the Covid-19
Pandemic: A Cursory Analysis Pandemic: A Cursory Analysis
Alison L. Hansen
Follow this and additional works at: https://digital.sandiego.edu/law_chlb_research_scholarship
Part of the Health Law and Policy Commons, and the Juvenile Law Commons
Digital USD Citation Digital USD Citation Hansen, Alison L., "Child Maltreatment Reporting Statistics During the Covid-19 Pandemic: A Cursory Analysis" (2020). Center for Health Law Policy and Bioethics. 80. https://digital.sandiego.edu/law_chlb_research_scholarship/80
This Article is brought to you for free and open access by the Law School Centers at Digital USD. It has been accepted for inclusion in Center for Health Law Policy and Bioethics by an authorized administrator of Digital USD. For more information, please contact [email protected].

Child Maltreatment Reporting Statistics During the COVID-19 Pandemic 1
Child Maltreatment Reporting Statistics During the Covid-19 Pandemic: A Cursory
Analysis
Alison L. Hansen
University of San Diego School of Law
2
TABLE OF CONTENTS
ABSTRACT .............................................................................................................. 3
INTRODUCTION ..................................................................................................... 4
METHODS ................................................................................................................ 6
ANALYSIS AND DISCUSSION .............................................................................. 8
REFERENCES ........................................................................................................ 12
TABLES .................................................................................................................. 13

3
ABSTRACT
This goal of this research is to provide a cursory analysis of publicly available child
maltreatment data collected during the COVID-19 pandemic. The number of total allegations of
child maltreatment between the months of March and June—a span of time representative of the
COVID-19 pandemic thus far—were analyzed in five different states in the years 2017, 2018,
2019, and 2020. An analysis of total numbers of allegations and the percentage change in
allegations per year revealed a disproportionate decline in child maltreatment reports during the
COVID-19 pandemic. This data corroborates nationwide reports of decreases in child
maltreatment allegations in the immediate aftermath of stay-at-home orders and illustrates the
sustained impact that the COVID-19 pandemic has had on child maltreatment reporting.
4
INTRODUCTION
The Covid-19 pandemic has posed many unique issues relating to the education and
welfare of minor children. While staying home is key to preventing the spread of COVID-19,
children face an entirely new set of challenges, the extent of which may not emerge until in-
person instruction resumes and social distancing measures relax. Factors that contribute to
domestic violence, such as economic stress, social isolation, instability, and increased familial
exposure (Usher et al. 2020) have become characteristic of American life in recent months.
Additionally, “social isolation exacerbates personal and collective vulnerabilities, while limiting
accessible and familiar support options” like teachers, counselors, and other trusted adults.
(Usher et al. 2020).
News media from nearly every state reported a sharp decline in calls made to child
protection agencies immediately following stay-at-home orders. Some states, such as Wisconsin,
Washington, South Carolina, New Hampshire, and Missouri, reported a 50% or greater decrease
in reports of alleged child maltreatment. Experts from across the country believe a decrease in
reports is likely a byproduct of social isolation, rather than an authentic decline in the incidence
child maltreatment (Campbell 2020). Because educators account for 1 in 5 reports of suspected
child maltreatment nationwide (Fitzpatrick et al. 2020), virtual learning poses considerable
challenges to detecting abuse. Signs of physical abuse that would be noticed in the classroom
might be missed in a virtual learning environment. Some researchers suggest that despite fewer
reports, child maltreatment is likely on the rise. Statistically, child maltreatment cases increase
following natural disasters and in times of economic recession (Griffith 2020). The COVID-19
pandemic mimics the stress of disaster conditions in terms of both unemployment and
environmental strain.
5
Of the four categories of child maltreatment—neglect, physical abuse, emotional abuse,
and sexual abuse—neglect occurs most commonly. Allegations of neglect disproportionately
affect low income families, as “parental inability to feed, clothe, or house a child is often
perceived as child maltreatment and can lead to government involvement [...]” (Dale 2014). In
conjunction with economic insecurity, stay-at-home orders have created childcare challenges for
working parents who can no longer send their children to school or to the home of a relative.
Over the course of the COVID-19 pandemic, parents will likely be challenged to meet increasing
demands with fewer resources. A report in the Journal of Family Violence details how a
psychological phenomenon called parental burnout may contribute to an increase in cases of
neglect and physical abuse (Griffith 2020). The phenomenon, defined as “a prolonged response
to chronic and overwhelming parental stress,” increases the likelihood that a parent will engage
in neglectful or abusive behavior toward their child (Griffith 2020).
Though media coverage on the sharp decline in total reports of child maltreatment during
early quarantine is abundant, ongoing data across reporting agencies has yet to be analyzed.
While many states release yearly reports of child maltreatment data, only five states release this
data on a monthly basis. Additionally, states vary with respect to the types of data points that
they collect and in the ways in which they categorize different forms of maltreatment. This
creates a significant barrier when comparing data between jurisdictions. The U.S. Department of
Health and Human Services, Children’s Bureau, releases an annual Child Maltreatment Report
collected from the states by the National Child Abuse and Neglect Data Systems (NCANDS).
The most current version of the national Child Maltreatment Report is from 2018. Due the
unavailability of accessible and comparable nationwide data, a comprehensive survey of reported
incidents of child maltreatment during the COVID-19 pandemic is not feasible at this time.

6
However, this report will provide a cursory analysis of the noted decrease in child maltreatment
allegations throughout the United States using available data from Arizona, Florida, Indiana,
Nevada, and New Jersey.
METHODS
Data collected in this study was taken from five U.S. states that publicly report child
maltreatment data on a monthly basis. The total number of child maltreatment allegations was
gathered for the months of March, April, May, and June, in the years 2017, 2018, 2019, and
2020. For the purposes of this study, March 2020 marks the beginning of the COVID-19
pandemic and stay-at-home orders in the United States. The most current available data for all
five states in the 2020 calendar year extends into June. By collecting data from the same seasonal
period (March-June) over the course of three years, this study aims to quantify the noted
decrease in reports during the COVID-19 pandemic in comparison to yearly decreases in reports
since 2017.
State Selection Criteria
The following states were selected for this study: Arizona, Florida, Indiana, Nevada, and
New Jersey. Each state was required to maintain a record of total monthly reports of child
maltreatment from March 2020 to June 2020 and a record of the same reports from the years
2017, 2018, and 2019. Some states included in this study have drastically lower numbers of child
maltreatment allegations than others; this study does not seek to compare the total number of
child maltreatment allegations between the states presented, but rather variations in the number
of allegations within each state. Additionally, this study does not examine the number of
substantiated cases of maltreatment, because this data was not available for the year 2020 in all
of the selected states. The method of data collection used by each state varies and is as follows:

7
Arizona.
The Arizona Department of Child Safety maintains a database of various department-
wide performance measures (Arizona 2020). Total child maltreatment allegations for each month
are contained within a monthly Operational Outcomes Report (Arizona 2020). The number of
alleged child maltreatment reports are categorized by report type, including neglect, physical
abuse, sexual abuse, and emotional abuse (Arizona 2020). For the purpose of this research all
types are included.
Florida.
The Florida Department of Children and Families maintains an interactive database of
child maltreatment allegations gathered by the Florida Safe Families Network (Florida 2020).
The database contains all allegations of child maltreatment from reports made and investigated
during the calendar month and includes both substantiated and unsubstantiated reports (Florida
2020). Any allegations of child maltreatment that are not investigated in a given calendar month
are included in the results for the following calendar month (Florida 2020).
Indiana.
The Indiana Department of Child Services maintains statewide data of child maltreatment
allegations collected through the Indiana Child Abuse and Neglect Hotline (Indiana 2020).
Hotline data includes calls, faxes, emails, and mail-in correspondence (Indiana 2020). According
to the Indiana Department of Child Services, “Some calls received at the hotline turn into more
than one report per call” (Indiana 2020).
Nevada.
The Nevada Division of Child and Family Services maintains statewide data of referrals
made to Child Protective Services (CPS) from outside agencies (Nevada 2020). This data is
8
collected on the 10th of every calendar month and includes the total number of child
maltreatment allegations referred to CPS (Nevada 2020).
New Jersey.
The New Jersey Department of Children and Families issues a monthly Commissioner’s
Report containing the total number of child maltreatment allegations collected from a statewide
hotline (Department of Children 2020). This data includes Child Protective Services reports,
Child Welfare Services referrals, and human trafficking referrals (Department of Children 2020).
Each of these categories of reports and referrals is included in this study.
ANALYSIS AND DISCUSSION
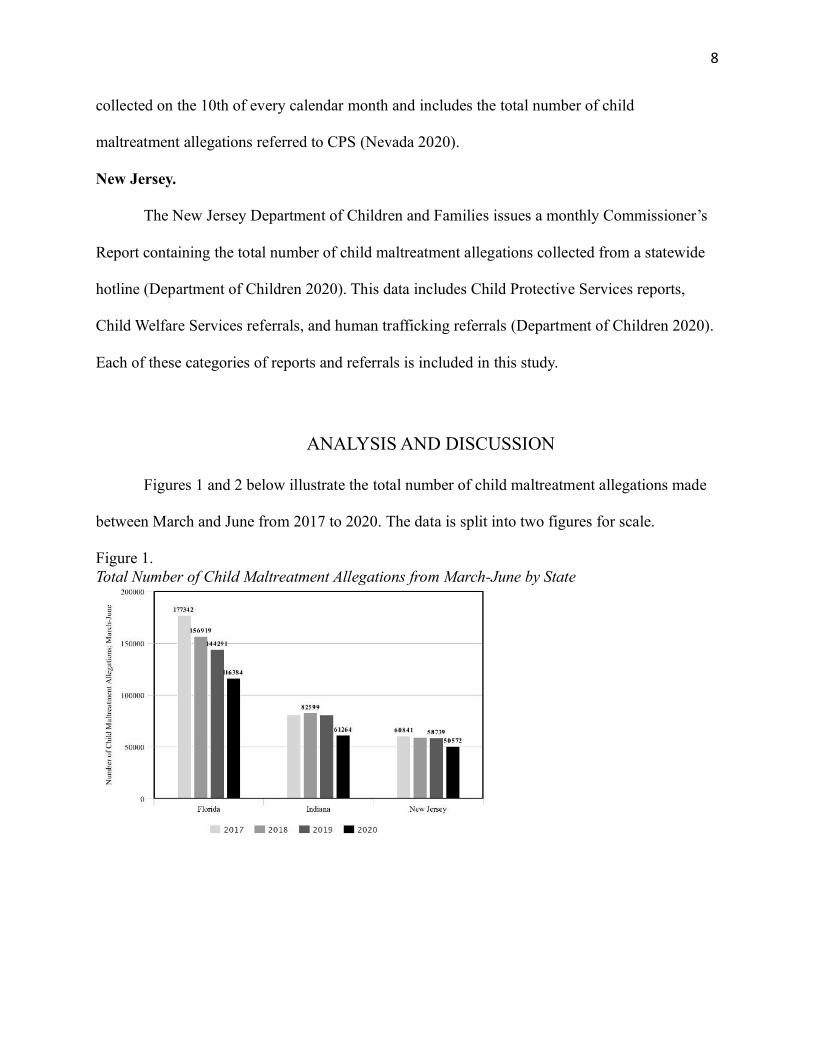
Figures 1 and 2 below illustrate the total number of child maltreatment allegations made
between March and June from 2017 to 2020. The data is split into two figures for scale.
Figure 1.
Total Number of Child Maltreatment Allegations from March-June by State

9
Figure 2.
Total Number of Child Maltreatment Allegations from March-June by State
In all five states, the total number of child maltreatment allegations in the period between
March and June was lowest in 2020. Florida, New Jersey, and Arizona experienced a decline in
the number of reported child maltreatment allegations each year from 2017 to 2020. While the
decline between 2019 and 2020 may be explained by the COVID-19 pandemic, the general
downward trend in the number of child maltreatment allegations is likely influenced by a number
of different factors. The consistent decrease in the number of reports could be explained by an
actual decrease in child maltreatment within these states. Indiana and Nevada had a relatively
consistent number of child maltreatment allegations between 2017 and 2019 but experienced a
significant decrease in allegations only in 2020. Because this data takes into account a period of
time representative of the COVID-19 pandemic, these results may very well be attributable to
unique social, economic, and environmental factors associated with the pandemic.

10
Table 1.
Yearly Percentage Change in Reports of Alleged Child Maltreatment from March-June
Time Period Percent Change Per Year (%)
Arizona Florida Indiana Nevada New Jersey
2017-2018 -1.61 -11.5 +2.29 +3.34 -2.17
2018-2019 -2.86 -8.05 -2.00 -2.71 -1.31
2019-2020 -15.9 -19.3 -24.3 -26.6 -13.9
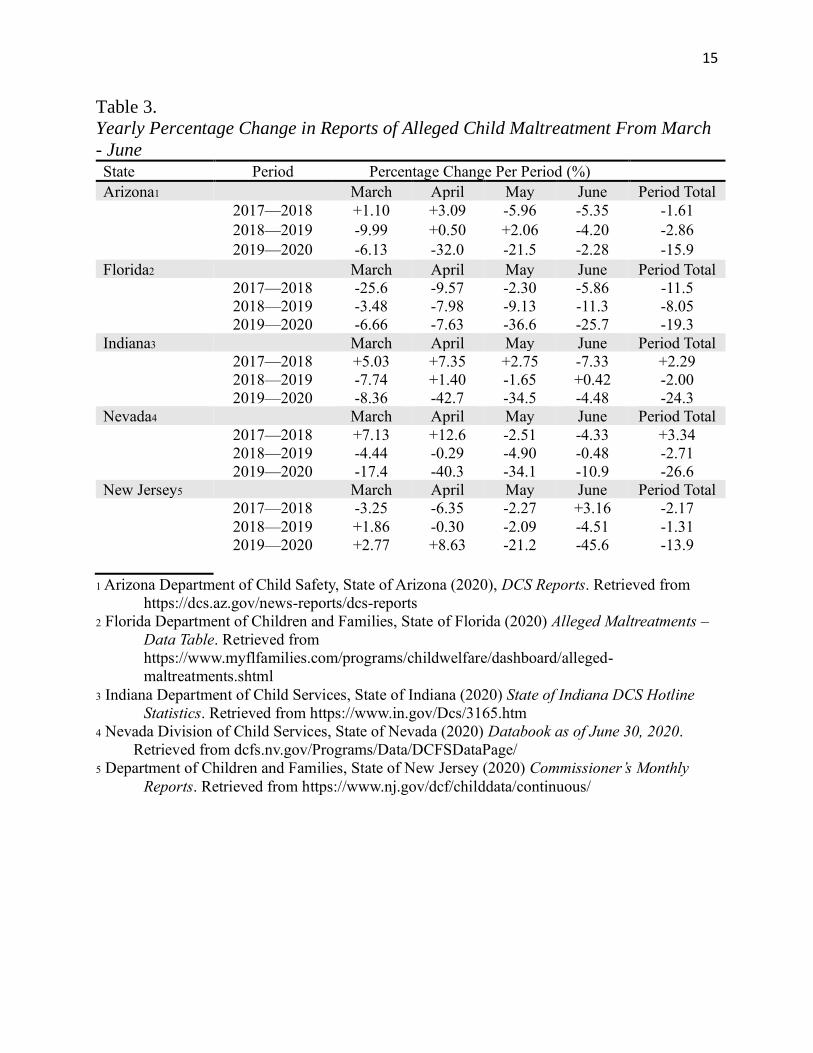
Indiana and Nevada experienced the greatest percentage change in reports of alleged
child maltreatment. Nevada experienced a 26.6% decrease in reports between 2019 and 2020. In
the previous two years, the state experienced a maximum of 3.34% change in the number of
reports of alleged child maltreatment. Similarly, Indiana experienced a 24.3% decrease in reports
of alleged child maltreatment in the same time period. In the two years prior, Indiana
experienced a maximum of 2.29% change in the number of alleged reports of child maltreatment.
This dramatic difference in percentage change is likely due to the impact of COVID-19.
Each state experienced the greatest percentage change in the period between 2019 and
2020. While this data only takes into account the period of time between 2017 and 2020, a
consistent dramatic decrease in the number of reports across these five states is indicative of a
greater national trend. It is important to note that the five states included in this study are
representative of many different geographical regions. As data continues to emerge from both the
states included in this study and others in the future, a more comprehensive study of the impact
that COVID-19 has on the total number of reports of child maltreatment will be feasible.
Additionally, data reported in the future about the number of verified cases of child maltreatment
will lend itself to an important study of whether or not decreased reporting during the COVID-19
pandemic is reflective of actual cases of child maltreatment. As stay-at-home orders are lifted

11
and children return to school in the coming months, a sustained investigation of data from these
sources may provide some answers.
12
REFERENCES
Arizona Department of Child Safety, State of Arizona (2020), DCS Reports. Retrieved from
https://dcs.az.gov/news-reports/dcs-reports
Campbell, A. M. (2020). An increasing risk of family violence during the Covid-19 pandemic:
Strengthening community collaborations to save lives. Forensic Science International:
Reports, 2, 100089. doi:10.1016/j.fsir.2020.100089
Dale, M.K., (2014), Addressing the Underlying Issue of Poverty in Child-Neglect Cases.
American Bar Association. Retrieved from
https://www.americanbar.org/groups/litigation/committees/childrens-
rights/articles/2014/addressing-underlying-issue-poverty-child-neglect-cases/
Department of Children and Families, State of New Jersey (2020) Commissioner’s Monthly
Reports. Retrieved from https://www.nj.gov/dcf/childdata/continuous/
Fitzpatrick, M., Benson, C., and Bondurant, S.R. (2020), Beyone Reading, Writing and
Arithmetic: The Role of Teacher and Schools in Reporting Child Maltreatment. NBER
Working Paper No. 27033. doi:10.3386/w27033
Florida Department of Children and Families, State of Florida (2020) Alleged Maltreatments –
Data Table. Retrieved from
https://www.myflfamilies.com/programs/childwelfare/dashboard/alleged-
maltreatments.shtml
Griffith, A.K. Parental Burnout and Child Maltreatment During the COVID-19 Pandemic. J Fam
Viol (2020). doi.org:10.1007/s10896-020-00172-2
Indiana Department of Child Services, State of Indiana (2020) State of Indiana DCS Hotline
Statistics. Retrieved from https://www.in.gov/Dcs/3165.htm
Nevada Division of Child Services, State of Nevada (2020) Databook as of June 30, 2020.
Retrieved from dcfs.nv.gov/Programs/Data/DCFSDataPage/
Usher, K., Bhullar, N., Durkin, J., Gyamfi, N. and Jackson, D. (2020), Family violence and
COVID‐19: Increased vulnerability and reduced options for support. Int J Mental Health
Nurs, 29: 549-552. doi:10.1111/inm.12735

13
TABLES
Table 2.
Total Reports of Alleged Child Maltreatment Made From March - June in 2017,
2018, 2019, and 2020 by State.
State Year Total Reports Per Month March-June
Total
Arizona1
March April May June 2017 4,197 4,271 4,275 3,438 16,181 2018 4,243 4,403 4,020 3,254 15,920 2019 3,819 4,425 4,103 3,117 15,464 2020 3,585 3,011 3,222 3,188
13,006
Florida2
March April May June 2017 50,606 41,870 42,038 42,828 177,342 2018 37,665 37,862 41,073 40,319 156,919 2019 36,355 34,841 37,321 35,774 144,291 2020 33,932 32,183 23,678 26,591
116,384
Indiana3
March April May June 2017 20,301 20,574 22,181 17,696 80,752 2018 21,322 22,087 22,792 16,398 82,599 2019 19,671 22,396 22,417 16,467 80,951 2020 18,026 12,834 14,674 15,730
61,264
Nevada4
March April May June 2017 3,367 3,031 3,580 2,612 12,590 2018 3,607 3,414 3,490 2,499 13,010 2019 3,447 3,404 3,319 2,487 12,657 2020 2,849 2,034 2,188 2,217
9,288
New Jersey5
March April May June 2017 15,375 14,478 16,228 14,760 60,841 2018 14,876 13,558 15,859 15,227 59,520 2019 15,153 13,518 15,528 14,540 58,739 2020 15,573 14,684 12,398 7,917 50,572
1 Arizona Department of Child Safety, State of Arizona (2020), DCS Reports. Retrieved from
https://dcs.az.gov/news-reports/dcs-reports
2 Florida Department of Children and Families, State of Florida (2020) Alleged Maltreatments –
Data Table. Retrieved from
https://www.myflfamilies.com/programs/childwelfare/dashboard/alleged-
maltreatments.shtml
3 Indiana Department of Child Services, State of Indiana (2020) State of Indiana DCS Hotline
Statistics. Retrieved from https://www.in.gov/Dcs/3165.htm
14
4 Nevada Division of Child Services, State of Nevada (2020) Databook as of June 30, 2020.
Retrieved from dcfs.nv.gov/Programs/Data/DCFSDataPage/
5 Department of Children and Families, State of New Jersey (2020) Commissioner’s Monthly
Reports. Retrieved from https://www.nj.gov/dcf/childdata/continuous/
15
Table 3.
Yearly Percentage Change in Reports of Alleged Child Maltreatment From March
- June
State Period Percentage Change Per Period (%)
Arizona1
March April May June Period Total
2017—2018 +1.10 +3.09 -5.96 -5.35 -1.61
2018—2019 -9.99 +0.50 +2.06 -4.20 -2.86
2019—2020 -6.13 -32.0 -21.5 -2.28 -15.9
Florida2
March April May June Period Total
2017—2018 -25.6 -9.57 -2.30 -5.86 -11.5
2018—2019 -3.48 -7.98 -9.13 -11.3 -8.05
2019—2020 -6.66 -7.63 -36.6 -25.7 -19.3
Indiana3
March April May June Period Total
2017—2018 +5.03 +7.35 +2.75 -7.33 +2.29
2018—2019 -7.74 +1.40 -1.65 +0.42 -2.00
2019—2020 -8.36 -42.7 -34.5 -4.48 -24.3
Nevada4
March April May June Period Total
2017—2018 +7.13 +12.6 -2.51 -4.33 +3.34
2018—2019 -4.44 -0.29 -4.90 -0.48 -2.71
2019—2020 -17.4 -40.3 -34.1 -10.9 -26.6
New Jersey5
March April May June Period Total
2017—2018 -3.25 -6.35 -2.27 +3.16 -2.17
2018—2019 +1.86 -0.30 -2.09 -4.51 -1.31
2019—2020 +2.77 +8.63 -21.2 -45.6 -13.9
1 Arizona Department of Child Safety, State of Arizona (2020), DCS Reports. Retrieved from
https://dcs.az.gov/news-reports/dcs-reports
2 Florida Department of Children and Families, State of Florida (2020) Alleged Maltreatments –
Data Table. Retrieved from
https://www.myflfamilies.com/programs/childwelfare/dashboard/alleged-
maltreatments.shtml
3 Indiana Department of Child Services, State of Indiana (2020) State of Indiana DCS Hotline
Statistics. Retrieved from https://www.in.gov/Dcs/3165.htm
4 Nevada Division of Child Services, State of Nevada (2020) Databook as of June 30, 2020.
Retrieved from dcfs.nv.gov/Programs/Data/DCFSDataPage/
5 Department of Children and Families, State of New Jersey (2020) Commissioner’s Monthly
Reports. Retrieved from https://www.nj.gov/dcf/childdata/continuous/
Top Related