


Languages
Pages
Legal

ResearchOnline@JCU
This file is part of the following work:
Bobeszko, Teressa (2017) Characterisation of carbonic anhydrase in
the symbiotic dinoflagellate Symbiodinium. PhD thesis, James Cook
University.
Access to this file is available from:
https://doi.org/10.4225/28/5aceb0b4420a7
Copyright © 2017 Teressa Bobeszko.
The author has certified to JCU that they have made a reasonable effort to gain permission and acknowledge the owner of any third party copyright material included in this document. If you
believe that this is not the case, please email [email protected]

Characterisation of carbonic anhydrase in the
symbiotic dinoflagellate Symbiodinium
Thesis submitted by
Teressa Bobeszko BSc (Hons)
for the degree of Doctor of Philosophy in Biochemistry
within the Discipline of Molecular and Cellular Biology and the
ARC Centre of Excellence for Coral Reef Studies
James Cook University
Townsville Queensland Australia

Statement of Access
I, the undersigned, the author of this thesis, understand that James Cook University
will make it available for use within the University Library and via the Australian
Digital Thesis Network for use elsewhere.
I understand that as an unpublished work this thesis has significant protection under
the Copyright Act and I do not wish to put any further restrictions upon access to this
thesis.
(Signature) (Date)

Statement of Sources Declaration
I declare that this thesis is my own work and has not been submitted in any form for
another degree or diploma at my university or other institution of tertiary education.
Information derived from the published or unpublished work of others has been
acknowledged in the text and a full list of references is given.
(Signature) (Date)

Electronic copy declaration
I, the undersigned, the author of this work, declare that the electronic copy of this
thesis provided to the James Cook University library, is an accurate copy of the print
thesis submitted, within the limits of the technology available.
(Signature) (Date)
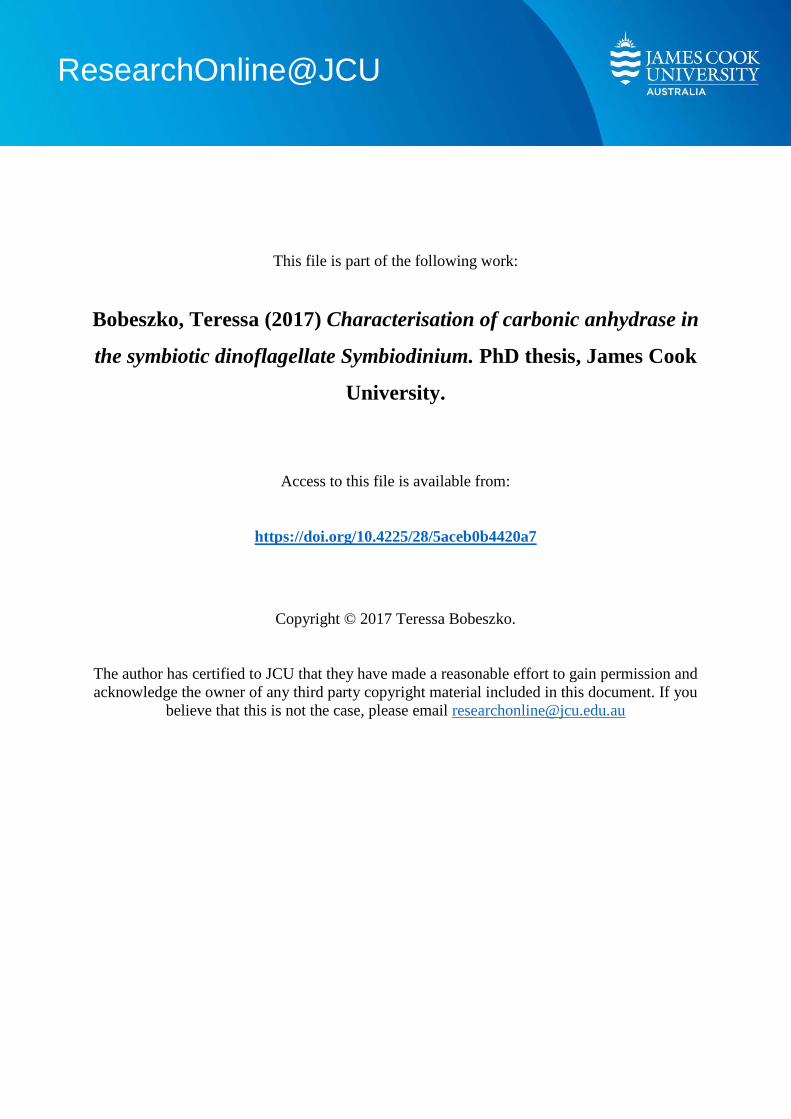
Statement on the contribution of others
Some of the chapters of this thesis are also manuscripts that have been submitted for
publication in peer-reviewed journals or are in preparation for submission. Several
researchers and staff have made contributions to these manuscripts and I am sincerely
thankful to the following people for providing resources, intellectual support, editorial
assistance and scientific assistance to me during my candidature:
Nature of Assistance Contribution Names, Titles and
Affiliations of Co-
Contributors
Intellectual support Proposal writing
Editorial assistance
Provision of EST data
Review of experimental designs
Technical advice and support
A/Prof William Leggat
Prof David Yellowlees
Prof James Burnell
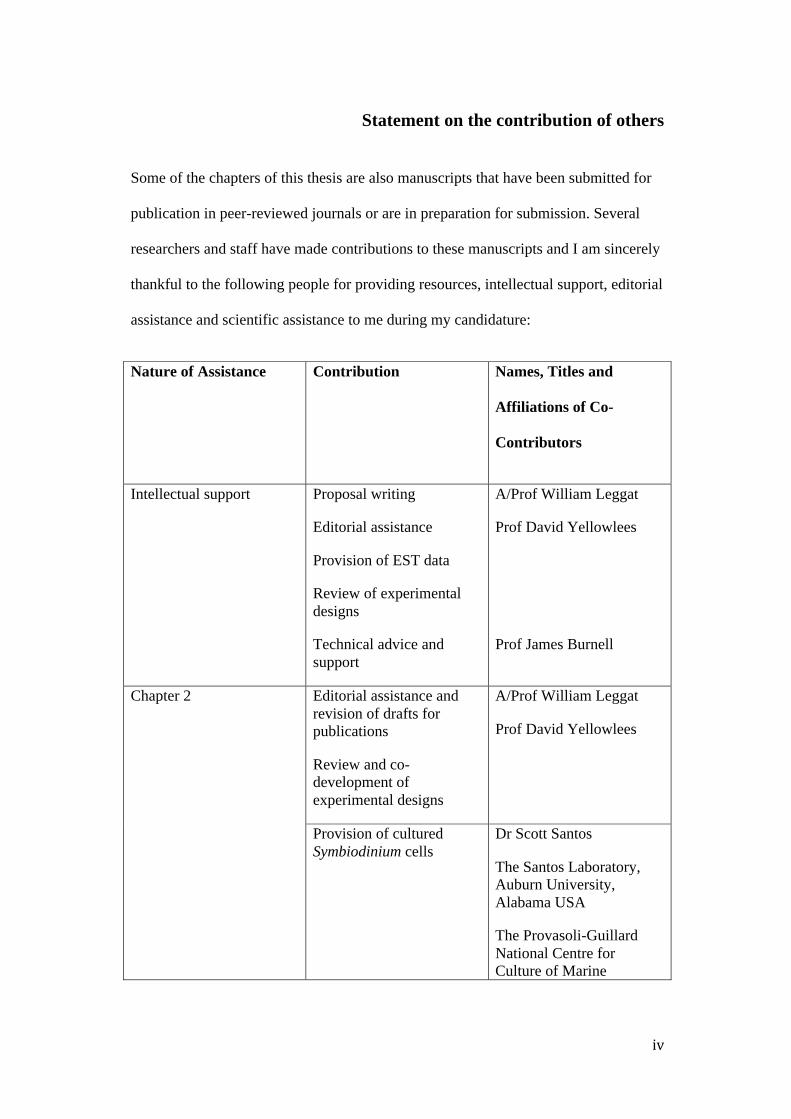
Chapter 2
Editorial assistance and revision of drafts for publications
Review and co-development of experimental designs
A/Prof William Leggat
Prof David Yellowlees
Provision of cultured Symbiodinium cells
Dr Scott Santos
The Santos Laboratory, Auburn University, Alabama USA
The Provasoli-Guillard National Centre for Culture of Marine
Phytoplankton
Phylogenetic analysis assistance
Dr. Marcelo Visentini Kitahara
Prof James Burnell
Technical advice and assistance of experimental equipment and setup
David Jusseaume
Storeperson/WHSO JCU
Chapter 3 Editorial assistance and revision of drafts for publications
Review and co-development of experimental designs
A/Prof William Leggat
Prof David Yellowlees
Chapter 4 Co-development of experimental design
Dr Lynda Boldt
Provision of cultured Symbiodinium C1 cells
The Provasoli-Guillard National Centre for Marine Algae and Microbiota, Bigelow Laboratory for Ocean Sciences, USA
Imaging – pulse amplitude modulated fluorometry data analysis
Dr Lynda Boldt
Chapter 5 Co-development of
experimental design
A/Prof William Leggat
Editorial assistance and
revision of drafts for
publications
A/Prof William Leggat

Financial Support
This research project was funded by James Cook University as details below.
• JCU Australian Postgraduate Award (APA)
• JCU Graduate Research Scheme Grant
• JCU Postgraduate Research Write-up Scholarship
Publications
Ogawa, D., Bobeszko, T., Ainsworth, T., Leggat, W. (2013) The combined effects of
temperature and CO2 lead to altered gene expression in Acropera aspera. Coral Reefs
32 (4): 895-907
Bobeszko, T., Yellowlees, D., Leggat, W. Identification of β- and δ-class carbonic
anhydrase in the symbiotic Dinoflagellate Symbiodinium and response to elevated
CO2 concentrations.
In review: Plant and Cell Physiology.
Acknowledgements
There are many people of whom without their support this thesis would not have been
possible. Firstly I wish to thank my supervisors Associate Professor Bill Leggat and
Professor David Yellowlees for their continued support, encouragment and patience
during my long and often painful PhD candidature. Your guidence and extensive
knowlegde has been an integral part of this research and I feel extremely priviliged to
have been a student under your supervision.
To Professor James Burnell, I can not find the words to express how grateful I
am for all your support and guidence. Your passion and enthusiasm for science has
inspired me and has made me think about science in a different way. You will forever
stand out as one of the few teachers to have left such a positive impression on my life
and I will dearly miss our intense conversations in the lab regarding what unfolded on
the latest episode of MKR.
I would like to thank Professor Helene Marsh for the continued encouragment,
understanding and guidence towards the end of my candidature. Professor Alan
Baxter and members of the College of Public Health, Medical and Vet Sciences who
made the data analysis of Chapter 5 a little easier.
To the members of the Leggat, Miller and Burnell Lab, I thank each and every
one of you for putting up with my (sometimes) erratic behaviour. Sarah Gierz, Ben
Gordon, Rebecca Tolentino and Dr Tracey Ainsworth, I am extremely grateful for all
the times you were there to help me.
Thank you to David Jusseaume who was always willing to help me with the
technical side of setting up experiments and for moving my full CO2 bottles from one
side of the university to the other.
To my dear friends Dr Lynda Boldt, Raph Rial and Colette Williams, thank
you is not enough for all your constant support, encouragement and laughter during
my PhD. Lynda, I cannot think of another person I would have wanted to share this
experience with.
Of course a massive thank you goes to my family for their support (even
though you never really knew what it was I was doing). To Justin, I would never
have been able to continue without you. We have been through so much over the
years and I will forever be grateful for everything you have done for me.
Finally, I would like to dedicate this thesis to my father who never got to see
me finish. I hope you know that I always have you in my thoughts and I hope that
you are proud of me. To my three beautiful daughters, Charlotte, Olivia and Chloe,
let this thesis be your proof that you can achieve anything you set your mind to. No
matter how hard things get in life, no matter how many times you fall down, pick
yourself up and achieve your dreams. I love you all xo.
Table of Contents
Statement of Access ...................................................................................................... i
Statement of Sources Declaration .............................................................................. ii
Electronic copy declaration ....................................................................................... iii
Statement on the contribution of others .................................................................. iv
Publications ................................................................................................................ vii
Acknowledgements ................................................................................................... viii
Abstract ......................................................................................................................... 1
Chapter 1. General Introduction ............................................................................... 6
Introduction ................................................................................................................ 6
Dinoflagellates ........................................................................................................... 7
Symbiodinium ........................................................................................................... 12
Cultured verse symbiotic Symbiodinium .................................................................. 14
Photosynthesis .......................................................................................................... 15
Inorganic carbon supply for Symbiodinium photosynthesis .................................... 18
Carbon-concentrating mechanisms .......................................................................... 19
Carbonic anhydrase .................................................................................................. 22
Alpha CA gene family ............................................................................................. 24
Beta CA gene family ................................................................................................ 25
Gamma CA gene family .......................................................................................... 27
Delta CA gene family .............................................................................................. 28
Zeta CA gene family ................................................................................................ 29
Eta CA gene family .................................................................................................. 29
CAs in photosynthetic eukaryotes ............................................................................ 29
Environmental regulation of CCMs and CAs .......................................................... 32
Significance and thesis objectives ............................................................................ 34
Chapter 2: Identification of β- and δ-class carbonic anhydrase in the symbiotic
dinoflagellate Symbiodinium and response to elevated CO2 concentrations ........ 39
Statement of purpose ............................................................................................. 39
Introduction ............................................................................................................ 40
Material and Methods ........................................................................................... 43
Symbiodinium genotype ....................................................................................... 43
CA sequencing ..................................................................................................... 44
Phylogenetic analysis ........................................................................................... 46
Cell culture and experimental conditions ............................................................. 46
mRNA isolation and cDNA synthesis ................................................................. 47
RNA transcript analysis by quantitative-PCR ..................................................... 49
Imaging – pulse amplitude modulated fluorometry ............................................. 52
Statistical analysis ................................................................................................ 52
Results ..................................................................................................................... 53
Identification of SymBCA1 and SymBCA2 β-class Symbiodinium CAs ............ 53
Identification of δ-class CA SymDCA1 .............................................................. 59
Imaging – pulse amplitude modulated fluorometry ............................................. 61
RNA transcript analysis ....................................................................................... 62
Discussion ................................................................................................................ 65
Symbiodinium β-CA polyproteins ........................................................................ 67
Symbiodinium CAs and photosynthetic efficiency in response to elevated CO2 . 69
Chapter 2 Summary points ................................................................................... 73
Chapter 3: Effects of combined elevated CO2 and temperature on gene
expression patterns in the symbiotic dinoflagellate Symbiodinium ....................... 76
Statement of purpose ............................................................................................. 76
Introduction ............................................................................................................ 77
Material and Methods ........................................................................................... 80
Experimental treatments ...................................................................................... 80
Imaging – pulse amplitude modulated fluorometry ............................................. 82
Symbiodinium cell density and pigment content .................................................. 82
mRNA isolation and cDNA synthesis ................................................................. 83
RNA transcript analysis ....................................................................................... 83
Statistical analysis ................................................................................................ 85
Results ..................................................................................................................... 85
Imaging – pulse amplitude modulated fluorometry ............................................. 85
Symbiodinium cell density and pigment content .................................................. 87
RNA transcript analysis ....................................................................................... 91
Discussion ................................................................................................................ 93
Chapter 3 Summary points ................................................................................. 100
Chapter 4: Carbonic anhydrase expression in Symbiodinium sp. in response to
varied light environments ........................................................................................ 103
Statement of purpose ........................................................................................... 103
Introduction .......................................................................................................... 104
Materials and Methods ........................................................................................ 108
Algal cultures ..................................................................................................... 108
Experimental design ........................................................................................... 109
RNA extraction and cDNA synthesis ................................................................ 110
Primer Design .................................................................................................... 111
RNA transcript analysis ..................................................................................... 111
Imaging – pulse amplitude modulated fluorometry ........................................... 112
Statistical analysis .............................................................................................. 112
Results ................................................................................................................... 113
Imaging – pulse amplitude modulated fluorometry ........................................... 113
RNA transcript analysis ..................................................................................... 116
Discussion .............................................................................................................. 120
Chapter 4 Summary points ................................................................................. 125
Chapter 5: Changes in Symbiodinium transcriptome in response to elevated
pCO2 concentrations ................................................................................................ 128
Statement of Purpose ........................................................................................... 128
Introduction .......................................................................................................... 130
Material and Methods ......................................................................................... 133
Culture growth/Experimental conditions ........................................................... 133
Chlorophyll analysis .......................................................................................... 134
Data Analysis ..................................................................................................... 134
Total RNA extraction and Illumina sequencing ................................................ 135
mRNA extraction and quantitative PCR validation ........................................... 135
Data assembly and analysis ................................................................................ 136
Results ................................................................................................................... 137
Chlorophyll pigment quantification ................................................................... 137
Symbiodinium transcriptome features ................................................................ 139
Identification of differentially expressed genes ................................................. 140
Gene ontology enrichment analysis ................................................................... 143
Over-represented functions in Symbiodinium transcriptome ............................. 143
Carbonic anhydrases .......................................................................................... 145
Energy/ATP metabolism .................................................................................... 146
Transcription factors .......................................................................................... 147
Under-represented functions in Symbiodinium transcriptome ........................... 150
Protein and ATP binding .................................................................................... 151
Protein phosphorylation ..................................................................................... 152
Validation of gene expression by qPCR ............................................................ 154
Discussion .............................................................................................................. 155
Specific functions enhanced under elevated CO2 .............................................. 156
Enhanced photosynthesis ................................................................................... 157
Carbonic Anhydrase ........................................................................................... 160
Enhanced metabolism ........................................................................................ 161
Enhanced transcription and translation factors .................................................. 164
Specific functions down-regulated under elevated CO2 .................................... 165
Reduced transmembrane transport ..................................................................... 165
Protein and ATP binding/Cell regulation ........................................................... 167
Conclusions ........................................................................................................... 168
Chapter 5 Summary points ................................................................................. 169
Chapter 6: General Discussion ............................................................................... 172
References ................................................................................................................. 185
Appendices ................................................................................................................ 224
List of Figures
Figure 1.1. Schematic representation of the evolution of plastids through a series of
endosymbiotic events.
Figure 1.2. Phylogenetic relationship between the nine clades of Symbiodinium.
Figure 1.3. Overall reaction of photosynthesis, showing conversion of carbon dioxide
to carbohydrates using water and light energy from the sun while producing oxygen.
Figure 1.4. Schematic representation of the photosynthetic process.
Figure 1.5. Model of the CCM in Chlamydomonas reinhardtii depicting an algal cell
with a single chloroplast and a single pyrenoid.
Figure 1.6. Phylogenetic analysis of the β-CA gene family depicting the different sub-
groups (monocots, dicots and subgroups A–D).
Figure 2.1. Schematic Representation of SymBCA1 and SymBCA2 polyproteins.
Figure 2.2. Alignment of SymBCA1 and SymBCA2 domains with other known β-CA
proteins.
Figure 2.3. Phylogenetic analysis of Symbiodinium β-CA domains with other β- class
carbonic anhydrase sequences from plants, bacteria, eukaryotes’ and representative
groups (A-D, monocaots, dicots, and the novel dinoflagellate grouping).
Figure 2.4. Alignment of SymDCA1 with other δ-CA proteins.
Figure 2.5. Phylogenetic analysis of Symbiodinium sp. C1 δ-CA domains with other
δ-class carbonic anhydrase sequences.
Figure 2.6. Photosynthetic and gene expression response of Symbiodinium to
elevated CO2 conditions.
Figure 3.1. pCO2 concentrations of culture media during the 21-day experiment.
Figure 3.2. Photosynthetic efficiency of PSII of cultured Symbiodinium C1, measured
as dark-adapted yield, Fv/Fm.
Figure 3.3. Symbiodinium cell density exposed to control - 380 ppm: 25 °C (open
circle), 750 ppm: 25 °C (open triangle), 1500 ppm: 25 °C (open diamond), 380 ppm:
31 °C (closed circle), 750 ppm: 31°C (closed triangle), 1500 ppm: 31°C (closed
diamond).
Figure 3.4. Symbiodinium pigment concentrations exposed to control - 380 ppm: 25
°C (open circle), 750 ppm: 25 °C (open triangle), 1500 ppm: 25 °C (open diamond),
380 ppm: 31 °C (closed circle), 750 ppm: 31°C (closed triangle), 1500 ppm: 31°C
(closed diamond). (a) chlorophyll a per Symbiodinium cell, (b) chlorophyll c per
Symbiodinium and (c) ratio of chl c to chl a.
Figure 3.5. Relative expression of genes of interest in Symbiodinium when exposed
to 380 ppm: 25 °C (open circle), 750 ppm: 25 °C (open triangle), 1500 ppm: 25 °C
(open diamond), 380 ppm: 31 °C (closed circle), 750 ppm: 31°C (closed triangle),
1500 ppm: 31°C (closed diamond). Values expressed as ratios of treatment to control
for each day: (a) SymBCA1, (b) SymBCA2, (c) Rubisco and, (d) PGPase.
Figure 4.1. Photosystem II photochemical efficiency (Fv/Fm) of Symbiodinium sp. C1
acclimated to high-light (squares) or medium-light (triangles) conditions prior to
transfer and exposure to varied light regime.

Figure 4.2. Relative expression of Symbiodinium genes. (a) SymBCA1, (b)
SymBCA2, (c) acpPC_15 and, (d) acpPC_17 acclimated to high-light conditions
(filled squares) prior to transitioning to medium light (filled triangles) or low-light
(filled circles) conditions.
Figure 4.3. Relative expression of Symbiodinium β-CA genes. (a) SymBCA1 and (b)
SymBCA2, (c) acpPC_15 and, (d) acpPC_17 acclimated to medium-light conditions
prior to transitioning to high-light (filled triangles) or low-light (filled circles)
conditions.
Figure 5.1. Chlorophyll pigment analysis of Symbiodinium clade F (a) concentration
of chlorophyll a in Symbiodinium cells, (b) concentration of chlorophyll c in
Symbiodinium cells, (c) ratio of chlorophyll a to c per Symbiodinium cells.
Figure 5.2. General characteristics of data distribution of Symbiodinium
transcriptome. (a) pie chart representing the number of contigs mapped and annotated
by Blast2GO and, (b) representation of the number of sequences and corresponding
length.
Figure 5.3. Differential expression analysis of Symbiodinium transcriptome. (a) MDS
plot of experimental conditions in which the distances represent the typical log2 fold
change between samples, (b) bar chart representing a summary of differential
expression results with the total amount of features in the transcriptome, the number
of kept features that have passed the filtering step, the number of features
differentially expressed and the number of features up-regulated and down-regulated,
(c) MA plot comparing fold change and expression level with differentially expressed
genes marked in red and, (d) volcano plot comparison of statistical significance and

fold change. Up-regulated genes (green), down-regulated genes (red) and non-
differentially expressed (black).
Figure 5.4. Gene enrichment analysis of most specific up-regulated GO categories in
Symbiodinium clade F transcriptome.
Figure 5.5. Gene enrichment analysis of most specific down-regulated GO categories
in Symbiodinium clade F transcriptome.
Figure 5.6. Validation of RNA-Seq approach using qPCR. Gene expression levels of
six up-regulated and six down-regulated genes quantified by qPCR.
List of Tables
Table 1.1. Known distribution of CA genes in the five CA families.
Table 1.2. Current distribution of CA isoforms among selected eukaryotes.
Table 2.1. Symbiodinium clade C1 primer sequences used for quantitative PCR.
Table 3.1 Symbiodinium primer sequences used for quantitative PCR.
Table 5.1 Overview of the sequencing data, assembly and annotation statistics of
Symbiodinium clade F transcriptome.
Table 5.2. Differentially expressed carbonic anhydrase genes in Symbiodinium clade
F and their corresponding logFC and gene family.
Abbreviations
acPCPs peridinin chlorophyll a-c binding proteins
AGRF Australian Genome Research Facility
AMTs ammonium transporters
ATP adenosine triphosphate
BLAST basic local alignment search tool CA carbonic anhydrase
Cab chlorophyll a/b- binding protein
CaCl2.2H2O calcium chloride dihydrate
Cal calmodulin
CCM carbon-concentrating mechanism
CCMP Centre for Culture of Marine Phytoplankton
CDK cyclin-dependent kinase
cDNA complementary deoxyribonucleic acid
Chl a chlorophyll a
Chl c chlorophyll c
Ci inorganic carbon
CNRQ calibrated normalised relative quantities
CO2 carbon dioxide
CO32- carbonate
CoSO4.7H2O cobalt (II) sulphate heptahydrate
cpDNA chloroplast deoxyribonucleic acid
CSD cold shock domain
CSPs cold shock proteins
Cyc cyclophilin
Cys cycteine
ddH2O double-distilled water
DEGs differentially expressed genes
DEPC diethylpyrocarbonate
DIC dissolved inorganic carbon
DNA deoxyribonucleic acid
EDTA ethylenediaminetetraacetic acid
EST Expressed Sequence Tag
FBP fructose-1,6-bisphosphatase
Fd ferredoxin
FDR false discovery rate
FeCl3.6H2O iron(III) chloride hexahydrate
FNR ferredoxin-NADP reductase activity
Fv/Fm dark-adapted yield of chlorophyll fluorescence
G6PD glucose-6-phosphate dehydrogenase
GAPDH glyceraldehyde-3-phosphate dehydrogenase
Gb gigabase
GBRMPA Great Barrier Reef Marine Park Authority
gDNA genomic deoxyribonucleic acid
GLM generalised linear model
Gln/Q glutamine
GO gene ontology
GOI gene of interest
H3BO3 boric acid
HATS high-affinity transporter system
HCO3- bicarbonate
His histidine
HL high-light
HSPs heat shock proteins
ICG internal control gene
iPAM imaging pulse-amplitude modulation

IPCC Intergovernmental Panel on Climate Change
ITS internal transcribed spacer
ITS1 internal transcribed spacer 1
ITS2 internal transcribed spacer 2
KCl potassium chloride
LATS low-affinity transporter system
LB Luria broth
LEF linear electron flow
LHC light-harvesting complex
LHCI light-harvesting complex 1
LHCII light-harvesting complex 2
LL low-light
LogFC log-fold change
LSU large subunit
MAFFT multiple alignment using fast fourier transform
Mb megabase
Mbp megabase pair
MgSO4.7H2O magnesium sulfate heptahydrate
ML medium-light
MnSO4.4H2O manganese(II) sulphate tetrahydrate
mRNA messenger ribonucleic acid
MTCA Methanobacterium thermoautotrophicum
NaCl sodium chloride
NADP nicotinamide adenine dinucleotide phosphate
NADPH nicotinamide adenine dinucleotide phosphate hydrogen NaNO3 sodium nitrate NCBI National Center for Biotechnology Information NH4NO3 ammonium nitrate
Nt nucleotide

NTA nitrilotriacetic acid
NTC non-template control
NPQ non-photochemical quenching O2 oxygen
OA ocean acidification
OPP oxidative pentose phosphate
PAM pulse amplitude modulated
PAR photosynthetically active radiation
PBS phosphate-buffered saline PCNA proliferating cell nuclear antigen
PCP peridinin-chlorophyll a-protein
PEP phosphoenolpyruvate
PEPCK phosphoenolpyruvate carboxykinase
pCO2 partial pressure of carbon dioxide
PCP peridinin-chlorophyll a-protein
PCR polymerase chain reaction
POR protochlorophylide reductase
PORB protochlorophylide reductase B
PGPase phosphoglycolate phosphatase
ppm parts per million
PSI photosystem I
PSII photosystem II
qPCR quantitative polymerase chain reaction
rDNA ribosomal deoxyribonucleic acid
RNA ribonucleic acid
ROS reactive oxygen species
rRNA ribosomal ribonucleic acid
Rp-S4 S4 ribosomal protein
Rubisco ribulose-1,5-bisphosphte carboxylase/oxygenase

SAM S-adenosyl methionine synthetase
SEM standard error of mean
SL spliced leader
SST sea surface temperature
TMM trimmed mean of M values
tRNA transfer ribonucleic acid
Y(II) Maximum quantum yield of photosystem II ZnSO4.7H2O Zinc sulphate heptahydrate

Abstract
Photosynthesis by Symbiodinium plays a central role in the coral-algal symbiosis as
the majority (around 95%) of the hosts’ metabolic demand is derived from
photosynthetically fixed carbon. Photosynthesis in Symbiodinium is augmented by
the use of a carbon-concentrating mechansism (CCM), of which the enzyme carbonic
anhydrase (CA) plays a significant role in the accumulation, transportation and
interconversion of inorganic carbon (Ci) forms to ultimately provide CO2 for the
carbon-fixing enzyme ribulose-1,5-bisphosphate carboxylase/oxygenase (Rubisco).
Environmental changes associated with climate change, such as ocean acidification
and warming, represent key threats to coral reef ecosystems and are the major causes
of the decline and deterioration of coral reefs worldwide and have prompted a major
research focus on how climate related stressors affect coral-algal symbioses. Given
the hosts’ dependency on the symbionts ability to perform photosynthesis, how
climate change will affect Symbiodinium photosynthesis is therefore an area that
needs to be investigated.
Current understanding of eukaryotic CCM expression is predominately
derived from the green alga Chlamydomonas reinhardtii. While it has been
demonstrated that Symbiodinium possess a CCM, the signals that trigger the
expression of the CCM and subsequent genes involved have not been precisely
defined in Symbiodinium. Therefore, the aims of this research were to use sequence
tag data for Symbiodinium sp. Clade C3 to characterise the genes encoding CAs
involved in the Symbiodinium CCM and to determine if Symbiodinium CAs were
modified by external CO2 concentrations as in other photosynthetic algae; to
determine what the combined effects of elevated CO2 and temperature were on

Symbiodinium photosynthesis and CA expression; to examine varying light intensities
on the regulation of CA; and to investigate possible long-term effects of CO2
enrichment on the Symbiodinium transcriptome.
To achieve these aims a sequencing project was performed. Bioinformatic
analyses including analysis of conserved amino acid residues of CA sequences and
homology of translated CA protein sequences with other known CA genes from algae
and higher plants was performed. Phylogenetic comparison of the translated protein
sequences of CAs with CA sequences from a variety of organisms was also
undertaken. Quantitative PCR was used for RNA transcript analysis of the identified
CAs, Rubisco and phosphoglycolate phosphatase (PGPase) under the various
environmental stressors and Illumina RNA-seq was used to investigate long-term CO2
effects on the Symbiodinium transcriptome.
Two distinct β-CAs and one δ-CA protein were identified and characterised in
this study. Both β-CAs were encoded as polyproteins and, were presumably localised
to the cytosol while the δ-CA protein is likely localised to the plasma membrane.
Phylogenetic analysis revealed that the dinoflagellate β-CAs form a novel group
within this gene family, illustrating the diversity that exists within the β-CA class.
Expression analysis of CAs in Symbiodinium sp. clade C1 under elevated CO2
concentrations revealed that CAs are down-regulated by elevated CO2 conditions as
seen in other algae however, expression patterns differ between different phylotypes
of Symbiodinium.
Exposure to combined elevated CO2 and temperature illustrated that thermal
stress was the main driver of changes in both transcript levels and physiological
parameters of Symbiodinium sp. clade F, while CO2 concentrations relevant to current
through to projected future levels of CO2 had little significant effect overall.

Transcript abundance of Symbiodinium CAs under varied light intensities was also
examined. High-light environments caused both a decrease in Symbiodinium CA
transcripts and photosynthetic efficiency. Lastly, the response of Symbiodinium clade
F to long-term elevated CO2 concentrations highlighted the transcriptome wide
changes with elevated CO2 significantly enhancing processes such as photosynthesis,
energy and ATP metabolism and CA transcript abundance while processes such as
transmembrane transport and protein phosphorylation were significantly down-
regulated.
The information resulting from this research therefore provides a basis for
future investigations into the role and functioning of CAs in Symbiodinium; a means
to compare the expression of CAs between stress tolerant and susceptible
Symbiodinium species; and a platform to understand how Symbiodinium
photosynthesis and therefore the coral-algal symbiosis may be affected by future
climate change conditions.
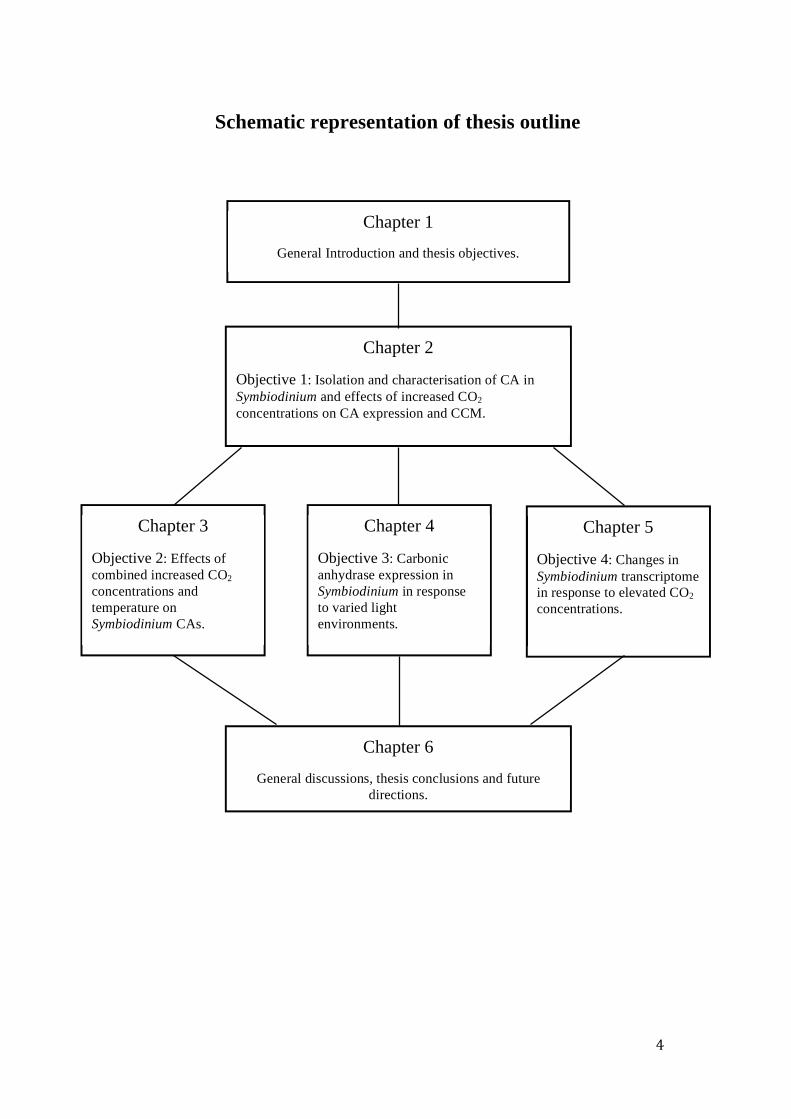
Schematic representation of thesis outline
Chapter 2
Objective 1: Isolation and characterisation of CA in Symbiodinium and effects of increased CO2 concentrations on CA expression and CCM.
Chapter 3
Objective 2: Effects of combined increased CO2 concentrations and temperature on Symbiodinium CAs.
Chapter 4
Objective 3: Carbonic anhydrase expression in Symbiodinium in response to varied light environments.
Chapter 5
Objective 4: Changes in Symbiodinium transcriptome in response to elevated CO2 concentrations.
Chapter 6
General discussions, thesis conclusions and future directions.
Chapter 1
General Introduction and thesis objectives.
Chapter 1. General Introduction
Introduction
Photosynthetic dinoflagellates belonging to the genus Symbiodinium are well known
for their endosymbiotic role in a variety of marine invertebrates and are largely
responsible for the photosynthetic productivity that underlies the vast growth of
tropical coral reefs (Falkowski et al. 1984). The effectiveness of photosynthesis in
Symbiodinium is largely dependant on the availability, assimilation and transportation
of inorganic carbon (Ci) from the external seawater medium to the carbon-fixing
enzyme ribulose-1,5-bisphosphate carboxylase/oxygenase (Rubisco). Mechanisms
such as a carbon-concentrating mechanism (CCM) are employed by dinoflagellates
to increase the internal concentration of CO2 at the active site of Rubisco, of which the
enzyme carbonic anhydrase (CA) plays a major role by the interconversion of the
Ci forms (Moroney et al. 2001). Despite the evolution of CCMs, changes in the
availability or concentration of Ci in the external seawater medium may have the
potential to affect the operation of the CCM, CA enzymes and therefore the
photosynthetic capabilities of Symbiodinium. One of the major concerns is that the
rapidity of the current environmental change could exceed the capacity of
Symbiodinium to acquire and fix carbon under elevated atmospheric CO2 conditions.
Therefore, this thesis addressed some of the potential effects of global
climate change conditions, such as increases in atmospheric CO2, increases in sea
surface temperature (SST) and light availability, on the operation of the
Symbiodinium CCM through the expression of CA enzymes.
Dinoflagellates
Dinoflagellates (phylum Dinoflagellata) are unicellular eukaryotes belonging to the
infrakingdom Alveolata that also comprises the phyla Ciliophora and Apicomplexa
(Burki et al. 2007). Most dinoflagellates are 10 -100 µm in diameter and are
characterised by two flagella that facilitate motility of cells, and a unique cell
covering referred to as the theca. Dinoflagellates form a monophyletic group that are
closest to apicomplexans and can be found in both the marine and freshwater
ecosystems (Hackett et al. 2004). The vast majority of dinoflagellates exist as free-
living cells, with autotrophic and heterotrophic lifestyles, but can also form symbiosis
with a wide range of marine invertebrates. The dinoflagellates are most notable for
their symbioses with reef-building corals, the production of toxic algal blooms,
termed red tides, and their spectacular bioluminescence. Apart from diatoms, the
dinoflagellates are the most important eukaryotic primary producers in the oceans and
as a group, are responsible for a high proportion of net global primary productivity
that play a major role in the drawdown of atmospheric CO2 via the process of
photosynthesis (Taylor and Pollingher 1987).
As a group, dinoflagellates are characterised by many unusual and unique
genetic characteristics that distinguish them from other eukaryotes. As with other
photoautotrophs, the dinoflagellate consists of three distinct genomes, the nuclear
genome, the mitochondrial and the plastid genome. Perhaps the most striking genetic
feature of dinoflagellates is their large nuclear genome of 1,500 – 245,000 megabase
pair (Mbp) (Lin 2011, Wisecaver and Hackett 2011). This is in contrast to other
eukaryotic algae whose genome sizes typically range from tens to hundreds of million
Mbp (Veldhuis et al. 1997). The large genome size in dinoflagellates is thought to be
due to high gene copy numbers, with several genes such as Rubisco (Rowan et al.
(1996), actin (Bachvaroff and Place 2008), peridinin-chlorophyll a-protein (PCP)
(Reichman et al. 2003), a variety of chlorophyll a-chlorophyll c2 – peridinin (acpPCP)
binding proteins (Boldt et al. 2012), transmembrane transporters such as bicarbonate
and ammonium related transporters and CAs (Aranda et al. 2016) all shown to be
present in multiple copies.
Structurally, the nuclear genome is unconventional in that the genome lacks
histones (the proteins involved in DNA packaging and ordering) and the DNA is not
arranged into nucleosomes (the basic method of DNA packaging in eukaryotes),
although small, basic, histone-like proteins that may play a role in DNA packaging
have been identified (Okamoto and Hastings 2003, Hackett et al. 2005, Lin 2011).
Although the dinoflagellate nuclear genome displays high gene copy numbers,
approximately 98 – 99 % of the genome is mostly non-coding DNA (Hou and Lin
2009, Lin 2011, Bayer et al. 2012). The genomic DNA also occurs in a liquid
crystalline state (Bouligand and Norris 2001), is permanently condensed and is
extensively methylated with, 5-hydroxymethyluracil replacing 12 – 70 % of thymine
bases, and varying levels of cytosine methylation also being observed (Blank et al.
1988). Spliced leader (SL) trans-splicing also appears to be ubiquitous in
dinoflagellates (Zhang et al. 2007, Zhang and Lin 2008). In this phenomenon a
highly conserved 22 nt SL sequence is transferred to the 5’ end of mRNA molecules,
which can serve a variety of roles and may also play a role in regulating gene
expression (Zhang et al. 2007). The dinoflagellate SL is unique from SL in other
trans-splicing organisms in that the ‘T’-rich Sm-binding motif occurs in the exon
instead of the intron region (Zhang et al. 2007, Zhang and Lin 2009). Given the
uniqueness of the dinoflagellate SL it can therefore be used as a selective primer to
obtain full-length transcripts and analyse the dinoflagellate transcriptome.
In contrast to their large nuclear genomes both the mitochondrial and plastid
genomes of dinoflagellates are highly reduced which appears to be the result of
extensive horizontal gene transfer to the nuclear genome. Although there is little
information on the structure of the mitochondrial genome, such as whether it is
circular or linear and or even the number of genomes (Waller and Jackson 2009), to
date the mitochondrial genome of dinoflagellates has been shown to carry genes for
only three essential components of the electron transport chain (Cob, cox1 and cox3)
plus two fragmented rRNA genes (Norman and Gray 2001, Chaput et al. 2002,
Jackson et al. 2007, Nash et al. 2007, Jackson et al. 2012).
The plastid genomes of dinoflagellates are extremely unique both structurally
and evolutionarily. The plastid (commonly referred to as the chloroplast) in all
eukaryotic photoautotrophs is thought to have arisen from an initial endosymbiotic
event in which a eukaryote engulfed a photosynthetic cyanobacterium (Figure 1.1).
Divergence of this primary endosymbiosis gave rise to the green lineage, resulting in
chlorophytes including plants and green algae, the red lineage resulting in the red
algae or rhodophyta and the glaucophytes (Delwiche 1999, Gould et al. 2008). The
uptake of a green alga or red alga by a second eukaryote resulted in secondarily
acquired plastids. Independent uptake of green algae lead to the euglenoids and
chlorarachniophyte, but it was the uptake of red algae, and the integration of the
engulfed red alga plastid with the host cell, that lead to a much greater diversity of
organisms (Keeling 2009).Dinoflagellates, haptophytes, heterokontophytes and
cryptophytes contain red algal plastids acquired via secondary or tertiary
endosymbiotic events. Organisms with a plastid of red algal origin may have
acquired the plastid via a single endosymbiosis of a red alga or via several
endosymbiotic events in which the organism engulfed another organism that had
already integrated a plastid of red algal origin. As a consequence of these multiple
symbiotic events, dinoflagellates have plastids with at least three surrounding
membranes and pigmented with chlorophyll a (chl a) and chlorophyll c (chl c) and the
unique carotenoid peridinin.
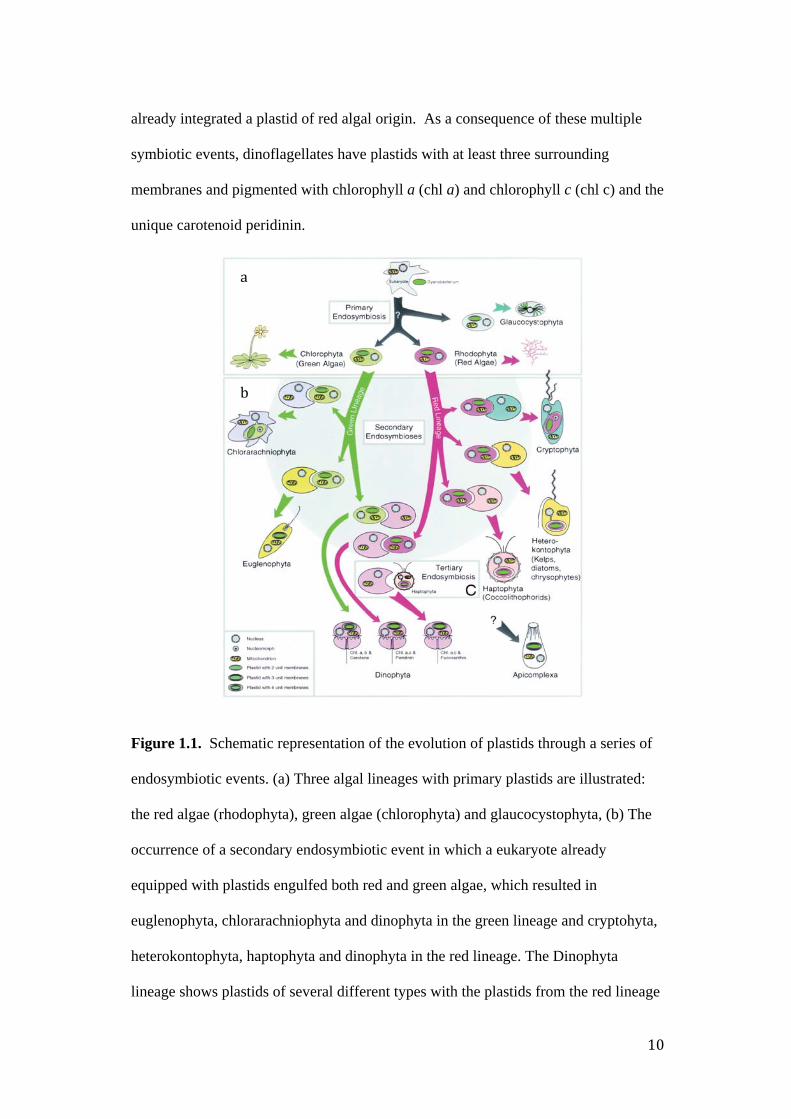
Figure 1.1. Schematic representation of the evolution of plastids through a series of
endosymbiotic events. (a) Three algal lineages with primary plastids are illustrated:
the red algae (rhodophyta), green algae (chlorophyta) and glaucocystophyta, (b) The
occurrence of a secondary endosymbiotic event in which a eukaryote already
equipped with plastids engulfed both red and green algae, which resulted in
euglenophyta, chlorarachniophyta and dinophyta in the green lineage and cryptohyta,
heterokontophyta, haptophyta and dinophyta in the red lineage. The Dinophyta
lineage shows plastids of several different types with the plastids from the red lineage

and includes the unique pigment peridinin. In most photosynthetic dinoflagellates, the
plastids are derived from the red linage (c) A tertiary endosymbiotic event where
species have acquired fucoxanthin-pigmented plastids from the haptophyte lineage
(from Delwiche 1999).
Structurally, the plastid genome of dinoflagellates is also unconventional.
Chloroplast genomes are typically composed of a single circular genome of
approximately 70 – 200 kb which encodes between 42 – 251 chloroplast proteins
(Wolfe et al. 1992) with the remaining chloroplast genes found in the nuclear genome.
In contrast, the dinoflagellate plastid genome has been fragmented and encodes no
more than 20 core genes of the photosynthetic electron transport chain plus two
rRNAs and several tRNA genes (Zhang et al. 1999, Howe et al. 2008, Green 2011).
The genes are organised on small minicircles (Zhang et al. 1999, Barbrook and Howe
2000, Barbrook et al. 2001, Moore et al. 2003) of between 2-10 kb (Nisbet et al.
2008) with these mincircle genes also displaying a number of anomalous features
such as, non-traditional translation start codons, (for example GUA in Amphidinium
and AUA in Heterocapsa (Zhang et al. 1999, Barbrook and Howe 2000, Barbrook et
al. 2001), accelerated rate of evolution compared to other chloroplast genes of other
organisms (Zhang et al. 2000) and several small deletions (Barbrook and Howe
2000). The fact that dinoflagellates have a highly reduced plastid genome has meant
that nearly all plastid proteins are nuclear encoded with a number of these nuclear
encoded plastid proteins, such as Rubisco (Rowan et al. 1996), PCP (Norris and
Miller 1994, Reichman et al. 2003) and acpPCP binding proteins (Boldt et al. 2012),
occurring as polyproteins. These multi-copy proteins are translated as one mRNA,
translated as one protein and are directed through the triple membrane chloroplast via
a N-terminal targeting sequence (Patron et al. 2005, Yoon et al. 2005). Once inside
the chloroplast the N-terminal peptide is typically cleaved and proteins may be
subsequently processed to their final mature state.
Yet another distinguishing feature of the dinoflagellates is that they are
currently the only eukaryotic taxon to utilise a Form II Rubisco of proteobacterial
origin as the carbon-fixing enzyme (Whitney et al. 1995). As a bi-functional enzyme
fixing both CO2 and O2, the Form II Rubisco is known to have the lowest
carboxylation:oxygenation specificity factor among eukaryotic phytoplankton
(Badger et al. 1998, Whitney and Andrews 1998) and is therefore less able to
discriminate between CO2 and O2 (Jordan and Ogren 1983, Morse 1995, Whitney et
al. 1995, Whitney and Andrews 1998). This has given dinoflagellates a disadvantage
with respect to carbon acquisition and fixation and has therefore led to the evolution
of carbon-concentrating mechanisms (CCMs) that serve to increase the concentration
of CO2 at the active site of Rubisco (Leggat et al. 1999).
Symbiodinium
Symbiodinium (or commonly referred to as zooxanthellae), are primarily known for
their role as mutualistic endosymbionts with reef-building corals and a wide range of
other marine invertebrates (Muscatine et al. 1981), but are also found free-living. As
symbionts, Symbiodinium are essential as a large proportion of the hosts’ energy
requirements (ca. 95%) are met by the translocation of photosynthetically fixed
carbon from the symbiont (Muscatine 1990). Initially considered a single pandemic
species and classified Symbiodinium microadriaticum (Freudenthal 1962),
morphological and physiological studies have revealed that Symbiodinium is an
extremely functionally diverse genus exhibiting much higher sequence diversity than

that observed between genera of non-symbiotic dinoflagellates (LaJeunesse 2001,
Coffroth and Santos 2005, LaJeunesse et al. 2010). Analyses of Symbiodinium
nuclear (rDNA) and chloroplast ribosomal DNA (cpDNA) phylogenies have revealed
variation in genotypes and the varying genotypes have been arbitrarily designated
using an alpha-numeric system (Rowan and Powers, 1991a, Coffroth and Santos,
2005, Pochon et al., 2006). Symbiodinium are currently divided into nine highly
divergent clades designated A-I (Figure 1.2), which in turn contain multiple subclades
(phylotypes) based on small differences in internal transcribed spacers (ITS), partial
large subunit (LSU), and plastid gene sequences (Stat et al. 2006). Each of these
clades can also exhibit distinct host taxon, geographic distribution (LaJeunesse 2001,
Pawlowski et al. 2001, Santos et al. 2002), and display variations in tolerance to
abiotic factors such as temperature and irradiance (Warner et al. 1999, Savage et al.
2002).
Figure 1.2. Phylogenetic relationship between the nine Symbiodinium clades (A-I).
Many coral hosts’ can harbour multiple Symbiodinium clades and the
dominance or distribution of the different clades can vary within the same coral
species. Reef-building corals have been shown to associate with symbionts from
clades A, B, C, D or F. Clades A and B are more common in Caribbean scleractinians
(LaJeunesse 2001). Symbionts from clade D appear to be thermally tolerant with
their abundance known to increase in reefs that have suffered episodes of severe
bleaching (Baker et al. 2004, Rowan 2004, Berkelmans and Van Oppen 2006). The
most prevalent Symbiodinium clade, clade C, comprises the greatest number of
ecologically distinct species and dominates scleractinian corals in the Pacific and
Indian Oceans (Lien et al. 2012).
Cultured verse symbiotic Symbiodinium
There are numerous variations between cultured and symbiotic cells in morphology,
size, biochemistry, gene expression, motility and, growth rates (Shoenberg and
Trench 1980). For example, Symbiodinium cells in culture possess a thick prominent
pellicle, which in non-cultured cells is reduced (Shoenberg and Trench 1980b). Cell
doubling in cultured Symbiodinium can range between 2.7 to 33 days (McBride et al
2009) while in symbiotic Symbiodinium cell doubling can range between 53-73 days
(Muscatine et al 1984). In addition, the immediate environment surrounding the cell is
very different in symbiosis and in culture. In symbiosis the algae is surrounded by a
highly acidic symbiosome membrane complex that most likely has a high pCO2
(Barott et al. 2015).
Morphological and physiological descriptions for Symbiodinium have
primarily arisen due to studies involving cultured Symbiodinium (Trench and Blank,
1987, Iglesias-Prieto et al., 1991, Iglesias-Prieto et al., 1992, Iglesias-Prieto et al.,

1993, Iglesias- Prieto and Trench, 1994, Iglesias-Prieto and Trench, 1997a, Iglesias-
Prieto and Trench, 1997b). A variety of Symbiodinium clades and sub-clades have
been successfully cultured (Santos et al., 2001, Coffroth et al., 2006) however,
Symbiodinium can demonstrate differential culturability. For example, clade A cells
are generally quite easily cultured, but specific sub-clades, such as C3, have been
challenging to culture suggesting particular clades or sub-clades may not be able to
exist as free- living organisms outside their host (Pochon et al., 2010). It has also been
recognised that culture conditions may select one genotype of Symbiodinium over
another (Rowan 1998).
While the response of cultured Symbiodinium to experimental parameters may
not reflect that of cells in symbiosis, research with symbiotic Symbiodinium poses
difficulties, such as the complex interaction between the host organism,
Symbiodinium and associated bacterial communities, not applicable to cultured
Symbiodinium. Benefits of working with cultured Symbiodinium include: the ability
to directly compare specific genotypes, accurately measure growth parameters and
record responses to manipulated and controlled environmental factors without host
and bacterial interference. Cultured Symbiodinium also provide an unlimited supply
of cells of a known molecular type from which information can be extracted.
Photosynthesis
Algal photosynthesis accounts for a large proportion of global primary productivity
(Falkowski and Raven 2013). Approximately half of the dinoflagellates are
photosynthetic (Keeling 2009) and play a major role in the drawdown of atmospheric
CO2 via this process. Photosynthesis in eukaryotes is carried out by plastids
(chloroplasts) and is the process of converting light energy and CO2 into chemical
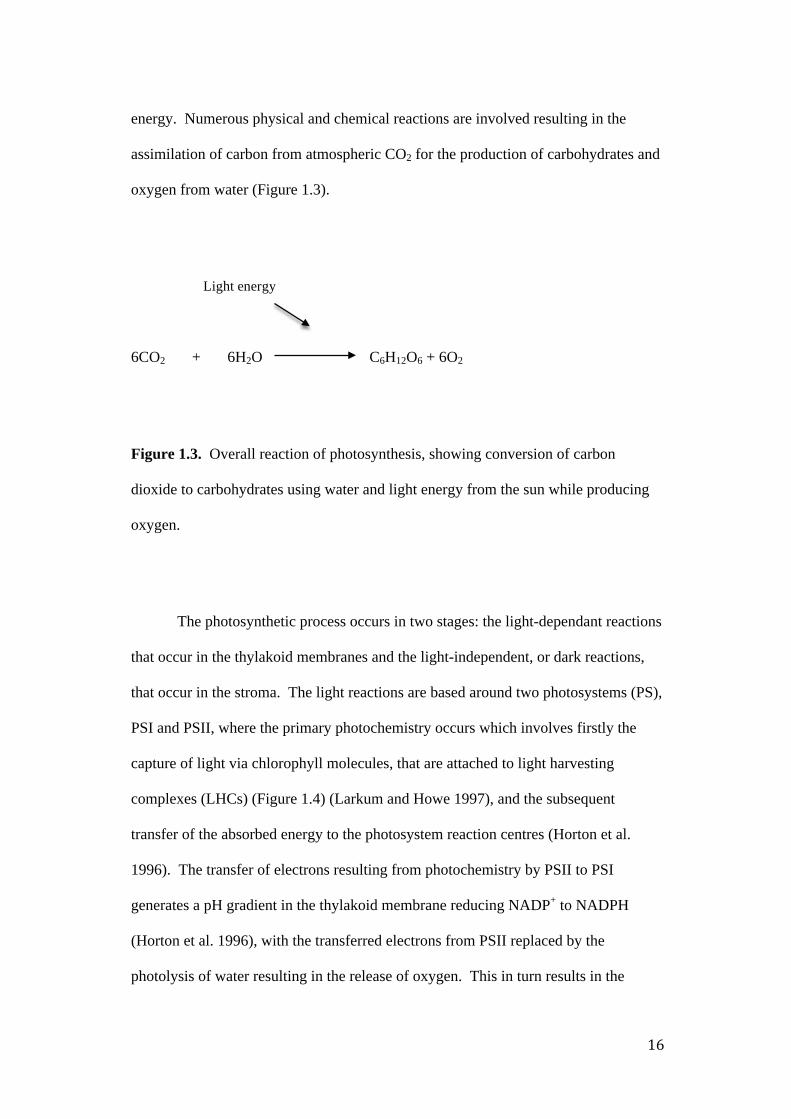
energy. Numerous physical and chemical reactions are involved resulting in the
assimilation of carbon from atmospheric CO2 for the production of carbohydrates and
oxygen from water (Figure 1.3).
6CO2 + 6H2O C6H12O6 + 6O2
Figure 1.3. Overall reaction of photosynthesis, showing conversion of carbon
dioxide to carbohydrates using water and light energy from the sun while producing
oxygen.
The photosynthetic process occurs in two stages: the light-dependant reactions
that occur in the thylakoid membranes and the light-independent, or dark reactions,
that occur in the stroma. The light reactions are based around two photosystems (PS),
PSI and PSII, where the primary photochemistry occurs which involves firstly the
capture of light via chlorophyll molecules, that are attached to light harvesting
complexes (LHCs) (Figure 1.4) (Larkum and Howe 1997), and the subsequent
transfer of the absorbed energy to the photosystem reaction centres (Horton et al.
1996). The transfer of electrons resulting from photochemistry by PSII to PSI
generates a pH gradient in the thylakoid membrane reducing NADP+ to NADPH
(Horton et al. 1996), with the transferred electrons from PSII replaced by the
photolysis of water resulting in the release of oxygen. This in turn results in the
Light energy

generation of a proton gradient across the thylakoid membrane resulting in the
generation of adenosine tri-phosphate (ATP) by ATP synthase (Mitchell 1961). The
light-independent or dark reaction is where carbon fixation occurs and is where the
enzyme Rubisco catalyses the first step of carbon fixation via the capture of
atmospheric CO2 through the Calvin-Benson cycle that uses the NADPH and ATP,
generated from the light-reactions, to generate 3-phosphoglyceraldehyde (GAPDH)
which is then exported to the cytosol and used to generate organic compounds. The
resulting compounds are further reduced to form carbohydrates such as glucose or
glycerol that is then used to meet the alga’s own energy requirements, if free-living,
or is translocated to the host if in symbiosis.
Figure 1.4. Schematic representation of the photosynthetic process illustrating the
domains of the thylakoid membrane and the electron-flow throughout the light
reactions. The light reactions involve the capture of light via chlorophyll molecules
that are attached to the light harvesting complexes (LCHII and LCHI) and the transfer
Thylakoid membrane
Thylakoid lumen
Stroma
of energy to the photosystem reaction centres (PSII and PSI). Any excess light is
dissipated by the xanthophyll cycle. Energy transfer to PSII and PSI then generates
electron transport in the thylakoid membrane. Red arrows illustrate cyclic electron
flow which results in generation of H+ gradient and ATP synthesis. Blue arrows
illustrate electron flow resulting in production of ATP and NADPH used for carbon
fixation in the dark reactions. Cyt c6, cytochrome c6; Fd, ferredoxin; FNR, Fd:NADP+
reductase; PQ, plastoquinone (Adapted from Finazzi et al 2003).
Inorganic carbon supply for Symbiodinium photosynthesis
Inorganic carbon (Ci) is required for photosynthesis in Symbiodinium. However the
supply of Ci in the surrounding seawater medium is one of the major factors affecting
photosynthesis. Ci in seawater exists in three forms: CO2, HCO3- and CO3
2- and
although free-living Symbiodininium live in an environment with a relatively large
and constant pool of Ci (~2.2 mM), the relative concentrations of the individual
carbon species vary depending upon seawater pH. At ambient pH of open ocean
seawater (pH 8.2) greater than 99% of the Ci content is in the form of membrane
impermeable HCO3-, while CO2, the carbon species required by Rubisco, constitutes
less than 1%. The CO2 availability is further reduced owing to a slow diffusion rate
and slow conversion rate between HCO3- and CO2 to support maximal photosynthetic
rates (Cook et al. 1986). In addition, the Form II Rubisco of dinoflagellates imposes
restrictions to photosynthesis. Although there are a number of structurally distinct
forms of Rubisco (Delwiche and Palmer 1996, Horken and Tabita 1999), all are
capable of both a carboxylation reaction, which leads to the net fixation of carbon,
and an energetically wasteful oxygenase reaction (Jordan and Ogren 1983). As a
consequence of the oxygenation reaction, one molecule of 3-phosphoglycerate and
one 2-phosphoglycolate is formed. Phosphoglycolate represents a potent inhibitor to
photosynthesis and loss of fixed carbon if not converted to glycolate by the enzyme
phosphoglycolate phosphatase (PGPase) via the photorespiratory pathway. The
extent to which the two reactions occur depends on both the concentration of CO2 and
O2 at the active site of Rubisco and affinity for each species. Dinoflagellate Form II
Rubisco is known to have the lowest carboxylation:oxygenation specificity factor
among eukaryotic phytoplankton (Whitney and Andrews 1998) and is therefore less
able to discriminate between CO2 and O2.
In contrast to free-living Symbiodinium, those that exist in symbiosis have
additional limitations in Ci supply. Due to intracellular location within the animal
host, the symbiont does not have immediate access to the Ci pool in seawater.
Although the symbiont is able to fix host metabolically produced CO2, when
photosynthetic rates exceed respiratory rates of the association Symbiodinium must
rely on the Ci transport systems of their host to mediate the flux of Ci to support
photosynthesis. To avoid such carbon limitations and the inefficiencies of the Form II
Rubisco dinoflagellates, including Symbiodinium, have evolved CCMs that function
to increase the intracellular concentration of CO2 at the active site of Rubisco, thereby
allowing maximal photosynthetic rates.
Carbon-concentrating mechanisms
To avoid the limitations of carbon supply and the kinetic inefficiencies of Rubisco,
algae have developed CCMs. The primary function of algal CCMs is to augment
photosynthetic productivity by increasing intracellular levels of CO2 at the active site
of Rubisco. The CCM also simultaneously serves to minimise the energetically
wasteful oxygenation reaction and CO2 loss via leakage (a risk that increases with
increasing accumulation of Ci). To date, CCMs have been identified in a wide range
of symbiotic and free-living marine photolithotrophs including cyanobacteria,
microalgae (Badger and Price 1992) and macrophytes (Johnston 1991) and also in
marine invertebrates such as corals (Al-Moghrabi et al. 1996, Furla et al. 2000) and
sea anemones (Bénazet-Tambutté et al. 1996). A wide diversity of Ci acquisition
mechanisms therefore exist (Badger et al. 2002, Colman et al. 2002) and while
components of the CCM can vary among different species, most CCMs primarily
involve one or more of the following processes: (1) the active transport of CO2 into
the cell via Ci transporters; (2) the dehydration of HCO3- to CO2 at the cell surface via
the enzyme carbonic anhydrase (CA) and/or the subsequent transfer of CO2 into the
cell; (3) the active transport of HCO3- directly into the cell and the subsequent
conversion to CO2 via CA and (4) the localisation of Rubisco to a specialised
microcompartment (carboxysomes in prokaryotic CCMs and the pyrenoid in most
eukaryotic CCMs), for the delivery of CO2, suggesting that Ci need only be elevated
within these specialized microcompartments to sustain photosynthesis.
The most well studied CCMs are those from the freshwater cyanobacteria and
the green alga Chlamydomonas reinhardtii. C. reinhardtii was the first eukaryotic
alga in which a CCM was demonstrated (Badger et al. 1980) and has since become a
model organism with one of the better understood CCMs in eukaryotes. In C.
reinhardtii, three components are seen to be essential for CCM activity: (1) Ci
transporters at the plasma membrane and chloroplast envelope (Spalding 2007); (2)
CAs which facilitate the conversion of HCO3- and CO2 (Moroney et al. 2011) and (3)
the localisation of Rubisco to a microcompartment within the chloroplast known as
the pyrenoid that serves to minimise CO2 leakage (Ma et al. 2011, Meyer et al. 2012)

(Figure 1.5). In addition, it has also been demonstrated that the CCM of C.
reinhardtii is inducible (Badger et al. 1980, Somanchi et al. 1998) with components
of the CCM not detected in cells that have been cultured at high CO2 concentrations
(>1% CO2).
Figure 1.5. Model of the CCM of Chlamydomonas reinhardtii depicting an algal cell
with a single chloroplast and a single pyrenoid. The relative concentrations of
bicarbonate and carbon dioxide are indicated by the size of the lettering. Cah1, Cah3,
Cah6, Cah8, and Cah9 are all specific CA isoforms localised to specific cell
compartments. Possible bicarbonate transporters are indicated by filled circles and
closed diamonds represent the photosynthetic electron transport chain. CE,

chloroplast envelope; PGA, 3-phosphoglyceric acid; PM, plasma membrane; TM,
thylakoid membrane (Moroney and Ynalvez 2007).
While most of the present knowledge about algal CCMs has been elucidated
from cyanobacteria and C. reinhardtii, the CCMs of Symbiodinium are far less
understood. Evidence for a CCM in Symbiodinium was first proposed by Leggat et al
(1999) who found intracellular dissolved inorganic carbon DIC was significantly
higher than can be accounted for by passive diffusion alone in Symbiodinium isolated
from the giant clam Tridacna gigas. Although the exact mechanisms and identity of
the components involved have not been fully established, a number of CCM
components have been identified such as, the utilisation of both the HCO3- and CO2
pool of Ci, H+-ATPase and Na+/HCO3- co-transporters (Yellowlees et al. 1993,
Leggat et al. 1999), the presence of both intra-cellular and extra-cellular CA enzymes
for the interconversion of HCO3- and CO2, and the localisation of Rubisco to the
pyrenoid (Leggat et al. 2002). As with the CCM of C. reinhardtii, it is also apparent
that the expression of the Symbiodinium CCM differs depending on whether
Symbiodinium is free-living or in symbiosis and if in symbiosis can depend on host
type, such as corals verse clams (Al-Moghrabi et al. 1996, Leggat et al. 1999,
Bertucci et al. 2009). Recent studies have also shown that CCM expression in
Symbiodinium can also be phylotype-specific with different clades and sub-clades of
Symbiodinium showing differential regulation in CCM activity when cultured under
differing CO2 concentrations (Brading et al. 2013).
Carbonic anhydrase
CA is a metalloenzyme that increases the relatively slow dehydration of HCO3-,
allowing rapid equilibration of HCO3- and CO2 (Khalifah and Silverman 1991) in a
reversible reaction that can be summarized as follows:
CO2 + H2O ↔ H+ + HCO3-
The enzyme is involved in a range of biological functions, including carboxylation
reactions, acid-base balance, ion exchange and in a variety of biochemical processes
such as respiration and photosynthesis (Tashian 1992). Since its first discovery in
bovine red blood cells by Meldrum and Roughton (1933), CA has been found in
virtually all animals as well as plants, algae and bacteria (Burnell et al. 1990,
Fukuzawa et al. 1992, Funke et al. 1997, Karlsson et al. 1998, Satoh et al. 2001). Six
different CA gene families (α, β, γ, δ, ζ and η) have been identified to date (Table
1.1), all of which have evolved independently and show little sequence homology
(Hewett-Emmett and Tashian 1996, Roberts et al. 1997, Lane et al. 2005, Soto et al.
2006). It is believed that the α, β and γ- CAs are convergently evolved, whereas the δ,
ζ and η CAs appear to be highly divergent variants of the β- or α-class CAs (Hewett-
Emmett and Tashian 1996, Liljas and Laurberg 2000, Supuran 2016). Recent studies
on the phylogenetic and kinetic properties of the CA of the protozoan parasite
Plasmodium falciparum, (PfCA) have suggested that these protozoan CAs do not
encode a CA belonging to the α-class as once thought, but instead encode for a new,
yet undisclosed, genetic family of CAs termed η-CAs (Del Prete et al. 2014). Based
on further bioinformatic analyses, these studies have also hypothesised that a possible
seventh class of CAs may also exist (proposed to be denominated è-CA), however the
confirmation or refutation of this class needs to be further investigated.
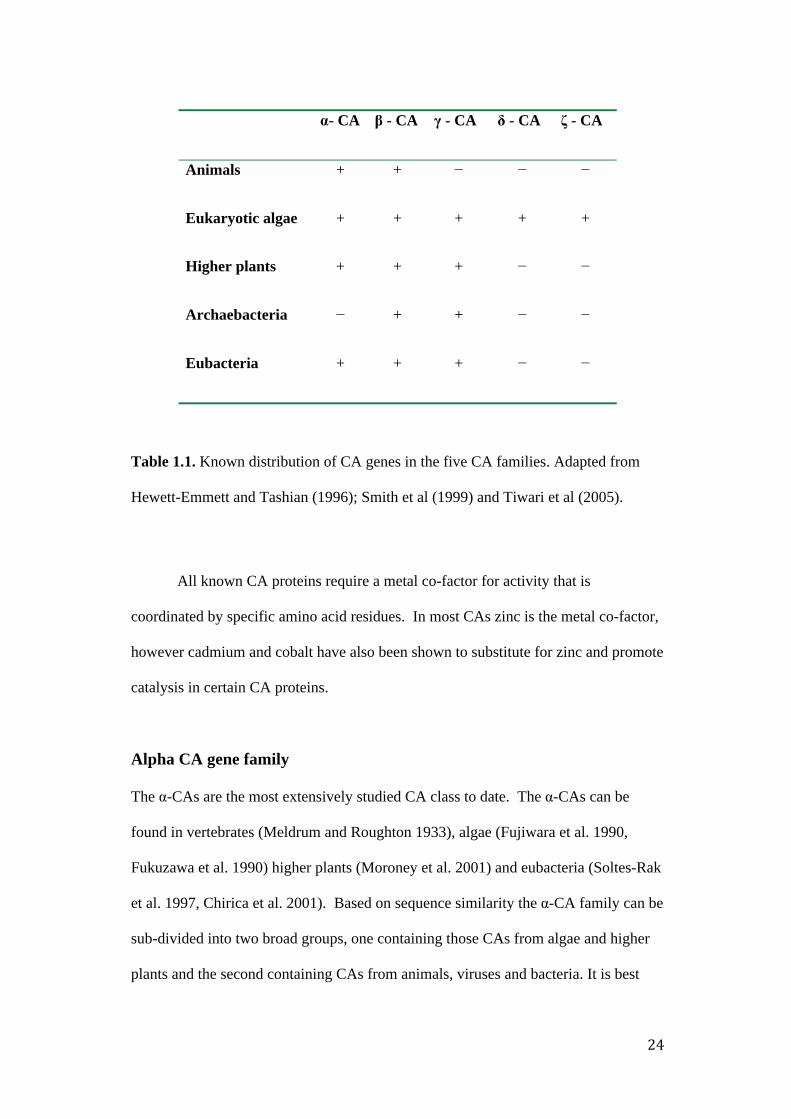
α- CA β - CA γ - CA δ - CA ζ - CA
Animals + + − − −
Eukaryotic algae + + + + +
Higher plants + + + − −
Archaebacteria − + + − −
Eubacteria + + + − −
Table 1.1. Known distribution of CA genes in the five CA families. Adapted from
Hewett-Emmett and Tashian (1996); Smith et al (1999) and Tiwari et al (2005).
All known CA proteins require a metal co-factor for activity that is
coordinated by specific amino acid residues. In most CAs zinc is the metal co-factor,
however cadmium and cobalt have also been shown to substitute for zinc and promote
catalysis in certain CA proteins.
Alpha CA gene family
The α-CAs are the most extensively studied CA class to date. The α-CAs can be
found in vertebrates (Meldrum and Roughton 1933), algae (Fujiwara et al. 1990,
Fukuzawa et al. 1990) higher plants (Moroney et al. 2001) and eubacteria (Soltes-Rak
et al. 1997, Chirica et al. 2001). Based on sequence similarity the α-CA family can be
sub-divided into two broad groups, one containing those CAs from algae and higher
plants and the second containing CAs from animals, viruses and bacteria. It is best
studied in humans where it occurs in a number of isozymic forms (numbered I-XV),
eleven of which are active and the remaining three devoid of catalytic activity due to a
change in the amino acids of the active site (Vullo et al. 2005). Among the most well
characterised isozymes is α-CAII, which has one of the most rapid turnover rates
known for an enzyme with a kcat of 1.4 x 10⁶ s-1 (Silverman 1991). Most α-CAs are
active as monomers of approximately 30 kDa with the zinc ion required for catalysis
coordinated by three conserved histidine residues and a water molecule (Moroney et
al. 2001).
Beta CA gene family
Initially the β-class was thought to be expressed only in the chloroplasts of higher
plants, however β-CAs have now been identified in a variety of organisms from
bacteria and archaea to invertebrates, missing only from vertebrates and most
chordates (Eriksson et al. 1996, Hewett-Emmett and Tashian 1996, Syrjänen et al.
2010). The β-class appears to be more diverse in sequence and distribution than any
of the other CA classes (Smith and Ferry 2000, Zimmerman and Ferry 2008). The
active site of β-CAs is composed of a zinc atom that is coordinated by one histidine
and two cysteine residues, unlike that of the three histidine residues conserved in the
α, γ- and δ- classes. β-CAs also contain a highly conserved dyad consisting of an
aspartate and arginine residue that is crucial for catalysis with mutations of these
residues causing reduced catalytic activity (Smith et al. 2002). Instead of functioning
as monomers, like most α-CAs or trimers like γ-CAs, β-CAs are usually active as
dimers or multimers (Kimber and Pai 2000, Smith et al. 2000, Strop et al. 2001). An
exception to this is the β-CA from the red alga Porphryidium purpureum in which
there are two catalytic CA domains within the one protein (Mitsuhashi and Miyachi
1996) that fold upon themselves to form a pseudo-dimer. This particular β-CA is
suggested to be a product of gene duplication with the N- and C-terminus halves
displaying 72% similarity.
Based on sequence identity, β-CAs can be further divided into six different
subgroups (Figure 1.6). The plant sequences form two groups representing
dicotyledonous and monocotyledonous plants (Smith et al. 1999) while the remaining
non-plant sequences separate into four distinct subgroups (A – D). The enzymes of
eukarya and bacteria form two of these subgroups while the other two subgroups are
solely prokaryotic with one group including enzymes from gram-negative bacteria
only and the second group consisting of sequences from archaea and gram-positive
bacteria.

Figure 1.6. Phylogenetic analysis of the beta-CA gene family depicting the different
sub-groups (monocots, dicots and groups A – D). The eukarya plant sequences are in
green, lower eukaryotes are in black and bacteria in red (Smith et al 1999).
Gamma CA gene family
An active γ-CA was first identified in the archaebacterium Methanosarcina
thermophila (Alber and Ferry 1994). Since then, γ-CAs have been identified in
eubacteria and plants (Newman 1994) but have apparently been secondarily lost in
animals and fungi (Elleuche and Poggeler 2009). γ-CAs have been shown to function
as trimers with the zinc ion coordinated by three histidine residues (Alber et al. 1999).
Studies have indicated that γ-CAs are part of Complex I of the mitochondrial electron
transport chain in plants and algae (Sunderhaus et al. 2006, Klodmann et al. 2010).
While the specific role of these γ-CAs is still not fully understood, it has been
proposed that the CA domain of complex I is involved in a CO2 recycling mechanism
that mediates the efficient transport of CO2 from the mitochondria to the chloroplast
for photosynthetic fixation (Braun and Zabaleta 2007, Zabaleta et al. 2012). This
proposed mechanism firstly involves the conversion of CO2 to HCO3- in the
mitochondria, transportation of HCO3- from the mitochondria to the chloroplast where
it is converted back to CO2 by chloroplastic CAs and finally fixation of CO2 by
Rubisco (Braun and Zabaleta 2007; Zabaleta et al 2012).
Delta CA gene family
To date, this family is widespread in the marine phytoplankton, being present in
haptophytes, dinoflagellates, diatoms, and chlorophytic prasinophytes. It was first
characterised in the diatom Thalassiosira weissflogii (Roberts et al. 2007), in which
the CA sequence showed no significant homology to previously sequenced CAs. The
active site has been examined by X-ray absorption spectroscopy and has been found
to be similar to that of α- and γ-CAs (Cox et al. 2000) in which the zinc ion is
coordinated by three histidine residues and a water molecule. In addition, studies
have demonstrated that cobalt can be substituted for zinc with no significant affect on
CA activity (Lane and Morel 2000), suggesting an adaptive mechanism employed to
maintain activity in waters that are low in zinc concentrations.
Zeta CA gene family
The ζ-gene family currently appears to be limited to marine protists. The geometry of
the active site has been shown to resemble the β-CAs (Lane and Morel 2000, Park et
al. 2007) with some similarity in the fold structure that has led to the suggestion that
this gene family may represent a distantly diverged subtype of β -CAs (Xu et al.
2008). This particular enzyme has also been shown to contain cadmium or cobalt in
the active site that can substitute for zinc, when zinc concentrations are low, without a
significant loss of the catalytic activity (Lane and Morel 2000; Lane et al 2005; Park
et al 2007).
Eta CA gene family
Recent studies on the phylogenetic and kinetic properties of the CA of the protozoan
parasite Plasmodium falciparum, (PfCA) cloned over ten years ago (Reungprapavut et
al. 2004), have suggested that these protozoa do not encode a CA belonging to the α-
class as once thought, but instead encode CAs belonging to a new family termed η-
CAs (Del Prete et al 2014). To date η-CAs are only represented in the genus
Plasmodium data on the structure of these proteins are currently unavailable.
CAs in photosynthetic eukaryotes
It is well known that CA in photosynthetic organisms plays a major role in the
operation of the CCM via the concentration of Ci for efficient photosynthetic activity
(Badger 2003, Badger and Price 2003, Moroney et al. 2011, Wang et al. 2011). Early
studies have demonstrated that photosynthesis in C. reinhardtii was severely impaired
and the affinity for Ci was reduced when the alga was exposed to sulfonamides
(strong inhibitors of CA), providing evidence that CAs directly participated in the
CCM of C. reinhradtii. Subsequently studies have shown CA to participate in all
stages of the algal CCM from Ci entry, prevention of CO2 leakage from the cell and
intra-cellular conversions of the Ci forms. The enzyme can be located externally and/
or internally, where its function differs depending on locality. In general, internal
CAs are considered constitutive and are used to facilitate Ci transport within the cell
(Merrett et al. 1996) via the rapid interconversion of CO2 and HCO3-. External CAs,
can be located external to the plasma membrane where they are used to facilitate the
diffusion of Ci to the cell surface by rapid dehydration thereby maintaining the Ci
species equilibrium at the site of transport for diffusion into the cell (Bozzo and
Colman 2000).
There is wide variation in the number of CA gene families found among
eukaryotic microorganisms (Table 1.2). Simultaneously, the same organism may have
a different number of genes for the representatives of each individual CA class, which
suggests that the specific function of one kind of CA gene may be different (Xiao et
al. 2016). But even within the same class, CAs may be represented by a number of
isoenzymes that show different molecular features, oligometric arrangement, cellular
localisation and responses to different classes of inhibitors (Alterio et al. 2012). Such
variation may either be the result of genome or cell size and or the environment in
which these organisms are found. Again, much of the current knowledge about
photosynthetic eukaryotic CAs has been elucidated from plants and the green alga C.
reinhardtii (Mitra et al. 2005, Spalding 2007) with little knowledge on the CAs
present in the symbiotic dinoflagellate Symbiodinium. In C. reinhardtii there are at
least 12 CAs identified, including three α-CAs, six β-CAs, and three γ-CAs. The α-
CAs have been localised to the periplasm (Fujiwara et al. 1990, Rawat and Moroney
1991) and thylakoid lumen (Karlsson et al. 1995), β-CAs to the mitochondria
(Eriksson et al. 1996), chloroplast stroma (Mitra et al. 2004), periplasm (Ynalvez et
al. 2008) and the cytoplasm, while all three γ-CAs have been localised to the
mitochondria (Cardol et al. 2005). In comparison, while Symbiodinium have also
been shown to possess both intracellular and extracellular CAs (Yellowlees et al.
1993, Leggat et al. 2000), initial protein studies indicate that the symbiotic
dinoflagellate possesses at least three α-CAs, which can be found in the thylakoid,
pyrenoid, and membrane bound (Marendy, unpublished data). Analysis of an
established expressed sequence tag (EST) library of clade C3 Symbiodinium has also
identified partial gene sequences with some homology to the β-CA gene family
(Leggat et al. 2007). With advances in sequencing technologies, recent genome data
from Symbiodinium minutum clade B1 (Shoguchi et al. 2013) and Symbiodinium
kawagutii clade F (Lin et al. 2015) have now begun to reveal the multiplicity of CA
isoforms in Symbiodinium. For example, analysis of the S. minutum genome revealed
the presence of 14 genes encoding CAs belonging to the α, β, and ζ-CA families. In
S. kawagutii 49 CA genes have been identified (Lin et al. 2015) most of which are
cytoplasmic with only two δ-CAs predicted to be localised to the plasma membrane
and one β-CA localised to the thylakoids (Lin et al. 2015).
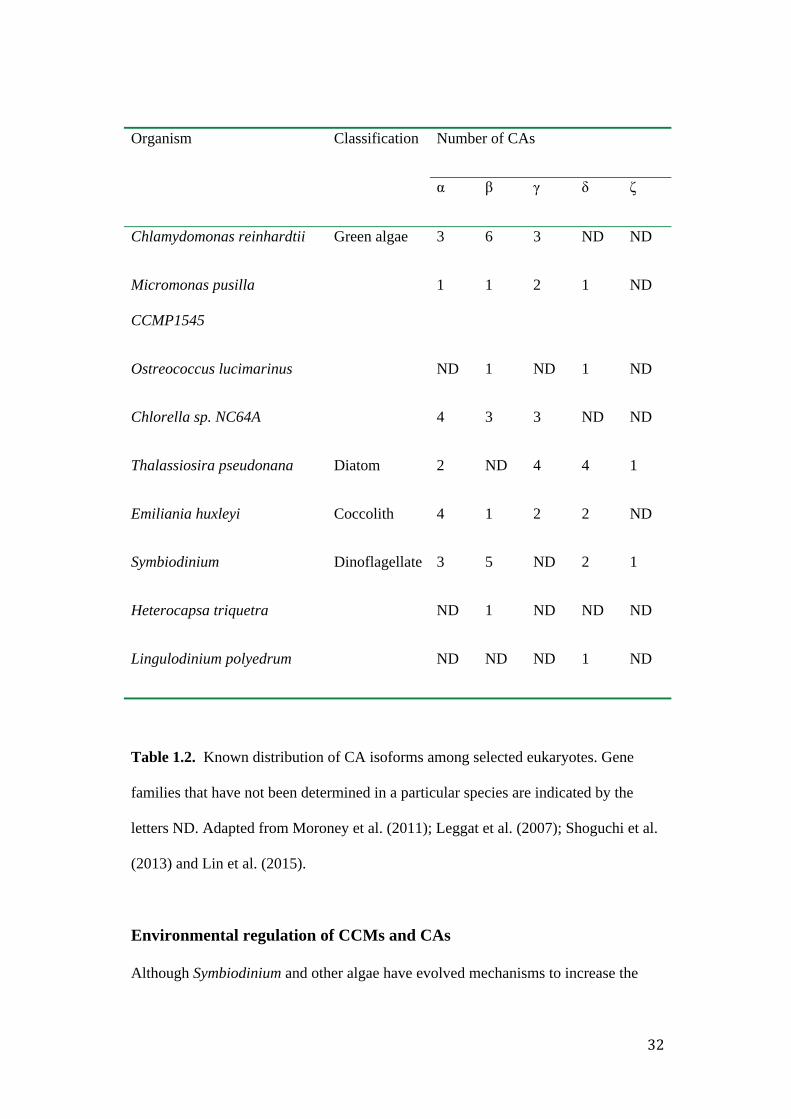
Organism Classification Number of CAs
α β γ δ ζ
Chlamydomonas reinhardtii Green algae 3 6 3 ND ND
Micromonas pusilla
CCMP1545
1 1 2 1 ND
Ostreococcus lucimarinus ND 1 ND 1 ND
Chlorella sp. NC64A 4 3 3 ND ND
Thalassiosira pseudonana Diatom 2 ND 4 4 1
Emiliania huxleyi Coccolith 4 1 2 2 ND
Symbiodinium Dinoflagellate 3 5 ND 2 1
Heterocapsa triquetra ND 1 ND ND ND
Lingulodinium polyedrum ND ND ND 1 ND
Table 1.2. Known distribution of CA isoforms among selected eukaryotes. Gene
families that have not been determined in a particular species are indicated by the
letters ND. Adapted from Moroney et al. (2011); Leggat et al. (2007); Shoguchi et al.
(2013) and Lin et al. (2015).
Environmental regulation of CCMs and CAs
Although Symbiodinium and other algae have evolved mechanisms to increase the

supply of Ci that supports photosynthesis, the capacity of many microalgal cells to
express CCMs and CA is regulated by several environmental factors, including but
not exclusively the concentration of Ci in the surrounding seawater medium (Beardall
et al. 1998). It has become well known that many microalgae are able to adapt
various components of their CCM in response to external Ci concentrations (Coleman
1991, Kaplan and Reinhold 1999). In particular, the CCM activity of cells grown
under air levels of CO2 often leads to the induction of high affinity CCMs and an
increase expression of external CA while growth under enriched CO2 concentrations
causes a decrease in CCM and external CA activity (Shiraiwa and Miyachi 1985). It
has also been demonstrated that in at least some eukaryotic algae there is a complete
loss of CCM expression when cells are grown under extreme CO2 concentrations of >
5% resulting in the reliance on diffusive CO2 transport from the surrounding media to
Rubisco (Giordano et al. 2005, Falkowski and Raven 2007). In several
dinoflagellates, CCMs have also been shown to respond to such changes in carbonate
chemistry (pH values of 8.0 – 9.1 and CO2 concentrations of 370 ppm and 5000 ppm
CO2) by lowered photosynthetic affinities for CO2 (Rost et al. 2006, Ratti et al. 2007)
and/or by the transcriptional regulation of CA, with some isoforms of CA up-
regulated by decreased CO2 concentrations while others are down-regulated (Leggat
et al. 2000, Moroney et al. 2001). The response of CCMs to external Ci
concentrations can also be dependent on a particular carbon species, for example,
HCO3- concentration has been suggested to be the controlling factor governing CCM
expression in cyanobacteria (Mayo et al. 1986) while in some eukaryotes such as
Peridinium gatunense (Berman-Frank et al. 1995) and Chlorella ellipsoidea (Matsuda
and Colman 1995), CO2 appears to be the Ci species that regulates CCM activity.

Aside from external CO2 concentrations, other environmental factors such as,
light intensity and temperature have also been known to control the expression of
various algal CCMs and CAs (Coles and Jokiel 1978, Hoegh-Guldberg and Smith
1989, Al-Khatib and Paulsen 1999, Demmig-Adams and Adams 2000). For example,
it has been demonstrated in C. reinhardtii that light can exert its control on CA
transcript abundance through a photosynthesis-dependant process (Dionisio et al.
1989) and that the operation of a complete photosynthetic apparatus is necessary for
CA and CCM induction (Spencer et al. 1983). One of the major reasons light has this
effect on CCMs is because the operation of the CCM is an active process, driven by
the ATP derived from photosynthesis (Beardall and Giordano 2002). Elevated
temperature has also been shown to inhibit CO2 fixation, either through inactivation
of the carbon fixing enzyme Rubisco or by the impairment of the CCM, with excess
ATP causing a backup in the photosynthetic transport electron transport chain that
increases oxidative stress and can damage photosynthetic proteins (Jones et al. 1998,
Wooldridge 2009, Buxton et al. 2012).
Significance and thesis objectives
Given that it has been well documented that CO2 concentrations affect the activity of
algal CCMs and CAs (Kaplan et al. 1980, Tsuzuki and Miyachi 1989, Raven 1991,
Matsuda et al. 2001), a major concern is that the rapidity of current environmental
change could exceed the evolutionary and or acclimatory capacity of photosynthetic
algal species (Hughes et al. 2003). While the planet has experienced significant
variations in climate in the geological past, the rate at which the present changes are
occurring is extraordinary. Currently, the concentration of atmospheric CO2 is
approximately 400 parts per million (ppm) and is expected to rise to reach between
480 and greater than 1000 ppm by the year 2100, depending on the climate model
used for future projections (IPCC 2013). As atmospheric CO2 is in equilibrium with
CO2 in the surface ocean waters, the higher the concentration of atmospheric CO2, the
greater the amount of CO2 dissolved in the surface ocean. These changes in seawater
carbonate chemistry result in lowered pH levels a phenomenon known as ocean
acidification (OA). In addition to increasing dissolved CO2 in surface ocean waters,
increases in atmospheric CO2 are predicted to result in the rise of sea surface
temperature (SST) with predicted increases of 1 - 3°C likely to occur on the Great
Barrier Reef by the year 2100 (GBRMPA 2011). Elevated SST will in turn cause a
decrease in CO2 solubility and may have important repercussions for photosynthetic
marine algae, including Symbiodinium, to acquire and fix carbon under elevated
global CO2.
Although there is an extensive body of literature on the repression of CCMs
by elevated CO2 concentrations in cyanobacteria and C. reinhardtii (Price and Badger
1989, Sültemeyer et al. 1989, Coleman 1991, Matsuda and Colman 1995, Kaplan and
Reinhold 1999, Giordano et al. 2005, Falkowski and Raven 2007), CCMs and CAs in
Symbiodinium are far less understood. Despite CAs also being identified in
Symbiodinium, there is still a substantial amount of knowledge lacking on how many
CAs Symbiodinium possess, what gene families are represented, their roles in the
CCM and how they are regulated under varied environmental stressors. Given the
importance of algal photosynthesis in the global carbon budget (Field et al. 1998,
Falkowski and Raven 2007) and, in terms of symbiotic relationships, the hosts’
dependency on Symbiodinium for their energy supply (Falkowski et al. 1984), it is
necessary to understand how Symbiodinium CAs and CCMs respond to environmental
changes. The fundamental aim of this thesis is therefore to establish a basis for
understanding what affect global climate change, including increasing atmospheric
CO2 levels, temperature and light availability, will have on the functioning of
Symbiodinium photosynthesis. This was achieved by several objectives:
Objective 1 - The first objective was to identify additional CA enzymes in
Symbiodinium. Emphasis was placed on isolating and characterising these CA
isoforms and examining the expression of these CAs, along with other genes involved
in the photosynthetic pathway, under elevated CO2 concentrations (Chapter 2) to see
if the Symbiodinium CAs identified respond in the same manner as other
photosynthetic algae with CCMs.
Objective 2 - Given that anthropogenic CO2 emissions are leading to rising SSTs, the
combined effects of increased CO2 and temperature on the expression of CA genes
identified from the first chapter were investigated (Chapter 3) along with other
selected genes involved in carbon metabolism. Physiological parameters such as
photosynthetic efficiency, chlorophyll content and cell density were also examined to
link any physiological changes with gene expression patterns.
Objective 3 - As the operation of the CCM and CA activity in some algal species has
been shown to be light-driven, the effect of varied light irradiances on CA expression
and physiological parameters in Symbiodinium were also examined (Chapter 4).
Objective 4 - Lastly, to establish a basis for what processes may be affected by long-
term exposure to elevated CO2 levels in Symbiodinium, the effects of increased pCO2
concentrations on cultured Symbiodinium cells were investigated at the transcriptome
level (Chapter 5).
The findings from these objectives enable a sound basis for global climate
change research on this important alga and will be imperative in understanding the

photosynthetic response of Symbiodinium CAs that are crucial in carbon acquisition
and fixation to a changing global environment.
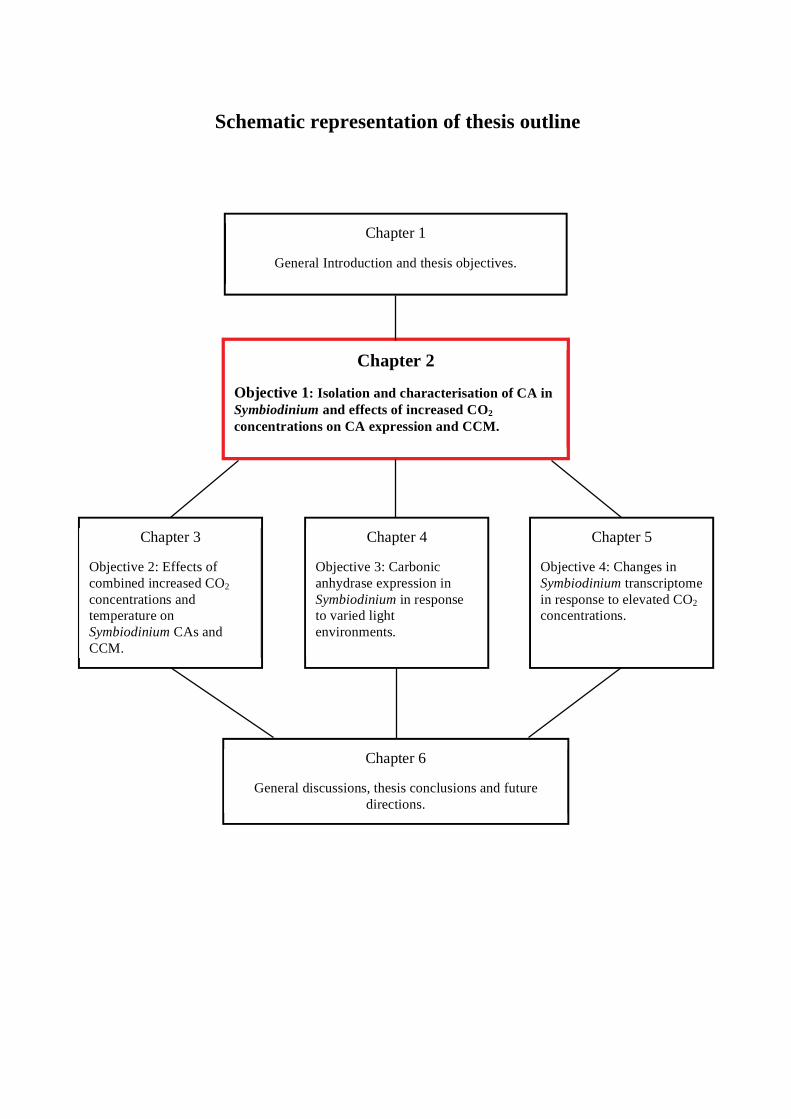
Schematic representation of thesis outline
Chapter 2
Objective 1: Isolation and characterisation of CA in Symbiodinium and effects of increased CO2 concentrations on CA expression and CCM.
Chapter 3
Objective 2: Effects of combined increased CO2 concentrations and temperature on Symbiodinium CAs and CCM.
Chapter 4
Objective 3: Carbonic anhydrase expression in Symbiodinium in response to varied light environments.
Chapter 5
Objective 4: Changes in Symbiodinium transcriptome in response to elevated CO2 concentrations.
Chapter 6
General discussions, thesis conclusions and future directions.
Chapter 1
General Introduction and thesis objectives.
Chapter 2: Identification of β- and δ-class carbonic anhydrase in the
symbiotic dinoflagellate Symbiodinium and response to elevated CO2
concentrations
Statement of purpose
Carbonic anhydrases (CA) are metalloenymes that play key roles in photosynthesis
and the carbon concentrating mechanisms (CCMs) of algae by increasing the
concentration of CO2 around the carbon-fixing enzyme ribulose-1,5-bisphosphate
carboxylase/oxygenase (Rubisco) in a low CO2 environment. CAs belong to various
distinct evolutionary classes, which share no significant amino acid similarity and are
thought to be the result of convergent evolution. It has become well known that the
expression of some algal CCMs and CA is regulated by external CO2 concentrations,
with activity of CA increasing when cells are grown under air levels of CO2 and
decreasing when exposed to 1-5 % partial pressure of CO2 (pCO2) (Price and Badger
1989, Sültemeyer et al. 1989, Matsuda and Colman 1995, Giordano et al. 2005,
Falkowski and Raven 2007). Chapter 2 reports the identification and phylogenetic
characterisation of two novel β-class CA proteins (SymBCA1 and SymBCA2) and a
δ-class CA protein (SymDCA1) from the symbiotic dinoflagellate Symbiodinium. To
elucidate the relationship between the effects of elevated external CO2 concentrations
on Symbiodinium CAs, cells of Symbiodinium clade C1 were exposed to elevated CO2
conditions for a short period of nine days where CA transcript abundance and other
photosynthetic parameters were measured. In addition, transcript abundance of
phosphoglycolate phosphatase (PGPase) and Rubisco were also examined to see if
Symbiodinium CCM responds to changes in external CO2 concentrations as seen in
other algae.
Introduction
Dinoflagellates are a diverse group of eukaryotic algae that occur in both the marine
and freshwater environments, either free-living or in symbiosis with a wide range of
marine protists and invertebrates. Compared to other eukaryotes, dinoflagellates have
several unique characteristics (Morse 1995, Zhang et al. 2007, Hou and Lin 2009): for
example they posses some of the largest known nuclear genomes with many genes
present in multiple, divergent copies and often arrayed in tandemly repeated subunits
(Hou and Lin 2009). In contrast to their large nuclear genomes, the mitochondrial
and plastid genomes are highly reduced which appears to be the result of extensive
gene transfer to the nuclear genome. The nuclear genes of dinoflagellates are also
unique in that a conserved 22-bp spliced leader (SL) sequence of non coding RNA is
added to the 5’ end of each monocistronic mRNA through trans-splicing, which has
been suggested is used to regulate gene expression (Zhang et al. 2007).
Dinoflagellates are also the only oxygenic photoautotrophs with a form II Rubisco
(Morse et al. 1995) which has the lowest known carboxylation:oxygenation
specificity factor among eukaryotic phytoplankton (Whitney and Andrews 1998).
Dinoflagellates belonging to the genus Symbiodinium are primarily known for
their role as mutualistic endosymbionts and are the dominant symbiont found in
corals. When in symbiosis these unicellular algae reside in the gastroderm of the
cnidarian host where they translocate photosynthetically fixed products to the host
that can account for up to 95% of the host’s energy requirements (Falkowski et al.
1993). However, whether in symbiosis or free-living, one of the major factors
effecting photosynthesis in Symbiodinium is the supply of inorganic carbon (Ci). Ci
in seawater exists in three forms: CO2, HCO3- and CO3
2- and although free-living
Symbiodininium live in an environment with a relatively large and constant pool of Ci

(~2.2 mM), the relative concentrations of the individual carbon species depends on
the seawater pH. At ambient pH (pH 8.2) greater than 99% of the Ci content is in the
form of non-membrane permeable HCO3- while CO2, the carbon species required by
Rubisco, constitutes less than 1%. The CO2 availability in seawater required to
support photosynthesis is further reduced because of the low CO2 diffusion rate and
slow conversion rate between HCO3– and CO2. To avoid carbon limitation in
photosynthesis many photosynthetic algae, including Symbiodinium, induce a carbon-
concentrating mechanism (CCM) (Leggat et al. 2002) that functions to increase the
concentration of CO2 at the active site of Rubisco. Carbonic anhydrases (CA) are
metalloenzymes that are ubiquitous in CCMs and rapidly catalyse the interconversion
of CO2 and HCO3-. The enzyme can be found extra- or intra-cellularly where its
function differs depending on localisation. Generally, external CAs have been shown
to prevent CO2 limitation by ensuring a high rate of CO2 supply to the cell while
internal CAs ensure high rate CO2 supply to Rubisco by rapid dehydration of the
HCO3- pool accumulated in the chloroplast (Kaplan and Reinhold 1999).
Currently six different CA gene families have been characterised (α, β, γ, δ, ζ,
and η), all of which have evolved independently and show little sequence homology
(HewettEmmett and Tashian 1996). The three major families (α, β and γ) are present
in higher plants, algae and cyanobacteria. The δ-CAs have been found in diatoms and
in the dinoflagellate Lingulodinium polyedruma (Roberts et al. 1997, Lapointe et al.
2008). The ζ-class appears to be confined to diatoms and currently the η-class is
restricted to the genus Plasmodium. The β-CAs however appear to be more diverse in
sequence, distribution and quaternary structure than any of the other classes (Smith et
al. 2000, Zimmerman and Ferry 2008). The active site of β-CAs is composed of a
zinc atom that is coordinated to one histidine and two cysteine residues and also

contain a highly conserved dyad consisting of an aspartate and arginine residue that is
crucial for catalysis (Smith et al. 2002). The β-CA’s are usually active as dimers or
multimers (Kimber and Pai 2000, Smith et al. 2000, Strop et al. 2001). Based on
sequence identity, β-CAs can be further divided into six different subgroups with the
plant sequences forming two groups representing dicotyledonous and
monocotyledonous plants (Smith and Ferry 1999, Smith et al. 1999) while the
remaining non-plant sequences separating into four distinct clades (A – D).
CAs have been reported in many photosynthetic organisms (Fukuzawa et al.
1992, Funke et al. 1997, Karlsson et al. 1998, Satoh et al. 2001) where the enzymes’
primary function in the CCM is to facilitate the acquisition and fixation of Ci under
low CO2 conditions for efficient photosynthesis (Badger 2003). It is also well
documented that the expression of the majority of algal CCMs is regulated by external
partial pressure of CO2 (pCO2) concentrations (Coleman 1991, Kaplan and Reinhold
1999), with activity of CA increasing when cells are grown under air levels of CO2
and decreasing when exposed to 1-5 % pCO2 (Price and Badger 1989, Sültemeyer et
al. 1989, Matsuda and Colman 1995, Giordano et al. 2005, Falkowski and Raven
2007).
Initial studies on Symbiodinium have identified both external and internal CAs
(Yellowlees et al. 1993, Leggat et al. 1999), with protein studies identifying at least
three α-class CAs that were localised to the thylakoid, pyrenoid and membrane bound
(Marendy, unpublished data). However, the full diversity of Symbiodinium CAs and
their role in the CCM are currently not entirely known. While there are also numerous
studies on the response of alga CCMs to external CO2 concentrations, most of the
current understanding has been elucidated primarily from freshwater cyanobacteria
(Badger and Price 1992, Badger and Price 2003) and the green alga Chlamydomonas
reinhardtii (Moroney and Ynalvez 2007, Spalding 2007, Yamano and Fukuzawa
2009, Wang et al. 2011). To date there is no substantial data on the effects of CO2
concentrations on CA gene expression in Symbiodinium.
Since elevated CO2 concentrations have been shown to reduce the activity of
CCMs and related enzymes such as CAs, it is expected to down-regulate the capacity
of the CCM if cells are acclimated to high CO2 levels. This may have important
repercussions for the ability of Symbiodinium to acquire Ci under elevated
atmospheric CO2 (Beardall and Raven 2004), which is predicted to increase 50 – 200
ppm within 50 years depending on the emissions scenario (IPCC 2013) . Therefore
the present study identified and characterised CAs from the β- and δ-class and
investigate through real-time quantitative polymerase chain reaction (RT-qPCR) CA
transcript abundance of Symbiodinium in response to elevated CO2 concentrations.
Material and Methods
Symbiodinium genotype
Symbiodinium genotype was confirmed through sequencing of the internal transcribed
spacer 2 region (ITS2). Genomic DNA was isolated using a DNeasy Plant Mini kit
(Qiagen, Valencia USA). Harvested cells re-suspended in 400 μL buffer AP1 with 4
μL RNase A stock solution were transferred to a Lysing Matrix A tube (MP
Biomedicals, Australia) and lysed twice for 20 s at 4.0 ms-1 on a FastPrep®-24
Instrument (MP Biomedicals, Australia). The lysate, including cell debris, was
transferred to a 1.5 μL microcentrifuge tube and DNA extracted according to
manufacturer’s protocol. Elution with 50 μL of buffer AE was performed rather than
100 μL to increase DNA concentration. The ITS 2 region was amplified using the
forward primer ITSintfor2 (5’GAATTGCAGAACTCCGTG-3’) (LaJeunesse and
Trench 2000) and reverse primer ITS2-Reverse
(5’GGGATCCATATGCTTAAGTTCAGCGGGT-3’) (Coleman et al. 1994)
following the protocol of LaJeunesse (LaJeunesse 2002). Purified reaction product
was directly ligated into pGEM-T Vector (Promega, USA) and transformed into
NM522 cells (see Appendices for methods on NM522 cell preparation, ligation and
transformation protocols) and multiple clones sequenced at the Australian Genome
Research Facility (AGRF) using the forward primer M13F
(5’GTTTTCCCAGTCACGAC-3’) and reverse primer M13R
(5’CAGGAAACAGCTATGAC-3’).
CA sequencing
Two partial β-CA sequences were obtained from a Symbiodinium sp. clade C3
Expressed Sequence Tag (EST) library (Leggat et al. 2007). Specific primers were
designed to theses putative β-CA sequences using the software primer select
(Lasergene 8) and were tested for compatibility against complimentary DNA (cDNA)
isolated from cultured Symbiodinium C1. cDNA was prepared as follows:
approximately 6-10 x 106 cultured cells were harvested for total RNA extraction.
Cells were pelleted by centrifugation at 4500 g for 2 minutes and excess media was
discarded. The resulting pellet was then re-suspended by adding 450 µl ice cold RLT
buffer containing β-mercaptoethanol (RNeasy Plant Mini Kit, Qiagen, Australia) and
pipetted into RNA lysing matrix D tubes (MP Biomedicals, Australia) to be lysed on a
MP fastprep ® -24 for 40 seconds at 4.0 ms-1 (MP Biomedicals, Seven Hills, NSW,
Australia). The resulting lysate and cell debri were transferred to a Qiashredder spin
column and RNA extracted using RNeasy plant mini kit (Qiagen, Australia) protocol
including any additional centrifuge and elution steps. RNA yield was quantified
using a NanoDrop-1000 Spectrophotometer (Nanodrop Technologies, Wilmington,
De, USA). cDNA amplification and genomic DNA (gDNA) elimination were
performed with QuantiTect Reverse Transcription Kit (Qiagen, USA) in a 20 μL
reaction using 500 ng of total RNA as template and a RT primer mix consisting of
random primers and oligo-dT. Negative controls prepared without total RNA as
template were included for each series of reaction.
DNA amplification was performed by polymerase chain reaction (PCR) with
Platinum® Taq DNA polymerase (Invitrogen, Australia) using the following
conditions: an initial cycle of 2 min at 94°C, followed by 35 cycles of 20 s at 94°C, 20
s at a gradient range of 50-62°C, 2 min at 72°C with a final holding temperature of
4°C. Resulting products were ligated into pGEM®-T Vector System (Promega, USA)
and used to transform NM522 cells (see Appendices for methods). Plasmids were
isolated using Macherey – Nagel Nucleospin® Plasmid kit (Scientifix, Australia) and
were sequenced at Macrogen Inc. Korea. The resulting nucleotide sequences were
trimmed and assembled using Lasergene® v8.0 (DNAStar Inc, Madison, USA).
Symbiodinium CA sequences were identified based on transcript (blastN) and protein
(blastX) similarity searches using NCBI databases and gene specific primers designed
to the resulting consensus sequences using DNAStar Lasergene® v8.0 software
PrimerSelect (USA).
To obtain the remaining 5’ region, nested PCR was performed using internal
primers and the 22 nucleotide 5’ trans-spliced leader (SL) sequence common to all
dinoflagellate mRNA (Zhang et al. 2007). All ligations and sequencing were
performed as previously described. In addition to the β-CA sequences, a δ-CA
sequence was obtained from an illumina transcriptome (Chapter 5) and was used to

design primers for RT-qPCR analysis. CBS prediction server (Nielsen et al. 1997,
Emanuelsson et al. 2000) was used to predict cellular locations of the Symbiodinium
CAs.
Phylogenetic analysis
Multiple sequence alignment of SymBCA1, SymBCA2 and SymDCA1 was
constructed using the multiple sequence alignment program MAFFT (Katoh and
Standley 2013) and edited using the multiple alignment editor Jalview 2.5.1
(Waterhouse 2009). Each domain of SymBCA1 and SymBCA2 was treated as
individual sequences. Phylogenetic and molecular evolutionary analyses were
conducted using MEGA version 5 (Tamura et al. 2011), maximum likelihood and
bootstrapped 10 000 times.
Cell culture and experimental conditions
Cultures of Symbiodinium C1 (CCMP2466) were obtained from The Provasoli-
Guillard National Center for Culture of Marine Phytoplankton (CCMP), Bigelow
Laboratory for Ocean Sciences (Maine USA). This particular phylotype was chosen
based on previous studies identifying clade C to dominate zooxanthellate corals (Lien
et al. 2012), with subclade C1 being the most commonly found species amongst many
host species (Wong et al. 2016). Cells were grown in a controlled refrigerated
incubator (Thermoline Scientific, Australia) on a 12:12 h light/dark photoperiod cycle
at 25 ºC under a photon flux density of 90-100 µE m-2 s -1 in tissue culture flasks
(Sarstedt, NC, USA) containing ASP-8A medium (Blank 1987) (see Appendices
Tables 1-3). For experimental purposes, cells were divided equally into a total of three
flasks for each of the four experimental treatments: (1) 400 parts per million CO2
(ppm; control), (2) 550 ppm, CO2 (3) 750 ppm CO2 and (4) 10 000 ppm CO2. The
experiment started with cells in log-phase growth to avoid age-dependent response.
All treatments were subjected to a constant temperature of 25 ºC. Modified CO2
levels were achieved by a CO2 mixing system based on the design of Munday et al
(2009) where pure CO2 was mixed with air and pumped into each incubator. CO2
was measured using a datalogging CO2 meter (Vaisala GM70D4A1M0A0B).
Experimental conditions were maintained and monitored for 9 days with samples
taken on day 0, 3, 6, 9. pH measurements were also taken on each sampling day prior
to harvesting of cells.
mRNA isolation and cDNA synthesis
Approximately 6 x 10⁶ cells were collected and centrifuged at 5000 g for 2 min,
supernatant discarded and snap frozen in lysing matrix D tubes (MP Biomedicals,
Australia) containing 400 µl of ice cold Dynabead lysis buffer (Dynabeads ® mRNA
DIRECTTM kit, Invitrogen, Norway) for later mRNA extraction. After brief thawing
on ice cells were lysed using a MP Fastprep®-24 Instrument (MP Biomedicals,
Australia) at 4.5 M s-1 for 3 x 45 seconds and resulting lysate transferred to a
microcentrifuge tube containing 100 µl of pre-washed Dynabeads oligo (dT)25 and
allowed to anneal for 5 min on a rotation vortex at approximately 900 rpm. The tube
containing the lysate was then placed on a magnetic column for 10 min, supernatant
discarded and the resulting pellet washed twice with 600 µl of wash buffer A,
returning the tube to the magnetic column for 30 sec after each wash to remove
supernatant. The sample and beads were then resuspended in 300 μl of washing buffer
B and transferred to a new RNase-free microcentrifuge tube, returned to the magnet
for 2 min before repeating the wash step. mRNA was eluted from the beads by
adding 22 µl of ice cold 10 mM Tris-HCl (pH 7.5) and transferred to a 0.6 ml tube
and heated for 2 min at 80 °C in a PTC-200 DNA engine, programmable thermal
cycler (MJ Research, Inc) then placed on ice to chill. The tube was then placed on the
magnetic column for 30 sec and eluted mRNA transferred to a new tube and
quantified spectrophotometrically RNA-40 setting on a NanoDrop-1000 (NanoDrop
Technologies, Wilmington USA).
Prior to reverse transcription, DNase treatment of all mRNA was performed to
eliminate genomic DNA contamination. Approximately 100 ng of mRNA was
treated with RQ1 RNase-Free DNase (Promega) in a total volume of 9 μl (see
Appendices Table 4). Following incubation of the DNase digestion reaction at 37 ºC
for 30 min, 1 µl of RQ1 DNase Stop Solution was added to each digest and incubated
further at 65 ºC for 10 min to inactivate the DNase and terminate the reaction.
cDNA was reversed transcribed from DNase treated mRNA using the
SuperScriptTM III First-Strand Synthesis SuperMix for qPCR (Invitrogen). The 2X
RT Reaction Mix contained the following components of oligo (dT)20 (2.5 µM),
random hexamers (2.5 ng/μl), 10 nM MgCl2, and dNTPs (1 mM each) (see
Appendices Table 5 for reaction volumes). The cDNA synthesis reaction was then
incubated at 25 ºC for 10 min followed by a second incubation step at 50 ºC for 30
min before being terminated at 85 ºC for 5 min. The cDNA synthesis reaction was
then chilled on ice before 1 µl of Escherichia coli RNase H (2U) was added and
incubated at 37 ºC for 20 min. The resulting cDNA was then either used immediately
for RT-qPCR or stored at -20 ºC for later use.

RNA transcript analysis by quantitative-PCR
Quantitative PCR (qPCR) was used to measure RNA transcription levels of various
genes of interest (GOI). Primers were designed for the two β-CA Symbiodinium genes
along with one δ-CA gene, phosphoglycolate phosphatase (PGPase) and Rubisco
using the software primer select (Lasergene 8) (Table 2.1). In addition, candidate
Symbiodinium normalisation genes, glyceraldehyde-3-phosphate dehydrogenase
(GAPDH) (Jurca et al 2008), cyclophilin (Cyc) and S4 ribosomal protein (Rp-S4)
(Rosic et al. 2011) were considered for use as reference genes to compare relative
expression of GOI. Validation for use as reference genes in this experiment was
performed across all treatments using GeNorm in the qBase plus software package
(Biogazelle) with M values of 0.5 or lower deemed acceptable.
The efficiency of each gene-specific primer was determined by serial dilutions
ranging from 1:10 to 1:160. A 1:80 cDNA dilution was optimal for all primer sets. A
total volume of 15 µl containing 7.5 µl SYBR® GreenERTM qPCR SuperMix
Universal (Invitrogen, USA), 3.5 µL of a 1 µM primer mix containing forward and
reverse primers for each GOI, and 4 µL of 1:80 diluted cDNA template were used.
Non-template controls (NTC) were also used and included 4 µL Ultra-pure GIBCO
water instead of template cDNA. All reactions were pipetted by a CAS-1200 robot
(Corbett Life Science, Australia) in triplicate and quantification performed by Rotor-
gene™ 6000 (Corbett Life Science, Australia) with the following temperature profile:
a 2 minute holding step at 50 °C, denaturation step at 95 °C for 10 minutes, 35 cycles
of 95 °C for 15 s and 66 °C for 60 s, followed by a melt curve from 60 °C to 95°C to
check reaction specificity. A single distinct peak in the melt curve indicated
amplification of a single product.

Calibrated normalised relative quantities (CNRQ), the relative gene expression
values for GOIs, were calculated using qBASEplus software package (Biogazelle).
All expression values were represented as the CNRQ of GOI in treatment, relative to
control level expression for that GOI for each day.
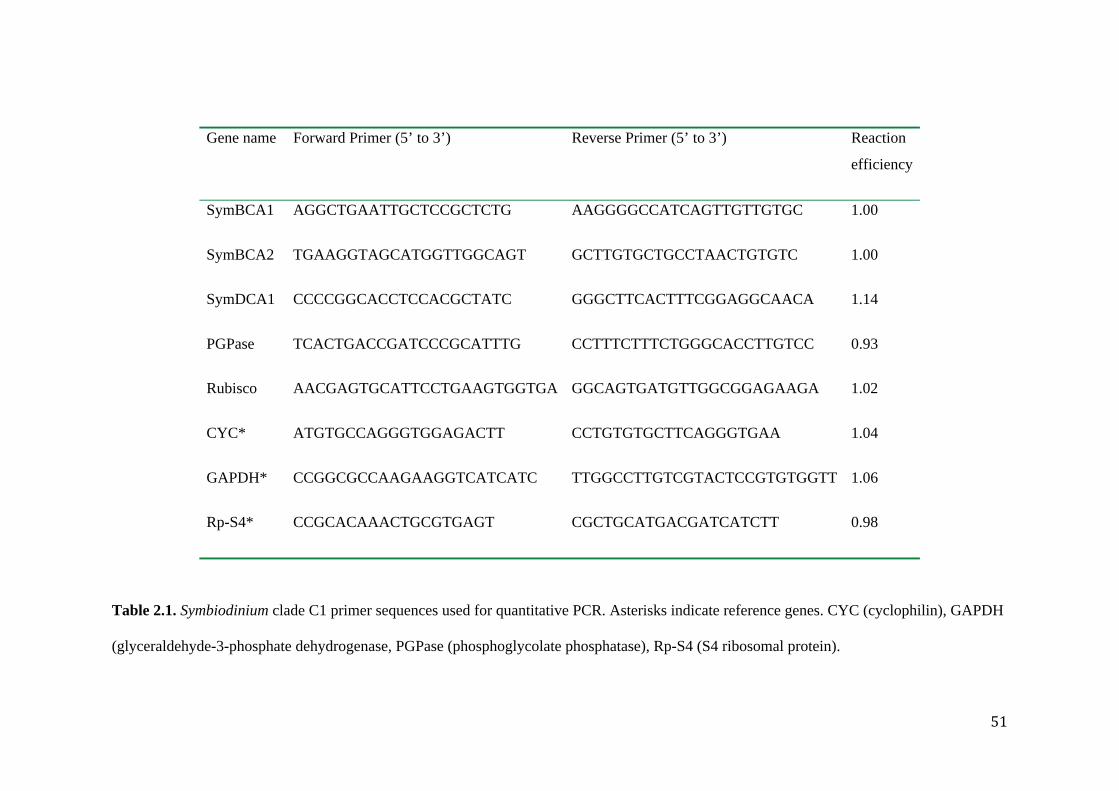
Gene name Forward Primer (5’ to 3’) Reverse Primer (5’ to 3’) Reaction
efficiency
SymBCA1 AGGCTGAATTGCTCCGCTCTG AAGGGGCCATCAGTTGTTGTGC 1.00
SymBCA2 TGAAGGTAGCATGGTTGGCAGT GCTTGTGCTGCCTAACTGTGTC 1.00
SymDCA1 CCCCGGCACCTCCACGCTATC GGGCTTCACTTTCGGAGGCAACA 1.14
PGPase TCACTGACCGATCCCGCATTTG CCTTTCTTTCTGGGCACCTTGTCC 0.93
Rubisco AACGAGTGCATTCCTGAAGTGGTGA GGCAGTGATGTTGGCGGAGAAGA 1.02
CYC* ATGTGCCAGGGTGGAGACTT CCTGTGTGCTTCAGGGTGAA 1.04
GAPDH* CCGGCGCCAAGAAGGTCATCATC TTGGCCTTGTCGTACTCCGTGTGGTT 1.06
Rp-S4* CCGCACAAACTGCGTGAGT CGCTGCATGACGATCATCTT 0.98
Table 2.1. Symbiodinium clade C1 primer sequences used for quantitative PCR. Asterisks indicate reference genes. CYC (cyclophilin), GAPDH
(glyceraldehyde-3-phosphate dehydrogenase, PGPase (phosphoglycolate phosphatase), Rp-S4 (S4 ribosomal protein).

Imaging – pulse amplitude modulated fluorometry
Imaging – pulse amplitude modulated (iPAM) fluorometry (MAXI Imaging – PAM,
Walz, Germany) was used to analyse the photosynthetic efficiency of Symbiodinium
cells. Three replicate samples from each treatment were used, except on day 6 in the
550 ppm CO2 treatment where one sample was omitted to due to a failed reading on
the PAM instrument. Symbiodinium cells (≈1.6 x 10⁶) were pelleted for 2 min at 4500
g then resuspended in 300 µl of ASP-8A media, transferred to a 96 well plate and
dark adapted for 30 min. Dark-adapted yield and maximal fluorescence were
determined using a weak pulse of light, followed by a saturating pulse of 2,700 μmol
quanta m−2 s−1 of photosynthetically active radiation (PAR) for 800 ms. Induction
recovery curves were performed by exposing cells to fifteen saturation pulses of
photosynthetically active radiation (2800 µmol quanta m-2 s-1) over a 5 min period
with a pulse – modulated actinic light set to 111 µmol quanta m-2 s-1. The induction
phase was then followed by a dark recovery period of 14 min consisting of 16
measuring light pulses, which were used to determine photo-kinetic parameters such
as effective quantum yield. Data from induction/recovery curves were used to
determine photokinetic parameters, such as effective quantum yield (Fv/Fm). Fv/Fm
was used as a proxy to determine the effect of increased CO2 concentrations on
photosynthetic efficiency of photosystem II (PSII) of Symbiodinium.
Statistical analysis
Data analysis was performed using statistical software package SPSS (IBM) version
19.0. A generalised linear model (GLM) was applied with a standard ANOVA and
sequential Bonferroni post-hoc (α<0.05) to determine significant differences between
treatments and control. CO2 and day were set as fixed factors and CO2 X day as an
interaction. Flasks were treated as a random factor.
Results
Identification of SymBCA1 and SymBCA2 β-class Symbiodinium CAs
From the partial gene sequences obtained from the Symbiodinium clade C3 EST
library, two β-CA genes were identified in Symbiodinium. These sequences were
named SymBCA 1 and 2. SymBCA1 encodes a protein of 744 amino acids with a
molecular mass of 78 kDa while SymBCA2 encodes a 483 amino acid product with a
molecular weight of 51 kDa. Based on NCBI database searches both translated
protein sequences were found to encode polyproteins containing multiple subunits
within the one transcript (Figure 2.1a and b). The full-length transcript containing a
start codon preceded by a 5’ untranslated region was obtained for SymBCA1 and
shown to contain three subunits within the one transcript (Figure 2.1). Each sub-unit
of SymBCA1 was separated by a spacer region, which contained a conserved LPPS
motif (Figure 2.2). Subunits two and three showed the highest similarity at the amino
acid level (63%) followed by subunits one and two and sub-units three and one (61%
and 59% respectively).
SymBCA2 was found to contain two subunits also separated by a spacer
region (Figure 2.1b) however the conserved LPPS motif seen in the spacer regions of
SymBCA1 was not identified for SymBCA2 (Figure 2.2). The two domains of
SymBCA2 displayed a 52% identity at the protein level. Although no start codon was
identified for SymBCA2, a 10 amino acid putative leader sequence was identified
which may either be part of a N-terminal signal sequence or the 3’ end of a third

domain (Figure 2.2). Based on CBS prediction server (Nielsen et al. 1997,
Emanuelsson et al. 2000), both SymBCA1 and SymBCA2 protein sequences did not
contain any transit peptide sequence and predicted that both proteins were located in
the cytosol.
a.
Figure 2.1. Schematic Representation of SymBCA1 and SymBCA2 polyproteins. (a)
SymBCA1 protein showing the three sub-units (SymBCA1-D1, SymBCA1-D2 and
SymBCA1-D3) separated by spacer regions and, (b) SymBCA2 protein showing dual
domains (SymBCA2-D1 and SymBCA2-D2) separated by a spacer region.
Multiple sequence alignment of all sub-units of SymBCA1 and SymBCA2
with other known β-type CAs indicates the conservation of the two cysteine and one
histidine residue required for zinc coordination in the β-class (Figure 2.2).
Interestingly, although the conserved aspartate and arginine dyad is present in all sub-
SymBCA2-D1
3’ 5’
Spacer region
SymBCA2-D2
3’ SymBCA1-D2 SymBCA1-D3 SymBCA1-D1
5’
Spacer region
5’

units of SymBCA1, this dyad is only found in the C-terminal sub-unit of SymBCA2
with the arginine residue substituted with glutamine (Gln/Q) in the N-terminal domain
of SymBCA2. All sub-units of the two Symbiodinium β-CA sequences were shown to
have the greatest homology to the dinoflagellate Heterocapsa triquetra.

Figure 2.2. Alignment of SymBCA1 and SymBCA2 domains with other known β-
CA proteins. Black shading represents >80% conservation, dark grey >60% and light
grey >40%. Active site residues are indicated with asterisks and the aspartic and
arginine pair conserved in all sequences except SymBCA2-D1 indicated with a cross
(+). The conserved LPPS motif in the spacer regions of all domains of SymBCA1 is
boxed.
Arabidopsis_thaliana_CAH2Pisum_sativumZea_maysPorphyridium_purpureum_NPorphyridium_purpureum_CEcoli_P36857Heterocapsa_triquetraChlamydomonas_reinhardtiiSymBCA2-D1SymBCA2-D2SymBCA1-D1SymBCA1-D2SymBCA1-D3Salmonella_enterica
Arabidopsis_thaliana_CAH2Pisum_sativumZea_maysPorphyridium_purpureum_NPorphyridium_purpureum_CEcoli_P36857Heterocapsa_triquetraChlamydomonas_reinhardtiiSymBCA2-D1SymBCA2-D2SymBCA1-D1SymBCA1-D2SymBCA1-D3Salmonella_enterica
Arabidopsis_thaliana_CAH2Pisum_sativumZea_maysPorphyridium_purpureum_NPorphyridium_purpureum_CEcoli_P36857Heterocapsa_triquetraChlamydomonas_reinhardtiiSymBCA2-D1SymBCA2-D2SymBCA1-D1SymBCA1-D2SymBCA1-D3Salmonella_enterica
Arabidopsis_thaliana_CAH2Pisum_sativumZea_maysPorphyridium_purpureum_NPorphyridium_purpureum_CEcoli_P36857Heterocapsa_triquetraChlamydomonas_reinhardtiiSymBCA2-D1SymBCA2-D2SymBCA1-D1SymBCA1-D2SymBCA1-D3Salmonella_enterica
Arabidopsis_thaliana_CAH2Pisum_sativumZea_maysPorphyridium_purpureum_NPorphyridium_purpureum_CEcoli_P36857Heterocapsa_triquetraChlamydomonas_reinhardtiiSymBCA2-D1SymBCA2-D2SymBCA1-D1SymBCA1-D2SymBCA1-D3Salmonella_enterica
Arabidopsis_thaliana_CAH2Pisum_sativumZea_maysPorphyridium_purpureum_NPorphyridium_purpureum_CEcoli_P36857Heterocapsa_triquetraChlamydomonas_reinhardtiiSymBCA2-D1SymBCA2-D2SymBCA1-D1SymBCA1-D2SymBCA1-D3Salmonella_enterica
6753384231
283611111
21
- Y E D A I E A L K K L L I E K D D - - L K D V A A A K - - - - - - - - - - - - - - - - - - - - - - - - - - V K K I T - - - - A - - E L Q A- Y D E A I E E L Q K L L R E K T E - - L K A T A A E K - - - - - - - - - - - - - - - - - - - - - - - - - - V E Q I T - - - - A - - Q L G T- E G E A V H R Y P H L V T P S E P E A L Q P P P P P S K - - - - - - - - - - - - - - - - A S S K GMD P T V E R L K - - - - S - - G F Q K- - - - VM S D L E K K F I E L E A K L V A - - - - - - - - - - - - - - - - - - - - - - - - - - - - - - - - - - - - - - - - - - - - - - - -- - - - - E S E L D S T M E K L T A E L V Q - - - - - - - - - - - - - - - - - - - - - - - - - - - - - - - - - - - - - - - - - - - - - - - -- - - - - MK D I D T L I S - - - - - - - - - - - - - - - - - - - - - - - - - - - - - - - - - - - - - - - - - - - - - - - - - - - - - - - -- - - V T A E D F E V R E V Y E A R T T K S - - - - - - - - - - - - - - - - - - - - - - - - - - - - - P - A V P P E E - - - - - - - - - - -- - A Q R A A A L G G A S A V N K G C A C - - - - - - - - - R C G R V A CMG A CM P MR H L H A H P N P P S D P D Q - - - - - - - - - - -- - - MD C C C A F L R P I P D S Q K R I S - - - - - - - - - - - - - - - - - - - - - - - - - - - - - I R D A E P A E R D P T V T V E D V S- - - - - - - - - - - R T A S D S W - - - - - - - - - - - - - - - - - - - - - - - - - - - - - - - - - - - - M T A K Q - - - - - - - - - - -- - - MA S S S R N V R T T A D A P - - - - - - - - - - - - - - - - - - - - - - - - - - - - - - - - - - - - M P P D E - - - - - - - - - - -- - - - - R G E H G V R T T V D S A - - - - - - - - - - - - - - - - - - - - - - - - - - - - - - - - - - - - V P A E E - - - - - - - - - - -- - - - - - - - - - - R T T T D G P - - - - - - - - - - - - - - - - - - - - - - - - - - - - - - - - - - - - L P S Q E - - - - - - - - - - -- - - V S A L S V T G L A A L S V P T I S F - - - - - - - - A A S - - - - - - - - - - - - - L S K E E R D GM T P D A - - - - - - - - - - -
4111080
10240105484391321191356
- - - - - - - - A S S S D S K S - - F D P V E R I K E G F V T F K K E K Y E T N P A L Y G E L A K G Q S P K YMV F A C S D S R V C - - P S- - - - - - - - T S S S D G I P K - S E A S E R I K T G F L H F K K E K Y D K N P A L Y G E L A K G Q S P P F MV F A C S D S R V C - - P SF K - - - - - - T E V Y D K K P E L F E P L K S G Q S G F Q Q F K V N V Y D K K P E L F G P L K S G Q A P K YMV F A C S D S R V C - - P S- - - - - - - - - - - - Q P A G Q A V P G K S N I F A N N E AWR Q E M L K Q D P E F F N R L A N G Q S P E Y L W I G C A D S R V P - - A N- - - - - - - - - - - - Q T P G K L K E G A N R V F V N N E NWR Q KM L K Q D P Q F F S K L A H T Q T P E I L W I G C A D S R V P - - A N- - - - - - - - - - - - - - - - - - - - - - - - - - - N N A L WS KM L V E E D P G F F E K L A Q A Q K P R F L W I G C S D S R V P - - A E- - - - - - - - - - - - - A L R L L Q E G N A R Y T K A N N T V V R K G L A E Q R K Q L V E Y G - - Q K P MA V V F G C A D S R A P - - I D- - - - - - - - - - - - - A L E Y L R E G N K R F V N N K P H D S H P T R N L D R V K A T A A G - - Q K P F A A F L S C A D S R V P - - V EP V R T G - - - A D A R A S I R L L K E G N T R F T S G N - T L R K T T N D T MR K E L - E I A - - E A P H C A I I G C A D S Q V P - - L E- - - - - - - - - - - - - A L E V L K E G N S R F V L G T - P L A K A A D D QMR E A L V N Q G - - Q A P H T A V L G C A D S R V P - - V D- - - - - - - - - - - - - A L K L L K E G N A R F I K G E - P T A T R T N E KMR Q E L V DMG - - Q A P H T A I I G C A D S R A P - - L E- - - - - - - - - - - - - A L KM L K A G N E R F A V G A - P L A K H A T L KMR E A L V S H G - - Q A P H T A I L G C A D S R V P - - V D- - - - - - - - - - - - - A L K L L K E G N A R F T S G A - A I S G K I T P AMR K A L V K E G - - Q A P H T A I I G C A D S R A P - - L E- - - - - - - - - - - - - V I E H F K Q G N L R F R E N R P A K H D - - - Y L A Q K R N S I A G - - Q Y P A A V I L S C I D S R A P - - A E
991691421589651
10713710065737165
106
H V L D F H P G D A F V V R N I A NMV P P F D - - - - - K V K Y A G - - V G A A I E Y A V L H L K V E N I V V I G H S A C G G I K G L M SH V L D F Q P G K A F V V R N V A N L V P P Y D - - - - - Q A K Y A G - - T G A A I E Y A V L H L K V S N I V V I G H S A C G G I K G L L SV T L G L Q P G E A F T V R N I A AMV P G Y D - - - - - K T K Y T G - - I G S A I E Y A V C A L K V E V L V V I G H S C C G G I R A L L SQ L L D L P A G E V F V H R N I A N Q C I H S D - - - - - - I S F L S - - - - - V L Q Y A V Q Y L K V K H I L V C G H Y G C G G A K A A L GQ I I N L P A G E V F V H R N I A N Q C I H S D - - - - - - M S F L S - - - - - V L Q Y A V Q Y L K V K R V V V C G H Y A C G G C A A A L GR L T G L E P G E L F V H R N V A N L V I H T D - - - - - - L N C L S - - - - - V V Q Y A V D V L E V E H I I I C G H Y G C G G V Q A A V ET I F D A L P G D L F I L R N A G N T C T R A E - - - - - - G S MV G - - - - - S I E Y A I S H L D S K L I L V L G H T K C G A I A G A T KI I F D Q G F G D V F V T R V A G N - - - I V T - - - - - - N E I T A - - - - - S L E F G T A V L G S K V L MV L G H S A C G A V A A T MNT I F D S S P G D I F A L R N A G N T C T H A E - - - - - - G S MV G - - - - - S L E F C I S K L K S R L I L V L G H T H C S A V Y G A T KI I F D AM P G DM F V L R N A G N T C T H A E - - - - - - G S M L G - - - - - S L E F C A S K L G S K L I L V L G H T N C S A L T G A A QT I F D A L P G D I F V L R N A G N T C T H A E - - - - - - G S MV G - - - - - S L E F C T G K L G A RM I L V L G H T K C G A V Y G A T NT V F D AM P G D L F V L R N A G N X C T H A E - - - - - - G S MV G - - - - - S L E F C C G K L G S K L I L VMG H T K C G A I A G A T AT V F D AM P G D I F V L R N A G N T C T H A E - - - - - - G S V L G - - - - - S L E F C V A A L Q S KMV L V L G H T A C G A I K G A T AI V L D A G I G E T F N S R V A G N - - - I S N - - - - - - R DM L G - - - - - S M E F A C A V A G A K V V L V I G H T R C G A V R C A I D
162232205217155110166193159124132130124162
F P L - - - - - - - - - - - D G N N S T D - - - - - - - - - F I E DWV K I C L P A K S K V L A E S E S S - - - - - A F E D Q C - - G R C EF P F - - - - - - - - - - - D G T Y S T D - - - - - - - - - F I E E WV K I G L P A K A K V K A Q H G D A - - - - - P F A E L C - - T H C EL Q D - - - - - - - - - - - G A A Y T F H - - - - - - - - - F V E DWV K I G F I A KMK V K K E H A S V - - - - - P F D D Q C - - S I L E- - - - - - - - - - - - - - - - D S R L G - - - - - - - - - L I D NWL R H I R D V R RMN A K Y L D K C - - - - - K D G D E E - L N R L I- - - - - - - - - - - - - - - - D S R L G - - - - - - - - - L I D NWL R H I R D V R R H N Q A E L S R I - - - - - T D P K D S - L N R L I- - - - - - - - - - - - - - - - N P E L G - - - - - - - - - L I N NWL L H I R D I WF K H S S L L G E M - - - - - P Q E R R - - L D T L CT M L A Q K - - - - - - - - E K K D C S C L A K G - - - S S A L D I L L D G L V P V A K Q A A D E N P G - - - - - - A A E A E I - A T K A VG A - - - - - - - - - A V P G - - - - - - - - - - - - - - - V I S S L Y Y S I S P A C K K A Q A - - - - - - - - - - - - - G D - - V D G A IA Y F D T V Q A A Q A - - - G P P D R S E R A S T - - - - - A L E G L L Q D L S C I A E Q A V S E V G R D - - G R D G E F E E V - A I H A VA Y Q K S Q - - - - E - - - N K G Q L S Q S S R V - - - S T A L E G L L T S L S T V S K R S A D S L G P N - - - - - A D F T Q L - I A H S AA Y L A A K - - - - - - - - - - K S E T A S V E S - - - - - A L E G L L L D L A P V A E K A V A DMG - - - - - C H T D A D E V - A A H A VT Y L A S K - - - - E - - - G K A S K S A G S - - - - - - - A L E G L L V G L S G V A K Q A E E E L G V G - - - - - A D Q D Q L - V S H S VT Y L Q A K - S - - G - - - N K P Q V T K - - - - - - - - - A L D A L L V G L S D V A K K A S D E L G E G - - - - - A T E A Q I - V D R T IN A - - - - - - - - - E L G - - - - - - - - - - - - - - - - N L T G L L D E I K P A I - A K T E Y S G - - - E - R K G S N Y E F - V D A V A
205275248256194148218224218178181180173201
R E A V N V S L A N L L T Y P F V R E G V V K G T - L A L K G G Y Y D F V N G S F E L WE L Q F G I S P V H S I - - - - - - - - - - - - - -K E A V N A S L G N L L T Y P F V R E G L V N K T - L A L K G G Y Y D F V K G S F E L WG L E F G L S S T F S V - - - - - - - - - - - - - -K E A V N V S L E N L K T Y P F V K E G L A N G T - L K L I G A H Y D F V S G E F L T WK K - - - - - - - - - - - - - - - - - - - - - - - -E L N V L E Q V H N V C A T S I V Q D AWD A G Q E L T V Q G V V Y G V G D G K L R D L G V V V N S S D D I S K F Y R T K - - - - - - - - -E I N V L E QMH N V C A T S I V Q D AWD A G Q E L E V Q G V V Y G V G D G K L R DMG V V A K A N D D I G Q I F R T K Q - - - - - - - -E L N VM E Q V Y N L G H S T I MQ S AWK R G Q K V T I H GWA Y G I H D G L L R D L D V T A T N R E T L E Q R Y R H G I S N L - - - K LH V N V F H T I C R L F S Y S K A L R DMV S S G E V Q V H G G I Y D L E S G - - - - - - - - - - - - - - - - - - - - - - - - - - - - - - -A E N V K V QM E Q L K - V S P V L Q G L V K E G K L K I V G G V Y D L A T G K V T E I A - - - - - - - - - - - - - - - - - - - - - - - - -K I N V F H T I N F L L K Y S S Q I R QMV R R R Q V E I Q G G I Y D L A S G H V E F L G C S P D Q E E L L S S KMX L P L S V A A R S S NK V N V F H S I - - - - - - - - - - - - - - - - - - - - - - - - - - - - - - - - - - - - - - - - - - - - - - - - - - - - - - - - - - - - - -R V N V F H T I D F L L K Y S A P L R E K V K S G Q V E I Q G G I Y H L D S G K V E F MG R S P Q Q S T L L S T N L G L P P S M T R E G G RR V N V F S S I E F L L K Y S P S L R E L V K S G N V E I Q S G I Y H L E T G R V E F L G R S P R Q A E L L R S D P S L P P S L Q A L P I -K L N V F H T I D F L L Q Y S P L V R E K V A A G E V E I Q G G I Y D L E T G H V E F L G Q S P A Q A P L V K S A S A L P P S L A - - - - -R K N V E L T I E N I R K N S P V L K Q L E D E K K I K I V G S MY H L T G G K V E F F E V - - - - - - - - - - - - - - - - - - - - - - - -
215
288
251
- - - - - - - -- - - - - - - -- - - - - - - -- - - - - - - -- - - - - - - -K H A N H K - -- - - - - - - -- - - - - - - -N P L K G V - -- - - - - - - -T S G Y G P S A- - - - - - - -- - - - - - - -- - - - - - - -
D A -
F A C S*
I L S C
I G H S*I D S R
S A C G G
C
S *
- - -- -
**- -- -

The phylogenetic comparison of all sub-units of SymBCA1 and SymBCA2
protein sequences with other known β-CA proteins indicate the distinctive subgroups
found within the β-CA class (Figure 2.3). The plant sequences form two
monophyletic groups representing monocotyledons and dicotyledons while all other
non-plant sequences separate into four sub-groups (A-D). Distinct from all other
sequences are the dinoflagellates that do not conform to any of the existing subgroups
and instead form a novel subgroup of β-CAs (Figure 2.3).

Figure 2.3. Phylogenetic analysis of Symbiodinium β-carbonic anhydrase domains
with other β-class carbonic anhydrase sequences from plants, bacteria, eukaryotes and
representative groups (A-D, monocots, dicots, and the novel dinoflagellate grouping).
Phylogenetic and molecular evolutionary analyses were conducted using maximum
likelihood and bootstrapped 10 000 times. Numbers at branches represent the number
of times this node was found in 10 000 bootstraps.
Identification of δ-class CA SymDCA1
In addition to the two β-CA proteins, a δ-CA sequence was obtained from an Illumina
transcriptome (Chapter 5) and named SymDCA1. SymDCA1 encodes a protein of
341 amino acids with a molecular mass of 38 kDa. The CBS prediction server
TargetP1.1 identified an N-terminal signal peptide followed by a cleavage site
between amino acid positions 16 and 17 in the deduced amino acid sequence of
SymDCA1 (Emanuelsson et al. 2000). Although no predicted trans-membrane
domains were found in the N-terminal region of SymDCA1, TargetP1.1 predicts that
SymDCA1 is most likely directed to the secretory pathway (Figure 2.4).
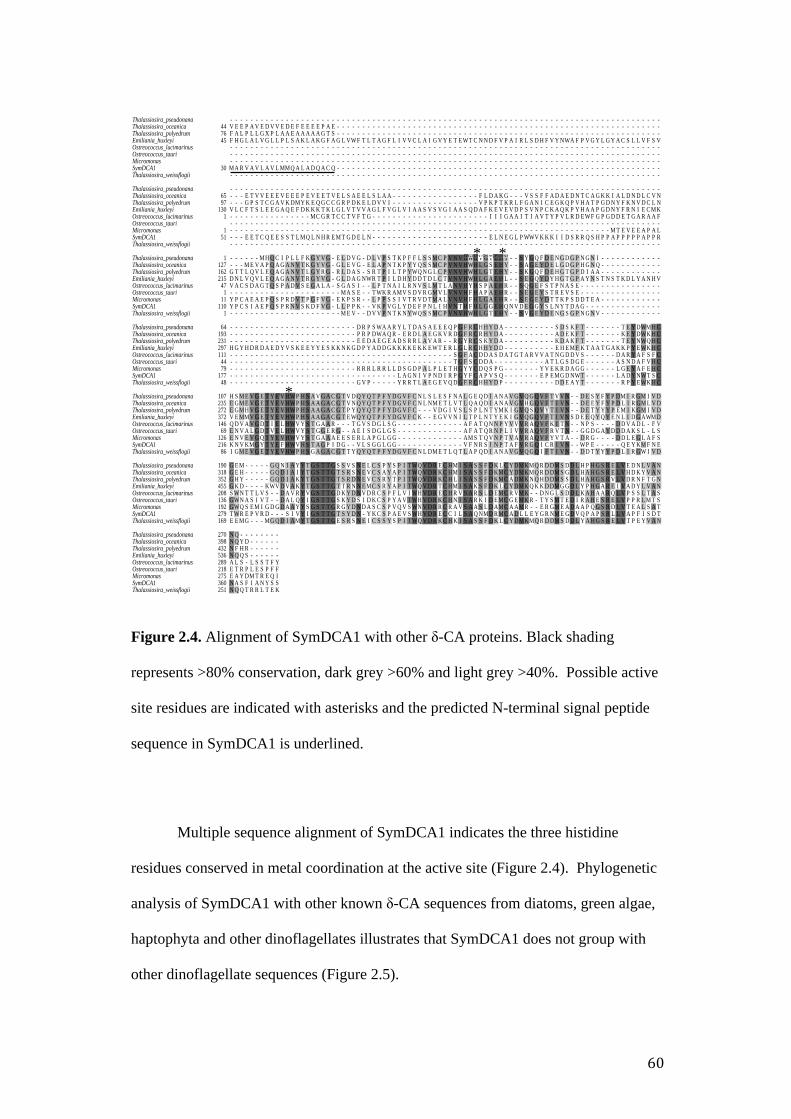
Figure 2.4. Alignment of SymDCA1 with other δ-CA proteins. Black shading
represents >80% conservation, dark grey >60% and light grey >40%. Possible active
site residues are indicated with asterisks and the predicted N-terminal signal peptide
sequence in SymDCA1 is underlined.
Multiple sequence alignment of SymDCA1 indicates the three histidine
residues conserved in metal coordination at the active site (Figure 2.4). Phylogenetic
analysis of SymDCA1 with other known δ-CA sequences from diatoms, green algae,
haptophyta and other dinoflagellates illustrates that SymDCA1 does not group with
other dinoflagellate sequences (Figure 2.5).
Thalassiosira_pseudonanaThalassiosira_oceanicaThalassiosira_polyedrumEmiliania_huxleyiOstreococcus_lucimarinusOstreococcus_tauriMicromonasSymDCA1Thalassiosira_weissflogii
Thalassiosira_pseudonanaThalassiosira_oceanicaThalassiosira_polyedrumEmiliania_huxleyiOstreococcus_lucimarinusOstreococcus_tauriMicromonasSymDCA1Thalassiosira_weissflogii
Thalassiosira_pseudonanaThalassiosira_oceanicaThalassiosira_polyedrumEmiliania_huxleyiOstreococcus_lucimarinusOstreococcus_tauriMicromonasSymDCA1Thalassiosira_weissflogii
Thalassiosira_pseudonanaThalassiosira_oceanicaThalassiosira_polyedrumEmiliania_huxleyiOstreococcus_lucimarinusOstreococcus_tauriMicromonasSymDCA1Thalassiosira_weissflogii
Thalassiosira_pseudonanaThalassiosira_oceanicaThalassiosira_polyedrumEmiliania_huxleyiOstreococcus_lucimarinusOstreococcus_tauriMicromonasSymDCA1Thalassiosira_weissflogii
Thalassiosira_pseudonanaThalassiosira_oceanicaThalassiosira_polyedrumEmiliania_huxleyiOstreococcus_lucimarinusOstreococcus_tauriMicromonasSymDCA1Thalassiosira_weissflogii
Thalassiosira_pseudonanaThalassiosira_oceanicaThalassiosira_polyedrumEmiliania_huxleyiOstreococcus_lucimarinusOstreococcus_tauriMicromonasSymDCA1Thalassiosira_weissflogii
447645
30
- - - - - - - - - - - - - - - - - - - - - - - - - - - - - - - - - - - - - - - - - - - - - - - - - - - - - - - - - - - - - - - - - - - - - - - - - - - - - - - - - - - - -V E E P A V E D V V E D E F E E E E P A E - - - - - - - - - - - - - - - - - - - - - - - - - - - - - - - - - - - - - - - - - - - - - - - - - - - - - - - - - - - - - - - -F A L P L L G X P L A A E A A A A A G T S - - - - - - - - - - - - - - - - - - - - - - - - - - - - - - - - - - - - - - - - - - - - - - - - - - - - - - - - - - - - - - - -F H G L A L V G L L P L S A K L A K G F A G L VWF T L T A G F L I V V C L A I G V Y E T EWT C N N D F V P A I R L S D H F V Y NWA F P V G Y L G Y A C S L L V F S V- - - - - - - - - - - - - - - - - - - - - - - - - - - - - - - - - - - - - - - - - - - - - - - - - - - - - - - - - - - - - - - - - - - - - - - - - - - - - - - - - - - - -- - - - - - - - - - - - - - - - - - - - - - - - - - - - - - - - - - - - - - - - - - - - - - - - - - - - - - - - - - - - - - - - - - - - - - - - - - - - - - - - - - - - -- - - - - - - - - - - - - - - - - - - - - - - - - - - - - - - - - - - - - - - - - - - - - - - - - - - - - - - - - - - - - - - - - - - - - - - - - - - - - - - - - - - - -MA R V A V L A V L MMQ A L A D Q A C Q - - - - - - - - - - - - - - - - - - - - - - - - - - - - - - - - - - - - - - - - - - - - - - - - - - - - - - - - - - - - - - - -- - - - - - - - - - - - - - - - - - - - - - - - - - - - - - - - - - - - - - - - - - - - - - - - - - - - - - - - - - - - - - - - - - - - - - - - - - - - - - - - - - - - -
6597
1301
151
- - - - - - - - - - - - - - - - - - - - - - - - - - - - - - - - - - - - - - - - - - - - - - - - - - - - - - - - - - - - - - - - - - - - - - - - - - - - - - - - - - - - -- - - E T V V E E E V E E E P E V E E T V E L S A E E L S L A A - - - - - - - - - - - - - - - - - F L D A K G - - - V S S F F A D A E D N T C A G K K I A L D N D L C V N- - - G P S T C G A V K DMY K E Q G C C G R P D K E L D V V I - - - - - - - - - - - - - - - - - V P K P T K R L F G A N I C E G K Q P V H A T P G D N Y F K N V D C L NV L C F T S L E E G A Q E F D K K K T K L G L V T V V A G L F V G L V I A A S V S V G I A A S Q D A F K E V E V D P S V N P C K A Q K P Y H A A P G D N Y F R N I E CMK- - - - - - - - - - - - - - - - MC G R T C C T V F T G - - - - - - - - - - - - - - - - - - - - - - - I I I G A A I T I A V T Y P V L R D E WF G P G D D E T G A R A A F- - - - - - - - - - - - - - - - - - - - - - - - - - - - - - - - - - - - - - - - - - - - - - - - - - - - - - - - - - - - - - - - - - - - - - - - - - - - - - - - - - - - -- - - - - - - - - - - - - - - - - - - - - - - - - - - - - - - - - - - - - - - - - - - - - - - - - - - - - - - - - - - - - - - - - - - - - - - - - - - M T E V E E A P A L- - - E E T C Q E E S S T L MQ L N H R E M T G D E L N - - - - - - - - - - - - - - - - - - - - - - - E L N E G L P WWV K K K I I D S R R Q S H P P A P P P P P A P P R- - - - - - - - - - - - - - - - - - - - - - - - - - - - - - - - - - - - - - - - - - - - - - - - - - - - - - - - - - - - - - - - - - - - - - - - - - - - - - - - - - - - -
1127162215471
11110
1
- - - - - - MH Q C I P L L F K G Y V G - E L D V G - D L V P S T K P F F L S S MC P V N V HWH V G T E H Y - - S Y G Q F D E N G D G P N G N I - - - - - - - - - - - -- - - M E V A P Q A G A N V T K G Y V G - G L E V G - E L A P N T K P Y Y Q S S MC P V N V HWH L G S E H Y - - S A G E Y D E L G D G P H G N Q - - - - - - - - - - - -G T T L Q V L E Q A G A N V T L G Y R G - R L D A S - S R T P I L T P YWQ N G L C P V N V HWH L G T E H Y - - S K G Q F D E H G T G P D I A A - - - - - - - - - - - -D N L V Q V L E Q A G A N V T R G Y V G - G L D A G NWR T P I L D H Y D D T D L C T V N V HWH L G A E H L - - S E G Q Y D Y H G T G P A Y N S T N S T K D L Y A N H VV A C S D A G T Q S P A D V S E G A L A - S G A S I - - L P T N A I L R N V S L M T L A N V H Y H S P A E H R - - S Q G E F S T P N A S E - - - - - - - - - - - - - - - -- - - - - - - - - - - - - - - - - - - - - - MA S E - - T WK R AMV S D V R GMV L V N V H F H A P A E H R - - S E G E Y S T R E V S E - - - - - - - - - - - - - - - -Y P C A E A E P Q S P R D V T P G F V G - E K P S R - - L P P S S I V T R V D T MA L V N V H F H L G A E H R - - S E G E Y D T T K P S D D T E A - - - - - - - - - - - -Y P C S I A E P Q S P R N V S K D F V G - L L P P K - - V K P V G L Y D E F P N L I H V N T H F H L G G E H Q N V D E G G Y S L N Y T D A G - - - - - - - - - - - - - - -- - - - - - - - - - - - - - - - - - - - - - M E V - - D V V P N T K N YWQ S S MC P V N V HWH L G T E H Y - - S V G E Y D E N G S G P N G N V - - - - - - - - - - - -
641932312971114479
17748
- - - - - - - - - - - - - - - - - - - - - - - - - D R P S WA A R Y L T D A S A E E E Q P G F R C H H Y D A - - - - - - - - - - S D S K F T - - - - - - - T E Y DWMH C- - - - - - - - - - - - - - - - - - - - - - - - - P R P DWA Q R - E R D L A E G K V R D G F R C R H Y D A - - - - - - - - - - A D E K F T - - - - - - - K E Y DWK H C- - - - - - - - - - - - - - - - - - - - - - - - - E E D A E G E A D S R R L A V A R - - R G Y R C S K Y D A - - - - - - - - - - K D A K F T - - - - - - - T E Y NWQ H CH G Y H D R D A E D Y V S K E E Y Y E S K K N K G D P Y A D D G K K K K E K K E WT E R L G L R C H H Y D D - - - - - - - - - - E H E M F K T A A T G A K K P Y EWK H C- - - - - - - - - - - - - - - - - - - - - - - - - - - - - - - - - - - - - - - - - - - - S G F A C D D A S D A T G T A R V V A T N G D D V S - - - - - - D A R Y A F S F C- - - - - - - - - - - - - - - - - - - - - - - - - - - - - - - - - - - - - - - - - - - - T G F S C D D A - - - - - - - - - - A T L G S D G E - - - - - - A S N D A F V H C- - - - - - - - - - - - - - - - - - - - - - - - - R R R L R R L L D S G D P A L P L E T H G Y Y C D Q S P G - - - - - - - Y V E K R D A G G - - - - - - L G E Y A F E H C- - - - - - - - - - - - - - - - - - - - - - - - - - - - - - - - - L A G N I V P N D I R P G Y F C A P V S Q - - - - - - - E P E MG D NWT - - - - - - L A D Y NWT S C- - - - - - - - - - - - - - - - - - - - - - - - - G V P - - - - - Y R R T L A E G E V Q D G F R C H H Y D P - - - - - - - - - - D D E A Y T - - - - - - - R P Y E WK H C
10723527237214669
12621686
H S M E V G E T Y E V HWP H S A V G A C G T V D Q Y Q T P F Y D G V F C N L S L E S F N A L G E Q D I A N A V G V Q G Q V F T V V N - - D E S Y F Y P DM I R GM I V DE GM E V G E T Y E V HWP H S A A G A C G T V N Q Y Q T P F Y D G V F C N L NM E T L V T L Q A Q D I A N A V G V H G Q V F T I V N - - D E E Y F Y P D L I R GM L V DE GMH V G E T Y E V HWP H S A A G A C G T P Y Q Y Q T P F Y D G V F C - - - V D G I V S L S P L N T YMK I G V Q S Q V Y T I V N - - D E T Y Y Y P E M I K GM I V DV E MMV G E T Y E V HWP H S A A G A C G T E WQ Y Q T P F Y D G V F C K - - E G V V N I L T P L N T Y E K I G V Q G Q V F T I V N S D E E Q Y Q Y E N L I D G AWMDQ D V A V G D T I E L HWV Y S T G A A R - - - T G V S D G L S G - - - - - - - - - - - - - A F A T Q N N P Y V V V R A Q V F K I T N - - N P S - - - - D D V A D L - F VE N V A L G D T V E L HWV Y S T G G E R G - - A E I S D G L G S - - - - - - - - - - - - - A F A T Q R N P L I V V R A Q V F R V T N - - G G D G A Y D D D A K S L - L SE N V E V G Q T Y E V HWV Y S T G A A A E E S E R L A P G L G G - - - - - - - - - - - - - AM S T Q V N P T V A V R A Q V F Y V T A - - D R G - - - - D D L E G L A F SK N V KMG Y T Y E F HWV H S T A G P I D G - - V L S G G L G G - - - - - - - - - - - - - V F N R S I N P T A F V R G Q I C R I V N - - WP E - - - - - Q E Y KM F N EI GM E V G E T Y E V HWP H S G A G A C G T T Y Q Y Q T P F Y D G V F C N L DM E T L Q T L A P Q D I A N A V G V Q G Q I F T I V N - - D D T Y Y Y P D L I R GW I V D
190318352455208136192279169
G E M - - - - - G Q N I A Y Y T G S T T G S S V S N E L C S P Y S P I T WQ V D R E C HM I S A S S F D K L C Y DMKMQ R D DM S D D L H P H G S R E L V E D N L V A NG E H - - - - - G Q D I A I Y T G S T T G T S R S N E V C S A Y A P I T WQ V D R K C HM I S A S S F D KMC Y DMKMQ R D DM S G D L H A H G S R E L V H D K Y V A NG H Y - - - - - G Q D I A K Y T G S T T G T S R D N E V C S R Y T P I TWQ V D R K C H L I S A S S F D KMC A DMK N Q H D DM S S D L H A H G S R V L V D R N F T G NG K D - - - - KWV D V A K Y T G S T T G T T R N N E MC S R Y A P I T WQ V D R T C HM I S A K S F D K L C Y DMK Q K K D DMG G D L Y P H G A R E I V A D Y L V A NS WN T T L V S - - D A V R Y V G S T T G D K Y D N V D R C S P F L V I WH V D R E C H R V S A R S L D E MC R VMK - - D N G L S D D L K A H A A R Q L V P S S L T A SGWN A S I V T - - D A L Q Y I G S T T G S K Y D S I D K C S P Y A V T WH V D R K C H N I S A R K I D E MC G E MK R - T Y S M T E D I R A H E S R E L V P P R LM T SGWQ S EM I G D G D A A Y Y S G S T T G R G Y D N D A S C S P V Q V S WN V D R R C R A V S A A S L D AMC A AMR - - E R GM E A D A A P Q G S R D L V T E A L S A TT WR E P V R D - - - S I V Y I G S T T G T S Y D N - Y K C S P A E V S WH V D R E C C I L S A Q NMD RMC A D L L E Y G R NM E G D V Q P A P S R L L V A P F I S D TE E MG - - - MG Q D I AMY T G S T T G E S R S N E I C S S Y S P I T WQ V D R K C H K I S A S S F D K L C Y DMKMQ R D DM S D D L Y A H G S R E L V T P E Y V A N
270398432536289218275360251
N Q - - - - - - - -N Q Y D - - - - - -N F H R - - - - - -N Q Q S - - - - - -A L S - L S S T F YE T R P L E S P F FE A Y DM T R E Q IN A S F I A N Y S SN Q Q T R R L T E K
- - - - -
HWWWH V G*- - - - -
T E H Y*
- - - - -
E V HWWP*
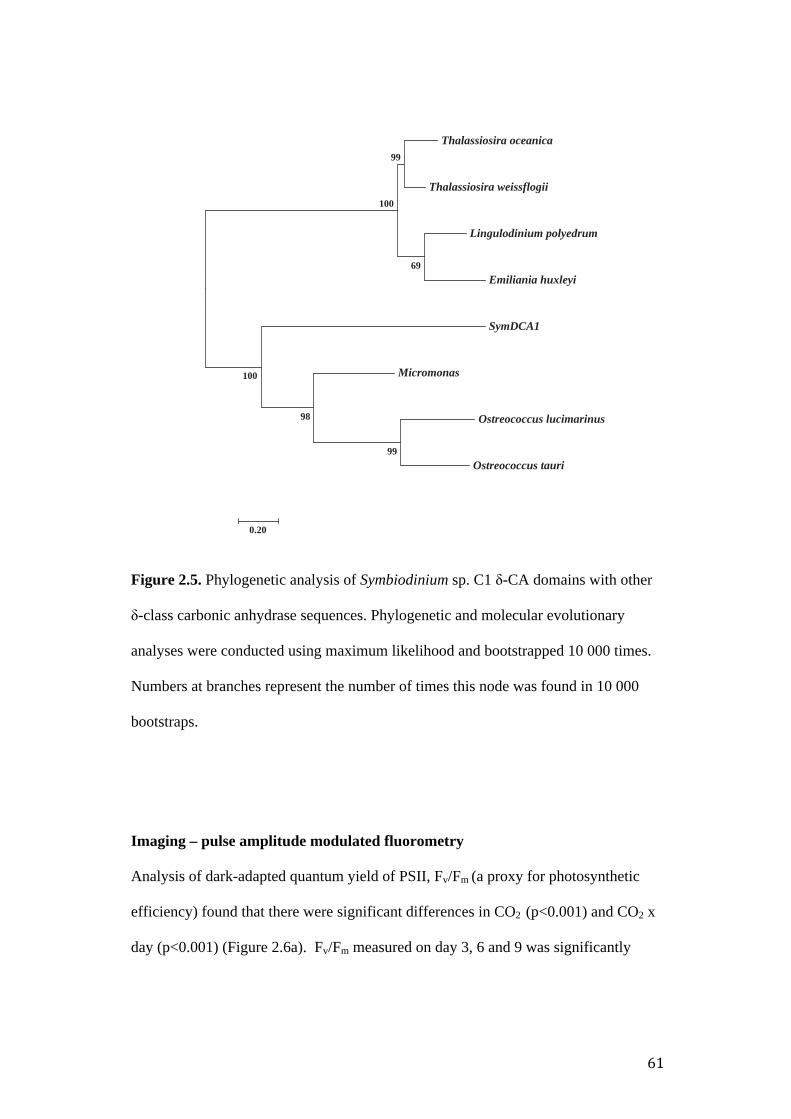
Figure 2.5. Phylogenetic analysis of Symbiodinium sp. C1 δ-CA domains with other
δ-class carbonic anhydrase sequences. Phylogenetic and molecular evolutionary
analyses were conducted using maximum likelihood and bootstrapped 10 000 times.
Numbers at branches represent the number of times this node was found in 10 000
bootstraps.
Imaging – pulse amplitude modulated fluorometry
Analysis of dark-adapted quantum yield of PSII, Fv/Fm (a proxy for photosynthetic
efficiency) found that there were significant differences in CO2 (p<0.001) and CO2 x
day (p<0.001) (Figure 2.6a). Fv/Fm measured on day 3, 6 and 9 was significantly
Thalassiosira oceanica
Thalassiosira weissflogii
Lingulodinium polyedrum
Emiliania huxleyi
SymDCA1
Micromonas
Ostreococcus lucimarinus
Ostreococcus tauri
99
69
100
99
98
100
0.20
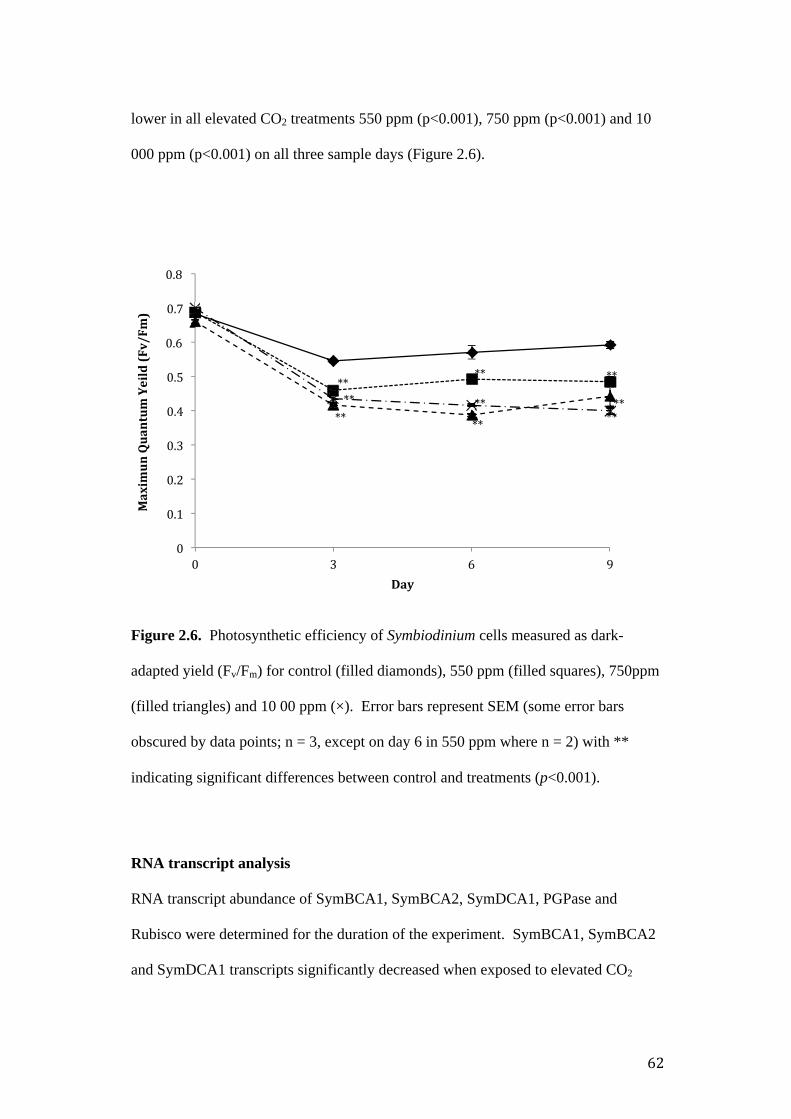
lower in all elevated CO2 treatments 550 ppm (p<0.001), 750 ppm (p<0.001) and 10
000 ppm (p<0.001) on all three sample days (Figure 2.6).
Figure 2.6. Photosynthetic efficiency of Symbiodinium cells measured as dark-
adapted yield (Fv/Fm) for control (filled diamonds), 550 ppm (filled squares), 750ppm
(filled triangles) and 10 00 ppm (×). Error bars represent SEM (some error bars
obscured by data points; n = 3, except on day 6 in 550 ppm where n = 2) with **
indicating significant differences between control and treatments (p<0.001).
RNA transcript analysis
RNA transcript abundance of SymBCA1, SymBCA2, SymDCA1, PGPase and
Rubisco were determined for the duration of the experiment. SymBCA1, SymBCA2
and SymDCA1 transcripts significantly decreased when exposed to elevated CO2

concentrations (Figure 2.7 a-e). Both SymBCA1 and SymBCA2 transcripts were
lowered in the 10 000 ppm CO2 treatment conditions on day 6 (10-fold and 9-fold
respectively) (Figure 2.7a and b). SymBCA2 transcript also decreased on day 9 when
exposed to 10 000 ppm CO2 conditions (10-fold; p< 0.003; Figure 2.7b). SymDCA1
transcript was significantly decreased on day 6 in both the 750 ppm CO2 treatment by
2-fold (p<0.001) and 10 000 ppm CO2 treatment by 20-fold (p<0.001; Figure 2.7c).
In addition to the Symbiodinium CA genes, transcript abundance of PGPase
and Rubisco were also determined. PGPase decreased 12-fold on day 6 (p<0.001)
and 25-fold on day 9 (p<0.002; Figure 2.7d) in the 10 000 ppm CO2 treatment while
transcript abundance of Rubisco increased on day 3 in the 750 ppm CO2 by 0.5-fold
(p<0.001) and 10 000 ppm CO2 treatment by 0.6-fold (p< 0.001) and also on day 6 in
the 10 000 ppm CO2 treatment by 1.66 fold (p<0.012; figure 2.7e).
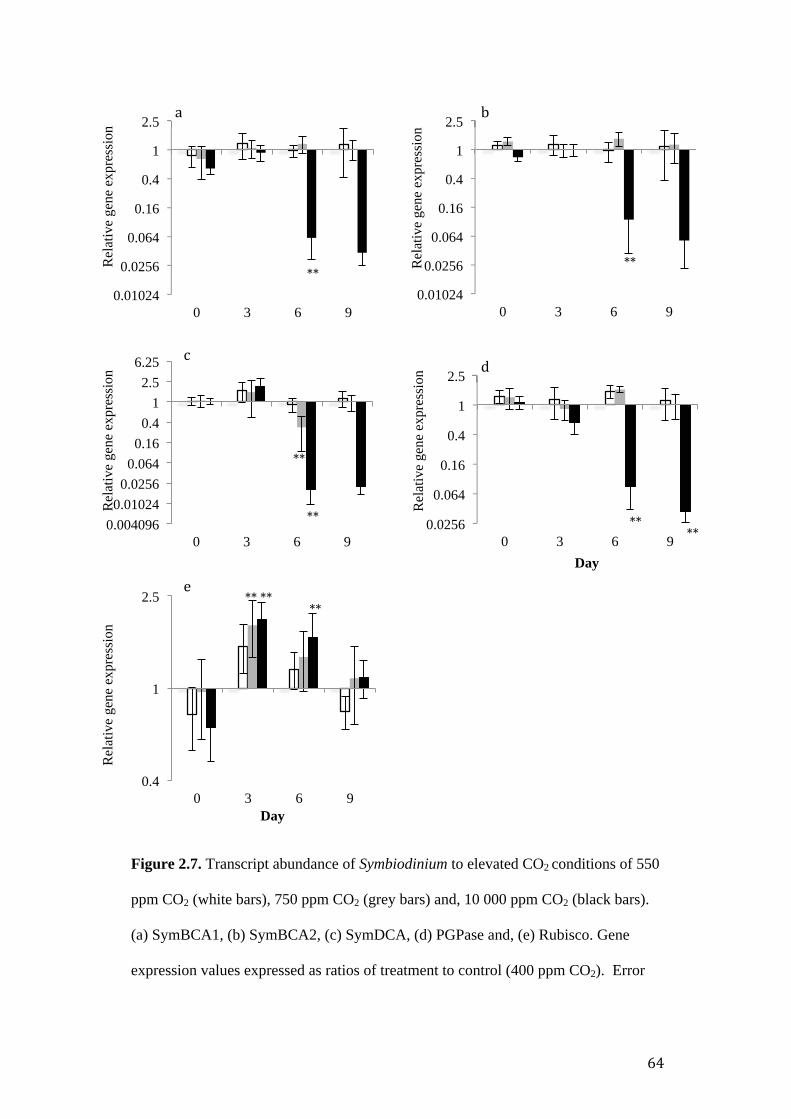
Figure 2.7. Transcript abundance of Symbiodinium to elevated CO2 conditions of 550
ppm CO2 (white bars), 750 ppm CO2 (grey bars) and, 10 000 ppm CO2 (black bars).
(a) SymBCA1, (b) SymBCA2, (c) SymDCA, (d) PGPase and, (e) Rubisco. Gene
expression values expressed as ratios of treatment to control (400 ppm CO2). Error
0.01024
0.0256
0.064
0.16
0.4
1
2.5
0 3 6 9
Rel
ativ
e ge
ne e
xpre
ssio
n
0.01024
0.0256
0.064
0.16
0.4
1
2.5
0 3 6 9
Rel
ativ
e ge
ne e
xpre
ssio
n
0.0256
0.064
0.16
0.4
1
2.5
0 3 6 9
Rel
ativ
e ge
ne e
xpre
ssio
n
Day
0.4
1
2.5
0 3 6 9
Rel
ativ
e ge
ne e
xpre
ssio
n
Day
0.004096 0.01024 0.0256 0.064 0.16 0.4
1 2.5
6.25
0 3 6 9
Rel
ativ
e ge
ne e
xpre
ssio
n

bars are SEM (some error bars obscured by data points; n=3 except for data adapted
yield except on day 6 for the 550 ppm CO2 where n=2). Asterisks indicate significant
differences between treatment and control (p < 0.001).
Discussion
The present study identified and characterised for the first time, two β-class and a δ-
class CA from Symbiodinium and examined the response of these CAs to enhanced
CO2 concentrations. The initial survey of Symbiodinium β-class CAs, through both
EST and PCR analysis (Bobeszko et al, unpublished data) identified that there is a
large diversity of sequences found within the one strain, suggesting multiple copies
within the genome. The study subsequently characterised two of these β-class CAs
along with one δ-class CA and found their transcript abundance is altered under high
CO2 concentrations (10 000 ppm CO2), while at lower concentrations (550 ppm CO2
and 750 ppm CO2) gene expression is unaltered.
Both SymBCA1 and SymBCA2 and the δ-CA SymDCA1 contained the three
conserved amino acid residues (Cys-His-Cys for β-CA gene family and His-His-His
for the δ-CA gene family) required for zinc co-ordination. While the highly
conserved dyad of the aspartate and arginine residues of the β-CA gene family was
identified in all sub-units of SymBCA1, the arginine residue in the N-terminal of
SymBCA2 was replaced with glutamine (Figure 2.2). This is the first time to our
knowledge that this particular mutation has been found in the β-CA class. The role of
the arginine residue in the conserved dyad has been suggested to hold the aspartate
residue in the active site through two hydrogen bonds, with amino acid substitutions
influencing catalytic activity (Smith et al. 2002). For example, previous studies
conducted on the structure and catalytic mechanism of the archaeal β-CA
Methanobacterium thermoautotrophicum (MTCA) identified that the replacement of
the conserved arginine residue with lysine and alanine produced variants with
substantial decreases in kcat and kcat/Km for CO2 hydration by 2–3 orders of magnitude
(Smith et al. 2002). Whether the mutation seen in SymBCA2 also influences catalytic
activity is uncertain and would have to be further investigated.
In addition to amino acid substitution, a β-CA lacking entire conserved amino
acid residues required for activity has also been identified (Sawaya et al. 2006). The
β-CA of the bacteria Halothiobacillus neapolitanus (CsoSCA) contains three domains
of which its C-terminal domain is completely devoid of all catalytic metal ions
(Sawaya et al. 2006). Interestingly, the crystal structure of CsoSCA reveals that it is a
representative member of a new subclass of β-CAs that is distinguished by the lack of
active site pairing. The function or physiological role of this CA protein lacking
activity remains ambiguous, however it has been suggested that these diminished
domains may have evolved a new function specific to its particular environment
(Sawaya et al. 2006).
While the significance of the amino acid substitution observed in SymBCA2
in the present study is unclear, it is interesting to note that despite the mutation
transcript abundance was altered in the same manner as SymBCA1, showing a
decrease in abundance of 9-fold on day 6 when exposed to 10 000 ppm CO2 (Figure
2.7b). This could suggest that not all of the active sites in SymBCA2 are required for
the protein to function. Alternatively both sub-units may be functional however the
N-terminus sub-unit missing the arginine residue does not operate with the same
catalytic efficiency. Further attempt to gain full-length coverage of SymBCA2, future

protein expression studies and localisation studies are needed to assess the
functionality of this particular CA in Symbiodinium.
Interestingly the phylogenetic analysis of SymBCA1 and SymBCA2 indicated
that the dinoflagellates form a novel seventh clade within the β-CA class (Figure 2.3).
A separation can also be seen in SymDCA1 where it does not group with other
dinoflagellates in the δ-class (Figure 2.5).
Symbiodinium β-CA polyproteins
The polyprotein structure identified in SymBCA1 and SymBCA2 (Figure 2.1) was
not surprising and has been identified in several other dinoflagellate genes, for
example, Rubisco (Rowan et al. 1996), peridinin-chlorophyll a-protein (PCP) (Norris
and Miller 1994, Reichman et al. 2003) and peridinin chlorophyll a-c binding proteins
(acPCPs) (Boldt et al. 2012). The polyproteins of Rubisco, PCP and acPCPs are
localised to the chloroplast and are directed through the multiple chloroplast
membrane via a N-terminal targeting sequence (Patron et al. 2005, Yoon et al. 2005)
containing a signal peptide and/or a plastid transit peptide (Nassoury et al. 2003).
Once in the chloroplast the N-terminal peptide is typically cleaved off and these
proteins may be subsequently cleaved at specific cleavage points to their correct
monomeric size. Given the absence of any identifiable characteristic transit peptide
sequence in both SymBCA1 and SymBCA2, suggests that these proteins are localised
to the cytosol. However, it must be noted again that the full-length sequence was not
obtained for SymBCA2. Cytosolic β-CAs have previously been identified in plants
and in unicellular green algae such as Coccomyxa and C. reinhardtii (Moroney et al.
2011). The β-CA in Coccomyxa (Co-CA) has been suggested to facilitate the
diffusion of Ci from the plasma membrane to the chloroplast envelope (Badger and

Price 1994). The β-CA from the green algae c. reinhardtii (CAH9), although not
fully characterised, also lacks any such transit or signal peptides and has been
predicted to be located in the cytosol (Moroney et al. 2011). While the role of CAH9
in the CCM of C. reinhardtii is not yet fully understood, expression studies indicate
that CAH9 is expressed at very low levels (Moroney et al. 2011). The exact role of
SymBCA1 and SymBCA2 in the cytosol of Symbiodinium and their role in the CCM,
if any, are also unclear at present. However, these proteins may play some role in
maintaining HCO3- pools of Ci and may also prevent leakage of CO2 from the cytosol
by trapping CO2 in the form of HCO3-. The conserved LPPS motif observed in the
spacer regions of SymBCA1 (Figure 2.2) may still serve as a cleavage site where the
protein could be cleaved to its correct monomeric size. An alternative is that that these
polyproteins are not cleaved and instead remain as mature proteins encoding multiple
domains for catalysis to occur more efficiently, as occurs in the red algae
Porphyridium purpureum where the two catalytic CA subunits are contained within
the one protein and fold upon themselves to form a pseudo-dimer (Mitsuhashi and
Miyachi 1996).
Gene duplication is a well-documented event in dinoflagellates (Zhang et al.
2006, Leggat et al. 2011) that is thought to have also contributed to the rise of
polyproteins. The 62 kDa β-CA in P. purpureum appears to be a product of gene
duplication with the N- and C- terminal halves displaying 72% similarity.
Surprisingly the identity between the three sub-units of SymBCA1 (63% for sub-units
two and three; 61% for sub-units one and two and 51% for subunit one and three) and
the two sub-units of SymBCA2 (52%) is relatively small when compared to P.
purpureum. This may suggest that the sub-units of SymBCA1 and SymBCA2 could
have arisen through a fusion event of separate CA genes or an early duplication and
fusion event.
Unlike the polyprotein structure found in SymBCA1 and SymBCA2,
SymDCA1 is not encoded as a polyprotein. While the deduced amino acid sequence
of SymDCA1 contains a predicted signal sequence consistent with secretion of the
protein, the exact location of SymDCA1 is not yet known. Given the location of other
δ-CAs in dinoflagellates, such as the δ-CA in Lingulodinium polyedrum (LP- δ-CA)
(Lapointe et al. 2008), and in the two δ-CAs identified in Symbiodinium kawagutii,
SymDCA1 may also be associated with the plasma membrane. However, due to
difficulties in bioinformatically identifying glycophosphatidylinositol anchors it is not
possible to conclusively determine if SymDCA1 is membrane anchored, as is seen in
Lp- δ-CA (Lapointe et al. 2008). Future work targeting SymDCA1 to a particular
subcellular location may therefore provide clues to the exact role played by this class
of CAs in Symbiodinium. However given the down regulation of SymDCA1 in
response to the 750 ppm CO2 and 10 000 ppm CO2 treatments (2-fold and 20-fold)
(Figure 2.7d) it is plausible to say that this particular CA does have a role in the
operation of the Symbiodinium CCM.
Symbiodinium CAs and photosynthetic efficiency in response to elevated CO2
Regulation of CA in response to CO2 has been demonstrated in many species which
has shown that decreasing CO2 concentrations increases CA activity correlating with
an increase in mRNA levels (Raines et al. 1992). In addition, elevated CO2 has been
known to increase the carboxylation reaction relative to oxygenation reaction of
Rubisco leading to increased photosynthetic rates. In the present study,
Symbiodinium were exposed to CO2 concentrations ranging from current day levels,

through near future concentrations (550 ppm CO2 and 750 ppm CO2) to extreme
levels (10 000 ppm CO2). Perhaps surprisingly, with the exception of SymDCA1 and
Rubisco, only at extreme CO2 concentrations was a change in transcript abundance
observed for SymBCA1 and SymBCA2 (Figure 2.7a-e). The lowered transcript
abundance of Symbiodinium CAs in the 10 000 ppm CO2 treatment were to be
expected as there is less physiological need for these enzymes to accumulate and/or
concentrate CO2 under such conditions be due to passive diffusion of CO2. Despite
CO2 only decreasing transcription of the β-CA transcripts at concentrations higher
than those currently experienced and, well above those concentrations predicted in the
near future, these results are consistent with other microalgal studies that have shown
growth in 5% CO2 represses most of the characteristics of CCMs (Price and Badger
1989, Sültemeyer et al. 1989, Matsuda and Colman 1995). Furthermore, the present
results are also consistent with previous Symbiodinium studies showing the algas’
ability to regulate the CCM (Leggat et al. 2002). The apparent absence of any
regulation at the lower levels of CO2 (550 ppm CO2 and 750 ppm CO2) for SymBCA1
and SymBCA2 may indicate a secondary role for these CAs or that both SymBCA1
and SymBCA2 are constitutively expressed, as seen in the chloroplastic α-CA (Cah3)
in C. reinhardtii (Karlsson et al 1998).
As the substrate for photosynthesis, elevated CO2 concentrations would be
expected to increase photosynthetic rates either directly by relieving carbon limitation
or indirectly by lowering the energy capacity required to concentrate CO2 against a
concentration gradient. However, enhanced photosynthesis under elevated CO2
concentrations has been shown to be species specific (Rost et al. 2003, Chen and Gao
2004, Collins et al. 2006) and unlike other dinoflagellate studies where photosynthesis
and carbon fixation are enhanced under elevated CO2 (Burkhardt et al. 1999, Rost et
al. 2006), in the present study the photosynthetic efficiency of Symbiodinium was
significantly depressed in cells exposed to all elevated CO2 treatments (Figure 2.6).
While most organisms are able to utilize both HCO3- and CO2 to support
photosynthesis there does seem to be species-specific preferences (Kaplan and
Reinhold 1999). This has previously been demonstrated in Symbiodinium where cells
freshly isolated from the giant clam initially utilised CO2 for photosynthesis however
after two days of isolation there was a shift in utilisation of the HCO3- pool in the
media to support photosynthesis (Leggat et al. 1999). While an increase in transcript
abundance of Rubisco was observed in both the 750 ppm CO2 and 10 000 ppm CO2
treatments on day 3 (0.5- and 0.6-fold respectively) and the 10 000 ppm CO2
treatment on day 6 (0.6-fold; Figure 2.7e) in the present study, it is evident from the
maximum quantum yield data (Figure 2.6), that this increase does not relate to a
greater capacity to fix CO2 and hence increase photosynthesis. Therefore this could
suggest that: (a) the carboxylase activity of Rubisco is limited by HCO3- supply and
that this up-regulation of Rubisco may be an acclimation process to elevated CO2
levels, (b) the accumulation of cellular CO2, due to elevated CO2 conditions and
passive diffusion of CO2, has possibly caused an acidification of the cytoplasm and or
the chloroplast and in turn has caused possible photoinhibition of photosystem II
(PSII) or, (c) since there is a significant down-regulation of both SymBCA1 and
SymBCA2 (that are assumed to be localised to the cytosol), CO2 is lost via leakage as
it is unable to be converted to HCO3- via CA. Further studies would have to be
conducted in order to examine these possibilities.
The carboxylase activity of Rubisco would also be inhibited by the oxygenase
activity via the production of phosphoglycolate if it were not converted to glycolate
by the enzyme PGPase. Accordingly, Crawley et al (2010) demonstrated that
enhanced activity of PGPase was critical to preventing the accumulation of PGP from
photorespiration, which would otherwise inhibit carbon fixation. It is assumed that
under ambient CO2 the CCM still allows the oxygenase reaction to take place (Tytler
and Trench 1986). In fact, it has been demonstrated that full induction of the CCM in
Synechococcus PCC7942 requires O2-dependant processes such as photorespiration
(Woodger et al. 2005). The process of photorespiration can therefore function as a
photoprotective mechanism providing an alternative pathway that diverts excess
excitation energy (Niyogi 1999, Smith et al. 2005). Transcript abundance of PGPase
in the present study significantly decreased on both day 6 (12-fold; p<0.001) and day
9 (25-fold; p<0.002; Figure 2.7d) in the 10 000 ppm CO2 treatment. This decrease
coincided with a decrease in both CA transcript abundance and photosynthetic
efficiency. Such a decline in PGPase transcript abundance could mean a decline in
the need for conversion of phosphoglycolate due to elevated affinity for Rubisco
carboxylation at high CO2 concentrations (Drake et al. 1997), suggesting either a
reduced capacity to fix CO2 and or the reduction in the oxygenase activity (via the
non removal/accumulation of phosphoglycolate). Previous studies on C. reinhardtii
and cyanobacteria have shown that there is no change to PGPase expression when
cells are transferred from air to high CO2 (Marek and Spalding 1991, Norman and
Colman 1991). However, in a study conducted on Symbiodinium in hospite, PGPase
expression was reduced by 50% when transferred to a high CO2 environment with this
reduction also coinciding with a decline in photosynthetic productivity (Crawley et al.
2010). The interpretation of results obtained in the present study on cultured
Symbiodinium compared to those in symbiosis however must be done with caution.
In summary the data presented in this study are the first to have characterised
the β- and δ-class CA gene family in Symbiodinium and the expression of these CAs

to enriched CO2 conditions. Although transcriptional control of nuclear genes in
dinoflagellates appears to be limited (Lidie et al. 2005, Moustafa et al. 2010, Leggat
et al. 2011) the results of the present study indicate that Symbiodinium is able to
modulate its CA at the transcriptional level. While elevated CO2 concentrations can
be advantageous to some microalgae and decrease the need for a CCM therefore
freeing the resources and energy involved in its operation (Beardall and Giordano
2002), elevated CO2 concentrations may not be advantageous for Symbiodinium clade
C1 as seen in the decline of photosynthetic efficiency of Symbiodinium cells exposed
to elevated CO2 conditions. It is highly likely that other forms of CAs remain
undiscovered and that these CAs may play some undiscovered role in the
Symbiodinium CCM. How Symbiodinium controls the CCM is not yet fully
understood including what signal is responsible for initiating changes. The structural
complexity of the eukaryotic cell also complicates the analyses of the CCM. The
results from the present study together with future work would therefore gain a better
understanding of acclimation to increased atmospheric CO2 at the molecular level
within this important genus.
Chapter 2 Summary points
• Two novel β-class and one δ-class CA were identified in Symbiodinium.
• Both SymBCA1 and SymBCA2 are transcribed as polyproteins. Due to the
absence of any characteristic transit peptide, these proteins are predicted to be
localised to the cytosol.
• Phylogenetic analysis of SymBCA1 and SymBCA2 indicate dinoflagellate β-
CAs are forming a novel class within the β-CA family.

• The cellular location of SymDCA1 is currently unknown. SymDCA1 was
found to contain a predicted signal sequence consistent with secretion of the
protein and may be associated with the plasma membrane as with other
dinoflagellate δ-Class CAs.
• As with other algae, CA transcript abundance in Symbiodinium is modified by
external CO2 concentrations.
• Transcript analysis identified significant decline in abundance of SymBCA1,
SymBCA2, and SymDCA1 when Symbiodinium cells were exposed to
elevated CO2 treatments.
• Photosynthetic efficiency of Symbiodinium cells exposed to elevated CO2
treatments (550 ppm CO2, 750 ppm CO2 and 10 000 ppm CO2) significantly
declined.
• Transcript abundance of PGPase also significantly decreased in the highest
CO2 treatment while transcript abundance of Rubisco increased in elevated
CO2 treatments, however could not be linked with greater photosynthetic
efficiency.

Schematic representation of thesis outline
Chapter 2
Objective 1: Isolation and characterisation of CA in Symbiodinium and effects of increased CO2 concentrations on CA expression and CCM.
Chapter 3
Objective 2: Effects of combined increased CO2 concentrations and temperature on Symbiodinium CAs and CCM.
Chapter 4
Objective 3: Carbonic anhydrase expression in Symbiodinium in response to varied light environments.
Chapter 5
Objective 4: Changes in Symbiodinium transcriptome in response to elevated CO2 concentrations.
Chapter 6
General discussions, thesis conclusions and future directions.
Chapter 1
General Introduction and thesis objectives.
Chapter 3: Effects of combined elevated CO2 and temperature on
gene expression patterns in the symbiotic dinoflagellate
Symbiodinium
Statement of purpose
It is becoming well known that climate change is having profound effects on our
oceans (IPCC 2013). In particular, increasing CO2 emissions are leading to rising sea
surface temperature (SST) and decreased ocean pH, a phenomenon known as ocean
acidification (OA). These changes in seawater carbonate chemistry may have
important repercussions for photosynthetic marine algae to acquire and fix carbon.
Given that CA activity and transcript abundance is altered in Symbiodinium exposed
to elevated partial pressure of CO2 (pCO2), Chapter 3 investigates the interactive
effects of elevated CO2 and temperature on the transcript abundance of the
Symbiodinium CAs identified in Chapter 2, and on ribulose-1,5-bisphosphate
carboxylase/oxygenase (Rubisco) and phosphoglycolate phosphatase (PGPase)
involved in the carbon pathway. In addition, physiological parameters, such as
photosynthetic efficiency, chlorophyll content and cell densities were also examined
in an attempt to link any physiological changes with transcript abundance changes in
Symbiodinium. This chapter is in preparation for publication.
Introduction
It is becoming well known that increases in atmospheric CO2 and SST are having
profound effects on our oceans (IPCC 2013). Currently, the concentration of
atmospheric CO2 is approximately 400 parts per million (ppm) and is expected to rise
to reach between 550 ppm and 1200 ppm by the year 2100, depending on the
emission scenarios (IPCC 2013). The chemistry of inorganic carbon (Ci) in seawater
dictates that an increase in atmospheric CO2 will lead to increases in dissolved CO2.
These changes in seawater carbonate chemistry result in lowered pH levels (Wolf-
Gladrow et al. 1999), a phenomenon also known as ocean acidification (OA). In
addition to increasing dissolved CO2 in surface ocean waters, increases in atmospheric
CO2 will also result in the rise of SST with predicted increases of 1 - 3°C likely to
occur on the Great Barrier Reef by the year 2100 (GBRMPA 2011). Given that
photosynthesis is directly dependent on the supply and fixation of CO2 (Badger et al
1998), such acidification of ocean waters and increases in SST may have important
repercussions for Symbiodinium to acquire and fix carbon.
The genus Symbiodinium is divided into nine phylogenetically distinct clades
designated A-I (Pochon and Gates 2010). The successful symbiosis between
hermatypic corals and their dinoflagellate endosymbionts of the genus Symbiodinium,
is largely based on the translocation of photosynthetically fixed carbon form the
symbiont (Muscatine 1990). Photosynthesis in Symbiodinium is augmented by the
use of a CCM. CA plays an important role in most algal CCMs by accelerating the
interconversion of HCO3- and CO2 and the facilitation and transportation of CO2 and
HCO3- across cell membranes (Badger and Price 1994; Kaplan and Reinhold 1999;
Sültemeyer 1998). However, the operation of the CCM and the sensitivity of
photosynthesis and associated photosynthetic proteins to anthropogenic stress such as
increased CO2 levels and elevated seawater temperature is a crucial environmental
response that underlies the resilience between host-symbiont relationships.
Prior research has demonstrated that enrichment of CO2 can significantly
influence photosynthesis, growth and CCM function in some taxonomic groups of
phytoplankton for example, marine diatoms, cyanobacteria (Hutchins et al. 2007) and
coccolithophores (Riebesell et al. 2000, Riebesell 2004, Rost et al. 2008). However,
whether phytoplankton benefit from increases in CO2 or are disadvantaged by such
increases vary according to the particular species examined and the dependency on
the particular inorganic carbon (Ci) species preferred for uptake by these species. The
few studies examining photosynthetic capacity and growth of Symbiodinium cells
exposed to enriched CO2 conditions have also produced varied results according to
the particular phylotype of Symbiodinium examined with certain phylotypes
responding positively to enriched CO2 conditions while other phylotypes remain
unchanged (Brading et al. 2011).
In addition to physiological parameters such as photosynthetic efficiency and
growth rate, it is well known that the activity and expression of CA is inhibited under
increased Ci concentrations and stimulated under limited Ci concentrations (Beardall
et al 1998; Giordano et al 2005). Previous research on algal CCMs and CA activity in
response to enriched CO2 conditions has demonstrated that pCO2 concentrations
projected for 2100 down-regulate some algal CCMs (Kaplan et al. 1980, Tsuzuki and
Miyachi 1989, Raven 1991, Matsuda et al. 2001) by lowered photosynthetic affinity
for CO2 (Rost et al. 2006, Ratti et al. 2007) and/or by down-regulation of CA
transcripts (Van de Waal et al. 2013) and presumably protein. Whether or not
Symbiodinium photosynthesis will be enhanced by increased CO2 due to climate
change still remains controversial given; (1) the different phylotypes of Symbiodinium

and, (2) the varied responses in physiology, modes of Ci uptake, utilization of CAs
and tolerance to environmental stressors (Brading et al. 2013).
Increases in temperature can also exert its effect on ocean carbonate chemistry
and algal CCMs. Increasing SST decreases the solubility of CO2 and favours
speciation of Ci into more carbonate ions (CO32-) and less CO2. Experimental
evidence has shown that CA activity can increase in some microalgae as temperature
increases (Shiraiwa and Miyachi 1985) and that carbon acquisition and CCM function
can also be enhanced in certain phylotypes of Symbiodinium (Oakley et al. 2014). A
well-studied consequence of elevated SST is coral bleaching where Symbiodinium are
expelled from the coral host or photosynthetic pigments are lost from the symbiont
cells (Glynn 1993, Jones et al. 1998, Dove et al. 2006, Hoegh-Guldberg 2011). There
is strong evidence that impairment of the Symbiodinium photosynthetic mechanism is
involved in coral bleaching. Studies conducted on Symbiodinium cells in culture have
shown that photosynthesis is impaired at temperatures above 30 °C and is completely
disrupted at 36 °C (Iglesias-Prieto et al. 1992). While the trigger for thermal damage
in Symbiodinium remains controversial, several possible sites of temperature
sensitivity have been considered such as degradation of the Rubisco enzyme (Jones et
al. 1998, Lilley et al. 2010, Buxton et al. 2012), impairment of the CCM (Leggat et al.
2004); causing disequilibrium in the photosynthetic electron transport chain leading to
oxidative stress, damage to photosynthetic proteins such as the D1 protein of
photosystem II (PSII) (Warner et al. 1999) and, thylakoid membrane integrity
(Tchernov et al. 2004) such as light-harvesting complexes (LHCs) (Takahashi et al.
2008). However, none of these potential sites have conclusively been demonstrated
as the initial site of thermal damage. In addition, it is well known that thermal
tolerance and sensitivity of Symbiodinium varies across the many phylotypes.

Phylotypes D1, D1-4, C15, A3 are generally accepted as thermotolerant, while
phylotypes C3, C7, B17 and A13 are more thermosensitive (Thornhill et al. 2006,
Silverstein et al. 2011, McGinty et al. 2012, Tonk et al. 2014).
Although there have been numerous studies on the response of various
phytoplankton, including Symbiodinium, to elevated CO2 (Hutchins et al. 2007, Rost
et al. 2008, Brading et al. 2011) or temperature (Robison and Warner 2006, Oakley et
al. 2014, Gierz et al. 2016, Gierz et al. 2017) many of these studies have examined
these stressors in isolation. Despite the environmental relevance of combined
interactions between rising CO2 and temperature few studies have examined these
environmental stressors in combination. Given the importance of Symbiodinium to
symbiotic relationships, the sensitivity of Symbiodinium photosynthesis, in particular
CAs, to OA is currently limited. Therefore the present study aims to examine the
response of this important species to future conditions of OA and warming focusing
on growth, photosynthetic efficiency, chlorophyll content and gene expression of the
two Symbiodinium β-CAs (SymBCA1 and SymBCA2) identified in Chapter 2. From
these results we also aim to identify any possible links between Symbiodinium
physiology and gene expression under combined pCO2 and temperature conditions.
Material and Methods
Experimental treatments
Symbiodinium clade F cells were grown in a controlled refrigerated incubator
(Thermoline Scientific refrigerated incubator, Sanyo TRISL-495-1-SD) on a 12:12 hr
light/dark photoperiod cycle in tissue culture flasks (Sarstedt, NC, USA) containing
ASP-8A medium (Blank 1987). This particular phylotype was chosen, as the C1
phylotype was not available at the time. This however presented an opportunity to
explore if the response of Symbiodinium clade F would be similar to that of clade C1
used in Chapter 2. The experiment started with cells in log-phase growth to avoid age-
dependent response. Cells were divided equally in triplicate flasks for each of the six
experimental treatments that included three CO2 concentrations of 390 – 400 ppm
pCO2 (control), 750 ppm pCO2 and 1500 ppm pCO2 at a control temperature of 25 ºC
(CO2 alone conditions) and the same three CO2 concentrations at an elevated
temperature of 31 ºC (thermally stressed conditions). A CO2 mixing system based on
the design of Munday et al (2009) was used where pure gaseous CO2 was mixed with
ambient air in a mixing chamber and pumped into each incubator. Temperatures were
recorded every 30 min with HOBO® temperature/alarm pendant data loggers (Onset,
MA, USA). Experimental conditions were maintained and monitored over 21 days
with samples taken on days 0, 4, 7, 14 and 21 after a six-hour photoperiod.
Approximately 30 mls of ASP-8A media was taken for alkalinity
measurements conducted by the Townsville City Water Council and both temperature
and pH were measured daily with a calibrated YSI 600QS Sonde (YSI, Ohio, USA).
Resulting alkalinity, pH and water temperature values were entered into CO2CALC
(Robbins et al 2010) to calculate pCO2 of each sample (Figure 3.1a).
Doubling time for cells was approximately 7 days therefore all flasks were
split in half on day 7 and 14 after experimental measurements were taken to prevent
cells entering stationary phase of growth. Splitting of Symbiodinium cells involved
discarding the culture media and adding fresh media to the same flask. Cells were
then resuspended in the fresh culture media using a disposable sterile cell scrapper
(Starstedt, NC, USA) and cell counts were performed using a haemocytometer.
Approximately half of the fresh media, including suspended cells, were then

transferred into new sterile flasks and filled to approximately 80 mls with fresh
media. The new flasks were then used for the remainder of the experiment.
Imaging – pulse amplitude modulated fluorometry
Measurements of chlorophyll fluorescence of Symbiodinium cells were taken using
Imaging – pulse amplitude modulated (iPAM) fluorometry (MAXI Imaging – PAM,
Walz, Germany). See Chapter 2 methodology for dark-adapted maximum quantum
yield measurements. Three replicate samples of Symbiodinium cells from each
treatment were designated for PAM measurements and used throughout the
experiment. Induction recovery curves were performed to examine the ability of
Symbiodinium to dissipate excess light energy and recover from light stress after
experimental conditions.
Symbiodinium cell density and pigment content
Approximately 3 ml of culture were taken from all treatments in triplicate and
centrifuged at 5000g for 2 min to pellet algal cells for chlorophyll a (chl a) and
chlorophyll c (chl c) pigment quantification. Chlorophyll was extracted by re-
suspending the algal pellets in 90 % acetone for 24 hours in the dark at 4 °C. After 24
hours cells were briefly disrupted using a MP Fastprep®-24 Instrument (MP
Biomedicals, Australia) at 4.5 M s-1 for 3 x 45 seconds and chlorophyll measured on a
DU-650 spectrophotometer (Beckman, USA) at 630 and 664 nm light wavelength.
Chl a and chl c content were quantified using the equations of Jeffrey and Humphrey
(1975) for 90 % acetone. A total aliquot of 1 ml from each sample was also taken for
cell counts with replicate counts performed on a haemocytometer (n = 8).
mRNA isolation and cDNA synthesis
Approximately 6 x 10⁶ Symbiodinium cells were collected for mRNA extraction and
snap frozen in lysing matrix D tubes for later mRNA extraction (MP Biomedicals,
Australia). See Chapter 2 methodology for details on mRNA isolation procedures.
DNase treatment of all mRNA samples was performed prior to reverse transcription
with approximately 100 ng of mRNA (see Appendices Table 4). All mRNA samples
were treated with RQ1 RNase-Free DNase (Promega) as per Chapter 2 methodology
and used as a template for SuperScript™ III First-Strand Synthesis SuperMix for
qPCR kit following manufacturer’s protocol (Invitrogen, California, USA). See
Appendices Table 5 for reaction volumes.
RNA transcript analysis
Quantitative PCR (qPCR) was used to measure transcript levels of various genes of
interest (GOI) (Table 3.1). Candidate internal control genes (ICG) used for
Symbiodinium were: glyceraldehyde 3-phosphate dehydrogenase
GAPDH (Rosic et al. 2011), proliferating cell nuclear antigen (PCNA) (Boldt et al
2008) and S-adenosyl methionine synthetase (SAM) (Rosic et al. 2011). Validation
for use as ICG in this experiment was performed using GeNorm in qBASE plus
software package (Biogazelle) with M values of 0.5 or lower deemed acceptable. The
amplification efficiency for each gene specific primer was determined by serial
dilutions ranging from 1:10 to 1:160. A 1:40 dilution was determined to be optimal
for all primer sets with reaction efficiencies between 0.9 and 1.0. qPCR was then
performed; see Chapter 2 methodology for details on reaction mix and qPCR
parameters. Relative expression analysis was performed using qBASE plus
(Biogazelle).
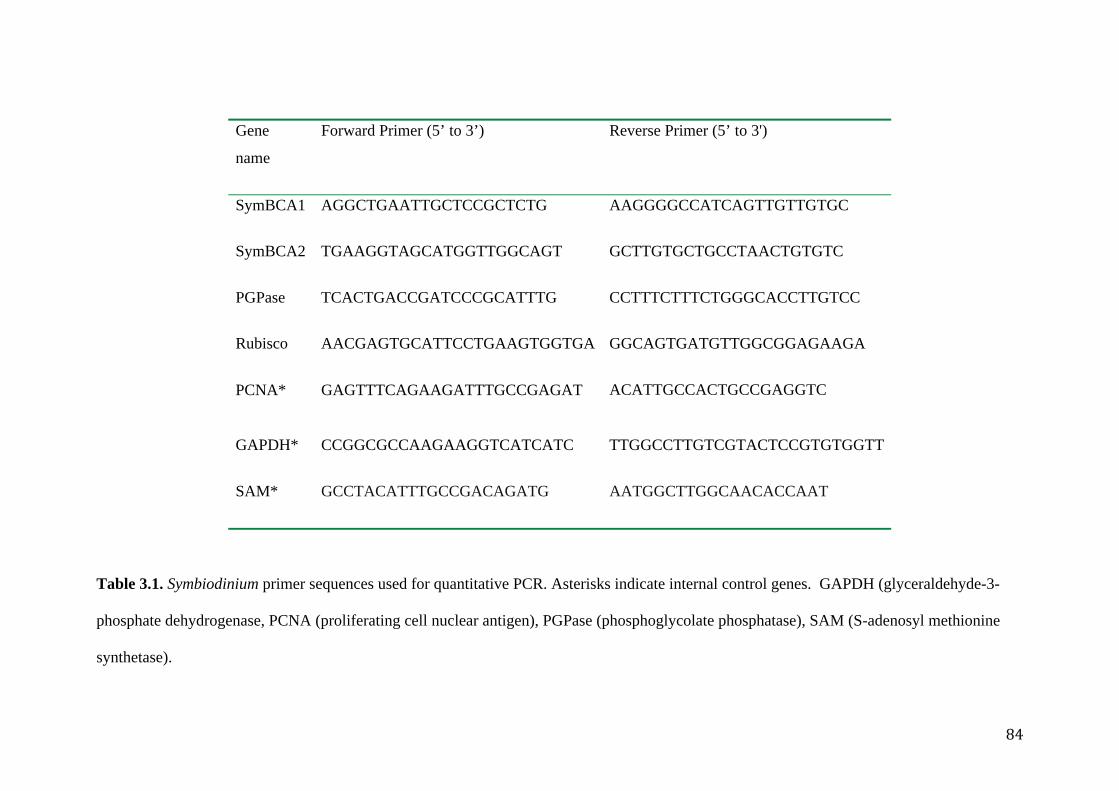
Table 3.1. Symbiodinium primer sequences used for quantitative PCR. Asterisks indicate internal control genes. GAPDH (glyceraldehyde-3-
phosphate dehydrogenase, PCNA (proliferating cell nuclear antigen), PGPase (phosphoglycolate phosphatase), SAM (S-adenosyl methionine
synthetase).
Gene
name
Forward Primer (5’ to 3’) Reverse Primer (5’ to 3')
SymBCA1 AGGCTGAATTGCTCCGCTCTG AAGGGGCCATCAGTTGTTGTGC
SymBCA2 TGAAGGTAGCATGGTTGGCAGT GCTTGTGCTGCCTAACTGTGTC
PGPase TCACTGACCGATCCCGCATTTG CCTTTCTTTCTGGGCACCTTGTCC
Rubisco AACGAGTGCATTCCTGAAGTGGTGA GGCAGTGATGTTGGCGGAGAAGA
PCNA* GAGTTTCAGAAGATTTGCCGAGAT ACATTGCCACTGCCGAGGTC
GAPDH* CCGGCGCCAAGAAGGTCATCATC TTGGCCTTGTCGTACTCCGTGTGGTT
SAM* GCCTACATTTGCCGACAGATG AATGGCTTGGCAACACCAAT
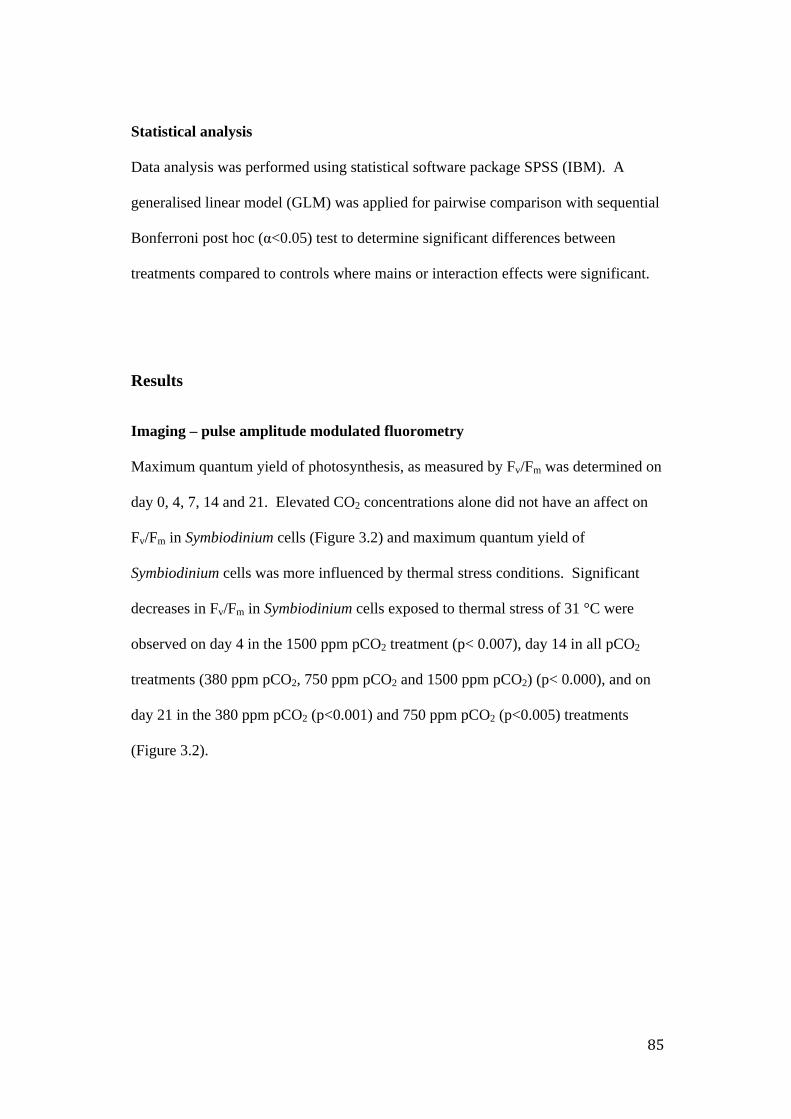
Statistical analysis
Data analysis was performed using statistical software package SPSS (IBM). A
generalised linear model (GLM) was applied for pairwise comparison with sequential
Bonferroni post hoc (α<0.05) test to determine significant differences between
treatments compared to controls where mains or interaction effects were significant.
Results
Imaging – pulse amplitude modulated fluorometry
Maximum quantum yield of photosynthesis, as measured by Fv/Fm was determined on
day 0, 4, 7, 14 and 21. Elevated CO2 concentrations alone did not have an affect on
Fv/Fm in Symbiodinium cells (Figure 3.2) and maximum quantum yield of
Symbiodinium cells was more influenced by thermal stress conditions. Significant
decreases in Fv/Fm in Symbiodinium cells exposed to thermal stress of 31 °C were
observed on day 4 in the 1500 ppm pCO2 treatment (p< 0.007), day 14 in all pCO2
treatments (380 ppm pCO2, 750 ppm pCO2 and 1500 ppm pCO2) (p< 0.000), and on
day 21 in the 380 ppm pCO2 (p<0.001) and 750 ppm pCO2 (p<0.005) treatments
(Figure 3.2).

Figure 3.1. pCO2 concentrations of culture media during the 21 day experiment.
Values represent the average of 3 replicate flasks. Data represented are: control 380
ppm: 25 °C (open circle), 750 ppm: 25°C (open triangle), 1500 ppm: 25 °C (open
diamond), 380 ppm: 31 °C (closed circle), 750 ppm: 31°C (closed triangle), 1500
ppm: 31°C (closed diamond). Error bars represent the standard error (some error bars
obscured by data points; n=3).
0
200
400
600
800
1000
1200
1400
1600
1800
2000
0 4 7 14 21
pCO
2 pp
m
Day
380 ppm 25°C
380 ppm 31°C
750 ppm 25°C
750 ppm 31°C
1500 ppm 25°C
1500 ppm 31°C
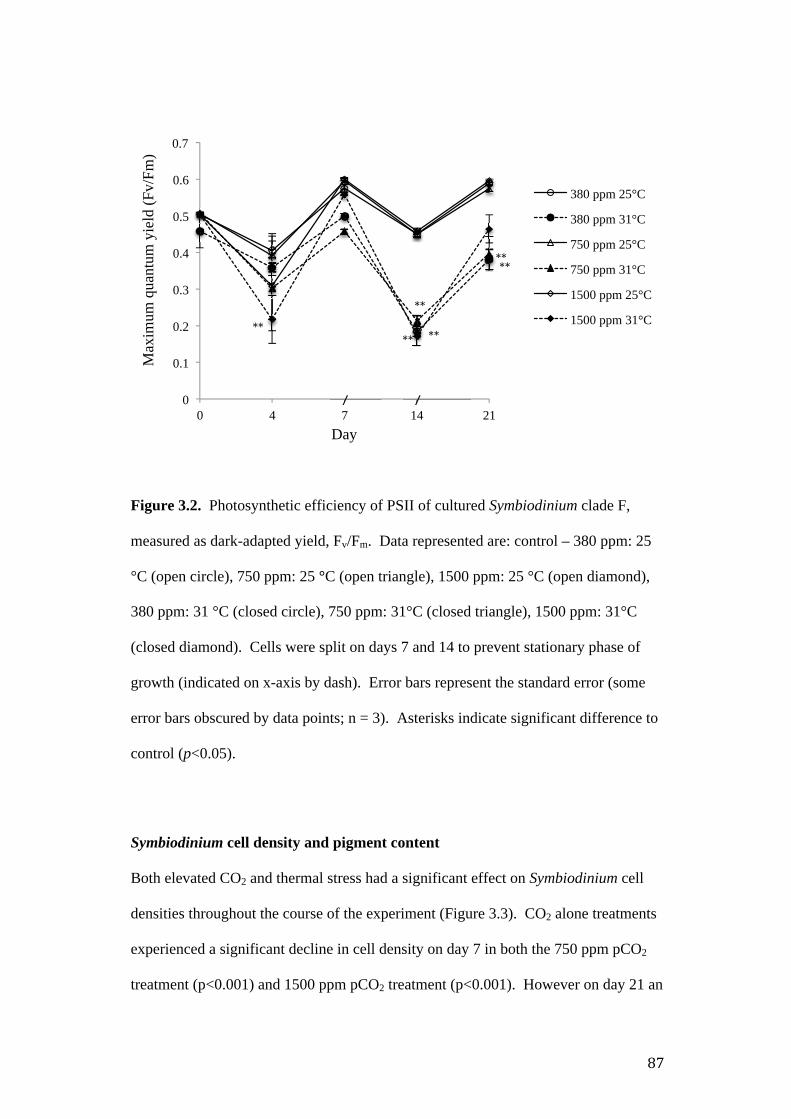
Figure 3.2. Photosynthetic efficiency of PSII of cultured Symbiodinium clade F,
measured as dark-adapted yield, Fv/Fm. Data represented are: control – 380 ppm: 25
°C (open circle), 750 ppm: 25 °C (open triangle), 1500 ppm: 25 °C (open diamond),
380 ppm: 31 °C (closed circle), 750 ppm: 31°C (closed triangle), 1500 ppm: 31°C
(closed diamond). Cells were split on days 7 and 14 to prevent stationary phase of
growth (indicated on x-axis by dash). Error bars represent the standard error (some
error bars obscured by data points; n = 3). Asterisks indicate significant difference to
control (p<0.05).
Symbiodinium cell density and pigment content
Both elevated CO2 and thermal stress had a significant effect on Symbiodinium cell
densities throughout the course of the experiment (Figure 3.3). CO2 alone treatments
experienced a significant decline in cell density on day 7 in both the 750 ppm pCO2
treatment (p<0.001) and 1500 ppm pCO2 treatment (p<0.001). However on day 21 an
0
0.1
0.2
0.3
0.4
0.5
0.6
0.7
0 4 7 14 21
Max
imum
qua
ntum
yie
ld (F
v/Fm
)
Day
380 ppm 25°C
380 ppm 31°C
750 ppm 25°C
750 ppm 31°C
1500 ppm 25°C
1500 ppm 31°C

increase in cell density was observed in the 750 ppm pCO2 treatment (p<0.007)
compared to control treatment (380 pCO2: 25 °C; Figure 3.3). From day 7 of the
experiment all Symbiodinium cells exposed to thermal stress experienced significant
declines in cell densities (p<0.001) and were significantly lower than cell densities in
control treatments (p<0.001). The cell density continued to decrease over the
remaining course of the experiment in all thermally stressed treatments on day 14
(p<0.001) and day 21 (p<0.001). By day 21 average cell densities of all thermal
stress treatments significantly declined to approximately 8 x 10⁴ cells/ml compared to
average cell densities of controls 1.4 x 10⁶ cells/ml. No other changes in cell densities
were seen for any other pCO2 treatment.
Figure 3.3. Symbiodinium cell density exposed to control 380 ppm: 25 °C (open
circle), 750 ppm: 25 °C (open triangle), 1500 ppm: 25 °C (open diamond), 380 ppm:
31 °C (closed circle), 750 ppm: 31°C (closed triangle), 1500 ppm: 31°C (closed
Sym
biod
iniu
m c
ells
(1
x 1
06 cel
ls/m
l)
Day

diamond). Asterisks indicate significant difference to controls (p<0.05). Error bars
represent the standard error (some bars obscured by data points; n = 8).
Elevated CO2 alone conditions did not have any significant effect on
chlorophyll pigment content of Symbiodinium cells. There was however a significant
increase in both the chl c and chl a content per Symbiodinium cell for thermally
stressed treatments from day 7 onwards (Fig 3.4a and b). Chl c per algal cell
increased in thermally stressed treatments on day 14 in the 1500 pCO2 treatment
(p<0.001) and again on day 21 in all thermally stressed treatments (380 ppm pCO2: 31
°C, 750 ppm pCO2: 31 °C and 1500 ppm pCO2: 31 °C) (p<0.001; Figure.3.4a). Chl a
per algal cell also increased in thermally stressed treatments on day 7 in the 1500 ppm
pCO2 (p<0.011), day 14 in the 1500 ppm pCO2 (p<0.001) and on day 21 in all
thermally stressed treatments (380 ppm pCO2: 31°C (p<0.001), 750 ppm pCO2: 31 °C
(p<0.001) and 1500 ppm pCO2: 31 °C (p<0.001) (Figure 3.4b). The ratio of chl c to
chl a was significantly increased in all thermally stressed treatments on day 21
(p<0.05 (Figure 3.4c). No CO2 effect was observed for of chl c to chl a ratio.

Figure 3.4. Symbiodinium pigment concentrations exposed to control - 380 ppm: 25
°C (open circle), 750 ppm: 25 °C (open triangle), 1500 ppm: 25 °C (open diamond),
0 1 2 3 4 5 6 7 8 9
Chl
c (p
g ce
ll -1
)
0
1
2
3
4
5
Chl
a (p
g ce
ll-1)
0
1
2
3
0 4 7 14 21
chl c
: ch
l a
Day
**
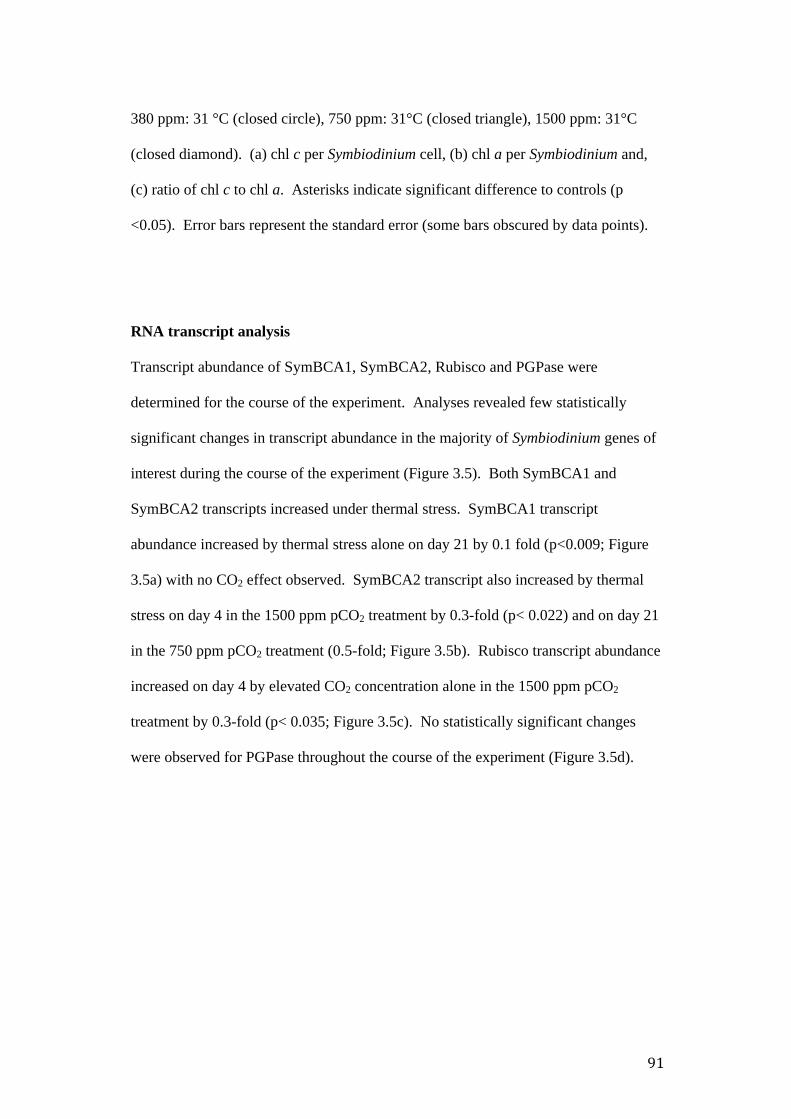
380 ppm: 31 °C (closed circle), 750 ppm: 31°C (closed triangle), 1500 ppm: 31°C
(closed diamond). (a) chl c per Symbiodinium cell, (b) chl a per Symbiodinium and,
(c) ratio of chl c to chl a. Asterisks indicate significant difference to controls (p
<0.05). Error bars represent the standard error (some bars obscured by data points).
RNA transcript analysis
Transcript abundance of SymBCA1, SymBCA2, Rubisco and PGPase were
determined for the course of the experiment. Analyses revealed few statistically
significant changes in transcript abundance in the majority of Symbiodinium genes of
interest during the course of the experiment (Figure 3.5). Both SymBCA1 and
SymBCA2 transcripts increased under thermal stress. SymBCA1 transcript
abundance increased by thermal stress alone on day 21 by 0.1 fold (p<0.009; Figure
3.5a) with no CO2 effect observed. SymBCA2 transcript also increased by thermal
stress on day 4 in the 1500 ppm pCO2 treatment by 0.3-fold (p< 0.022) and on day 21
in the 750 ppm pCO2 treatment (0.5-fold; Figure 3.5b). Rubisco transcript abundance
increased on day 4 by elevated CO2 concentration alone in the 1500 ppm pCO2
treatment by 0.3-fold (p< 0.035; Figure 3.5c). No statistically significant changes
were observed for PGPase throughout the course of the experiment (Figure 3.5d).

Figure 3.5. Transcript abundance of Symbiodinium clade F when exposed to 380
ppm: 31 °C (diagonal line bar), 750 ppm: 25 °C (white bars), 750 ppm: 31°C (light
grey bar), 1500 ppm: 25 °C (dark grey bar) and, 1500 ppm: 31°C (black bar). Values
expressed as ratios of treatment to control (380 ppm: 25°C) for each day. (a)
SymBCA1, (b) SymBCA2, (c) Rubisco and, (d) PGPase. Error bars are standard
error (n=3). Asterisks indicate significant difference to controls (p <0.05).
0.125
0.25
0.5
1
2
4
0 4 7 14 21
Rel
ativ
e ge
ne e
xpre
ssio
n
0.25
0.5
1
2
4
8
16
0 4 7 14 21
Rel
ativ
e ge
ne e
xpre
ssio
n
0.25
0.5
1
2
4
8
0 4 7 14 21
Rel
ativ
e ge
ne e
xpre
ssio
n
Day
0.125
0.25
0.5
1
2
4
0 4 7 14 21
Rel
ativ
e ge
ne e
xpre
ssio
n
Day
Discussion
This study examined the effects of a prolonged 21 day experiment on cells of
Symbiodinium clade F that were exposed to combined elevated pCO2 and temperature
conditions. The response of certain physiological parameters and transcript analyses
of Symbiodinium β-CAs, Rubisco and PGPase were investigated to examine links
between physiological responses and gene expression. The results of this study
revealed that the greatest changes in Symbiodinium cells exposed to combined
elevated pCO2 and temperature were on physiological parameters and cell density
while RNA transcript analysis of the chosen genes of interest revealed few, small
significant changes. In addition, the main driver of these changes was thermal stress
while CO2 conditions that are environmentally relevant had minimal significant
effects over all.
During the course of the experiment Symbiodinium cells exposed to thermal
stress decreased to approximately half the density compared to controls (Figure 3.3),
which is consistent with a variety of other studies examining thermal stress on
Symbiodinium cell densities (Ogawa et al. 2013, Gierz et al. 2016). The CO2 driven
effect that was observed on the decline of cell densities in the 750 ppm pCO2 and
1500 ppm pCO2 treatments on day 7 (Figure 3.3) may be due to cell cultures being
split on this particular time point to prevent stationary phase of growth, as these
changes were not observed throughout the remainder of the experiment. Additionally,
the only other CO2 driven effect that was observed on cell density was an increase in
density in the 750 ppm pCO2 treatment on day 21. Growth rates in Symbiodinium
when exposed to elevated CO2 conditions appear to vary according to the phylotype
examined. For example, the A13 phylotype of Symbiodinium appears to respond
positively to CO2 enrichment while phylotypes A1, A2 and B1 remain largely

unaffected by a doubling in pCO2 from 380 ppm to 780 ppm (Brading et al. 2011).
The heat related increases in Symbiodinium chl a and chl c were surprising and
contradict coral bleaching events, given that previous studies have demonstrated that
cells of Symbiodinium exposed to thermal stress generally lose pigmentation (Brown
et al. 2002, Dove et al. 2006). However, recent studies on Symbiodinium cells
isolated from the coral Acropera aspera have also shown increases in chlorophyll
content under thermal stress (Ogawa et al. 2013, Gierz et al. 2016). The exact cause
of such increases in chlorophyll content is not yet known but has been attributed to
repackaging of chlorophylls in the chloroplast membrane (Bissett et al. 1997) and
may be associated with alterations in the type of pigment-protein complexes
expressed under thermal stress.
Analysis of maximum quantum yield (Fv/Fm) demonstrated that Symbiodinium
cells exposed to thermal stress exhibited depressed photosynthetic rates (Figure 3.2),
while elevated pCO2 concentrations had no significant effect. The decline in
maximum quantum yield efficiency of PSII is a hallmark of thermal stress in
symbiotic dinoflagellates with severe impairment of photosynthesis at temperatures
32-34 °C (Iglesias-Prieto et al. 1992, Jones et al. 1998, Robison and Warner 2006).
While these results are consistent with previous studies on Symbiodinium cells
exposed to thermal stress, both in vitro and in symbiosis (Iglesias-Prieto et al. 1992,
Warner et al. 1996, Warner et al. 1999, Tchernov et al. 2004, Warner et al. 2006,
Gierz et al. 2016), they are in contrast to a study by Oakley et al (2014) that showed
an increase in net and gross maximum photosynthetic rates of 32 % in Symbiodinium
phylotype B when exposed to temperatures up to 34 °C. Oakley et al (2014) found no
evidence for thermal inhibition of the CCM and concluded that CCM components are
therefore not likely to be primary sites of thermal damage in Symbiodinium clade B.

However, it must be noted that differential thermal stress sensitivity has been
observed across the diverse Symbiodinium species, therefore leading to different
impacts on photobiology of cultured Symbiodinium under thermal stress (Tchernov et
al 2004; Robinson and Warner 2006; Takahashi et al 2008). The response of Fv/Fm
during thermal stress may therefore vary with Symbiodinium depending on what
phylotype is examined. Despite the significant decreases observed in Symbiodinium
cell density exposed to thermal stress (Figure 3.3), photosynthetic efficiency of
remnant cells was still maintained throughout the course of the experiment (Figure
3.2). Previous studies on cultured Symbiodinium from phylotype A1 under thermal
and light stress have identified similar differences in growth of cells and PSII
response (Robison and Warner 2006, Krämer et al. 2012). Krämer et al (2012) have
suggested that photosynthesis and growth become uncoupled in A1 cells and that
decline in growth rates may be caused by allocating more energy to protein repair and
or metabolic suppression. However, it is important to note that photochemical
efficiency of PSII can remain high even when there is significant decline in PSII
protein content under thermal stress (Jeans et al. 2014).
While it has previously been shown that enrichment of CO2 can significantly
increase photosynthetic efficiency of Symbiodinium from phylotype A2 (Brading et al
2011), in the present study no CO2 effect was observed on the Fv/Fm in Symbiodinium
clade F cells exposed to enriched pCO2. This is in contrast to results obtained in
Chapter 2 where Fv/Fm was depressed in Symbiodinium clade C1 under elevated pCO2
conditions (Figure 2.6a). These results suggest that compared to clade C1, clade F
may be more CO2 tolerant and therefore could possibly fair better under conditions of
OA.

Increases in photosynthetic efficiency not only seem to be species specific but
may also depend on the particular Ci species preferred for uptake by these species.
Species that rely on diffusive uptake of CO2 are possibly far more likely to show
increases in photosynthetic rates and growth than those species utilising HCO3- or
taking up CO2 actively via a CCM. In addition CCMs generally differ in their design
and efficiency between algal species (Tortell 2000, Giordano et al. 2005), therefore it
is not inconceivable that CCMs may differ in their efficiency and their sensitivity to
enriched CO2 conditions between Symbiodinium phylotypes. In fact CCM expression
has been shown to be environmentally driven and host dependent for some phylotypes
of Symbiodinium. For example, Symbiodinium isolated from corals have been shown
to initially utilise HCO3- but then indiscriminately utilise CO2 and HCO3
- (Goiran et
al. 1996), whereas Symbiodinium isolated from giant clams exhibit a preference for
direct CO2 uptake (Leggat et al. 1999). Interestingly, in the latter study, this
preference changed to direct HCO3- uptake after 2 days of being maintained in culture
(Leggat et al. 1999). Free-living Symbiodinium in culture have been shown to utilise
HCO3- by a sodium dependent mechanism (Al-Moghrabi et al. 1996), which may
reflect a change in physiology between symbiotic and free-living forms.
Although large changes were seen in Symbiodinium physiology, transcript
analysis of selected photosynthetic genes revealed few significant changes in
Symbiodinium. The sustained photocompetency of remaining Symbiodinium cells
exposed to thermal stress seen in the present study may therefore reflect the relatively
stable expression of Rubisco, PGPase and CAs. While it can be assumed that
increases in CO2 should increase the carboxylase activity of Rubisco and hence
photosynthesis, the increase in transcript abundance of Rubisco (0.3-fold; p<0.035)
(Figure 3.5c) did not correspond to any increases in photosynthetic efficiency in the
present study nor did the up-regulation continue through the remainder of the
experiment. Similar transcript patterns for Rubisco were observed in Chapter 2 where
an initial up regulation of Rubisco occurred in Symbiodinium clade C1 cells exposed
to elevated CO2 (750 ppm pCO2; Figure 2.6f). However no other significant changes
in transcript abundance were observed for the remainder of either experiment. In
many plant species CO2 concentration becomes an increasingly greater limitation on
Rubisco activity as less of the Rubisco capacity is used for carboxylation (Salvucci
and Crafts‐Brandner 2004), due to reduced affinity for CO2 and lower solubility of
CO2 at elevated temperatures (Berry and Bjorkman 1980).
Inactivation of Rubisco due to elevated temperature has been one of many
potential sites of thermal sensitivity in Symbiodinium where damage results in a
decrease in photosynthetic efficiency (Jones et al. 1998). While decreases in Rubisco
enzyme activity have previously been observed in Symbiodinium exposed to thermal
stress (Leggat et al. 2004; Lilley et al. 2010), no thermal effect was observed on
Rubisco gene expression patterns in the present study. In addition PGPase remained
unaffected by either elevated CO2 or temperature. This is in contrast to previous
studies conducted on Symbiodinium that have shown PGPase transcript abundance to
decrease in Symbiodinium within corals that had been exposed to elevated pCO2
concentrations (Crawley et al. 2010) and increase when exposed to elevated
temperature treatments (Mayfield et al. 2012). The present results for PGPase
transcript abundance is also in contrast to results obtained in Chapter 2 that
demonstrated a decrease in PGPase transcripts of cultured Symbiodinium clade C1
exposed to elevated pCO2 concentrations (Figure 2.6e). However, the CO2
concentrations used in Chapter 2 to illicit this response was much higher than the
concentrations used for the present study.
Both Symbiodinium β-CA transcripts examined (SymBCA1 and SymBCA2)
were significantly increased by thermal stress (Figure 3.5a and b). It is interesting to
note however that SymBCA1 transcript abundance was only increased by thermal
stress at ambient pCO2 concentrations while SymBCA2 transcript abundance was
only increased by thermal stress combined with elevated pCO2 concentrations of 1500
ppm pCO2 on day 4 (0.3-fold) and on day 21 by 750 ppm pCO2 (0.5-fold; Figure
3.5b). Given the sequence diversity that exists within the β-class of CAs it is not
implausible to assume that differences in expression pattern between SymBCA1 and
SymBCA2 may be due to different roles played in the Symbiodinium CCM of clade F.
Theoretically elevated temperatures increase the need for CA due to the shifting
equilibrium of Ci to less CO2 (Beardall et al. 1998). For example, it has been
demonstrated in microalgae that CA activity has been shown to increase
concomitantly with temperature up to 37 °C (Shiraiwa and Miyachi 1985).
Furthermore, Oakley et al. (2014) showed that overall CCM function was enhanced
by temperatures up to 34 °C in strains of cultured B1, A and D1a Symbiodinium.
While there were increases in transcript abundance of both Symbiodinium β-CAs in
the present study, there was no evidence to suggest a shift in the equilibrium of Ci to
less CO2 as seen in the pCO2 of culture media (Figure 3.1). Whether or not the
increase in transcripts of SymBCA1 and SymBCA2 were due to decreases in CO2
concentration due to increased temperatures would have to be further examined as no
clear pattern of regulation was observed for either SymBCA1 and SymBCA2
throughout the remainder of the study and increases of these transcripts did not
correspond to any changes in physiological parameters. This would be achieved by
examining how much CO2 decreases from 31 °C in comparison to 25 °C with the
same total Ci content.

While it is well known that CA activity and transcripts can decrease with
increasing CO2 concentrations (Van de Waal et al. 2013), both SymBCA1 and
SymBCA2 transcript abundance remained unchanged when exposed to elevated CO2
(750 ppm pCO2 and 1500 ppm pCO2) without thermal stress. These results are
consistent with the RNA transcripts analyses from Chapter 2 where changes in gene
expression were only observed at extreme pCO2 levels of 10 000 ppm pCO2 (Figure
2.6a and b). As in previous targeted studies that have examined transcript levels in
Symbiodinium exposed to environmental stressors, small to minimal changes have
been observed even when significant stress such as light or temperature is applied
(Boldt et al. 2010, Rosic et al. 2010, Leggat et al. 2011, Ogawa et al. 2013, Krueger et
al. 2015, Gierz et al. 2016). These small changes in Symbiodinium transcriptome
levels are most likely a result of a greater dependency on post-transcriptional
regulation within the dinoflagellates (Okamoto and Hastings 2003, Bachvaroff and
Place 2008) and have been hypothesized to primarily drive changes in the proteome,
especially under heat stress (Barshis et al. 2014). Another possibility is that these
particular β-CA genes are constitutively expressed in the CCM even at CO2
concentrations of 750 ppm pCO2 and 1500 ppm pCO2.
In summary, the results of this study have demonstrated that the greatest
change in Symbiodinium clade F exposed to combined elevated pCO2 and temperature
was on physiological parameters and cell density while minimal to no change was
observed for transcript analysis of selected genes. In addition, thermal stress was the
main driver of these changes while CO2 had little effects over all. While no clear link
between physiology and transcript abundance could be inferred from the present
study, it does not rule out the possibility that that these changes may be independent
of some CCM or photosynthetic components, such as CA, Rubisco and or PGPase.

Future work should therefore focus on post-transcriptional responses of Symbiodinium
in order to determine the response of Symbiodinium to combined elevated pCO2 and
temperature conditions. Unfortunately there is currently little literature evaluating the
effects of temperature on Symbiodinium CCMs with which to compare our results
therefore interpretation of results should be done with caution and until additional
experiments are conducted. The results of the present study however emphasize the
diversity and variability of physiological responses that can exist both between and
within different phylotypes of Symbiodinium when exposed to significant
environment stresses, and illustrate minimal transcriptional regulation under such
conditions.
Chapter 3 Summary points
• The greatest change in Symbiodinium clade F exposed to combined elevated
pCO2 and temperature was on physiological parameters and cell density while
minimal to no change was observed for transcript analysis of selected
photosynthetic genes.
• Elevated temperature was the main driver of these changes.
• Both SymBCA1 and SymBCA2 transcripts increased under thermal stress
however, SymBCA2 transcript levels were only increased by thermal stress if
combined with elevated pCO2 concentrations.
• Rubisco transcript abundance increased under elevated pCO2 alone (1500 ppm
pCO2)

• No clear link between physiological responses or with genes coding for
proteins involved in the physiological pathways examined were observed, with
greater changes possibly observable post-transcriptionally.
• The present results support and demonstrate the variability between and within
the different phylotypes of Symbiodinium exposed to certain environmental
stressors.

Schematic representation of thesis outline
Chapter 2
Objective 1: Isolation and characterisation of CA in Symbiodinium and effects of increased CO2 concentrations on CA expression and CCM.
Chapter 3
Objective 2: Effects of combined increased CO2 concentrations and temperature on Symbiodinium CAs and CCM.
Chapter 4
Objective 3: Carbonic anhydrase expression in Symbiodinium in response to varied light environments.
Chapter 5
Objective 4: Changes in Symbiodinium transcriptome in response to elevated CO2 concentrations.
Chapter 6
General discussions, thesis conclusions and future directions.
Chapter 1
General Introduction and thesis objectives.
Chapter 4: Carbonic anhydrase expression in Symbiodinium sp. in
response to varied light environments
Statement of purpose
Light is a crucial factor in photosynthesis that serves as an energy source to fuel
photosynthetic fixation of CO2. However, under certain conditions, light also has the
potential to be toxic to photosynthesis and forces photoautotrophs to acclimate to
maintain the efficiency of photosynthesis and avoid photodamage. Natural
environments exhibit a dynamic range of light conditions, from very high intensities
in full sunlight (higher than 2000 μmol photons m_2 s_1) to heavily shaded
conditions with little available light. In addition to CO2 concentrations, light has been
shown to control the extent of some algal carbon-concentrating mechanisms (CCMs),
such as in the green algae Chlamydomonas reinhardtii, with transcriptional changes
in certain photosynthetic genes involved in the CCM under varied light conditions. In
the present study, quantitative PCR (qPCR) was used to determine transcript
abundance of SymBCA1 and SymBCA2 and two chlorophyll a-chlorophyll c 2-
peridinin-proteins in Symbiodinium C1 cells acclimated to high and medium-light
conditions and transferred to different light conditions for nine days in air levels of
CO2. The efficiency of photosystem II (PSII) to perform photosynthesis was also
measured to resolve two key issues: (1) do varied light intensities regulate
transcription of Symbiodinium β-CAs and acpPCPs and are these changes linked to
physiological parameters and, (b) are response times of Symbiodinium to changes in
light intensity consistent with changes in the time scale observed for other organisms.
Introduction
It is well known that a key component of the Symbiodinium-coral relationship is the
symbionts’ ability to perform photosynthesis and the subsequent translocation of
photosynthetic products to the host that accounts for the majority of metabolic energy
required by the host (Muscatine 1990). Numerous studies have identified
environmental factors that can affect the process of photosynthesis, such as
temperature (Berry and Bjorkman 1980, Hoegh-Guldberg and Smith 1989, Iglesias-
Prieto et al. 1992, Jones et al. 1998, Al-Khatib and Paulsen 1999), CO2 (Beardall et al.
1998, Bhatt et al. 2010, Errera et al. 2014, Clement et al. 2017) and light availability
(Hoegh-Guldberg and Smith 1989, LaRoche et al. 1991, Iwai et al. 2007, Erickson et
al. 2015). However little attention has been paid to the effects varied light intensities
have on transcription rates of several genes involved in the Symbiodinium CCM.
Photosynthesis is a light-driven process that occurs in two sequential stages,
the light-dependant reactions and the light-independent (or dark) reactions. The light
reactions are based around two photosystems, photosystem I (PSI) and photosystem II
(PSII). PSI and PSII perform the primary photochemistry involving the absorption of
light energy via chlorophyll molecules that are attached to light-harvesting complexes
(LHCs) and the subsequent transfer of energy to the photosystem reaction centres,
where charge separation of electrons occur (Huner et al. 1998). Light harvesting is
mediated in dinoflagellates by two LHCs that bind these photosynthetic pigments; the
water-soluble protein peridinin-chlorophyll a-binding proteins (PCPs) and the water-
insoluble chlorophyll a-chlorophyll c 2-peridinin-protein complexes (acpPC), both of
which are present in multiple forms in dinoflagellates (Boldt et al. 2012). The light-
independent or dark reaction is where carbon fixation occurs and is where the enzyme
ribulose-1,5-bisphosphate carboxylase/oxygenase (Rubisco) catalyses the first step of

carbon fixation via the capture of CO2 through the Calvin-Benson cycle. The fixation
of CO2 by Rubisco is an active process that is driven by the adenosine triphosphate
(ATP) and nicotinamide adenine dinucleotide phosphate hydrogen (NADPH)
generated from the light-dependant stage of photosynthesis (Raven et al. 2000;
Beardall and Giordano 2002). In Symbiodinium the process of carbon acquisition and
fixation is augmented by the use of a CCM, which allows cells to concentrate Ci at
the site of Rubisco. Algal CCMs involve several CA enzymes that, based on locality
within the cell, are involved in CO2 capture, CO2 transportation and rapid inter-
conversion between the carbon species (Giordano et al. 2005, Moroney and Ynalvez
2007). The acquired CO2 then undergoes reduction in photosynthetic reactions to
form carbohydrates that are either used to meet the alga’s own energy requirements, if
in a free-living state, or translocated to the host if in symbiosis.
In all photosynthetic organisms the balance between light flux and carbon
fixation must be balanced for the photosynthetic process to be carried out efficiently.
Although light is an energy source that fuels photosynthetic CO2 fixation, limited or
excess light intensities are known to stress and imbalance aspects of photosynthesis
including light-utilisation, carbon acquisition and fixation (Coles and Jokiel 1978,
Hoegh-Guldberg and Smith 1989, Al-Khatib and Paulsen 1999, Demmig-Adams and
Adams 2000). Limited light levels have been shown to cause a decrease in affinity
for inorganic carbon (Ci), suggesting that the activity of the CCM is lowered as
photon flux densities decrease and that the accumulation and transportation of Ci
within cells is light dependent (Spalding and Ogren 1982) and may be driven by
photosynthesis (Badger and Andrews 1982, Spalding et al. 1984, Kaplan et al. 1987).
Conversely, exposure to high light environments can lead to a limitation of CO2 and
result in the absorption of excess light energy by photosynthetic pigments. When
light absorption exceeds the capacity for carbon fixation, production and
accumulation of reactive oxygen species (ROS) may damage cells, result in PSII
excitation pressure that can affect an organism’s photochemistry (Huner et al. 1998)
and disrupt PSII reaction centers leading to photoinhibition (Niyogi 1999). All
photoautotrophs must therefore be able to alter components of their photosynthetic
apparatus and employ a range of photo-acclimation responses to maximise the
efficiency of light capture and hence carbon fixation under varying environmental
conditions (Iglesias-Prieto and Trench 1994, Iglesias-Prieto and Trench 1997,
MacIntyre et al. 2002). Some of these photo-acclimation responses include changes
in pigment-protein complexes (Demmig-Adams and Adams 1992), redistribution of
excitation energy between PSI and PSII (Biggins and Bruce 1989) and lowering
quantum yield of PSII in high light (HL) conditions via induction of non-
photochemical quenching (NPQ) of fluorescence (Müller et al. 2001). Activation of
these mechanisms in response to varying environmental factors can occur on varying
time scales ranging from seconds or hours (for functional adjustments to individual
proteins within the photosynthetic apparatus) to weeks or months (for developmental
adjustments to the whole or parts of the organism) (Walters 2005).
Prior research has demonstrated that transcription rates of several genes
involved in photosynthesis in many algal species, including Symbiodinium, are
influenced by light intensities (Hobson et al. 1985, Xu and Tabita 1996, Im and
Grossman 2002, Xiang et al. 2015). In addition, the redox state of the electron
transport system may be the driving factor behind gene regulation in photosynthetic
organisms and also represents a sensing or signalling system (Maxwell et al. 1995).
In the green algae C. reinhardtii transcription rates of several Ci transporters and CAs
involved in the CCM are transcriptionally up-regulated in light, with evidence

suggesting that in addition to CO2 limitation, light and the operation of a complete
photosynthetic apparatus is associated with CA and CCM induction (Spencer et al.
1983, Spalding et al. 1984, Yamano et al. 2008). As with other photosynthetic
organisms, Symbiodinium are also able to adjust any imbalances between light
absorption and utilisation to minimise induced damage to PSII, limiting
photoinhibition and therefore maintaining maximum photosynthetic rates (Iglesias-
Prieto and Trench 1994, Iglesias-Prieto and Trench 1997, MacIntyre et al. 2002).
Although studies on cultured Symbiodinium indicate that the varied phylotypes differ
in their capacity for photoacclimation (Chang et al. 1983, Porter et al. 1984, Iglesias-
Prieto and Trench 1994), photoacclimation processes can also include cellular
changes that optimise their light-harvesting capabilities such as alterations of their
chlorophyll and peridinin concentrations (Dubinsky et al. 1984, Porter et al. 1984,
Titlyanov et al. 2001, Mass et al. 2007) and preferentially modifying the PSII reaction
centre content (Porter et al. 1984, Iglesias-Prieto and Trench 1994, Hennige et al.
2009).
While Symbiodinium possess a CCM that is active in light and exhibits distinct
light-activated intracellular CA activity (Leggat et al. 1999), factors regulating
photosynthetic proteins still remain poorly understood in Symbiodinium. Little
attention has been paid to the potential for light to regulate expression levels of genes
involved in the CCM, especially CA, and to link any changes in gene expression to
photosynthetic efficiency of Symbiodinium under environmental stress such as light
intensity. Since Ci accumulation and transport is light dependent and requires energy,
in the form of ATP and NADPH produced by the light-dependent stage of
photosynthesis, and CAs are crucial for algal CCMs it is certainly feasible that
fluctuations in the capacity to generate ATP by light availability may restrict the

capacity of Symbiodinium to accumulate and fix Ci for photosynthesis. Such changes
may be evident through transcription rates of some photosynthetic proteins.
Modifying the expression of genes coding for proteins in photosynthesis and the
CCM may therefore be a subcellular means by which Symbiodinium can adjust to
environmental changes such as varied light intensities. This study investigates how
Symbiodinium C1 acclimated to medium light (ML, ~80 - 100 μmol quanta m-2 s-1)
levels or high light (HL, ~250 – 350 μmol quanta m-2 s-1) levels, respond following
transition to a different light regime. Using measures for maximum quantum yield of
PSII, which is an indicator of how efficiently PSII reaction centres are able to perform
photosynthesis, together with transcriptional changes of the two β-CAs, (SymBCA1
and SymBCA2) identified in Chapter 2 and acpPC proteins, this study also sought to
examine whether changes in photosynthetic efficiency could be linked with changes
in gene expression and if the response time of Symbiodinium is similar to other
organisms.
Materials and Methods
Algal cultures
Symbiodinium C1 (CCMP2466) cells were grown in 75 cm2 tissue culture flasks with
PE vented caps (Sarstedt, NC, USA) containing 100 mL of ASP-8A medium (Blank
1987). This particular phylotype was chosen based on previous studies identifying
clade C to dominate zooxanthellate corals (Lien et al. 2012), with subclade C1 being
the most commonly found species amongst many host species (Wong et al. 2016).
Flasks were maintained in a light and temperature controlled refrigerated incubator

TRISL-495-1-SD (Thermoline Scientific, Australia) on a 12 h light:dark cycle
photoperiod with temperature set at 25 oC. Cells of Symbiodinium C1 were grown on
shelves adjusted to 80 µmol - 100 µmol quanta m-2 s-1 provided by four 18 W cool
white fluorescent tubes (Polylux XLR™, GE Lighting). Shade cloth was used to
achieve these desired light intensities and measured using a LI-193SA Underwater
Spherical Quantum Sensor with a LI-250A Light Meter (LI-COR® Biosciences, NE,
USA). Symbiodinium genotype was confirmed through sequencing of the internal
transcribed spacer 2 region (ITS 2; See Chapter 2 methodology).
Experimental design
Symbiodinium C1 cells were cultured on shelves adjusted to 80 μmol - 100 μmol
quanta m-2 s-1 in replicate flasks (n=3). At week seven cells from the replicate flasks
were sub-divided (n=12) and the new replicate flasks were evenly distributed (n=4) to
shelves with varying light levels; high-light (HL, ~250 – 350 μmol quanta m-2 s-1),
medium-light (ML, ~80 - 100 μmol quanta m-2 s-1), and low-light (LL, ~10 – 15 μmol
quanta m-2 s-1). Replicates were maintained at these light levels for 25 weeks. During
the 25 week acclimation period cells on the HL and ML shelves were regularly
divided into fresh flasks containing 100 mL of ASP-8A media. LL replicates received
fresh media at the same intervals, but were not divided into new flasks due to limited
cell growth. The resulting 18 flasks (HL, n=9; ML, n=9) were then used in a 10 day
light manipulation experiment.
Control measurements were recorded for HL and ML cells during the mid-point of
the light cycle at time point zero (Day 0). During the mid-point of the dark cycle (Day
0) three flasks from the HL shelf were moved to the ML shelf (HL to ML), three to
the LL shelf (HL to LL) and three remained on the HL shelf (HL control). The
process was repeated with flasks from the ML shelf; three were moved to the HL
shelf (ML to HL), three to the LL shelf (ML to LL) and three remained on the ML
shelf (ML control). All 18 flasks were then sampled at 12 noon on day 1, 2, 3 and 9
with known cell numbers collected for RNA extraction to use in later qPCR analysis
and to measure the photosynthetic efficiency of Symbiodinium cells.
RNA extraction and cDNA synthesis
All equipment used for RNA extractions was treated with RNAseZap® (Ambion Inc,
USA), and any plasticware and reagents were RNAse/DNAse-free. Total RNA from
cultured Symbiodinium was isolated using an RNeasy Plant Mini kit (Qiagen,
Valencia USA). Cultures were harvested by centrifugation at 5000 x g for 2 min, the
pellet resuspended in 450 µL RLT buffer (Qiagen kit buffer), were transferred to a
Lysing Matrix D tube (MP Biomedicals, Australia) and lysed twice for 20 s at 4.0 ms-
1 on a FastPrep®-24 Instrument (MP Biomedicals, Australia). The lysate including cell
debris was transferred to a QIAshredder spin column and RNA extracted according to
manufacturer’s protocol, including the additional centrifuge and elution step using the
initial eluate to increase RNA concentration. Total RNA integrity was assessed by
formaldehyde agarose gel following the protocol of Sambrook and Russell (2001) and
stained with ethidium bromide (200 µg mL-1). RNA quantification and purity was
determined using a NanoDrop-1000 (NanoDrop Technologies, Wilmington USA).
Absorbance was measured at 260 and 280 nm with the ratio of absorbance (A260/A280)
providing an estimation of nucleic acid purity. Only samples with an absorbance ratio
of ≥1.9 were used for quantitative real time PCR (RT-PCR) applications.
cDNA amplification and genomic DNA elimination were performed with
QuantiTect Reverse Transcription® Kit (Qiagen, USA) in a 20 µL reaction using 500
ng of total RNA as template and a RT primer mix consisting of random primers and
oligo-dT. Negative controls prepared without total RNA as template were included
for each series of reactions.
Primer Design
Normalization primers for β-actin and PCNA that were previously validated and
tested for stability under varying light conditions with acpPC from Symbiodinium sp.
clade C3 (Boldt et al., 2009) were used for quantitative PCR. Primers for both
acpPCP and SymBCAs that were designed to sequences obtained from an Expressed
Sequence Tag (EST) library of Symbiodinium sp. C3 (Leggat at al., 2007) were then
tested for compatibility with cDNA isolated from cultured Symbiodinium clade C1.
acpPC and CA primers were designed and checked as per Chapter 2 methods.
RNA transcript analysis
To optimize quantification accuracy template dilution series were prepared. After 4 -
fold dilution with ddH2O, 3 μl of diluted template was analysed using the Rotor-
GeneTM 6000 (Corbett Life Science, Australia). qPCR was performed with 7.5 μl of
Platinum® SYBR® Green qPCR SuperMix-UDG (Invitrogen Corp, Carlsbad, USA)
and gene specific primers (200 nM). The standard protocol was 95oC for 2 min,
followed by 45 cycles of 15 s at 95oC and 30 s at 60oC with the temperature
increasing 1oC every 5 s from 66oC to 95oC in a final melt stage. GeneDiscTM-100
(Corbett Life Sciences, Australia) included reactions for normalization and
Symbiodinium acpPCP and CA genes run in triplicate and non-template controls in
triplicate. Standard curves for the normalization, acpPCP and CA genes were
generated with four triplicates using template from ML and HL Day 0 control
samples. These same controls were used as an additional PCR efficiency check and
included on each GeneDiscTM-100 to ensure inter-disc comparability. Validation for
use as ICG in this experiment was performed using GeNorm in qBASE plus software
package (Biogazelle) with M values of 0.5 or lower deemed acceptable.
Imaging – pulse amplitude modulated fluorometry
At each time point 300 µL of cells were taken from all experimental flasks for
variable chlorophyll fluorescence measurements. Cells were dark adapted for 15 min
at room temperature prior to each Fv/Fm measurement using a Maxi-Imaging Pulse
Amplitude Modulated Chlorophyll Fluorometer (Heinz Walz GmbH, Germany). The
maximum photosystem II (PSII) efficiency of Symbiodinium cells exposed to
different light levels was expressed as Fv/Fm. Fv/Fm results can act as an indicator of
the efficiency of PSII reaction centres.
Statistical analysis
Statistical analysis was performed using statistical software package SPSS (IBM). A
generalised linear model (GLM) was applied for pairwise comparison using light and
day as main effects and light X day as an interaction. Post hoc analysis was
performed on all data using sequential Bonferroni (α<0.05) to determine significant
differences between treatments and controls.
Results
Imaging – pulse amplitude modulated fluorometry
Maximum quantum yield measurements for Symbiodinium C1 acclimated to HL
(~250 – 350 μmol quanta m-2 s-1) and transferred to ML (~80 - 100 μmol quanta m-2 s-
1) or LL conditions (~10 – 15 μmol quanta m-2 s-1), and ML acclimated cells
transferred to HL or LL conditions, were determined for each sampling day (Figure
4.1a and b). Sampling on Day 0, the day prior to replicates being transitioned to a
new light level, demonstrated that acclimation to HL or ML conditions significantly
affected maximum photochemical efficiency (p<0.001; Figure 4.1a and b). The
maximum quantum yield for Symbiodinium C1 grown and maintained between 250-
350 μmol quanta m-2 s -1 (HL controls) did not vary significantly from day 0 to day 9
(p=0.168; Figure 4.1a). Fv/Fm decreased from 0.27 to 0.24 by day 3 then remained
unchanged. The opposite was evident in both the HL to ML and HL to LL samples.
Transition of cells from HL to ML saw an initial increase in Fv/Fm on day 1 which
remained stable for the duration of the experiment (Figure 4.1a). Fv/Fm for HL to ML
cells increased significantly on days 1 (p=0.005), 2 (p=0.262), 3 (p<0.001), and 9
(p<0.001) compared to HL controls. The transition of cells from HL to LL also
showed significant increases in Fv/Fm for days 1 (p=0.009), day 2 (p=0.0369), day 3
(p<0.001) and day 9 (p<0.001) with PSII efficiency increasing from 0.27 on day 1 to
0.44 by day 9; p<0.001).
Fv/Fm for Symbiodinium C1 isolates grown and held at 80 – 100 μmol quanta
m-2 s-1 (ML controls) remained relatively stable for the duration of the experiment
decreasing from 0.37 (Day 0) to 0.35 (Day 9; p=0.07; Figure 4.1b). While PSII
efficiency for cells transferred from ML to LL remained relatively unchanged during

the initial three days, there was a significant increase in Fv/Fm on day 9 to 0.47
(p<0.001; Figure 4.1b). Fv/Fm for ML to HL isolates however significantly declined
on sampling days 1 (p<0.001), 2 (p<0.001) 3 (p< 0.001) and 9 (p<0.001) compared to
ML controls and showed minimal signs of recovery at the end of the experimental
period following an initial drop from 0.37 to 0.26 on day 1 and remained impaired at
0.28 on day 9 (Figure 4.1b). Overall, the maximum quantum yield for ML
Symbiodinium C1 cells shifted to HL and LL differed significantly for the duration of
experiment (p<0.001).
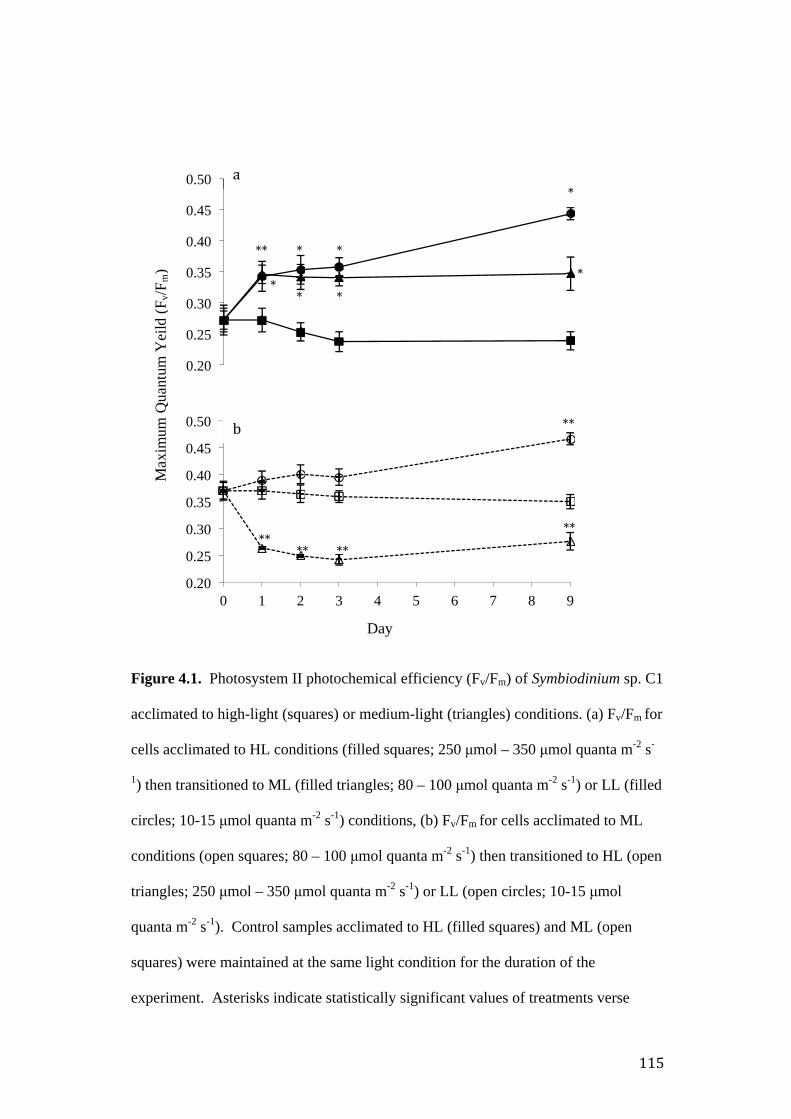
Figure 4.1. Photosystem II photochemical efficiency (Fv/Fm) of Symbiodinium sp. C1
acclimated to high-light (squares) or medium-light (triangles) conditions. (a) Fv/Fm for
cells acclimated to HL conditions (filled squares; 250 μmol – 350 μmol quanta m-2 s-
1) then transitioned to ML (filled triangles; 80 – 100 μmol quanta m-2 s-1) or LL (filled
circles; 10-15 μmol quanta m-2 s-1) conditions, (b) Fv/Fm for cells acclimated to ML
conditions (open squares; 80 – 100 μmol quanta m-2 s-1) then transitioned to HL (open
triangles; 250 μmol – 350 μmol quanta m-2 s-1) or LL (open circles; 10-15 μmol
quanta m-2 s-1). Control samples acclimated to HL (filled squares) and ML (open
squares) were maintained at the same light condition for the duration of the
experiment. Asterisks indicate statistically significant values of treatments verse
0.20
0.25
0.30
0.35
0.40
0.45
0.50
0.20
0.25
0.30
0.35
0.40
0.45
0.50
0 1 2 3 4 5 6 7 8 9
Day
Max
imum
Qua
ntum
Yei
ld (F
v/Fm
)
controls. Error bars represent the standard error for expression values for three
biological replicates (n=3).
RNA transcript analysis
During the 9 day experimental period there were no statistically significant changes in
mRNA transcript levels observed for any of the selected genes in cells of
Symbiodinium C1 that were acclimated to HL levels and moved to either ML or LL
levels (Figure 4.2).

Figure 4.2. Transcript analysis of Symbiodinium exposed to varied light intensities.
(a) SymBCA1, (b) SymBCA2, (c) acpPC_15 and, (d) acpPC_17 acclimated to high-
light conditions (filled squares) prior to transitioning to medium light (filled triangles)
or low-light (filled circles) conditions. Values expressed as ratios of treatment to
controls (filled squares). Error bars are SEM (n = 3).
In contrast, there were statistically significant changes in transcript abundance
of Symbiodinium C1 cells acclimated to ML conditions and moved to HL conditions
(Figure 4.3a-d). mRNA transcript levels for SymBCA1, SymBCA2, acpPC_15 and
acpPC_17, all experienced a significant decreases on day 9 compared to controls.
0.5
1
2
0 1 2 3 4 5 6 7 8 9
Rel
ativ
e ge
ne e
xpre
ssio
n
Day
Rel
ativ
e ge
ne e
xpre
ssio
n
0.25
0.5
1
2
0 1 2 3 4 5 6 7 8 9
Rel
ativ
e ge
ne e
xpre
ssio
n
Day
d
0.25
0.5
1
2
0 1 2 3 4 5 6 7 8 9
Rel
ativ
e ge
ne e
xpre
ssio
n a
b
c

SymBCA1 and SymBCA2 transcript levels decreased by 2-fold (p<0.001; Figure
4.3a) and 1.9-fold respectively (p=0.003; Figure 4.3b), while acpPC_15 and
acpPC_17 decreased by 1.8-fold (p<0.001; Figure 4.3c) and 1.9-fold (p<0.001; Figure
4.3d) respectively. There were no significant changes to transcript levels of
SymBCA1, SymBCA2, acpPC_15 and acpPC_17 for cells that were acclimated to
ML and moved to LL levels (Figure 4.3).
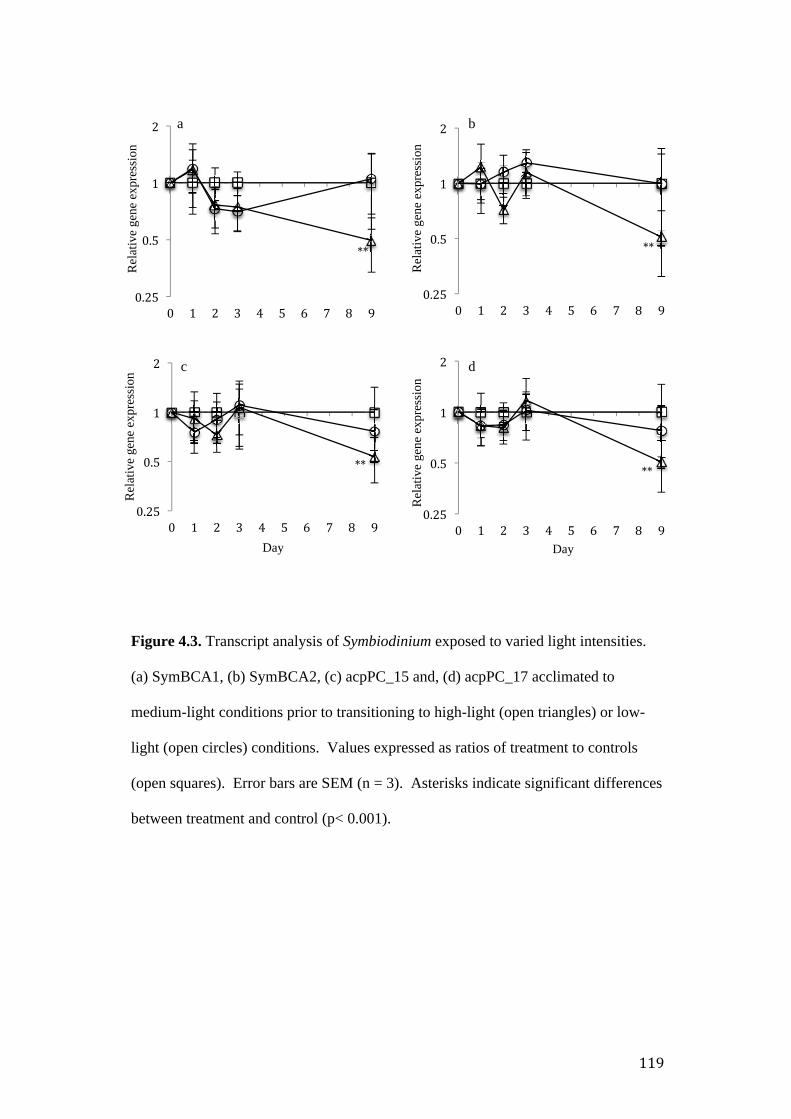
Figure 4.3. Transcript analysis of Symbiodinium exposed to varied light intensities.
(a) SymBCA1, (b) SymBCA2, (c) acpPC_15 and, (d) acpPC_17 acclimated to
medium-light conditions prior to transitioning to high-light (open triangles) or low-
light (open circles) conditions. Values expressed as ratios of treatment to controls
(open squares). Error bars are SEM (n = 3). Asterisks indicate significant differences
between treatment and control (p< 0.001).
Rel
ativ
e ge
ne e
xpre
ssio
n
b R
elat
ive
gene
exp
ress
ion
a
Rel
ativ
e ge
ne e
xpre
ssio
n
Day
d
Rel
ativ
e ge
ne e
xpre
ssio
n
Day
c
Discussion
Light is considered to be a major regulator of expression of photosynthetic proteins
(Escoubas et al. 1995, Pfannschmidt et al. 1999, Pfannschmidt et al. 2008) and
photoautotrophs exposed to limiting light levels demonstrate strategies that increase
light adsorption while organisms exposed to HL conditions demonstrate strategies
that alleviate oxidative stress (Lesser and Shick 1989). Modifying the transcription of
specific genes involved in photosynthesis is therefore required for cells to adjust to a
changing environment (Im and Grossman 2002). The present study examined the
effects of varied light intensities on Symbiodinium, through transcript analysis of
SymBCA1 and SymBCA2 and, on light-harvesting genes acpPC_15 and acpPC_17
involved in the capture of light energy. In addition, the photosynthetic efficiency of
PSII under these varied light intensities was measured in order to determine if
changes in transcript abundance are consistent with changes observed for
photosynthetic efficiency and if the response time of Symbiodinium to these
conditions occurs at the same rate as in other organisms.
In the present study, all cultures that were exposed to HL conditions showed
significantly lower photochemical efficiencies compared to cultures that were
exposed to either ML or LL conditions (Figure 4.1a and 4.1b), regardless of whether
they were first acclimated to HL or ML conditions. A sudden rise in light intensity
(or drop in CO2 availability) increases excitation pressure at PSII (Allorent et al.
2013). Subsequently, after the onset of high excitation pressure, NPQ mechanisms
are activated (Allorent et al. 2013). Decreases in Fv/Fm are characteristic of
organisms exposed to HL conditions (Iwai et al. 2007). Such decreases in Fv/Fm can
be associated with photoinhibition involving damage to PSII reaction centres,
accumulation of photoinactive PSII (Baker 2008) or photoprotective processes
including NPQ (Brown et al. 1999). While a slight decline in Fv/Fm was observed for
Symbiodinium acclimated to HL and left at HL conditions (HL controls), from 0.272
to 0.239 (Figure 4.1a), the decline may be due to photoacclimation, rather than
photoinhibition, as after a reduction in the first 3 days, Fv/Fm stabilises at a new steady
state for the remainder of the experiment. The opposite is true for cultures that were
transferred to lower irradiances, with significantly higher Fv/Fm values overall, while
those exposed to ML conditions maintained relatively constant Fv/Fm values
throughout the experiment (Figure 4.1a and b). Despite the significant decrease in
Fv/Fm at HL conditions and increases in Fv/Fm in Symbiodinium acclimated to HL and
moved to ML or LL conditions (Figure 4.1a), significant changes in CA and or
acpPCP transcript levels were not observed and therefore could not be linked to any
changes in PSII for cells acclimated to HL and moved to ML or LL conditions. The
light-harvesting complex II (LHCII) are one of the first detectable proteins to increase
production when green algae are transferred from HL to LL conditions (LaRoche et
al. 1991) and with Dunaliella tertiolecta, a decrease in light level corresponds with a
4 fold increase in chlorophyll a/b- binding protein (cab) mRNA within the first 9
hours (LaRoche et al. 1991). This initial increase is followed by a decrease in mRNA
levels and a new stable state is achieved that is 2 fold higher than the cab mRNA
levels of HL cells (LaRoche et al. 1991). The new steady state is reached within the
first 18 h of being shifted to the LL conditions and is maintained for at least another
18 h (LaRoche et al. 1991). Increases in cab mRNA are detectable within 1.5 h of the
cells being moved from HL to LL and changes in cab mRNA abundance correlate
with increases in the amount of chlorophyll per cell (LaRoche et al. 1991). However
care should be taken when comparing transcript abundance measured in the present
study with protein amounts in other studies, as protein measurements were not
included in this study.
Significant changes in CA and acpPC mRNA transcript levels were however
evident in Symbiodinium acclimated to ML and transitioned to HL conditions with
significant down-regulation of both SymBCA1 and SymBCA2 and acpPC_15 and
acpPC_17 on day 9, compared to controls (Figure 4.3 and 4.4). Correspondingly, the
down-regulation of these transcripts coincided with decreases in Fv/Fm (Figure 4.1b).
Intracellular redox levels, as set by photosynthetic electron transport rates, have
previously been implicated in the regulation of nuclear-encoded genes associated with
photosynthesis and has been suggested to be important for CCM induction (Escoubas
et al. 1995, Pfannschmidt et al. 2001). For example, it was observed in C. reinhardtii
that a mitochondrial CA involved in the CCM was not induced by low CO2 conditions
if cells were maintained in low light levels (<75 μmol quanta m-2 s-1) (Villand et al.
1997). As light intensity is elevated, the imbalance between photon excitation and
electron transport causes saturation of the photosynthetic rate. Photosynthesis
therefore becomes incapable of using all the light energy that has been absorbed.
Blocking photosynthetic electron transport has previously been shown to down-
regulate expression levels of low CO2- inducible genes, such as CAs, in C. reinhardtii
(Dionisio-Sese et al. 1990, Im and Grossman 2002) and decreases the ability of cells
to accumulate Ci for photosynthesis (Badger et al 1980).
A key observation in the present study is that while the physiological response
of Symbiodinium moved to HL conditions is consistent with previous studies on
Symbiodinium and other photosynthetic algae which report lower Fv/Fm values for HL
conditions (Robison and Warner 2006, Hennige et al. 2009), the acclimation process
of cells acclimated to ML and moved to HL takes place mostly during the first day for
PSII while significant changes in transcription in both SymBCA1 and SymBCA2 and
acpPCs takes place much later on day 9 with relatively small fold changes (0.49 and
0.51 fold respectively; Figure 4.3a and b). In C. reinhardtii several transcripts
encoding Ci transporters, mitochondrial CAs and light-harvesting proteins rapidly
alter mRNA concentrations within 1-2 hours of a shift to HL conditions (Durnford et
al. 2003, Tirumani et al. 2014). The abundance of mRNA encoding the PSII
associated antennae proteins, LHCII and mRNA encoding LHCI complex, all
decrease rapidly in response to HL conditions but recover to near starting abundance
after approximately 8 hours at HL (Dunford et al. 2003). In addition, the
mitochondrial CAs of C. reinhardtii (CAH4 and CAH5) are known to be up-regulated
in light reaching maximum levels of transcript within 6 hrs of exposure to light and
associated protein levels reaching maximum levels by 9-12 hours of light exposure
(Tirumani et al 2014). Furthermore, transcript accumulation for the periplasmic CA
(CAH1) was observed within 1-2 hours after cells of C. reinhardtti were exposed to
HL conditions (Dionisio-Sese et al 1990). It must be noted however that these
cultures were also grown in high CO2 conditions prior to transfer to a combined low
CO2 and HL environment. There may be three possible reasons for a delay in
observable mRNA transcript levels of Symbiodinium CAs and acpPCs in the present
study. The first may relate to the mRNA stability of Symbiodinium under light stress.
For example, a study on mRNA stability in the dinoflagellate Karenia brevis found
dinoflagellate mRNA half-lives (the time required to degrade 50% of the mRNA) to
be considerably longer than in other organisms (Morey and Van Dolah 2013). The
majority of transcripts involved in the stress response, metabolism, and transcriptional
regulation had half-lives over 24 h, and in some cases over four days (e.g.,
catalase/peroxidase, thioredoxin, and chaperone protein DnaJ) (Morey and Van Dolah
2013). Thus, detectable and significant changes in Symbiodinium mRNA expression

may require Symbiodinium to be subjected to longer experimental periods (Levin et
al. 2016). The second possible reason for delayed changes in transcript abundance
may be due to circadian regulation of proteins. Translational control mechanisms
have previously been observed for circadian clock genes, such as bioluminescence
(Morse et al. 1989), the nuclear-encoded chloroplast glyceraldehyde-3-phosphate
dehydrogenase (GAPDH) (Fagan et al. 1999) and the water-soluble LHC protein PCP
(Le et al. 2001), along with post-translational controls (Nassoury et al. 2001). It has
also been demonstrated that both the periplasmic and mitochondrial CAs of C.
reinhardtii are under the control of a circadian clock and are up-regulated in light
(Rawat and Moroney 1995, Eriksson et al. 1998). In dinoflagellates, regulation of
transcript levels of several photosynthetic genes have been shown to increase
transcript abundance approximately 2 hours after exposure to light (Okamoto and
Hastings 2003). Therefore, the possibility that more rapid changes in Symbiodinium
CA and acpPC levels transcript levels occurs within the first few hours post transition
cannot be ruled out. This however would need to be further investigated. The third
possible reason may relate to the unique genomic organization and large genome size
of Symbiodinium in which are permanently condensed (de la Espina et al. 2005). Due
to this, it may mean that Symbiodinium are not able to rapidly alter gene expression
patterns (Leggat et al 2011b).
While significant, detectable changes were observed in both Symbiodinium β-
CAs and both acpPCs examined, these changes were once again minimal. Small (2-4
fold) differences in mRNA transcript levels for dinoflagellate genes however are not
unusual, and have previously been observed in studies exposing Symbiodinium to a
range of environmental stresses (Okamoto and Hastings 2003; Van Dolah et al 2007;
Boldt et al 2009; Ogawa et al 2013; Gierz et al 2016). The results of the present study

not only illustrate that dinoflagellate genes are possibly subject to translational or
other controls that result in greater changes at the physiological level than those of the
transcripts (Okamoto and Hastings 2003), but are also consistent with the results
obtained in previous chapters of this thesis. Furthermore, the results of the present
study demonstrate that like C. reinhardtii, Symbiodinium LHC transcripts decrease
under HL conditions. In contrast, Symbiodinium β-CA transcript levels do not
increase, as demonstrated in C. reinhardtii, but are instead lowered under HL
conditions. This raises the possibility that CO2 or light may not be a sole factor in
regulation of Symbiodinium β-CAs but that an interactive effect between light and
CO2 is required. Given the diversity of CA genes identified in Symbiodinium so far,
the question arises as to whether Symbiodinium CAs are regulated by the same control
mechanism(s) and/or does this differ for different isoforms of CAs. These results also
raise the question whether the β-CAs (SymBCA1 and SymBCA2) are regulated by
the circadian clock.
Chapter 4 Summary points
• SymBCA1 and SymBCA2 transcript abundance from Symbiodinium sp. C1
lowered when cells were acclimated to ML and transitioned to HL. This is in
contrast to CA transcripts of C. reinhardtii that increase under HL conditions.
• Symbiodinium LHC transcripts are lowered under HL conditions as in C.
reinhardtii.
• Observed changes at the transcription level occur slower than responses
evident in other algae.

• Changes to photosynthetic efficiency of PSII could not clearly be linked with
mRNA expression
• The results of the present study support the notion that translational or post-
translational control mechanisms potentially influence Symbiodinium CA and
acpPC transcript abundance and are consistent with transcript changes of
previous chapters of this thesis.

Schematic representation of thesis outline
Chapter 2
Objective 1: Isolation and characterisation of CA in Symbiodinium and effects of increased CO2 concentrations on CA expression and CCM
Chapter 3
Objective 2: Effects of combined increased CO2 concentrations and temperature on Symbiodinium CAs and CCM
Chapter 4
Objective 3: Carbonic anhydrase expression in Symbiodinium in response to varied light environments
Chapter 5
Objective 4: Changes in Symbiodinium transcriptome in response to elevated CO2 concentrations
Chapter 6
General discussions, thesis conclusions and future directions
Chapter 1
General Introduction and thesis objectives
Chapter 5: Changes in Symbiodinium transcriptome in response to
elevated pCO2 concentrations
Statement of Purpose
Endosymbioses between dinoflagellate algae (Symbiodinium sp.) and scleractinian
coral species form the foundation of coral reef ecosystems. However in recent
decades the coral-algal symbiosis has been increasingly threatened by anthropogenic
disturbances such as increases in atmospheric CO2, which are leading to elevated
mean sea surface temperature (SST) and acidification of the oceans. Such changes in
ocean chemistry are in turn causing increased occurrence and intensity of mass coral
bleaching events on the Great Barrier Reef (GBR). Previous chapters of this thesis
have employed targeted gene expression analysis (quantitative-PCR) as a method for
identifying alterations of transcript abundance in Symbiodinium when placed under a
variety of environmental stress conditions. While changes in transcription were
identified, these changes were generally small, with regulation hypothesised to occur
via translational or post-translational processes. Recent advances in sequencing
technologies have enabled transcriptome-wide profiling allowing examination of
expression response of a wide variety of genes when placed under stress. This
method enables enhanced understanding of the stress biology of this important group
of eukaryotes by examination of numerous molecular, cellular and biological features
simultaneously. This chapter examined the transcriptome response of cultured
Symbiodinium to elevated pCO2 conditions using the Illumina-sequencing platform.
In addition, transcriptome data was used to gain further information on the carbonic
anhydrase (CA) gene families in Symbiodinium. Results from this experiment allow a
better understanding of the response of cellular mechanisms of Symbiodinium under

environmental stress conditions.

Introduction
The dinoflagellates are an ecologically diverse group of eukaryotes that display many
unique cellular and genetic traits. Of particular note, dinoflagellates contain some of
the largest and most complex nuclear genomes ranging from 1.5 Gb to 245 Gb (Lin
2011) with the highest levels of DNA found in chromosomes that are permanently
condensed and packaged into liquid crystalline forms instead of nucleosomes. Within
these genomes, individual genes occur in multiple copies, are often encoded in
tandem arrays (Bachvaroff and Place 2008, Lin et al. 2015) with all nuclear encoded
mRNAs possessing an identical trans-spliced leader sequence (Zhang et al 2007). In
addition, there appears to be a greater reliance on translational, rather than
transcriptional, gene regulation in dinoflagellates (Lin 2011). While the
dinoflagellates have some of the largest nuclear genomes of any eukaryote, their
mitochondrial and plastid genomes are among the smallest in term of gene number
with many chloroplast and mitochondrial genes transferred to the nucleus (Bachvaroff
and Place 2008, Howe et al. 2008).
Members of the genus Symbiodinium are photosynthetic endosymbionts of
stony corals and are largely responsible for the photosynthetic productivity that
underlies the vast growth of tropical coral reefs (Falkowski et al 1984). Growing
concerns on the effect of climate change conditions, such as warming oceans and
ocean acidification, have lead to a surge in scientific research on the stress response of
both the coral host and Symbiodinium. On a molecular level, numerous studies have
focused and reported on the number and level of gene expression changes, under
environmental conditions associated with bleaching such as warming oceans,
predominantly in the coral host (DeSalvo et al. 2008, Voolstra et al. 2009, Polato et
al. 2010, Aranda et al. 2016), while Symbiodinium gene expression studies has lagged
behind. The last decade however has seen a rapid growth in molecular studies for
dinoflagellates, especially Symbiodinium, from expressed sequence tag (EST)
analyses (Leggat et al 2007; Voolstra et al 2009), transcriptome studies (Leggat et al
2011; Bayer et al 2012; Rosic et al 2014; Xiang et al 2015; Levin et al 2016; Gierz et
al 2017) to recent genome studies. Such genome studies include the publication of
the first nuclear genome in 2013 for Symbiodinium minutum (clade B1; Shoguchi et al
2013), a complete chloroplast genome released in 2014 (clade C3; Barbrook et al
2014), the genome of Symbiodinium kawagutii released in 2015 (clade F1; Lin et al
2015) and the nuclear genome of Symbiodinium microadriaticum (clade A1; Aranda
et al 2016). These next-generation sequencing projects have allowed for studies of
specific gene families of interest and identification of specific molecular functions
that may or may not be enriched in Symbiodinium compared to other eukaryotes. For
example, comparative analyses of genomes both between the different Symbiodinium
species and other eukaryotes have identified that, all dinoflagellates possess
significantly more transmembrane transporters involved in the exchange of amino
acids. In addition, there appears to be more lipids and glycerol in Symbiodinium than
other eukaryotes and domains involved in the transport of carbon and nitrogen
(bicarbonate transporters, carbonic anhydrases (CAs), and ammonium transporters)
are specifically enriched in the Symbiodinium lineage.
The CA gene family is distinct from other families of enzymes due to the
diversity that is exhibited both in cellular distribution and in the putative or biological
functions of its member enzymes. These enzymes are involved in crucial
physiological processes such as pH and CO2 homeostasis and sensing, ion transport
and respiration (Tashian 1989). In algae, plants and some bacteria, CAs play an
important role in photosynthesis and biosynthetic reactions connected to it (Pocker

and Ng 1973, Graham et al. 1984, Smith et al. 1999, Xu et al. 2008, Capasso and
Supuran 2015). Recent genome studies have provided insight into the extent of CAs
present in Symbiodinium, which have shown CA domains to be overrepresented in the
genomes of S. microadriaticum, S. minutum and S. kawagutii in comparison to other
eukaryotic genomes (Aranda et al 2016). For example, 49 CAs have been identified
in the genome of S. kawagutii, most of which are cytoplasmic with only two δ-CAs
predicted to be localised to the plasma membrane and one β-CA in the thylakoids (Lin
et al. 2015).
Advances in sequencing technologies have also enabled a transcriptome-wide
approach to examine the stress response of Symbiodinium when cells are placed under
environmental stress conditions (Xiong et al. 2015, Levin et al. 2016, Gierz et al.
2017). This method enables a better understanding of the stress biology of this
important group of eukaryotes by examining numerous molecular, cellular and
biological features simultaneously. However, despite recent advances in sequencing
technologies, dinoflagellates are still one of the last major lineages of eukaryotes for
which little is known about genome structure and organisation and large-scale gene
expression studies in Symbiodinium are still lacking. While recent next-generation
sequencing projects have provided large quantities of valuable data, some of these
studies have lacked comparison between stress and non-stress conditions. In addition,
while published transcriptional studies of cultured Symbiodinium under stress have
explored Symbiodinium under conditions such as different light intensities with
different growth conditions (Xiang et al 2015) and thermal stress (Levin et al 2016;
Gierz et al 2017), additional studies are needed to provide insights into Symbiodinium
transcriptomes under elevated pCO2 conditions. Gaining further understanding of
gene expression patterns in Symbiodinium when placed under elevated pCO2 is a

critical step, not only to understanding the coral-algal symbiosis, but also on why the
coral holobiont and hence coral reefs are susceptible to climate change.
Chapter 2 identified and characterised three CAs (two from the β-class and
one from the δ-class CAs) from Symbiodinium and gene expression patterns when
placed under elevated CO2 (10 000 ppm) conditions. Previous chapters of this thesis
have employed quantitative PCR (qPCR) as a method for gene expression analysis of
Symbiodinium under stress conditions. These results demonstrated that alterations in
gene expression generally occurred at low fold changes, with regulation hypothesised
to occur via post-transcriptional mechanisms (Okamoto et al 2001; Bachvaroff et al
2008). In addition, previous chapters examining CA gene expression demonstrated
that the particular CAs examined (SymBCA1 and SymBCA2) have only been altered
by extreme CO2 concentrations of 10 000 ppm CO2 (Chapter 2). This Chapter took a
transcriptome-wide approach using RNA-seq, as opposed to the RT-qPCR based
targeted gene expression analysis, to provide mechanistic insight into the stress
response of Symbiodinium to high pCO2 levels. In addition, this study identified and
examined additional CA transcripts in the Symbiodinium transcriptome.
Material and Methods
Culture growth/Experimental conditions
Cultures of Symbiodinium sp. (Clade F) were grown in a controlled refrigerated
incubator (Thermoline Scientific, Australia) on a 12:12 hr light/dark photoperiod
cycle (80 – 100 μmol quanta m-2 s-1) in tissue culture flasks (Sarstedt, NC, USA)
containing 100 mL of ASP-8A media (Blank 1987). A control concentration of 450
ppm pCO2 was used for growth of cells and for the experiment. During log-phase

growth approximately 106 cells/ml were equally divided into replicate flasks (n=10)
for two experimental conditions; control pCO2 (450 ppm pCO2; n=5) and elevated
pCO2 (10 000 ppm pCO2; n=5) conditions. Replicate flasks were maintained at each
CO2 concentration for a period of 35 days to induce expression of maximum number
of genes. During the 35-day period all replicate flasks received fresh ASP-8A media
at the same intervals and divided to maintain log-phase growth. All 10 flasks were
then sampled during the mid-point of the light cycle (6 hours) on day 36. Cells of
Symbiodinium were harvested for total RNA (tRNA) extraction to use in qPCR
analysis and Illumina sequencing.
Chlorophyll analysis
A total aliquot of 3 ml of culture was taken from all 10 flasks in triplicate for pigment
quantification. Symbiodinium cells were pelleted by centrifugation for 2 min at 5000
g for chlorophyll a (chl a) and chlorophyll c (chl c) quantification. Chlorophylls were
extracted and measured as per Chapter 3 methodology and quantified using the
equations for 90 % acetone (Jeffrey and Humphrey 1975).
Data Analysis
Statistics software package SPSS statistics (V19.0, IBM, USA) was used for all
statistical analyses of physiological parameters. A generalised linear model was used
for pairwise comparison of chl a and chl c with sequential Bonferroni post hoc test to
determine significant differences between control and treatment.
Total RNA extraction and Illumina sequencing
Approximately 8 x 10⁶ Symbiodinium cells were collected for tRNA extraction using
an RNeasy Plant Mini kit (Qiagen, Valencia USA). See Chapter 3 methodology for
details on extraction procedure and measurements. After extraction, concentrations of
isolated tRNAs were measured using a NanoDrop ND-1000 spectrophotometer
(NanoDrop Technologies, Wilmington, DE, USA) and approximately 100 ng of total
RNA was treated with RQ1 RNase-Free DNase (Promega) as per Chapter 2
methodology. RNA-Seq libraries were prepared by the Australian Genome Research
Facility (AGRF, Melbourne, Australia) using the Illumina TruSeq RNA sample
preparation kit (Illumina) and standard Illumina protocols. Sequencing was
performed on the 10 libraries by AGRF on an Illumina HiSeq 2500 platform on one
lane, generating over 150 million 100 bp single-end reads.
mRNA extraction and quantitative PCR validation
Approximately 6 x 10⁶ Symbiodinium cells were collected for mRNA extraction and
snap frozen in lysing matrix D tubes (MP Biomedicals, Australia), for later mRNA
extraction and RT-qPCR analysis. See Chapter 2 methodology for details on
extraction procedures. DNase treatment of all mRNA samples was performed prior to
reverse transcription with approximately 100 ng of mRNA. All mRNA samples were
treated with RQ1 RNase-Free DNase (Promega) as per Chapter 2 methodology and
used as a template for SuperScript™ III First-Strand Synthesis SuperMix for qRT-
PCR kit following manufacturer’s protocol (Invitrogen, California, USA). See
Appendices Table 4-5 for reaction volumes.
RT-qPCR was performed to validate RNA transcription levels of selected
genes of interest (GOI). Twelve GOI were chosen for qPCR validation (six up-

regulated genes and six down-regulated genes) (Table 5.1). Primers for these GOI
were designed using the software DNASTAR Primer Select (Lasergene 11).
Housekeeping genes used for this experiment were selected from previously
established reference genes, which included S-adenosyl methionine synthetase
(SAM), S4 ribosomal protein (Rp-S4), calmodulin (Cal) and cyclophin (Cyc) (Table
5.1) and validated using GeNorm in the qBASE plus software package (Biogazelle).
Template cDNA dilution series were prepared to optimize quantification accuracy.
For analysis, cDNA was diluted 1:40 prior to use as a template in the qPCR analysis.
qPCR was performed using a Rotor-Gene™ 6000 (Corbett Life Science, Australia);
see Chapter 2 methodology for detail on reaction mix and qPCR parameters.
Modifications of Chapter 2 methodology for this experiment were: 62 °C elongation
step during qPCR. Relative expression analysis was performed using qBASE plus 2.5
software (Biogazelle; http://www.biogazelle.com/products/qbasePLUS).
Data assembly and analysis
Sequencing reads from Symbiodinium were trimmed, removing sequence adaptors
and low-quality regions, using libngs (https://github.com/sylvainforet/libngs) with a
minimum quality of 20 bp and a minimum size of 75 bp. The trimmed reads were
then assembled with Trinity (Grabherr et al. 2011) and the resulting assembly
clustered using CD-HIT-EST (Fu and He 2012) using 90% similarity and a word size
of 8. TransDecoder (Haas et al. 2013) and Blast2GO (Conesa et al. 2005) were used
to predict protein-coding sequences. Distribution of gene ontology (GO) terms within
the sequences that were differentially expressed were determined using Blast2GO
(v4.1.5) (Conesa et al. 2016). Nucleotide sequences were imported into Blast2GO

and GO terms generated using default parameters for the blast (blastx), mapping and
annotation steps (Conesa and Götz 2008).
To identify differentially expressed genes (DEG), a pairwise differential
expression analysis was performed through Blast2GO (v4.1.5) (Conesa et al. 2016).
Prior to analysis features with low counts across libraries were filtered and a Trimmed
mean of M values (TMM) was used to calculate normalization factor. A pairwise
comparison was used between control and treatment with exact test selected for
statistical testing (p< 0.05). In addition, gene enrichment analysis (Fischer’s exact
test) of GO ID’s was performed with a false discovery rate (FDR) correction (FDR
≤0.05) to determine the most specific GO terms for DEGs.
Results
Chlorophyll pigment quantification
Chlorophyll pigment analysis was determined for Symbiodinium at the completion
(Day 36) of the experiment. Chl a content per Symbiodinium cell was increased in
treatment cells compared to controls (Figure 5.1a). Analysis of chl a content found
that there was a significant difference between treatment and control (p<0.005).
Though chl c content increased in cells exposed to elevated pCO2 no significant
difference was found between control and treatment cells (p< 0.214; Figure 5.1b). In
addition, no significant difference was observed in the ratio of chl c to chl a in
Symbiodinium cells (Figure 5.1c).

Figure 5.1. Chlorophyll pigment analysis of Symbiodinium clade F exposed to control
(450 ppm pCO2) and elevated pCO2 (10 000 ppm). (a) Concentration of chlorophyll a
(chl a) in Symbiodinium cells, (b) concentration of chlorophyll c (chl c) in
Symbiodinium cells and, (c) ratio of chl a to chl c per Symbiodinium cells exposed to
control (450 ppm pCO2) (grey bar) and treatment (10 000 ppm pCO2) (black bar).
Error bars represent ± SEM (n = 5). Asterisks indicate significant difference to
controls (p <0.05).
0 0.2 0.4 0.6 0.8
1 1.2 1.4 1.6 1.8
2
control 10 000 ppm
Chl
a (
pg c
ell -
1)
Treatment
0 0.2 0.4 0.6 0.8
1 1.2 1.4 1.6 1.8
2
control 10 000 ppm
Chl
c (p
g ce
ll -1
) Treatment
0 0.2 0.4 0.6 0.8
1 1.2 1.4 1.6 1.8
2
control 10 000 ppm
Chl
c:c
hl a
Treatment
a b
c
Chl
a (p
g ce
ll -1
)
C
hl c
(pg
cell
-1)
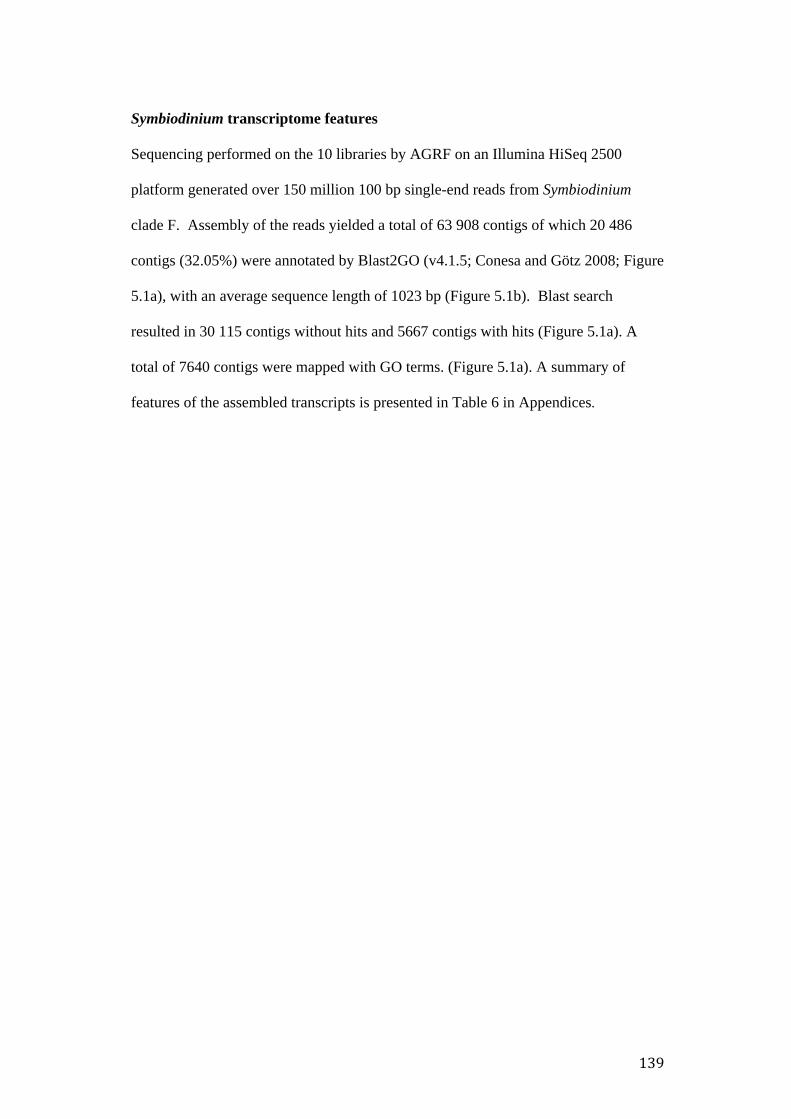
Symbiodinium transcriptome features
Sequencing performed on the 10 libraries by AGRF on an Illumina HiSeq 2500
platform generated over 150 million 100 bp single-end reads from Symbiodinium
clade F. Assembly of the reads yielded a total of 63 908 contigs of which 20 486
contigs (32.05%) were annotated by Blast2GO (v4.1.5; Conesa and Götz 2008; Figure
5.1a), with an average sequence length of 1023 bp (Figure 5.1b). Blast search
resulted in 30 115 contigs without hits and 5667 contigs with hits (Figure 5.1a). A
total of 7640 contigs were mapped with GO terms. (Figure 5.1a). A summary of
features of the assembled transcripts is presented in Table 6 in Appendices.
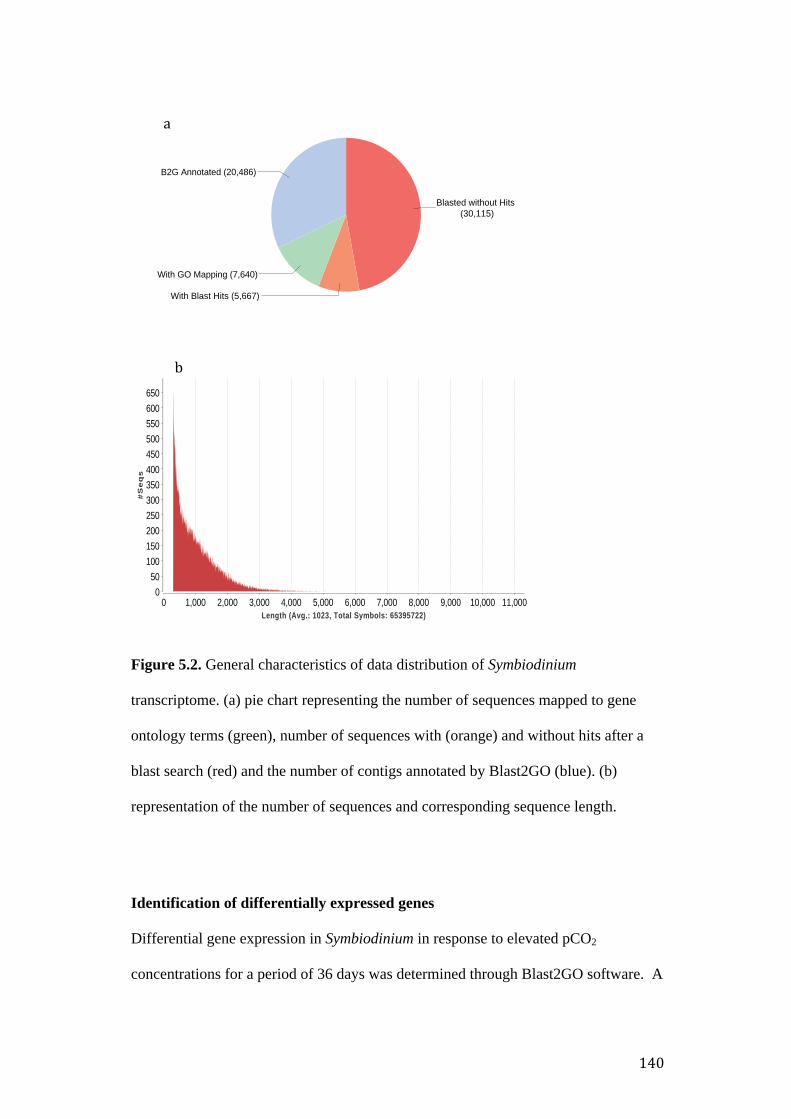
Figure 5.2. General characteristics of data distribution of Symbiodinium
transcriptome. (a) pie chart representing the number of sequences mapped to gene
ontology terms (green), number of sequences with (orange) and without hits after a
blast search (red) and the number of contigs annotated by Blast2GO (blue). (b)
representation of the number of sequences and corresponding sequence length.
Identification of differentially expressed genes
Differential gene expression in Symbiodinium in response to elevated pCO2
concentrations for a period of 36 days was determined through Blast2GO software. A
Data Distribution Pie Chart [zooxbil l002_v2]
B2G Annotated (20,486)
With GO Mapping (7,640)
With Blast Hits (5,667)
Blasted without Hits (30,115)
Number of Sequences with Length(x) [zooxbil l002_v2]
0 1,000 2,000 3,000 4,000 5,000 6,000 7,000 8,000 9,000 10,000 11,000Length (Avg.: 1023, Total Symbols: 65395722)
0
50
100
150
200
250
300
350
400
450
500
550
600
650
#S
eq
s

visual summary of the pairwise differential expression analysis is presented in Figure
5.3. Analysis of sample relationship identified similarities between biological
replicates and a clear separation between control and treatment samples with no
outliers (Figure 5.3a). Overall, 12,728 transcripts were differentially expressed
(FDR<0.05; p< 0.05; Figure 5.3b), accounting for approximately 20 % of the
transcriptome. Of the 12,728 differentially expressed transcripts that were detected,
6620 significantly increased and 6108 were significantly lowered (FDR < 0,05;
Figure 5.3b). The largest increase was a log-fold change (logFC) of 3.75 while the
largest decrease was a logFC of 1.79 (Figure 5.3c and d). The average significant
fold change of differentially expressed transcripts was < 1-fold change in expression
(Figure 5.3c) with both highly and lowly expressed transcripts undergoing similar
fold changes.
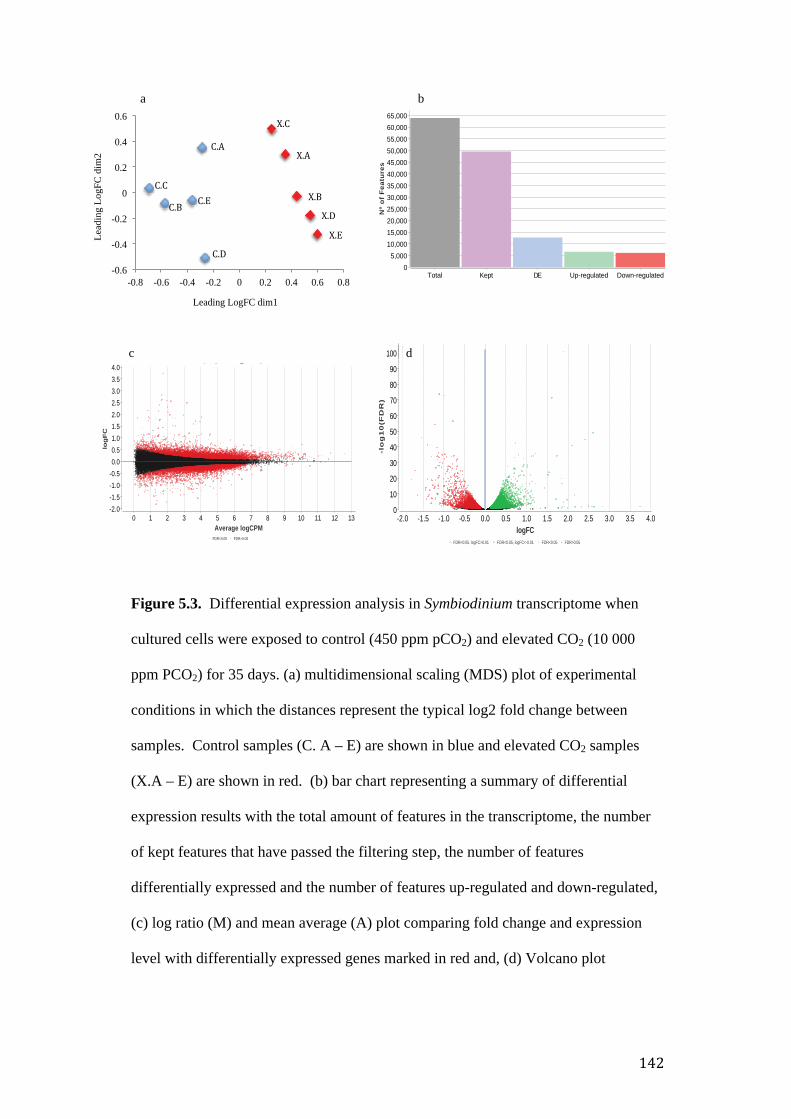
Figure 5.3. Differential expression analysis in Symbiodinium transcriptome when
cultured cells were exposed to control (450 ppm pCO2) and elevated CO2 (10 000
ppm PCO2) for 35 days. (a) multidimensional scaling (MDS) plot of experimental
conditions in which the distances represent the typical log2 fold change between
samples. Control samples (C. A – E) are shown in blue and elevated CO2 samples
(X.A – E) are shown in red. (b) bar chart representing a summary of differential
expression results with the total amount of features in the transcriptome, the number
of kept features that have passed the filtering step, the number of features
differentially expressed and the number of features up-regulated and down-regulated,
(c) log ratio (M) and mean average (A) plot comparing fold change and expression
level with differentially expressed genes marked in red and, (d) Volcano plot
Differential Expression Results [allCounts_results]
Total Kept DE Up-regulated Down-regulated0
5,000
10,000
15,000
20,000
25,000
30,000
35,000
40,000
45,000
50,000
55,000
60,000
65,000
Nº
of
Fe
atu
res
-0.6
-0.4
-0.2
0
0.2
0.4
0.6
-0.8 -0.6 -0.4 -0.2 0 0.2 0.4 0.6 0.8
Lead
ing
LogF
C d
im2
Leading LogFC dim1
MA plot [allCounts_results]
FDR<0.05 FDR>0.05
0 1 2 3 4 5 6 7 8 9 10 11 12 13Average logCPM
-2.0
-1.5
-1.0
-0.5
0.0
0.5
1.0
1.5
2.0
2.5
3.0
3.5
4.0
log
FC
Volcano plot [allCounts_results]
FDR<0.05, logFC>0.01 FDR<0.05, logFC<-0.01 FDR<0.05 FDR>0.05
-2.0 -1.5 -1.0 -0.5 0.0 0.5 1.0 1.5 2.0 2.5 3.0 3.5 4.0logFC
0
10
20
30
40
50
60
70
80
90
100
-lo
g1
0(F
DR
)
a b
c d

comparison of statistical significance and fold change. Up-regulated genes (green),
down-regulated genes (red) and non-differentially expressed (black).
Gene ontology enrichment analysis
To further assess changes in transcript abundance affected by elevated pCO2
conditions, GO term enrichment analysis was performed. Differentially expressed
transcripts were further reduced to most specific GO terms (FDR < 0.05).
Over-represented functions in Symbiodinium transcriptome
GO term enrichment analysis identified several enriched functions in Symbiodinium
cells exposed to elevated CO2 concentrations along with the percentage of sequences
annotated within each function (FDR<0.05; Figure 5.4). Biological functions
involved in energy production, such as photosynthesis-light harvesting
(GO:0009765), chlorophyll biosynthetic processes (GO:0015995), geranylgeranyl
reductase activity (GO:0045550), PSI reaction centre (GO:0009538), ferredoxin-
NADP+ reductase activity (GO:0004324), gluconeogenesis (GO:0006094), oxidative
phosphorylation (GO:0006119), pentose-phosphate shunt (GO:0006098), and ATP
synthesis coupled proton transport (GO:0015986) were significantly enriched in the
up-regulated transcript set. The most notable enriched GO terms were DNA binding
(GO:0003677), Ribosome (GO:0005840) and regulation of transcription, DNA
template (GO:0006355).
Photosynthesis
Expression of the nuclear-encoded light-harvesting complex (LHC) proteins
responsible for enhancing light transfer to core photosystems and photoprotection

were determined in elevated CO2 cells. In total, fifty-seven transcripts encoding the
Symbiodinium specific intrinsic membrane-bound LHC isoforms (acpPC), including
transcripts encoding the photoprotective chlorophyll a-b binding protein L1818,
fucoxanthin-chlorophyll a-c binding protein, caroteno-chlorophyll a-c binding
protein, and LHC I LH38, were detected with significant increases under elevated
CO2 conditions.
Transcripts encoding enzymes involved in chlorophyll biosynthetic processes
(GO:0015995) were also identified. One transcript encoding a magnesium-chelatase
subunit H (chlH) was identified with significant increase in transcript abundance
under elevated CO2 conditions, along with one transcript encoding protochlorophylide
reductase (POR) and one transcript encoding protochlorophylide reductase B
(PORB). Six transcripts encoding geranylgeranyl diphosphate reductase, that
catalyzes the reduction of geranylgeranyl diphosphate to phytyl diphosphate and
provides phytol for chlorophyll synthesis, were also identified and increased.
Transcripts encoding subunits of Photosystem I (PSI) reaction center
(GO:0009538) were identified within DEGs. Seven transcripts encoding polypeptide
subunits of photosystem I (psaD, psaE, psaF, and psaL) were identified all with
significant increases in transcript levels in Symbiodinium cells exposed to elevated
CO2 conditions. Five transcripts encoding for different isoforms of ferredoxin-
NADP+reductase (GO:0004324), an enzyme involved in the last step of the primary
phase of photosynthesis that produces NADP, were also detected with significant
increases in transcript levels in cells exposed to elevated CO2.

Carbonic anhydrases
A total of thirty-two transcripts encoding CAs were detected and annotated in the
Symbiodinium transcriptome. Six transcripts were identified belonging to the α-CA
gene family, 22 transcripts to the β-CA family, two transcripts to the γ- CA family
and two transcripts to the δ-CA gene family. Of the 32 CA transcripts nine
significantly increased in Symbiodinium exposed to elevated pCO2 conditions (FDR
<0.05; p< 0.001), all of which were predicted to be chloroplast targeted and belonging
to the β-CA family (Table 5.2). One transcript (comp 104242_c0), showed homology
to the SymBCA2 gene, previously identified in Chapter 2, and was significantly
increased by elevated pCO2 conditions in the present study (Table 5.2, shown in
bold). This transcript was also predicted as chloroplast targeted, which is in contrast
to the prediction of localisation of SymBCA2 in Chapter 2.
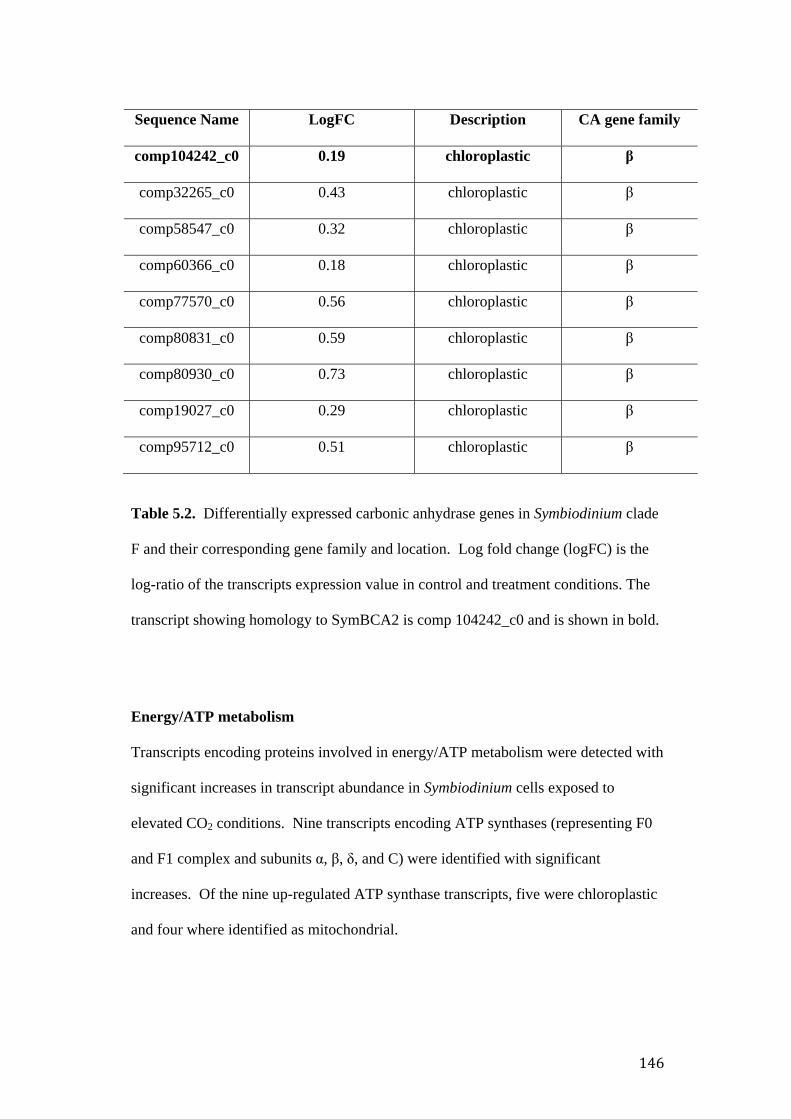
Sequence Name LogFC Description CA gene family
comp104242_c0 0.19 chloroplastic β
comp32265_c0 0.43 chloroplastic β
comp58547_c0 0.32 chloroplastic β
comp60366_c0 0.18 chloroplastic β
comp77570_c0 0.56 chloroplastic β
comp80831_c0 0.59 chloroplastic β
comp80930_c0 0.73 chloroplastic β
comp19027_c0 0.29 chloroplastic β
comp95712_c0 0.51 chloroplastic β
Table 5.2. Differentially expressed carbonic anhydrase genes in Symbiodinium clade
F and their corresponding gene family and location. Log fold change (logFC) is the
log-ratio of the transcripts expression value in control and treatment conditions. The
transcript showing homology to SymBCA2 is comp 104242_c0 and is shown in bold.
Energy/ATP metabolism
Transcripts encoding proteins involved in energy/ATP metabolism were detected with
significant increases in transcript abundance in Symbiodinium cells exposed to
elevated CO2 conditions. Nine transcripts encoding ATP synthases (representing F0
and F1 complex and subunits α, β, δ, and C) were identified with significant
increases. Of the nine up-regulated ATP synthase transcripts, five were chloroplastic
and four where identified as mitochondrial.

Transcripts encoding enzymes involved in the pentose-phosphate pathway
(GO:0006098) were identified with significant increases in transcript levels. These
included two transcripts encoding glucose-6-phosphate dehydrogenase (G6PD), one
transcript encoding 6-phosphogluconate dehydrogenase (6PGD), one transcript
encoding transketolase, and eight transcripts encoding fructose-bisphosphate aldolase.
Transcripts encoding succinate dehydrogenase complex II were identified and
annotated. Succinate dehydrogenase is the only enzyme that is involved in both the
mitochondrial electron transport chain and the citric acid cycle (tricarboxylic acid
cycle). Two transcripts encoding succinate dehydrogenase (ubiquinone) iron-sulfur
subunit 2 (comp71033_c0 and comp47174_c0) and one transcript encoding succinate
dehydrogenase (ubiquinone) flavoprotein (comp72308_c0) all significantly increased
in cells exposed to elevated CO2 concentrations. In addition, transcripts encoding
cytochrome b5, fumarate reductase, cytochrome c oxidase subunit 3 and cytochrome
bc1 complex involved in oxidative phosphorylation (GO:0006119) were also detected
and significantly increased.
Transcripts encoding gluconeogenic pathway proteins (GO:0006094) were
also identified in the transcriptome. Nine transcripts encoding fructose-bisphosphate
aldolase, an enzyme that is also involved in carbon utilization (GO:0015976) were
significantly increased in cells exposed to elevated pCO2 concentrations. In addition,
one transcript encoding phosphoenolpyruvate carboxykinase (PEPCK) was detected
with significant increase in transcript levels.
Transcription factors
The most expressed GO terms were genes involved in DNA binding (GO:0003677)
and the cellular component ribosome (GO:0005840) involved in the cellular process

of translation (GO:0005840; Figure 5.3a). A total of 124 transcripts were identified
for DNA binding. The majority of these transcripts encoded proteins containing cold
shock-like and cold shock domains (CSDs), representing homologs of bacterial cold
shock proteins (CSPs) CspA, B and D and the eukaryotic upstream of N-ras (UNR)
involved in regulation of translation and RNA stability. Transcripts encoding CSD
containing proteins were also identified and significantly increased in GO term
regulation of transcription (GO:0006355). Transcripts encoding mitochondrial and
chloroplastic proteins associated with ribosomal subunits (30S, 50S, 54S, and 60S)
involved in protein synthesis were also identified and showed significant increases in
cells exposed to elevated CO2 conditions.

Figure 5.4. Gene enrichment analysis of most specific up-regulated GO categories in Symbiodinium clade F transcriptome. Enrichment analysis
is expressed as significantly enriched GO terms (X-axis) and the relative percentage of sequences (%) within each GO term having a
significance value of FDR < 0.05 (Y-axis). Black bars correspond to the treatment set (10 000 ppm pCO2) and the grey bars represent control
samples (450 ppm pCO2).
0 0.1 0.2 0.3 0.4 0.5 0.6 0.7 0.8 0.9
1 1.1 1.2 1.3 1.4 1.5 1.6 1.7 1.8 1.9
2
% S
eque
nces
GO Name
Test
Reference Control
Treatment
Under-represented functions in Symbiodinium transcriptome
GO term enrichment analysis identified several under-represented functions in
Symbiodinium cells exposed to elevated pCO2 conditions (FDR <0.05; Figure 5.5).
The most notable down-regulated molecular functions were protein binding
(GO:0005515), ATP binding (GO:0005524), calcium ion binding (GO:0005509), and
protein serine/threonine kinase activity (GO:0004674). Biological processes such as
transmembrane transport (GO:0055085), protein phosphorylation (GO:0006468), and
ammonium transport (GO:0015696) were also under-represented in Symbiodinium
(Figure 5.5).
Transmembrane transport
A total of four hundred and fifty-one transcripts were significantly decreased for the
GO term transmembrane transport (GO:0055085) in Symbiodinium cells exposed to
elevated pCO2 conditions (Figure 5.5). The most abundant transcripts within this GO
category included channel proteins involved in ion transport such as, sodium channel
proteins (type 2, 8, 9 and 11 subunit alpha A and type 4 subunit alpha B), potassium
channel proteins (AKT2 and KAT1), and ATP-binding cassette (ABC) family
transporters. ATP-binding cassette (ABC) family transporters are a large superfamily
of membrane proteins that mediate the transport of a wide variety of molecules across
cell membranes, including ions, amino acids, and peptides (Higgins 1992). ABC
transporters convert the energy gained from ATP hydrolysis into trans-bilayer
movement of substrates either into the cytoplasm (import) or out of the cytoplasm
(export). Fifteen transcripts encoding various families (B, C, E, F, and G) of ABC
transporters were identified and significantly decreased.
Transcripts encoding ammonium and nitrate transporter proteins were also
identified and annotated. Ammonium transport is a key process in nitrogen
metabolism. Sixteen transcripts encoding ammonium transporters (GO:0015696)
belonging to the largest family of ammonium transporters (AMT1) were identified.
Eight of the sixteen transcripts encoded different AMT1 genes (AtAMT1-1,
AtAMT1-2 and AtAMT1-3) and were all significantly lowered in cells exposed to
elevated pCO2 conditions. Two transcripts encoding high affinity nitrate transporter
2.5 (AtNRT2.5), which is essential for nitrogen acquisition in Arabidopsis were also
identified with significant decreases in transcript abundance.
Protein and ATP binding
Transcripts encoding molecular chaperones such as heat shock proteins (HSPs) were
identified in the transcriptome. While HSPs were first identified as proteins whose
synthesis was enhanced by stresses such as an increase in temperature, several HSPs
have been shown to be involved in protein biogenesis. Three transcripts encoding
HSP90 transcripts were identified and significantly decreased in Symbiodinium cells
exposed to increased pCO2 conditions. Twenty-one transcripts encoding Hsp40, also
known as DnaJ, were identified and significantly decreased. The J domain of DnaJ
interacts with Hsp70 and plays a role in regulating the ATPase of Hsp70. Two
transcripts encoding HSP70 proteins were also identified and significantly lowered.
In addition, two DNA damage repair RAD proteins (RAD23-1; comp45467 and
RAD16 homolog; comp73817) were annotated and displayed significantly lower
transcript levels.

Protein phosphorylation
Serine/threonine-protein kinases are crucial components of various cellular processes,
including regulation of cell proliferation, meiosis (Draetta 1990), and apoptosis
(Cohen et al. 2005). Fifty-six transcripts representing various serine/threonine-protein
kinases families were detected. One transcript encoding the Aurora-B class was
identified along with one cyclin-dependent transcript and six never-in-mitosis A
serine/threonine kinase (Nek). All transcripts were significantly lowered in cells
exposed to elevated CO2 concentrations. Glycogen synthase kinase (GSK) is a
serine/threonine kinase with important roles in the regulation of glycogen synthesis,
protein synthesis, gene transcription, and cell differentiation in various cell types.
One transcript encoding GSK (GSK3B; comp75008) involved in protein
phosphorylation (GO:0006468) was identified and significantly decreased under
elevated pCO2conditions (p< 0.007).

Figure 5.5. Gene enrichment analysis of most specific down-regulated GO categories in Symbiodinium clade F transcriptome (FDR < 0.05).
Enrichment analysis is expressed as significantly enriched GO term (X-axis) and the proportion of genes that are down-regulated in the
transcriptome with percentage of sequences represented within each GO term (Y-axis). Black bars correspond to the treatment set (10 000 ppm
pCO2) and the grey bars represent control samples (450 ppm pCO2).
0 1 2 3 4 5 6 7 8 9
10 11 12
GO Name
Test set
Refernce set
Treatment
Control
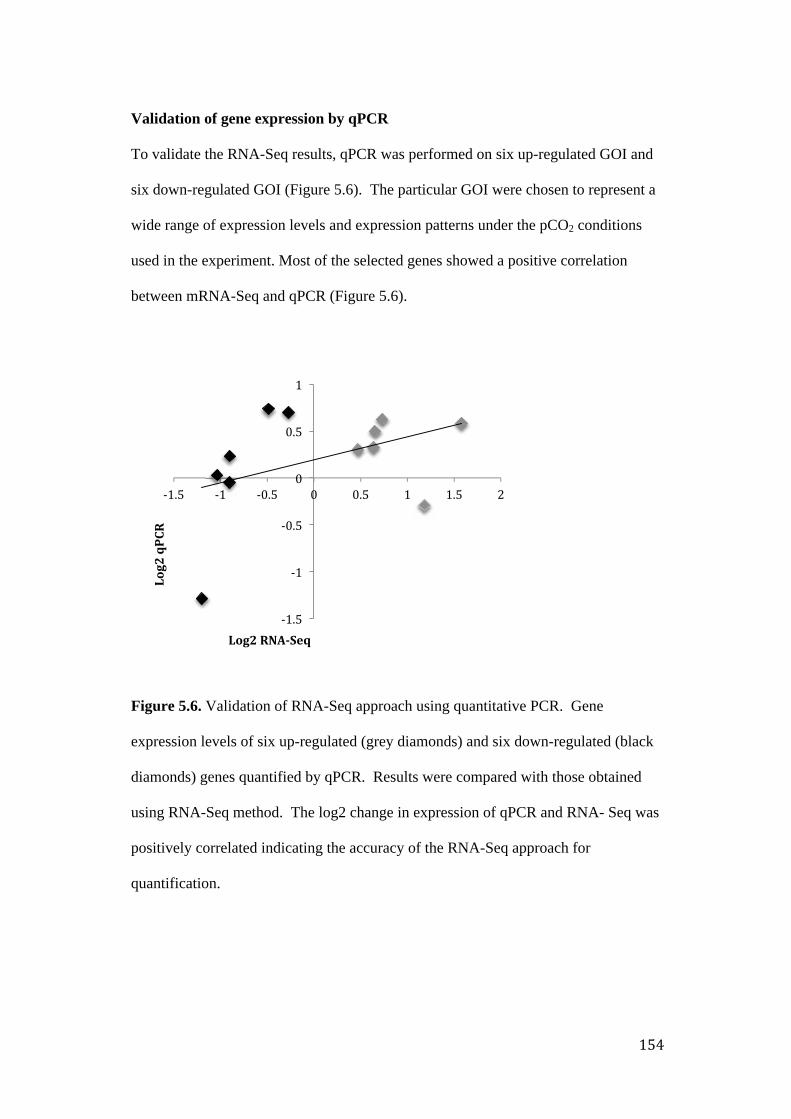
Validation of gene expression by qPCR
To validate the RNA-Seq results, qPCR was performed on six up-regulated GOI and
six down-regulated GOI (Figure 5.6). The particular GOI were chosen to represent a
wide range of expression levels and expression patterns under the pCO2 conditions
used in the experiment. Most of the selected genes showed a positive correlation
between mRNA-Seq and qPCR (Figure 5.6).
Figure 5.6. Validation of RNA-Seq approach using quantitative PCR. Gene
expression levels of six up-regulated (grey diamonds) and six down-regulated (black
diamonds) genes quantified by qPCR. Results were compared with those obtained
using RNA-Seq method. The log2 change in expression of qPCR and RNA- Seq was
positively correlated indicating the accuracy of the RNA-Seq approach for
quantification.
Discussion
The present transcriptome study was designed employing a treatment condition of
elevated pCO2 (10 000 ppm pCO2) and cells of Symbiodinium clade F. The primary
objective was to gain a general insight into the transcriptome-wide changes that occur
in response to elevated pCO2 conditions and to further examine CA genes in
Symbiodinium. The particular CO2 concentration of 10 000 ppm, while extreme, was
used to mirror the work carried out in Chapter 2. In addition, 5 % CO2 is routinely
used to study the effects of elevated CO2 concentrations in many physiological studies
(Spalding et al. 1983, Moroney et al. 1987, Fukuzawa et al. 1990, Marek and Spalding
1991, Bozzo and Colman 2000, Moroney and Ynalvez 2007).
Analysis of the Symbiodinium transcriptome revealed that approximately 20%
of the transcriptome was differentially expressed under elevated pCO2 conditions
(FDR < 0.05). Of the 12,728 differentially expressed transcripts that were detected,
6620 transcripts significantly increased while 6108 transcripts were significantly
lowered. This is similar to what has been observed in a transcriptome study of C.
reinhardtii where shifts in gene expression caused by transition from high CO2 to
limiting CO2 modifies the expression of around 14-38 % (about 2200 to 5880 genes)
of the approximately 15 500 chlamydomonas genes (Brueggeman et al. 2012, Fang et
al. 2012). In the present study, the majority of differentially expressed transcripts
displayed ≤ 1-fold change in abundance, which correlates with work described
previously in this thesis (Chapters 2, 3 and 4) and of targeted expression studies
(Leggat et al. 2011a; Rosic et al. 2011; Ogawa et al. 2013; Gierz et al. 2016). Due to
this it has been hypothesised that translation or post-translational regulation may be
critical in Symbiodinium cellular responses. Overall, increasing CO2 supply to
Symbiodinium clade F cultures enriched functions such as, photosynthesis, light-
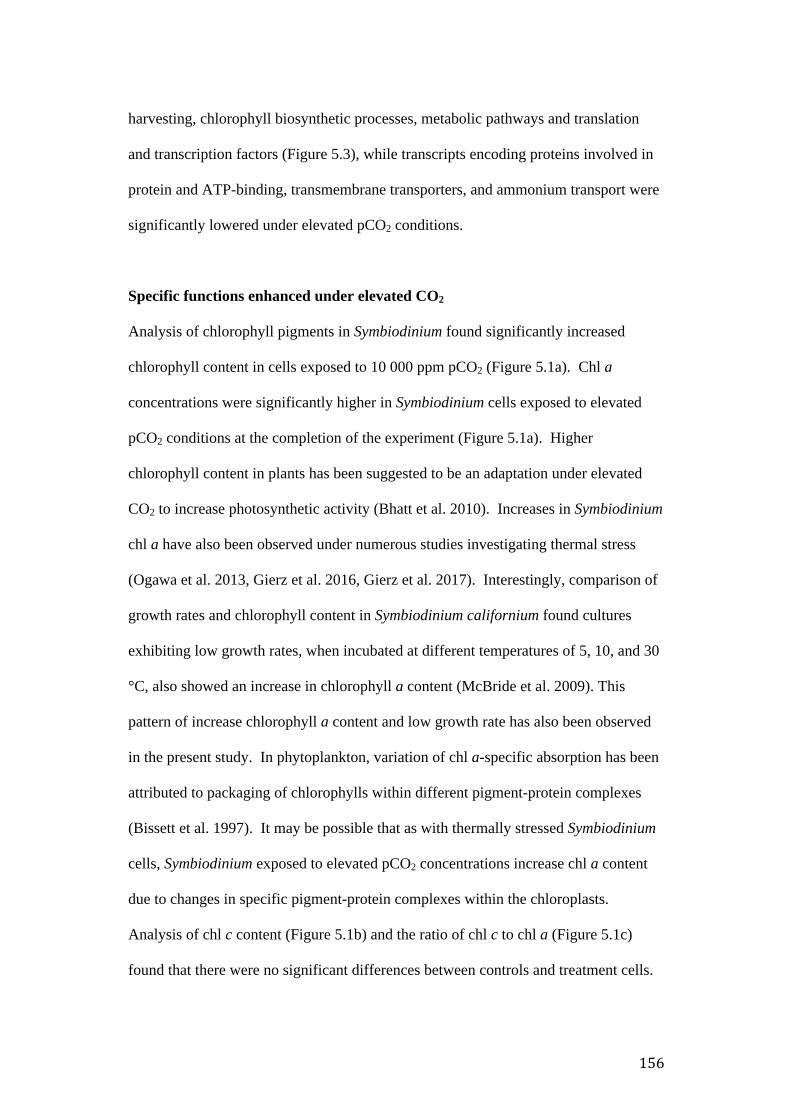
harvesting, chlorophyll biosynthetic processes, metabolic pathways and translation
and transcription factors (Figure 5.3), while transcripts encoding proteins involved in
protein and ATP-binding, transmembrane transporters, and ammonium transport were
significantly lowered under elevated pCO2 conditions.
Specific functions enhanced under elevated CO2
Analysis of chlorophyll pigments in Symbiodinium found significantly increased
chlorophyll content in cells exposed to 10 000 ppm pCO2 (Figure 5.1a). Chl a
concentrations were significantly higher in Symbiodinium cells exposed to elevated
pCO2 conditions at the completion of the experiment (Figure 5.1a). Higher
chlorophyll content in plants has been suggested to be an adaptation under elevated
CO2 to increase photosynthetic activity (Bhatt et al. 2010). Increases in Symbiodinium
chl a have also been observed under numerous studies investigating thermal stress
(Ogawa et al. 2013, Gierz et al. 2016, Gierz et al. 2017). Interestingly, comparison of
growth rates and chlorophyll content in Symbiodinium californium found cultures
exhibiting low growth rates, when incubated at different temperatures of 5, 10, and 30
°C, also showed an increase in chlorophyll a content (McBride et al. 2009). This
pattern of increase chlorophyll a content and low growth rate has also been observed
in the present study. In phytoplankton, variation of chl a-specific absorption has been
attributed to packaging of chlorophylls within different pigment-protein complexes
(Bissett et al. 1997). It may be possible that as with thermally stressed Symbiodinium
cells, Symbiodinium exposed to elevated pCO2 concentrations increase chl a content
due to changes in specific pigment-protein complexes within the chloroplasts.
Analysis of chl c content (Figure 5.1b) and the ratio of chl c to chl a (Figure 5.1c)
found that there were no significant differences between controls and treatment cells.

In accordance with increases in chl a content, gene enrichment analysis of
differentially expressed transcripts identified increases in transcripts encoding
magnesium-chelatase subunits (ChlH), protochlorophylide reductase and
geranylgeranyl diphosphate reductase involved in chlorophyll biosynthesis
(GO:0015995). The synthesis of Chl a from glutamic acid occurs via a complex
pathway consisting of at least fifteen reactions (Von Wettstein et al. 1995).
Magnesium-chelatase subunits (ChlI, ChlH and ChlD) act as catalysts for the ATP
dependant insertion of a magnesium ion into the chl a structure (Suzuki et al. 1997).
The ChlH subunit is known to bind protoporphyrin and has also been suggested to be
the catalytic subunit. Another important step in chlorophyll synthesis is the light-
dependant conversion of pchlide into chlide, which is achieved by the enzyme
protochlorophyllide reductase (POR). In contrast, a number of photosynthetic
eukaryotes synthesize an enzyme that reduces protochlorophylide irrespective of light,
thereby providing these organisms the ability to synthesize chlorophyll in the dark
(Dring 1988). Transcripts encoding the third identified enzyme involved in
chlorophyll biosynthesis, geranylgeranyl diphosphate reductase, were identified in the
present study. This particular enzymes catalyses the reduction of geranylgeranyl
pyrophosphate to phytyl pyrophosphate and provides phytol for chlorophyll synthesis.
Enhanced photosynthesis
Gene enrichment analysis identified increases in numerous transcripts encoding
several genes involved in the primary stages of photosynthesis under elevated CO2.
This was typified by increases in transcript abundance of light harvesting complex
(LHC) proteins, components of PSI reaction centre, PSII subunits, ATPsynthases and
the final part of the photosynthetic electron transfer ferredoxin and ferredoxin-NADP+
reductase activity (Figure 5.3). This pattern of up-regulation of photosynthetic genes
under CO2 enrichment is similar to that seen in other algae (Riebesell et al. 1993, Hein
and Sand-Jensen 1997, Peng et al. 2016, Sun et al. 2016)
LHC proteins are peripheral components of PSI and PSII and are essential for
capturing and transferring light energy to the photosystems as well as playing a
protective role in dissipating excess energy as heat (Iglesias-Prieto et al. 1993,
Takahashi et al. 2008). The LHC superfamily exhibits a high degree of sequence
diversity and includes subfamilies such as the Chl a and b binding proteins (Cab), the
Chl a and c binding proteins (Cac), the Chl a and phycobilin binding proteins (LhcaR,
Lhc), and fucoxanthin-Chl a and c binding proteins (Fcp) and those associated with
protective mechanisms and stress responses such as the LI818 and LI818-like proteins
(Richard et al. 2000, Koziol et al. 2007). Of the fifty-seven transcripts identified in
the present study all significantly increased, including transcripts encoding the LI818
and LI818-like proteins. The increase in chlorophyll from CO2 enrichment observed
in the present study may therefore be available for trapping more light energy for
photosynthesis. Furthermore the increase in L1818 and L1818-like proteins may also
indicate that CO2 enrichment could improve the resistance to stress of Symbiodinium.
Photosynthetic ATP synthesis can be generated through at least two routes.
Linear electron flow (LEF) is driven by photosystem II (PSII) and PSI, which involves
electron transfer via ferredoxin (Fd) and ferredoxin-NADP+reductase activity (FNR)
to reduce NADP+, generating NADPH and ATP for the Calvin-Benson cycle (Hald et
al. 2008). Transcripts encoding subunits of PSII that increased included psbJ, which
is involved in electron transfer within PSII, psbK which binds plastoquinone and also
has a role in maintaining the dimeric structure of PSII and psbF which encodes the β-
subunit of cytochrome b559. Cytochrome b559 is a ubiquitous component of PSII

located close to the D1 and D2 reaction centre subunits (Nanba and Satoh 1987).
Previous studies have identified that cytochtome b559 plays a structural role during
early stages of PSII assembly and may also be involved in a secondary electron
transfer pathway that helps protect PSII from photodamage (re(Shinopoulos and
Brudvig 2012, Hamilton et al. 2014). It is generally considered that the reactions of
linear electron flow generate less ATP than is required for the metabolic reactions of
photosynthesis (Osmond 1981, Kramer and Evans 2011, Foyer et al. 2012). In
addition, the ATP demand varies depending on environmental conditions and on
metabolic status. Cyclic electron flow is an alternate electron transfer route that
involves only PSI. Cyclic electron flow generates extra proton gradient by recycling
electrons around PSI, resulting in extra ATP in the absence of NADPH (Kramer and
Evans 2011). The PSI complex acts as a light-driven enzyme that catalyses the
transfer of electrons from plastocyanin in the thylakoid membrane to ferredoxin on the
stromal side of the thylakoid membrane (Jensen et al. 2007). PSI is composed of 15
core subunits and associated with light-harvesting complex I (LCHI). Elevated pCO2
enhanced several subunits PSI reaction centre (psaD, psaE, psaF and psaL). In
particular, both psaD and psaE subunits are involved in the binding of ferredoxin
(Jensen et al. 2007). Additionally, psaD is required for the assembly of psaE and
PsaC into the PSI complex.
The last step of the primary phase of photosynthesis involves the production of
NADPH via FNR. Previous studies on the microalga Coccomyxa subellipsoidea C-
169 have demonstrated up-regulation of ferredoxin and FNR under elevated CO2 and
have implied that the increase in energy generated through photosynthesis might be
converted and transferred through ferredoxin to sustain rapid growth and lipid
accumulation (Peng et al. 2016). NADPH is also known to be a reducing agent
involved in protecting cells against reactive oxygen species (ROS) (Clement et al.
2017). In the present study, five transcripts encoding ferredoxin-NADP+reductase
were identified with significant increases (Figure 5.3). The increased supply of
NADPH, as a result of enhanced FNR activity, may therefore play a photoprotective
role in Symbiodinium in the present study. However, further studies would need to be
conducted to determine if this is the case in Symbiodinium clade F cells exposed to
elevated pCO2 concentrations.
Carbonic Anhydrase
CAs are proteins that form integral parts of carbon-concentrating mechanisms
(CCMs), which play an important role in the acquisition of inorganic carbon for
photosynthesis in many algae (Leggat et al. 1999; Giordano et al. 2005; Oakley et al.
2014). Genome studies on Symbiodinium have identified enrichment of CAs in the
genomes of S. microadriaticum, S. minutum, and S. kawagutii in comparison to other
eukaryotic genomes (Aranda et al. 2016). In the present study thirty-two transcripts
encoding CAs were identified, one of which displayed homology to the SymBCA2
gene identified in Chapter 2 (comp 104242_c0). Of the thirty-two transcripts, nine
(including comp 104242_c0 transcript) were differentially expressed with significant
increases under elevated CO2 conditions (Table 5.2). The increase in transcript levels
of these CAs under elevated pCO2 conditions is surprising given that previous
chapters of this thesis have shown decreases of CA transcripts under elevated CO2
conditions, which is also consistent with previous studies (Price and Badger 1989,
Sültemeyer et al. 1989, Matsuda and Colman 1995, Giordano et al. 2005, Falkowski
and Raven 2007). Of particular note is the increase in transcription of comp
104242_c0 transcript, which is in contrast to results obtained in Chapter 2 (Figure
2.7b). However it must be noted that the C1 phylotype was used in Chapter 2 as
opposed to the F phylotype examined in the present study. While Chapter 3 examined
cultures of Symbiodinium F grown under elevated pCO2, the 10 000 ppm pCO2
concentration was not used, therefore a comparison cannot be made between the two
chapters. The contrasting results now raise the question as to whether the role of one
particular CA in Symbiodinium can differ according to the phylotype examined.
Further experiments would need to be conducted to investigate this hypothesis.
The majority of CA transcripts identified in the study, were represented by the
β-class, and predicted to be chloroplast targeted. In addition, all nine transcripts that
were differentially expressed represented the β-class and were also predicted to be
chloroplast targeted. Given that the β-class of CAs are much more diverse in their
quaternary structure, sequence, and distribution than any of the other CA families, the
higher representation of members in the β-class CAs in the present study is not
surprising. This is also evident in C. reinhardtii where six of the twelve known CAs
belong to the β-class (Mitra et al. 2005, Ynalvez et al. 2008). In addition, chloroplastic
CAs seem to be the most important CAs in the photosynthetic CO2 flux of microalgal
cells by facilitating the diffusion of CO2 across the chloroplast envelope or by rapidly
dehydrating bicarbonate to CO2 (Price et al. 1994). Surprisingly, the results of this
study predicted the transcript showing homology to SymBCA2 to also be chloroplast
targeted. This is in contrast to chapter 2 that predicted SymBCA2 to be located in the
cytosol. However, the prediction made in chapter 2 was due to the absence of any
transit peptides, as the full-length sequence was not obtained.
Enhanced metabolism
While photophosphorylation in photosynthesis provides the ATP and NADPH for the
Calvin cycle, enhanced carbon fixation raises higher demand of ATP and NADPH,
which can be generated from alternative pathways such as pentose-phosphate pathway
and oxidative phosphorylation. In the present study, elevated CO2 affected transcripts
encoding proteins involved in metabolic process such as the pentose-phosphate
pathway, oxidative phosphorylation and gluconeogenesis. These results suggest that
under high CO2 concentrations more fixed carbon is possibly driven into these
pathways to produce more intermediates and metabolic energy for anabolism. In
addition, the results of the present study indicate that energy production is matched to
metabolic demand in Symbiodinium clade F exposed to elevated CO2 conditions as
both photosynthesis and metabolism are enhanced.
The oxidative pentose phosphate (OPP) pathway is a strategy to provide
NADPH for biosynthetic processes. Transcripts encoding the critical enzymes for OPP
pathway identified in the present study, glucose-6-phosphate dehydrogenase (G6PD),
6-phosphogluconate dehydrogenase (6PGD), transketolase and fructose-bisphosphate
aldolase were all significantly increased. These enzymes participate in several
reactions of the pathway to generate NADPH and ribulose-5-phosphate (a precursor
for ribose-5-phosphate) (Kruger and von Schaewen 2003). The increased production
of NADPH observed in the present study may therefore be used to support carbon
assimilation. Increased transcripts of both G6PD and 6PGD involved in the OPP
pathway have also been observed in the diatom Phaeodactylum tricornutum under
elevated CO2 concentrations (Wu et al. 2015).
Genes encoding enzymes for the unique reactions in gluconeogenesis, PEP
carboxykinase (PEPCK) and fructose-1,6-bisphosphatase (FBP) were also
significantly increased in the present study, indicating that the gluconeogenic pathway
was in use under elevated pCO2 conditions. Enhanced gluconeogenic pathway
enzymes have been identified in Symbiodinium cells exposed to thermal stress and has
been suggested as a mechanism to reduce free fatty acids in cells to carbohydrates
(Gierz et al. 2017). PEPCK catalyzes the conversion of oxaloacetate into
phosphoenolpyruvate (Pilkis and Granner 1992) and FBP is responsible for the
conversion of fructose-1,6-biphosphate into fructose- 6-phosphate. Other than
gluconeogenesis, FBP is also involved in chloroplast conversion of d-fructose 1,6-
biphosphate into fructose-6-phosphate. Previous studies have demonstrated that over-
expression of FBP in C. reinhardtii has a detrimental effect on growth and can led to
decreases in biomass production (Dejtisakdi and Miller 2016). The results of the
present study have also demonstrated this pattern of increased transcript abundance of
FBP with decreases in transcripts encoding genes involved with cell regulation. These
results therefore suggest that exposure of Symbiodinium to pro-longed periods of
elevated pCO2 concentrations has a detrimental effect on growth.
In eukaryotes, the electron transport chain found in the inner mitochondrial
membrane is a composed of four multiprotein complexes (termed complex I-IV) and
serves as the site of oxidative phosphorylation through the use of ATP synthase.
Transcripts encoding genes involved in electron transport and oxidative
phosphorylation were significantly increased in Symbiodinium exposed to elevated
CO2. These included transcripts encoding several subunits of Complex II (succinate
dehydrogenase), Complex III (cytochrome bc1 complex), IV (cytochrome c oxidase)
and ATP synthase. ATP synthase, also known as Complex V, is the final enzyme in
the oxidative phosphorylation pathway and uses the energy stored in the proton
gradient across the membrane to drive synthesis of ATP from ADP and phosphate. In
the present study, four transcripts encoding ATP synthase coupled to mitochondrial
electron flow were significantly increased. Previous transcriptome studies on

microalgae have demonstrated that enhanced oxidative phosphorylation is a way of
supplying adequate ATP for rapid growth and biosynthetic processes under high CO2
concentrations (Peng et al 2016).
Enhanced transcription and translation factors
Transcripts encoding DNA binding proteins were also significantly increased in
Symbiodinium exposed to elevated pCO2, the majority of which carried a cold shock
domain (CSD). While the CSD is not common in other eukaryotes, previous studies
on the dinoflagellate Lingulodinium identified that 68% of the identified DNA-binding
domains fall into the class of CSD (Mihailovich et al. 2010), which has therefore been
suggested to be a lineage-specific expansion in dinoflagellates (Bayer et al. 2012).
Originally identified as a reaction to cold shock in E. coli, CSD containing proteins
have now been found in all three domains of life and have been associated with
various functions such as regulation of transcription (by binding DNA), splicing,
translation (Chaikam and Karlson 2010), and can also function as RNA chaperones
(Jiang et al. 1997, Phadtare 2004) Because these domains also bind mRNA, they are
also known for their role in post-transcriptional regulation in eukaryotes (Mihailovich
et al. 2010). However in the present study, the increased expression of DNA-binding
proteins containing the CSD suggests that these particular proteins are involved in
transcriptional regulation in Symbiodinium exposed to elevated pCO2 as opposed to
post-translational regulation. This fits with the observed increase in the GO category
regulation of transcription (GO:0006355) also identified in this study. Proteins
containing the CSD may therefore be responsible for much of the transcriptional
regulation in dinoflagellates.

Specific functions down-regulated under elevated CO2
Reduced transmembrane transport
Transmembrane transporters are involved in the translocation of diverse nutrients and
ions into and out of cells that are all vital for cellular homeostasis. Recent
Symbiodinium transcriptome studies have revealed that in comparison to other
eukaryotes Symbiodinium display a large amount of domains involved in
transmembrane transport (20 out of the identified 280 significantly enriched protein
domains), which include transporter domains specific for bicarbonate, ammonium,
amino acids as well as ABC and ion transporters (Aranda et al. 2016). The present
study identified significant decreases in transcript abundance of various transcripts
encoding transmembrane transporters in Symbiodinium exposed to elevated pCO2, the
majority of which were channel and voltage-gated proteins involved in the movement
of sodium, potassium and calcium ions. Calcium ions are required for a number of
processes that include the motility of eukaryotic cilia and flagella (Inaba 2015). In
particular, in C. reinhardtii calcium ions have been shown to play a role in phototaxis,
in the control of flagella waveform, in the maintenance of flagella length and in
flagella surface motility (Goodenough et al. 1993, Wakabayashi et al. 2009). In
addition, exposing cells of C. reinhardtii to lowered pH levels has resulted in the
excises of flagella. Nutrient shortages have also been shown to freeze Symbiodinium
in the G1 phase of the cell cycle (Muscatine et al. 1989, Muller‐Parker et al. 1996,
Smith and Muscatine 1999, Wang et al. 2008). In accordance with these previous
studies, the results of the present study have also demonstrated lowered transcript
abundance of proteins involved in transportation of ions and growth of Symbiodinium
clade F under elevated pCO2 conditions.

In addition to channel proteins, transcripts encoding proteins involved in
ammonium transport were also significantly decreased in Symbiodinium. Ammonium
is required for amino acid synthesis via the glutamine synthatase–glutamate synthase
cycle (GS-GOGAT) (Mariscal et al. 2004). Ammonium is taken up directly via
ammonium transporters (AMTs) and is the preferred source of nitrogen for many
microorganisms due to its assimilation having a lower energetic cost than that of
oxidised forms of nitrogen such as nitrate (Bloom et al. 2010). C. reinhardtti have
the largest AMT1 family of ammonium transporters compared to other plants,
consisting of eight members (González-Ballester et al. 2004) which are required for
the regulation of intracellular flux. In addition, low- and high-affinity transport
systems have been identified for both ammonium and nitrate (Crawford and Glass
1998). The low-affinity transporter system (LATS) is responsible for uptake when
substrate is plentiful externally, whereas the high-affinity transporter system (HATS)
is responsible for when substrate concentrations are low. In contrast to the present
study, previous studies have shown that the AMT1 genes of C. reinhardtii, while
strongly induced by N deficiency (González-Ballester et al. 2005), do not seem to be
affected by carbon supply (González-Ballester et al. 2004, Fernandez and Galvan
2007).
The ATP-binding cassette (ABC) transporter family is one of the largest
transporter families and is observed in all organisms from prokaryotes to eukaryotes
(Dudler and Hertig 1992, Higgins 1992, Martinoia et al. 1993, Rees et al. 2009).
Eukaryotic ABC transporters are classified into seven main families (ABCA to
ABCG) (Anjard et al. 2002, Roth et al. 2003, Sheps et al. 2004). Despite being called
transporters, two eukaryotic ABC transporter families (ABCE and ABCF) do not
function as transporters but are involved in other cellular processes including
ribonuclease inhibition and translational control (Kerr 2004, Zhao et al. 2004).
Translational control plays an essential role in maintaining homeostasis, and
controlling cell proliferation, growth and development. In Caenorhabditis elegans,
ABCE has been shown to be involved in regulation of growth and vulvae development
(Zhao et al. 2004). In the present study, transcripts encoding ABC transporters were
significantly decreased in elevated pCO2, including transcripts encoding the ABCE
and ABCF families. The decreases in ABC transcripts therefore suggest that the
decrease transportation of nutrients and effective maintenance of cell homeostasis are
inhibiting Symbiodinium cell growth at elevated pCO2 conditions.
Protein and ATP binding/Cell regulation
The molecular response to stress varies with many pathways in place to minimize
damage and re-establish cellular homeostasis. Various cellular functions can be
targeted during stress such as cell cycle control, molecular chaperoning, protein repair,
protein degradation, and DNA repair. If cellular function cannot be regained, cell
death (apoptosis) may occur (Kültz 2005). Heat shock proteins (HSPs) are molecular
chaperones that are involved in maintaining regular cellular functions with crucial
roles in protein folding, unfolding, aggregation, degradation, and transport (Sørensen
et al. 2003). In addition, these proteins are involved in cell differentiation (Gunter and
Degnan 2007), cell signaling and in the protection of cells against stress and apoptosis
(Arya et al. 2007). Previous gene expression studies on Symbiodinium have identified
HSPs (HSP70 and HSP90) and have quantified their expression mainly in response to
thermal stress (Leggat et al. 2007, Leggat et al. 2011, Rosic et al. 2011, Barshis et al.
2014). Within Symbiodinium exposed to elevated CO2 concentrations differentially
expressed transcripts encoding HSPs, DnaJs, and RAD DNA repair proteins were

significantly decreased. The down-regulation of chaperones and DNA repair proteins
may therefore indicate a higher rate of protein misfolding and as a consequence leads
to higher endoplasmic reticulum (ER) stress. ER stress triggers cell death by several
mechanisms, including activation of proteases, kinases, and transcription factors,
which have been identified in the present study.
Protein phosphorylation is another pathway that plays a significant role in a
wide range of cellular processes such as cell signaling, gene expression,
differentiation, and apoptosis. In addition, protein phosphorylation is a crucial post-
translational modification. Eukaryotic cell cycles are driven by a set of regulators
(Morgan 2007). Among these are the serine/threonine protein kinases. For example
aurora kinases regulate cell proliferation and are essential for mitotic progression
(Nigg 2001) and the nimA-realated kinases (Neks) represent a family of
serine/threonine kinases implicated in cell cycle control. In addition, cell cycle
progression is controlled by the action of cyclin-dependent kinases (CDKs). The
present study identified numerous transcripts encoding serine/threonine-protein
kinases that were lowered in Symbiodinium exposed to elevated CO2 conditions.
These results suggest that elevated CO2 hinders cell cycle in Symbiodinium clade F
however physiological measurements of growth and development are needed in order
to link transcript abundance profiles of these cell cycle regulatory proteins to
physiological responses of Symbiodinium.
Conclusions
In the present study CO2 enrichment (10 000 ppm pCO2) increase transcripts encoding
proteins involved in functions such as photosynthesis and metabolism in cultured
Symbiodinium clade F while transcripts encoding proteins involved in transmembrane

transport and cell regulation were decreased. While enhanced photosynthesis under
elevated pCO2 is consistent with previous studies, decreased transcript abundance of
ammonium transporters and CAs are in contrast to previous studies. The increase in
CA transcript abundance under 10 000 ppm pCO2 is also in contrast to Chapter 2
results that demonstrated lowered Symbiodinium CA transcripts. These differences
may be due to the different predicted cellular location of these transcripts.
Interestingly, the one CA transcript identified as having homology to SymBCA2
(comp10424_c0) differed in both predicted location and transcript abundance. The
results presented in this study have nevertheless provided significant insights into the
acclimation and molecular response of Symbiodinium clade F to elevated pCO2, which
therefore provides important information for future climate change research.
Chapter 5 Summary points
• Elevated pCO2 (10 000 ppm pCO2) increased transcripts encoding proteins
involved in:
o Photosynthesis
o Chlorophyll biosynthesis
o Oxidative pentose phosphate pathway
o Gluconeogenesis
o Oxidative phosphorylation
o Transcription and translation factors
• Elevated pCO2 (10 000 ppm pCO2) decreased transcripts encoding proteins
involved in processes such as:
o Transmembrane transport
o Ammonium transporters
o Cell regulation
• Thirty-two CAs were identified in the Symbiodinium transcriptome:
o Six α-CAs
o Twenty-two β-CAs
o Two γ-CAs
• One transcript (comp 104242_c0) showed homology to SymBCA2 that was
identified in Chapter 2
• Of the thirty-two CA transcripts identified, nine were DEG, all showing
significant up-regulation under elevated CO2 conditions. This included comp
104242_c0, which is in contrast to expression results obtained in Chapter 2.
• All nine differentially expressed CAs belong to the β-family and were
predicted to be chloroplast targeted.
• The predicted location of comp 104242_c0 to the chloroplast is in contrast to
the predicted location discussed in Chapter 2.

Schematic representation of thesis outline
Chapter 2
Objective 1: Isolation and characterisation of CA in Symbiodinium and effects of increased CO2 concentrations on CA expression and CCM
Chapter 3
Objective 2: Effects of combined increased CO2 concentrations and temperature on Symbiodinium CAs and CCM
Chapter 4
Objective 3: Carbonic anhydrase expression in Symbiodinium in response to varied light environments
Chapter 5
Objective 4: Changes in Symbiodinium transcriptome in response to elevated CO2 concentrations
Chapter 6
General discussions, thesis conclusions and future directions
Chapter 1
General Introduction and thesis objectives
Chapter 6: General Discussion
Coral reefs are among the most biologically diverse and productive ecosystems that
not only support hundreds of thousands of plant and animal species, but also
contribute significantly to the economic wealth of countries. The ecological success
of coral reefs is largely due to the symbiotic partnership of the cnidarian host and their
endosymbiotic dinoflagellates (Falkowski et al. 1993). Translocation of
photosynthetic products generated by Symbiodinium delivers the majority of metabolic
energy required by the host (Muscatine 1990). In return Symbiodinium are provided
with inorganic nutrients from the host and protection from predation (Muscatine and
Porter 1977). Dysfunction of this symbiosis under global climate change conditions,
such as ocean acidification (OA) and warming, has led to worldwide decline of
tropical coral reefs and a surge in scientific research on the causes, effects and
implications of mass bleaching events. It is now indisputable that increases in
anthropogenic CO2 emissions are creating oceanic conditions that are both rapidly and
increasingly becoming inhospitable to the worlds tropical coral reefs and symbiotic
partnerships (Hughes et al. 2003, Hoegh-Guldberg et al. 2007, Anthony et al. 2008,
Kleypas and Yates 2009). Understanding how coral reefs respond to stress events
resulting from such anthropogenic influences therefore requires a better understanding
of exactly how coral reefs function. This has always been challenging due to the
complexity of such a biological structure that involves at least three different
organisms; one an animal, one a plant, and the other a plethora of bacteria. The
significance of the present research project is that it provides new information on the
gene level for one of these organisms, the symbiotic dinoflagellate Symbiodinim.

The fundamental aim of this thesis was to establish a basis for understanding
what affect elevated CO2 conditions will have on the functioning of Symbiodinium
photosynthesis, in particular, the enzyme carbonic anhydrase (CA). Research
undertaken during this thesis therefore depended largely on first, the isolation and
characterisation of CA enzymes in Symbiodinium (Chapter 2; aim 1) and second,
assessing the expression of CA and other photosynthetic related genes under elevated
CO2 conditions (Chapter 2). In addition to elevated CO2 conditions, the effects of
other environmental stressors on Symbiodinium, such as increased temperature
(Chapter 3) and varied light intensities (Chapter 4), were also investigated. This was
achieved by employing the highly sensitive quantitative PCR (qPCR) technique that
quantifies the expression of genes of interest by comparison to stably expressed
internal control genes of Symbiodinium (Chapters 2, 3 and 4). This research also
employed next-generation sequencing technique, (Illumina sequencing), to
characterise the Symbiodinium transcriptome in response to prolonged elevated pCO2
conditions (Chapter 5). In addition to transcript analysis, physiological parameters
such as photosynthetic efficiency of PSII (measured as Fv/Fm of chlorophyll
fluorescence; see Chapter 2 for details), cell density and chlorophyll pigment analysis
were also investigated in an attempt to link any physiological changes with changes in
transcript abundance (Chapter 2, 3 and 4).
The functional roles of CAs are diverse. CAs are fundamental to many
biological processes such as respiration, CO2 and ion transport, calcification and acid-
base balance (Dodgson 1991). In addition, CAs play a major role in algal carbon-
concentrating mechanisms (CCMs) as a key enzyme in the acquisition and
concentration of inorganic carbon (Ci) for efficient photosynthetic activity (Badger
and Price 2003, Moroney et al. 2011, Wang et al. 2011, Ludwig 2012). The extensive

literature on Chlamydomonas and cyanobacterial CCMs has provided a
comprehensive platform on the functioning of CCMs and the involvement of multiple
CA gene families. Many organisms express multiple CA gene families, which
suggests that the specific function of one kind of CA gene may be different.
Simultaneously, many organisms express multiple CA isoenzymes which can differ in
oligomeric arrangement, molecular features, cellular localization, expression levels,
kinetic properties, and distribution in organs and tissues (Alterio et al. 2012). For
example, in C. reinhardtii there are at least 12 known genes that encode CAs of the α-,
β-, and γ-class, which differ in subcellular location and function within the CCM
(Moroney et al. 2011). Even though the evidence for a CCM in Symbiodinium was
proposed over 20 years ago (Al-Moghrabi et al. 1996, Leggat et al. 1999), the role and
extent of CAs in the Symbiodinium are still quite poorly studied and therefore promote
studies on cultured Symbiodinium such as the characterisation study documented in
Chapter 2. This is the first study to have isolated and characterised two β-class CAs
(SymBCA1 and SymBCA2) and one δ-class CA (SymDCA1) from Symbiodinium
(Chapter 2) and to examine the expression of these CAs under varied environmental
stress conditions. The initial survey of the Symbiodinium β-class (through both
expressed sequence tag (EST) analysis and PCR (Chapter 2)), identified that, as with
C. reinhardtii there is a large diversity of CA sequences found within the one
Symbiodinium strain (clade C3), indicating multiple copies within the genome. In
addition, the majority of these proteins are encoded as polyproteins, which is
consistent with other dinoflagellate chloroplastic genes that are present as multiple
copies such as ribulose-1,5-bisphosphate carboxylase/oxygenase (Rubisco) (Rowan et
al. 1996), peridinin-chlorophyll a-protein (PCP) (Norris and Miller 1994, Reichman et
al. 2003) and peridinin chlorophyll a-c binding proteins (acPCPs) (Boldt et al. 2012).

In contrast to Rubisco, PCP and acPCPs however, both SymBCA1 and SymBCA2
were not chloroplast targeted, and instead, predicted to be localised to the cytosol. In
addition, SymDCA1 was predicted to be localised to the plasma membrane (Chapter
2). A similar result has been identified in the genome of S. kawagutii in which the
majority of the identified CAs were predicted to be cytoplasmic, suggesting that
cytoplasmic CAs are critical for CO2 acquisition, while two δ-CA were predicted to be
localised to the plasma membrane (Lin et al. 2015). While the involvement of
SymBCA1, SymBCA2 and SymDCA1 in the Symbiodinium CCM was not fully
determined, the results of the present study did however illustrated additional CAs in
Symbiodinium and identified changes in transcription under environmental stress.
Transcriptome analysis (Chapter 5) further identified the diversity of CAs
within Symbiodinium. A total of 32 CA transcripts were identified in the
transcriptome of Symbiodinium clade F, representing members from the α-, β-, γ-, and
δ-CA gene family. In addition, one transcript showed homology to SymBCA2
identified in Chapter 2. Interestingly, more than half of the 32 CA transcripts were
representatives of the β-class and were chloroplast targeted. Such high representation
of the β-class in Symbiodinium is not surprising. This has also been observed in C.
reinhardtii where six of the 12 known CA genes belong to the β-class (Ynalvez et al.
2008; Mitra et al. 2005). As a whole, the β-class of CAs are much more diverse in
their quaternary structure, sequence and distribution than any of the other CA families.
Such sequence diversity has therefore given rise to subsequent subgroupings within
this class (Smith and Ferry 2000). The phylogenetic analysis of both SymBCA1 and
SymBCA2 reported in this thesis has illustrated further this evolutionary diversity, and
has also identified that the dinoflagellate CA sequences (including the sequences for
both SymBCA1 and SymBCA2) are forming a novel subgroup within the β-CA class.

Of particular note, the characterisation study (Chapter 2) identified for the first
time an amino acid substitution of the highly conserved arginine-aspartate dyad in the
N-terminus of SymBCA2. While the significance of this mutation remains ambiguous
and was not investigated, transcript abundance of SymBCA2 was still altered when
Symbiodinium cells were exposed to elevated pCO2 levels with a 9-fold decrease when
exposed to 10 000 ppm pCO2 conditions (Figure 2.6c, Chapter 2), an increase of 0.3-
fold when exposed to 1500 ppm pCO2 and 0.5-fold when exposed to 750 ppm pCO2
combined with thermal stress (Figure 3.5b, Chapter 3) and decrease of 1.9-fold when
transferred to high light conditions (Figure 4.3b, Chapter 4). Future work should
therefore focus on obtaining full-length coverage of SymBCA2 and protein expression
studies to assess the functionality of this particular CA in Symbiodinium.
One of the key findings of this research is that, while it has illustrated
Symbiodinium CAs and other targeted genes are modulated by a variety of external
environmental conditions, transcriptional regulation does not appear to play such a
significant role in Symbiodinium stress response and that Symbiodinium is possibly
reliant on post-transcriptional mechanisms for homeostatic regulation of its
photosynthetic proteins. This is consistent with prior research that has demonstrated
approximately 5-30% of genes are regulated at the level of transcription (Johnson et
al. 2012), while most nuclear-encoded proteins are predominately regulated by post-
transcriptional processes (Leggat et al. 2011). While transcriptional changes were
observed throughout this thesis, these changes were predominantly small-scale. For
example, the transcriptome study (Chapter 5) revealed that 20% of the transcriptome
was regulated under elevated pCO2 with the majority of differentially expressed
transcripts being <1-fold change (Figure 5.3c and d). The largest fold change reported
in this thesis however was a decrease in transcript abundance of phosphoglycolate
phosphatase (PGPase) by 25-fold under elevated CO2 conditions (Figure2.6e). One
possible explanation for such small-scale transcriptional changes may be due to the
unique genomic organization and large size of Symbiodinium genomes (greater than
2Gb) (LaJeunesse et al. 2005). Such a unique genome organization may mean that
Symbiodinium are not able to rapidly alter gene expression patterns (Leggat et al.
2011). Perhaps surprisingly, with the exception of SymDCA1 and Rubisco, only at
extreme CO2 concentrations (10 000 ppm pCO2) was a change in gene expression
observed for SymBCA1, SymBCA2, and PGPase, while at CO2 concentrations of 550
ppm pCO2 and 750 ppm pCO2 no change in expression was observed (Chapter 2).
These results imply that both SymBCA1 and SymBCA2 may be constitutively
expressed in Symbiodinium and/or may have a role outside of the CCM.
Alternatively, if both SymBCA1 and SymBCA2 are directly involved in the CCM
then their expression may be needed for efficient functioning, as seen in the α-CA
(Cah3) in C. reinhardtii (Karlsson et al. 1998). Future studies on Symbiodinium stress
response may therefore benefit from proteomic or metabolomics approaches rather
than transcriptomic (Gordon and Leggat 2010).
The synergistic effects of OA and elevated SST on both transcript abundance
of Symbiodinium β-CAs, Rubisco and PGPase and physiological parameters were also
investigated in this thesis (Chapter 3; Aim 2). As these two environmental factors will
be changing in tandem under future climate change scenarios, it is imperative to
conduct studies to assess the impacts of these combined stressors on Symbiodinium
photosynthesis. The results of this experiment demonstrated that the greatest changes
in Symbiodinium cells exposed to combined elevated pCO2 and temperature were on
physiological parameters while transcriptomic analysis revealed few, small significant
changes. Therefore, no clear link could be made between transcript abundance and
physiological response. In addition, minimal effects were observed in CO2 alone
treatments, while the main driver of these changes was thermal stress. This was
evident with the significant decline of photosynthetic efficiency in Symbiodinium cells
exposed to 31°C (Chapter 3; Figure 3.2), the decline in cell density from day 7 in cells
exposed to thermal stress (Figure 3.3) and, the increase in both chl a and chl c in all
thermal treatments (Figure 3.4). While the present study was conducted on cultured
cells of Symbiodinium, many studies have pointed to Symbiodinium as the weaker
partner in symbiosis during thermal stress. Impairment or damage to PSII, due to
environmental stress, has been shown to result in the production of harmful ROS that
may be a trigger for algal expulsion from the coral host (Lesser 1997, 2011). In a
study exploring the interactive effects of near-term CO2 increases (40 -90 ppm above
current ambient) during a simulated bleaching event (34 °C for five days) of Acropora
aspera, Symbiodinium photosynthetic efficiency was also significantly depressed
while elevated pCO2 only slightly mitigated the effects of increased temperature on
Fv/Fm (Ogawa et al. 2013). In addition, no significant physiological changes were
detected in Symbiodinium solely in response to increased CO2 levels. Changes were
however observed in response to temperature (Ogawa et al. 2013). These results,
together with the results of this thesis demonstrate that thermal stress will most likely
have a greater impact on Symbiodinium physiology than elevated pCO2 in both free-
living and symbiotic Symbiodinium.
A second key finding of this research is that both the physiological stress
response and changes in transcript abundance displayed by Symbiodinium exposed to
elevated pCO2 seem to be phylotype specific. The results presented in this thesis
therefore support previous studies on phylotype specific responses of Symbiodinium
exposed to such conditions (Brading et al. 2011). Such phylotype specific responses
were evident in photosynthetic efficiency (as measured by Fv/Fm), between cells of
Symbiodinium clade C1 and clade F exposed to elevated pCO2 conditions. Cells of
Symbiodinium clade C1 showed a significant decline in Fv/Fm when exposed to
elevated CO2 concentrations of 550 ppm pCO2, 750 ppm pCO2 and 10 000 ppm pCO2
concentrations (Chapter 2; Figure 2.6), while Fv/Fm was not affected by elevated pCO2
concentrations of 750 ppm pCO2 and 1500 ppm pCO2 in cells of Symbiodinium clade
F (Chapter 3; Figure 3.2). Changes in transcript abundance also varied between the
two clades examined in this thesis. Transcript levels of both SymBCA1 and
SymBCA2 were significantly decreased in Symbiodinium clade C1 exposed to 10 000
ppm CO2 conditions (Chapter 2; Figure 2.6b and c), while expression patterns were
not altered at concentrations of 550 ppm and/or 750 ppm CO2. Chapter 3 also
reported that gene expression patterns were not altered when cells of Symbiodinium
clade F were exposed to 750 ppm and/or 1500 ppm (Chapter 3; Figure 3.5 a and b) but
were more affected by thermal stress. Furthermore, the differentially expressed CA
transcripts identified in Chapter 5, including the transcript that showed homology to
SymBCA2 (comp 104242_c0), increased under 10 000 ppm CO2 conditions in
Symbiodinium clade F, which is in contrast to Chapter 2. One possible explanation for
the difference in CA transcription under elevated pCO2 may relate to the location of
these CAs. All differentially expressed CA transcripts identified in Chapter 5 were
predicted to be located to the chloroplast, while the CAs identified in Chapter 2 were
predicted to be located to the cytosol. It must be noted however that the full-length
sequence was not obtained for SymBCA2 in Chapter 2. Therefore it is possible that
SymBCA2 does contain a transit peptide and could be located to the chloroplast. It
may also be possible that different phylotypes are more susceptible to elevated CO2
conditions than other phylotypes (as has been displayed with thermal tolerance and

sensitivity of Symbiodinium (Rowan 2004, Berkelmans and Van Oppen 2006), and
therefore a CO2 tolerant linage may exists within Symbiodinium. This becomes
extremely important when the environmental threshold of the coral-algal symbiosis
relies upon the taxonomic composition of endosymbionts (Baker 2003, Berkelmans
and Van Oppen 2006). Such diversity of stress response within and between
Symbiodinium phylotypes has now led to attempts to facilitate genetic adaptation of
existing Symbiodinium strains to mitigate coral bleaching (van Oppen et al. 2015). In
this approach, strains of Symbiodinium can be subjected to a variety of environmental
stressors in the laboratory with the end goal of eliciting an adaptive response through
selection on random somatic mutations, which can be enhanced by exposing the
cultures to a mutagen. The selected Symbiodinium strains may be able to establish
symbiosis with the aposymbiotic early life stages of corals, resulting in corals with
new phenotypes. This can ultimately lead to corals harbouring Symbiodinium strains
with enhanced stress tolerance that can therefore be targeted for reef restoration (Van
Oppen et al. 2015). Whether or not a CO2 tolerant strain exists in Symbiodinium and
if CA transcription abundance differ between the strains would need to be further
investigated.
The effects of varied light intensities on Symbiodinium CA transcription were
explored for the first time in this thesis (Chapter 4; aim 3). Light is recognized as a
major regulator of photosynthetic proteins (Escoubas et al. 1995, Kobiyama et al.
2005, Murchie et al. 2005, Van Dolah et al. 2007), with CCM transcript levels of C.
reinhardtii shown to vary at various times of light/dark cycles, even at air-level CO2
concentrations (Tirumani et al. 2014). Both SymBCA1 and SymBCA2 transcript
levels were not altered when cells were previously acclimated to HL conditions (250 –
350 μmol quanta m-2 s-1) and transitioned to ML levels (80 - 100 μmol quanta m-2 s-1)

or LL levels (10 – 15 μmol quanta m-2 s-1). Changes in transcript abundance however
were noted when cells were acclimated to lower light intensities (ML; ~80 - 100 μmol
quanta m-2 s-1) intensities and changed to higher irradiance levels, with both
SymBCA1 and SymBCA2 transcripts lowered in HL conditions (Chapter 4; Figure
4.3a and b). These results suggest that CO2 may not be the sole factor in altering
transcription of SymBCA1 and SymBCA2 and, that an interactive effect of both light
and CO2 may regulate these particular CAs as seen in C. reinhardtii (Tirumani et al.
2014). A key observation of this study was that while the physiological response of
Symbiodinium moved to HL conditions is consistent with previous studies on
Symbiodinium, and other photosynthetic algae, which report lower Fv/Fm values for
HL conditions (Hennige et al. 2009; Robinson and Warner 2006), the acclimation
process of cells acclimated to ML and moved to HL takes place mostly during the first
day for PSII (Figure 4.1) while significant changes in transcript levels of SymBCA1,
SymBCA2, acpPC_15 and acpPC_17 takes place much later on day 9 (Figure 4.3a and
b). In addition, changes to transcript abundance of SymBCA1, SymBCA2 and
acpPCs occurred much slower when compared to other microalgae that have shown to
regulate expression within six hours of exposure to light (Tirumani et al. 2014). These
results support the hypothesis that Symbiodinium may not able to rapidly alter gene
expression patterns and that more changes are occurring post-transcriptionally. These
results have also revealed that there is little understanding about the timing of gene
expression in Symbiodinium and now raise the question as to whether SymBCA1 and
SymBCA2 could be regulated by a circadian clock as seen in the periplasmic and
mitochondrial CAs of C. reinhardtii. Future work should therefore investigate the
effect of light/dark cycles on Symbiodinium CAs and also incorporate varying
concentrations of pCO2. In addition, since decreases in acpPCs transcripts were
observed, chlorophyll pigment content should also be investigated to link transcription
changes to changes in chlorophyll content.
Advances in molecular and genomic approaches have enabled transcriptome
analysis of Symbiodinium stress response under various environmental conditions.
Whole-transcriptome analysis has already been used in studies on the impact of global
climate change on many coastal organisms (Franssen et al. 2011, Meyer et al. 2011,
Moya et al. 2012, Runcie et al. 2012). These studies have identified specific
biological functions or phenotypic plasticity across populations facing different
environmental conditions and, have also highlighted many unexpected pathways that
may or may not be affected by such conditions. The major aim of the Symbiodinium
transcriptome study (Chapter 5) was to initiate a whole-transcriptome analysis in
Symbiodinium clade F to gain insight into cellular processes occurring in response to
prolonged elevated pCO2 conditions. While the CO2 concentration used was not
ecologically relevant, this concentration was used to mirror the work reported in
Chapter 2. The results of Chapter 5 may therefore have a greater relevance to our
understanding of the high CO2 environment that surrounds Symbiodinium in the
symbiosome when in symbiosis. Elevated pCO2 conditions increased transcripts
encoding for proteins involved in functions such as photosynthesis and carbon
metabolism while transmembrane transport, protein phosphorylation, ATP and protein
binding were all significantly decreased in Symbiodinium clade F. These results have
indicated that Symbiodinium clade F cell cycle is affected by prolonged elevated pCO2
conditions. The increased transcript abundance of photosynthetic proteins under CO2
enrichment is similar to that seen in other algae (Riebesell et al. 1993, Hein and Sand-
Jensen 1997, Peng et al. 2016, Sun et al. 2016). However, the decrease in transcript
abundance of proteins involved in transmembrane transport, in particular transcripts
encoding ammonium transporters, is in contrast to previous transcriptome studies
(González-Ballester et al. 2004, Fernandez and Galvan 2007). As noted earlier, the
differentially expressed CA transcripts were all significantly increased in
Symbiodinium clade F under elevated CO2 conditions, which are in contrast to both
previous studies that have identified decreases in CA transcripts when exposed to 1 or
5 % pCO2 (Kaplan et al. 1980, Tsuzuki and Miyachi 1989, Raven 1991, Matsuda et al.
2001, Van de Waal et al. 2013) and, results obtained in Chapter 2. Therefore, it is
essential that future studies examine the effects of elevated pCO2 concentrations on
both phylotypes of Symbiodinium to see if a similar response is observed.
Ultimately, the physiological performance of coral reefs is highly dependant
upon the combined outcome of the coral host and its endosymbiotic algae
Symbiodinium. Evidence that coral reefs can adapt at rates which are sufficient for
them to keep up with rapid ocean warming and acidification is minimal, especially
given that corals are long-lived and hence have slow rates of evolution. The present
research however has improved the knowledge for one of these organisms, the
symbiotic dinoflagellate Symbiodinium and has provided a basis for future climate
change studies to further investigate the role and functioning of CA gene families in
Symbiodinium photosynthesis under climate change conditions. Future research
should therefore address the questions:
• Do certain CA gene families perform different roles in the CCM?
• Does the role of the same CA gene differ in different phylotypes of
Symbiodinium?
• How many of the identified CAs are actively involved in the CCM?
• Are Symbiodinium CAs regulated by a circadian clock?
• Do Symbiodinium regulate transcription and how? Is this regulation the
same for different phylotypes of Symbiodinium?
• Is there a regulatory gene controlling the induction of the
Symbiodinium CCM as identified in C. reinhardtii?
• How will high levels of irradiance interact with elevated SST and OA
to affect Symbiodinium photosynthesis?
In conclusion, this thesis has furthered the knowledge on CA enzymes in
Symbiodinium and of the potential impacts of global climate change on the physiology
and transcriptomic response of Symbiodinium photosynthesis. The data presented in
this thesis have also illustrated and supported Symbiodinium stress response to vary
according to the particular phylotype examined. Implicit in all the results obtained
from this thesis is a strong foundation for understanding how a particular
environmental driver such as ocean acidification and /or temperature will be
transduced through Symbiodinium to possibly alter the tolerance and response of the
coral-algal symbiosis to global climate change conditions. In addition, these results
have raised additional questions that can be used to further investigate Symbiodinium
stress response to climate change in order to protect such a biologically diverse and
important ecosystem.
References
Al-Khatib, K. and G. M. Paulsen (1999). High-temperature effects on photosynthetic
processes in temperate and tropical cereals. Crop Science 39: 119-125.
Al-Moghrabi, S., C. Goiran, D. Allemand, N. Speziale and J. Jaubert (1996).
Inorganic carbon uptake for photosynthesis by the symbiotic coral-
dinoflagellate association II. Mechanisms for bicarbonate uptake. Journal of
Experimental Marine Biology and Ecology 199: 227-248.
Alber, B. E., C. M. Colangelo, J. Dong, C. M. Stålhandske, T. T. Baird, C. Tu, C. A.
Fierke, D. N. Silverman, R. A. Scott and J. G. Ferry (1999). Kinetic and
spectroscopic characterization of the gamma-carbonic anhydrase from the
methanoarchaeon Methanosarcina thermophila. Biochemistry 38: 13119-
13128.
Alber, B. E. and J. G. Ferry (1994). A carbonic anhydrase from the archaeon
Methanosarcina thermophila. Proceedings of the National Academy of
Sciences 91: 6909-6913.
Allorent, G., R. Tokutsu, T. Roach, G. Peers, P. Cardol, J. Girard-Bascou, D.
Seigneurin-Berny, D. Petroutsos, M. Kuntz and C. Breyton (2013). A dual
strategy to cope with high light in Chlamydomonas reinhardtii. The Plant Cell
25: 545-557.
Alterio, V., A. Di Fiore, K. D’ambrosio, C. T. Supuran and G. De Simone (2012).
Multiple binding modes of inhibitors to carbonic anhydrases: how to design
specific drugs targeting 15 different isoforms? Chemical reviews 112: 4421-
4468.
Anjard, C., W. F. Loomis and D. S. Consortium (2002). Evolutionary analyses of
ABC transporters of Dictyostelium discoideum. Eukaryotic Cell 14: 643-652.
Anthony, K. R. N., D. I. Kline, G. Diaz-Pulido, S. Dove and O. Hoegh-Guldberg
(2008). Ocean acidification causes bleaching and productivity loss in coral reef
builders. Proceedings of the National Academy of Sciences 105: 17442-17446.
Aranda, M., Y. Li, Y. J. Liew, S. Baumgarten, O. Simakov, M. C. Wilson, J. Piel, H.
Ashoor, S. Bougouffa, V. B. Bajic, T. Ryu, T. Ravasi, T. Bayer, G. Micklem,
H. Kim, J. Bhak, T. C. Lajeunesse and C. R. Voolstra (2016). Genomes of
coral dinoflagellate symbionts highlight evolutionary adaptations conducive to
a symbiotic lifestyle. Scientific Reports 6: 39734.
Arya, R., M. Mallik and S. C. Lakhotia (2007). Heat shock genes—integrating cell
survival and death. Journal of biosciences 32: 595-610.
Bachvaroff, T. R. and A. R. Place (2008). From Stop to start: Tandem gene
arrangement, copy number and trans-splicing sites in the Dinoflagellate
Amphidinium carterae. Plos One 38: e2929.
Badger, M. (2003). The roles of carbonic anhydrases in photosynthetic CO2
concentrating mechanisms. Photosynthesis Research 77: 83-94.
Badger, M. R. and T. J. Andrews (1982). Photosynthesis and inorganic carbon usage
by the marine cyanobacterium, Synechococcus sp. Plant Physiology 70: 517-
523.
Badger, M. R., T. J. Andrews, S. M. Whitney, M. Ludwig, D. C. Yellowlees, W.
Leggat and G. D. Price (1998). The diversity and coevolution of Rubisco,
plastids, pyrenoids, and chloroplast-based CO2-concentrating mechanisms in
algae. Canadian Journal of Botany-Revue Canadienne De Botanique 76: 1052-
1071.
Badger, M. R., D. Hanson and G. D. Price (2002). Evolution and diversity of CO2
concentrating mechanisms in cyanobacteria. Functional Plant Biology 29: 161-
173.
Badger, M. R., A. Kaplan and J. A. Berry (1980). Internal inorganic carbon pool of
Chlamydomonas reinhardtii. Evidence for a carbon dioxide-concentrating
mechanism. Plant Physiology 66: 407-413.
Badger, M. R. and G. D. Price (1992). The CO2 concentrating mechanism in
cyanobactiria and microalgae. Physiologia Plantarum 84: 606-615.
Badger, M. R. and G. D. Price (1994). The role of carbonic anhydrase in
photosynthesis. Annual Review of Plant Physiology and Plant Molecular
Biology 45: 369-392.
Badger, M. R. and G. D. Price (2003). CO2 concentrating mechanisms in
cyanobacteria: molecular components, their diversity and evolution. Journal of
Experimental Botany 54: 609-622.
Baker, A. C. (2003). Flexibility and specificity in coral-algal symbiosis: diversity,
ecology, and biogeography of Symbiodinium. Annual Review of Ecology,
Evolution, and Systematics 34: 661-689.
Baker, A. C., C. J. Starger, T. R. Mcclanahan and P. W. Glynn (2004). Coral reefs:
corals' adaptive response to climate change. Nature 430: 741-741.
Baker, N. R. (2008). Chlorophyll fluorescence: a probe of photosynthesis in vivo.
Annual Review Plant of Biology. 59: 89-113.
Barbrook, A. and C. Howe (2000). Minicircular plastid DNA in the dinoflagellate
Amphidinium operculatum. Molecular and General Genetics MGG 263: 152-
158.
Barbrook, A., H. Symington, R. Nisbet, A. Larkum and C. Howe (2001). Organisation
and expression of the plastid genome of the dinoflagellate Amphidinium
operculatum. Molecular Genetics and Genomics 266: 632-638.
Barott, K. L., A. A. Venn, S. O. Perez, S. Tambutté and M. Tresguerres (2015). Coral
host cells acidify symbiotic algal microenvironment to promote
photosynthesis. Proceedings of the National Academy of Sciences 112: 607-
612.
Barshis, D. J., J. T. Ladner, T. A. Oliver and S. R. Palumbi (2014). Lineage specific
transcriptional profiles of Symbiodinium spp. Unaltered by heat stress in a
coral host. Molecular Biology and Evolution 31: 1343-1352.
Bayer, T., M. Aranda, S. Sunagawa, L. K. Yum, M. K. Desalvo, E. Lindquist, M. A.
Coffroth, C. R. Voolstra and M. Medina (2012). Symbiodinium transcriptomes:
genome insights into the dinoflagellate symbionts of reef-building corals. Plos
One 74: e35269.
Beardall, J. and M. Giordano (2002). Ecological implications of microalgal and
cyanobacterial CO2 concentrating mechanisms, and their regulation.
Functional Plant Biology 29: 335-347.
Beardall, J., A. Johnston and J. Raven (1998). Environmental regulation of CO2-
concentrating mechanisms in microalgae. Canadian Journal of Botany 76:
1010-1017.
Beardall, J. and J. A. Raven (2004). The potential effects of global climate change on
microalgal photosynthesis, growth and ecology. Phycologia 43: 26-40.
Bénazet-Tambutté, S., D. Allemand and J. Jaubert (1996). Permeability of the oral
epithelial layers in cnidarians. Marine Biology 126: 43-53.
Berkelmans, R. and M. J. Van Oppen (2006). The role of zooxanthellae in the thermal
tolerance of corals: a ‘nugget of hope’for coral reefs in an era of climate
change. Proceedings of the Royal Society of London B: Biological Sciences
273: 2305-2312.

Berman Frank, I., A. Kaplan, T. Zohary and Z. Dubinsky (1995). Carbonic
anhydrase activity in the bloom forming Dinoflagellate Peridinium gatunense.
Journal of Phycology 31: 906-913.
Berry, J. and O. Bjorkman (1980). Photosynthetic response and adaptation to
temperature in higher plants. Annual Review of plant physiology 31: 491-543.
Bertucci, A., É. Tambutté, S. Tambutté, D. Allemand and D. Zoccola (2009).
Symbiosis-dependent gene expression in coral–dinoflagellate association:
cloning and characterization of a P-type H+-ATPase gene. Proceedings of the
Royal Society of London B: Biological Sciences: rspb20091266.
Bhatt, R., M. Baig and H. Tiwari (2010). Elevated CO2 influences photosynthetic
characteristics of Avena sativa L cultivars.
Biggins, J. and D. Bruce (1989). Regulation of excitation energy transfer in organisms
containing phycobilins. Photosynthesis Research 20: 1-34.
Bissett, W. P., J. S. Patch, K. L. Carder and Z. P. Lee (1997). Pigment packaging and
Chl a specific absorption in high light oceanic waters. Limnology and
Oceanography 42: 961-968.
Blank, R. (1987). Cell architecture of the dinoflagellate Symbiodinium sp. inhabiting
the Hawaiian stony coral Montipora verrucosa. Marine Biology 94: 143-155.
Blank, R. J., V. A. Huss and W. Kersten (1988). Base composition of DNA from
symbiotic dinoflagellates: a tool for phylogenetic classification. Archives of
microbiology 149: 515-520.
Bloom, A. J., M. Burger, J. S. Rubio Asensio and A. B. Cousins (2010). Carbon
dioxide enrichment inhibits nitrate assimilation in wheat and Arabidopsis.
Science 328: 899-903.
Boldt, L., D. Yellowlees and W. Leggat (2009). Measuring Symbiodinium sp. gene
expression patterns with quantitative real-time PCR. In: Proceedings of the
11th International Coral Reef Symposium, pp. 118-122. From: 11th
International Coral Reef Symposium, 7 - 11 July 2008, Fort Lauderdale, FL,
USA.
Boldt, L., D. Yellowlees and W. Leggat (2012). Hyperdiversity of genes encoding
integral light-harvesting proteins in the Dinoflagellate Symbiodinium sp. Plos
One 710.
Bouligand, Y. and V. Norris (2001). Chromosome separation and segregation in
dinoflagellates and bacteria may depend on liquid crystalline states. Biochimie
83: 187-192.
Bozzo, G. and B. Colman (2000). The induction of inorganic carbon transport and
external carbonic anhydrase in Chlamydomonas reinhardtii is regulated by
external CO2 concentration. Plant, Cell & Environment 23: 1137-1144.
Brading, P., M. E. Warner, P. Davey, D. J. Smith, E. P. Achterberg and D. J. Suggett
(2011). Differential effects of ocean acidification on growth and
photosynthesis among phylotypes of Symbiodinium (Dinophyceae). Limnology
and Oceanography 56: 927-938.
Brading, P., M. E. Warner, D. J. Smith and D. J. Suggett (2013). Contrasting modes of
inorganic carbon acquisition amongst Symbiodinium (Dinophyceae)
phylotypes. New Phytologist 200: 432-442.
Braun, H.-P. and E. Zabaleta (2007). Carbonic anhydrase subunits of the
mitochondrial NADH dehydrogenase complex (complex I) in plants.
Physiologia Plantarum 129: 114-122.
Brown, B., I. Ambarsari, M. Warner, W. Fitt, R. Dunne, S. Gibb and D. Cummings
(1999). Diurnal changes in photochemical efficiency and xanthophyll
concentrations in shallow water reef corals: evidence for photoinhibition and
photoprotection. Coral Reefs 18: 99-105.
Brown, B., R. Dunne, M. Goodson and A. Douglas (2002). Experience shapes the
susceptibility of a reef coral to bleaching. Coral Reefs 21: 119-126.
Brueggeman, A. J., D. S. Gangadharaiah, M. F. Cserhati, D. Casero, D. P. Weeks and
I. Ladunga (2012). Activation of the carbon concentrating mechanism by CO2
deprivation coincides with massive transcriptional restructuring in
Chlamydomonas reinhardtii. The Plant Cell 24: 1860-1875.
Burkhardt, S., U. Riebesell and I. Zondervan (1999). Effects of growth rate, CO2
concentration, and cell size on the stable carbon isotope fractionation in marine
phytoplankton. Geochimica et Cosmochimica Acta 63: 3729-3741.
Burki, F., K. Shalchian-Tabrizi, M. Minge, Å. Skjæveland, S. I. Nikolaev, K. S.
Jakobsen and J. Pawlowski (2007). Phylogenomics reshuffles the eukaryotic
supergroups. Plos One 28: e790.
Burnell, J., M. Gibbs and J. Mason (1990). Spinach chloroplastic carbonic anhydrase:
nucleotide sequence analysis of cDNA. Plant Physiology 92: 37 - 40.

Buxton, L., S. Takahashi, R. Hill and P. J. Ralph (2012). Variability in the primary
site of photosynthetic damage in Symbiodinium sp.(Dinophyceae) exposed to
thermal stress. Journal of Phycology 48: 117-126.
Capasso, C. and C. T. Supuran (2015). An overview of the alpha-, beta-and gamma-
carbonic anhydrases from Bacteria: can bacterial carbonic anhydrases shed
new light on evolution of bacteria? Journal of Enzyme Inhibition and
Medicinal Chemistry 30: 325-332.
Cardol, P., D. González-Halphen, A. Reyes-Prieto, D. Baurain, R. F. Matagne and C.
Remacle (2005). The mitochondrial oxidative phosphorylation proteome of
Chlamydomonas reinhardtii deduced from the Genome Sequencing Project.
Plant Physiology 137: 447-459.
Chaikam, V. and D. T. Karlson (2010). Comparison of structure, function and
regulation of plant cold shock domain proteins to bacterial and animal cold
shock domain proteins. BMB Rep 43: 1-8.
Chang, S., B. Prezelin and R. Trench (1983). Mechanisms of photoadaptation in three
strains of the symbiotic dinoflagellate Symbiodinium microadriaticum. Marine
Biology 76: 219-229.
Chaput, H., Y. Wang and D. Morse (2002). Polyadenylated transcripts containing
random gene fragments are expressed in dinoflagellate mitochondria. Protist
153: 111 - 122.
Chen, X. and K. Gao (2004). Photosynthetic utilisation of inorganic carbon and its
regulation in the marine diatom Skeletonema costatum. Functional Plant
Biology 31: 1027-1033.
Chirica, L. C., B. Elleby and S. Lindskog (2001). Cloning, expression and some
properties of α-carbonic anhydrase from Helicobacter pylori. Biochimica et
Biophysica Acta (BBA)-Protein Structure and Molecular Enzymology 1544:
55-63.
Clement, R., S. Lignon, P. Mansuelle, E. Jensen, M. Pophillat, R. Lebrun, Y. Denis,
C. Puppo, S. C. Maberly and B. Gontero (2017). Responses of the marine
diatom Thalassiosira pseudonana to changes in CO2 concentration: a
proteomic approach. Scientific Reports 7: 42333.
Coffroth, M. A. and S. R. Santos (2005). Genetic diversity of symbiotic
dinoflagellates in the genus Symbiodinium. Protist 156: 19-34.

Cohen, P. T., A. Philp and C. Vázquez-Martin (2005). Protein phosphatase 4–from
obscurity to vital functions. Febs Letters 579: 3278-3286.
Coleman, A. W., A. Suarez and L. J. Goff (1994). Molecular delineation of species
and syngens in volvocacean green algae (Chlorophyta). Journal of Phycology
30: 80-90.
Coleman, J. R. (1991). The Molecular and biochemical analyses of CO2-concentrating
mechanisms in cyanobacteria and microalgae. Plant Cell and Environment 14:
861-867.
Coles, S. and P. L. Jokiel (1978). Synergistic effects of temperature, salinity and light
on the hermatypic coral Montipora verrucosa. Marine Biology 49: 187-195.
Collins, S., D. Sültemeyer and G. Bell (2006). Changes in C uptake in populations of
Chlamydomonas reinhardtii selected at high CO2. Plant, Cell & Environment
29: 1812-1819.
Colman, B., I. E. Huertas, S. Bhatti and J. S. Dason (2002). The diversity of inorganic
carbon acquisition mechanisms in eukaryotic microalgae. Functional Plant
Biology 29: 261-270.
Conesa, A. and S. Götz (2008). Blast2GO: A comprehensive suite for functional
analysis in plant genomics. International journal of plant genomics 2008.
Conesa, A., S. Götz, J. M. García-Gómez, J. Terol, M. Talón and M. Robles (2005).
Blast2GO: a universal tool for annotation, visualization and analysis in
functional genomics research. Bioinformatics 21: 3674-3676.
Conesa, A., P. Madrigal, S. Tarazona, D. Gomez-Cabrero, A. Cervera, A. Mcpherson,
M. W. Szcześniak, D. J. Gaffney, L. L. Elo and X. Zhang (2016). A survey of
best practices for RNA-seq data analysis. Genome biology 171: 13.
Cook, C., T. Lanaras and B. Colman (1986). Evidence for bicarbonate transport in
species of red and brown macrophytic marine algae. Journal of Experimental
Botany 37: 977-984.
Cox, E. H., G. L. Mclendon, F. M. M. Morel, T. W. Lane, R. C. Prince, I. J. Pickering
and G. N. George (2000). The active site structure of Thalassiosira weissflogii
carbonic anhydrase 1. Biochemistry 39: 12128-12130.
Crawford, N. M. and A. D. M. Glass (1998). Molecular and physiological aspects of
nitrate uptake in plants. Trends in Plant Science 3: 389-395.

Crawley, A., D. I. Kline, S. Dunn, K. Anthony and S. Dove (2010). The effect of
ocean acidification on symbiont photorespiration and productivity in Acropora
formosa. Global Change Biology 16: 851-863.
De La Espina, S. M. D., E. Alverca, A. Cuadrado and S. Franca (2005). Organization
of the genome and gene expression in a nuclear environment lacking histones
and nucleosomes: the amazing dinoflagellates. European journal of cell
biology 84: 137-149.
Dejtisakdi, W. and S. M. Miller (2016). Overexpression of calvin cycle enzyme
fructose 1,6-bisphosphatase in Chlamydomonas reinhardtii has a detrimental
effect on growth. Algal Research 14: 116-126.
Del Prete, S., D. Vullo, G. M. Fisher, K. T. Andrews, S.-A. Poulsen, C. Capasso and
C. T. Supuran (2014). Discovery of a new family of carbonic anhydrases in the
malaria pathogen Plasmodium falciparum—The η-carbonic anhydrases.
Bioorganic & Medicinal Chemistry Letters 24: 4389-4396.
Delwiche, C. F. (1999). Tracing the thread of plastid diversity through the tapestry of
life. The American Naturalist 154S4: S164-S177.
Delwiche, C. F. and J. D. Palmer (1996). Rampant horizontal transfer and duplication
of Rubisco genes in eubacteria and plastids. Molecular Biology and Evolution
13: 873-882.
Demmig-Adams, B. and W. W. Adams (2000). Photosynthesis: Harvesting sunlight
safely. Nature 403: 371-374.
Desalvo, M., C. Voolstra, S. Sunagawa, J. Schwarz, J. Stillman, M. Coffroth, A.
Szmant and M. Medina (2008). Differential gene expression during thermal
stress and bleaching in the Caribbean coral Montastraea faveolata. Molecular
ecology 17: 3952-3971.
Dionisio, M. L., M. Tsuzuki and S. Miyachi (1989). Blue light induction of carbonic
anhydrase activity in Chlamydomonas reinhardtii. Plant and Cell Physiology
30: 215-219.
Dionisio-Sese, M. L., H. Fukuzawa and S. Miyachi (1990). Light-induced carbonic
anhydrase expression in Chlamydomonas reinhardtii. Plant Physiology 94:
1103-1110.
Dodgson, S. (1991). The Carbonic Anhydrases. The Carbonic Anhydrases. S.
Dodgson, R. Tashian, G. Gros and N. Carter, Springer US: 3-14.

Dove, S., J. C. Ortiz, S. Enriquez, M. Fine, P. Fisher, R. Iglesias-Prieto, D. Thornhill
and O. Hoegh-Guldberg (2006). Response of holosymbiont pigments from the
scleractinian coral Montipora monasteriata to short term heat stress.
Limnology and Oceanography 51: 1149-1158.
Draetta, G. (1990). Cell cycle control in eukaryotes: molecular mechanisms of cdc2
activation. Trends in Biochemical Sciences 15: 378-383.
Drake, B. G., M. A. Gonzàlez-Meler and S. P. Long (1997). More efficient plants: a
consequence of rising atmospheric CO2. Annual Review of Plant Biology 48:
609-639.
Dring, M. (1988). Photocontrol of development in algae. Annual Review of Plant
Physiology and Plant Molecular Biology 39: 157-174.
Dubinsky, Z., P. Falkowski, J. Porter and L. Muscatine (1984). Absorption and
utilization of radiant energy by light-and shade-adapted colonies of the
hermatypic coral Stylophora pistillata. Proceedings of the Royal Society of
London B: Biological Sciences 222: 203-214.
Dudler, R. and C. Hertig (1992). Structure of an mdr-like gene from Arabidopsis
thaliana. Evolutionary implications. Journal of Biological Chemistry 267:
5882-5888.
Durnford, D. G., J. A. Price, S. M. Mckim and M. L. Sarchfield (2003). Light
harvesting complex gene expression is controlled by both transcriptional and
post transcriptional mechanisms during photoacclimation in Chlamydomonas
reinhardtii. Physiologia Plantarum 118: 193-205.
Elleuche, S. and S. Poggeler (2009). Evolution of carbonic anhydrases in fungi.
Current Genetics 55: 211 - 222.
Emanuelsson, O., H. Nielsen, S. Brunak and G. Von Heijne (2000). Predicting
subcellular localization of proteins based on their N-terminal amino acid
sequence. Journal of Molecular Biology 300: 1005 - 1016.
Erickson, E., S. Wakao and K. K. Niyogi (2015). Light stress and photoprotection in
Chlamydomonas reinhardtii. The Plant Journal 82: 449-465.
Eriksson, M., J. Karlsson, Z. Ramazanov, P. Gardestrom and G. Samuelsson (1996).
Discovery of an algal mitochondrial carbonic anhydrase: molecular cloning
and characterization of a low-CO2-induced polypeptide in Chlamydomonas

reinhardtii. Proceedings of the National Academy of Sciences USA 93: 12031
- 12034.
Eriksson, M., P. Villand, P. Gardeström and G. Samuelsson (1998). Induction and
regulation of expression of a low-CO2-induced mitochondrial carbonic
anhydrase in Chlamydomonas reinhardtii. Plant Physiology 116: 637-641.
Errera, R. M., S. Yvon-Lewis, J. D. Kessler and L. Campbell (2014). Reponses of the
dinoflagellate Karenia brevis to climate change: pCO2 and sea surface
temperatures. Harmful Algae 37: 110-116.
Escoubas, J.-M., M. Lomas, J. Laroche and P. G. Falkowski (1995). Light intensity
regulation of cab gene transcription is signaled by the redox state of the
plastoquinone pool. Proceedings of the National Academy of Sciences 92:
10237-10241.
Fagan, T., D. Morse and J. W. Hastings (1999). Circadian synthesis of a nuclear-
encoded chloroplast glyceraldehyde-3-phosphate dehydrogenase in the
dinoflagellate Gonyaulax polyedra is translationally controlled. Biochemistry
38: 7689-7695.
Falkowski, P. G., Z. Dubinsky, L. Muscatine and L. Mccloskey (1993). Population
Control in Symbiotic Corals. Ammonium ions and organic materials maintain
the density of zooxanthellae. Bioscience 43: 606-611.
Falkowski, P. G., Z. Dubinsky, L. Muscatine and J. W. Porter (1984). Light and the
bioenergetics of a symbiotic coral. Bioscience 34: 705-709.
Falkowski, P. G. and J. A. Raven (2007). Aquatic Photosynthesis, 2nd edition.
Princeton, NJ, Princeton University Press.
Falkowski, P. G. and J. A. Raven (2013). Aquatic photosynthesis, Princeton
University Press.
Fang, W., Y. Si, S. Douglass, D. Casero, S. S. Merchant, M. Pellegrini, I. Ladunga, P.
Liu and M. H. Spalding (2012). Transcriptome-wide changes in
Chlamydomonas reinhardtii gene expression regulated by carbon dioxide and
the CO2-concentrating mechanism regulator CIA5/CCM1. The Plant Cell 24:
1876-1893.
Fernandez, E. and A. Galvan (2007). Inorganic nitrogen assimilation in
Chlamydomonas. Journal of Experimental Botany 58: 2279-2287.

Field, C. B., M. J. Behrenfeld, J. T. Randerson and P. Falkowski (1998). Primary
production of the biosphere: integrating terrestrial and oceanic components.
Science 281: 237-240.
Foyer, C. H., J. Neukermans, G. Queval, G. Noctor and J. Harbinson (2012).
Photosynthetic control of electron transport and the regulation of gene
expression. Journal of Experimental Botany 63: 1637-1661.
Franssen, S. U., J. Gu, N. Bergmann, G. Winters, U. C. Klostermeier, P. Rosenstiel, E.
Bornberg-Bauer and T. B. Reusch (2011). Transcriptomic resilience to global
warming in the seagrass Zostera marina, a marine foundation species.
Proceedings of the National Academy of Sciences 108: 19276-19281.
Freudenthal, H. D. (1962). Symbiodinium gen. nov. and Symbiodinium
microadriaticum sp. nov., a Zooxanthella: Taxonomy, Life Cycle, and
Morphology. Journal of Eukaryotic Microbiology 91: 45-52.
Fu, B. and S. He (2012). Transcriptome analysis of silver carp (Hypophthalmichthys
molitrix) by paired-end RNA sequencing. DNA research 19: 131-142.
Fujiwara, S., H. Fukuzawa, A. Tachiki and S. Miyachi (1990). Structure and
differential expression of 2 genes encoding carbonic anhydrase in
Chlamydomonas reinhardtii. Proceedings of the National Academy of
Sciences of the United States of America 87: 9779-9783.
Fukuzawa, H., S. Fujiwara, Y. Yamamoto, M. L. Dionisio-Sese and S. Miyachi
(1990). cDNA cloning, sequence, and expression of carbonic anhydrase in
Chlamydomonas reinhardtii: regulation by environmental CO2 concentration.
Proceedings of the National Academy of Sciences 87: 4383-4387.
Fukuzawa, H., E. Suzuki, Y. Komukai and S. Miyachi (1992). A gene homologous to
chloroplast carbonic anhydrase (Icfa) is essential to photosynthetic carbon-
dioxide fixation by Synechococcus Pcc7942. Proceedings of the National
Academy of Sciences of the United States of America 89: 4437-4441.
Funke, R. P., J. L. Kovar and D. P. Weeks (1997). Intracellular carbonic anhydrase is
essential to photosynthesis in Chlamydomonas reinhardtii at atmospheric
levels of CO2 (demonstration via genomic complementation of the high-CO2-
requiring mutant ca-1). Plant Physiology 114: 237-244.
Furla, P., D. Allemand and M.-N. Orsenigo (2000). Involvement of H+-ATPase and
carbonic anhydrase in inorganic carbon uptake for endosymbiont
photosynthesis. American Journal of Physiology-Regulatory, Integrative and
Comparative Physiology 278: 870-R881.
GBRMPA (2011). Coral Bleaching Risk and Impact Assessment Plan 2011.
Gierz, S. L., S. Forêt and W. Leggat (2017). Transcriptomic analysis of thermally
stressed Symbiodinium reveals differential expression of stress and metabolism
genes. Frontiers in Plant Science 8.
Gierz, S. L., B. R. Gordon and W. Leggat (2016). Integral light-harvesting complex
expression in Symbiodinium within the coral Acropora aspera under thermal
stress. Scientific Reports 6.
Giordano, M., J. Beardall and J. Raven (2005). CO2 concentrating mechanisms in
algae: Mechanisms, environmental modulation, and evolution. Annual Review
of Plant Biology 56: 99-131.
Glynn, P. (1993). Coral reef bleaching: ecological perspectives. Coral Reefs 12: 1-17.
Goiran, C., S. Al-Moghrabi, D. Allemand and J. Jaubert (1996). Inorganic carbon
uptake for photosynthesis by the symbiotic coral/dinoflagellate association I.
Photosynthetic performances of symbionts and dependence on sea water
bicarbonate. Journal of Experimental Marine Biology and Ecology 199: 207-
225.
González-Ballester, D., A. Camargo and E. Fernández (2004). Ammonium transporter
genes in Chlamydomonas: the nitrate-specific regulatory gene Nit2 is involved
in Amt1;1 expression. Plant Molecular Biology 56: 863-878.
González-Ballester, D., A. De Montaigu, J. J. Higuera, A. Galván and E. Fernández
(2005). Functional genomics of the regulation of the nitrate assimilation
pathway in Chlamydomonas. Plant Physiology 137: 522-533.
Goodenough, U. W., B. Shames, L. Small, T. Saito, R. C. Crain, M. A. Sanders and J.
L. Salisbury (1993). The role of calcium in the Chlamydomonas reinhardtii
mating reaction. The Journal of cell biology 121: 365-374.
Gordon, B. R. and W. Leggat (2010). Symbiodinium—invertebrate symbioses and the
role of metabolomics. Marine drugs 8: 2546-2568.
Gould, S. B., R. F. Waller and G. I. Mcfadden (2008). Plastid evolution. Annual
Review of Plant Biology 59.
Grabherr, M. G., B. J. Haas, M. Yassour, J. Z. Levin, D. A. Thompson, I. Amit, X.
Adiconis, L. Fan, R. Raychowdhury and Q. Zeng (2011). Full-length
transcriptome assembly from RNA-Seq data without a reference genome.
Nature biotechnology 29: 644-652.
Graham, D., M. L. Reed, B. D. Patterson, D. G. Hockley and M. R. Dwyer (1984).
Chemical properties, distribution, and physiology of plant and algal carbonic
anhydrases. Annals of the New York Academy of Sciences 429: 222-237.
Green, B. R. (2011). Chloroplast genomes of photosynthetic eukaryotes. The Plant
Journal 66: 34-44.
Gunter, H. M. and B. M. Degnan (2007). Developmental expression of Hsp90, Hsp70
and HSF during morphogenesis in the vetigastropod Haliotis asinina.
Development genes and evolution 217: 603-612.
Haas, B. J., A. Papanicolaou, M. Yassour, M. Grabherr, P. D. Blood, J. Bowden, M.
B. Couger, D. Eccles, B. Li and M. Lieber (2013). De novo transcript sequence
reconstruction from RNA-Seq: reference generation and analysis with Trinity.
Nature protocols 88.
Hackett, J., H. Yoon, M. Soares, M. Bonaldo, T. Casavant, T. Scheetz, T. Nosenko
and D. Bhattacharya (2004). Migration of the plastid genome to the nucleus in
a peridinin dinoflagellate. Curr Biol 14: 213 - 218.
Hackett, J. D., T. E. Scheetz, H. S. Yoon, M. B. Soares, M. F. Bonaldo, T. L. Casavant
and D. Bhattacharya (2005). Insights into a dinoflagellate genome through
expressed sequence tag analysis. BMC Genomics 61: 80.
Hald, S., M. Pribil, D. Leister, P. Gallois and G. N. Johnson (2008). Competition
between linear and cyclic electron flow in plants deficient in Photosystem I.
Biochim Biophys Acta 1777: 1173-1183.
Hamilton, M. L., E. Franco, Z. Deák, E. Schlodder, I. Vass and P. J. Nixon (2014).
Investigating the photoprotective role of cytochrome b-559 in photosystem II
in a mutant with altered ligation of the haem. Plant and Cell Physiology 55:
1276-1285.
Hein, M. and K. Sand-Jensen (1997). CO2 increases oceanic primary production.
Nature 388: 526-527.
Hennige, S., D. J. Suggett, M. E. Warner, K. Mcdougall and D. J. Smith (2009).
Photobiology of Symbiodinium revisited: bio-physical and bio-optical
signatures. Coral Reefs 28: 179-195.
Hewett-Emmett, D. and R. E. Tashian (1996). Functional diversity, conservation, and
convergence in the evolution of the α-, β-, and γ-carbonic anhydrase gene
families. Molecular Phylogenetics and Evolution 51: 50-77.
Higgins, C. F. (1992). ABC transporters: from microorganisms to man. Annual
Review of Cell Biology 81: 67-113.
Hobson, L. A., W. J. Morris and K. P. Guest (1985). Varying photoperiod, ribulose 1,
5-bisphosphate carboxylase/oxygenase and CO2 uptake in Thalassiosira
fluviatilis (Bacillariophyceae). Plant Physiology 79: 833-837.
Hoegh-Guldberg, O. (2011). Coral reef ecosystems and anthropogenic climate change.
Regional Environmental Change 11: 215-227.
Hoegh-Guldberg, O., P. J. Mumby, A. J. Hooten, R. S. Steneck, P. Greenfield, E.
Gomez, C. D. Harvell, P. F. Sale, A. J. Edwards and K. Caldeira (2007). Coral
reefs under rapid climate change and ocean acidification. Science 318: 1737-
1742.
Hoegh-Guldberg, O. and G. J. Smith (1989). The effect of sudden changes in
temperature, light and salinity on the population density and export of
zooxanthellae from the reef corals Stylophora pistillata Esperi and Seriatopora
hystrix Dana. Journal of Experimental Marine Biology and Ecology 129: 279-
303.
Horken, K. M. and F. R. Tabita (1999). Closely related Form I ribulose bisphosphate
carboxylase/oxygenase molecules that possess different CO2/O2 substrate
specificities. Archives of Biochemistry and Biophysics 361: 183-194.
Horton, P., A. Ruban and R. Walters (1996). Regulation of light harvesting in green
plants. Annual Review of Plant Biology 47: 655-684.
Hou, Y. B. and S. J. Lin (2009). Distinct gene number-genome size relationships for
Eukaryotes and non-Eukaryotes: Gene Content Estimation for Dinoflagellate
Genomes. Plos One 49.
Howe, C. J., R. E. R. Nisbet and A. C. Barbrook (2008). The remarkable chloroplast
genome of dinoflagellates. Journal of Experimental Botany 59: 1035-1045.
Hughes, T. P., A. H. Baird, D. R. Bellwood, M. Card, S. R. Connolly, C. Folke, R.
Grosberg, O. Hoegh-Guldberg, J. Jackson and J. Kleypas (2003). Climate
change, human impacts, and the resilience of coral reefs. Science 301: 929-
933.
Huner, N. P., G. Öquist and F. Sarhan (1998). Energy balance and acclimation to light
and cold. Trends in Plant Science 36: 224-230.
Hutchins, D., F.-X. Fu, Y. Zhang, M. Warner, Y. Feng, K. Portune, P. Bernhardt and
M. Mulholland (2007). CO2 control of Trichodesmium N2 fixation,
photosynthesis, growth rates, and elemental ratios: Implications for past,
present, and future ocean biogeochemistry. Limnology and Oceanography 52:
1293-1304.
Iglesias-Prieto, R., N. Govind and R. Trench (1993). Isolation and characterization of
three membrane-bound chlorophyll-protein complexes from four dinoflagellate
species. Philosophical Transactions of the Royal Society of London B:
Biological Sciences 340: 381-392.
Iglesias-Prieto, R., J. L. Matta, W. A. Robins and R. K. Trench (1992). Photosynthetic
response to elevated temperature in the symbiotic dinoflagellate Symbiodinium
microadriaticum in culture. Proceedings of the National Academy of Sciences
89: 10302-10305.
Iglesias-Prieto, R. and R. Trench (1997). Acclimation and adaptation to irradiance in
symbiotic dinoflagellates. II. Response of chlorophyll–protein complexes to
different photon-flux densities. Marine Biology 130: 23-33.
Iglesias-Prieto, R. and R. K. Trench (1994). Acclimation and adaptation to irradiance
in symbiotic dinoflagellates. I. Responses of the photosynthetic unit to changes
in photon flux density. Marine Ecology Progress Series: 163-175.
Im, C. S. and A. R. Grossman (2002). Identification and regulation of high light-
induced genes in Chlamydomonas reinhardtii. The Plant Journal 30: 301-313.
Inaba, K. (2015). Calcium sensors of ciliary outer arm dynein: functions and
phylogenetic considerations for eukaryotic evolution. Cilia 41: 6.
IPCC (2013). Climate Change 2013: The Physical Science Basis. Contribution of
working group I to the fifth assessment report of the Intergovernmental Panel
on Climate Change‚ T.F. Stocker‚ D. Qin‚ G.-K. Plattner‚ M. Tignor‚ S.K.
Allen‚ J. Boschung‚ A. Nauels‚ Y. Xia‚ V. Bex‚ P.M. Midgley (eds.)‚
Cambridge, United Kingdom and New York.
Iwai, M., N. Kato and J. Minagawa (2007). Distinct physiological responses to a high
light and low CO2 environment revealed by fluorescence quenching in
photoautotrophically grown Chlamydomonas reinhardtii. Photosynthesis
Research 94: 307-314.

Jackson, C., J. Norman, M. Schnare, M. Gray, P. Keeling and R. Waller (2007). Broad
genomic and transcriptional analysis reveals a highly derived genome in
dinoflagellate mitochondria. BMC Biology 5: 41.
Jackson, C. J., S. G. Gornik and R. F. Waller (2012). The mitochondrial genome and
transcriptome of the basal dinoflagellate Hematodinium sp.: Character
evolution within the highly derived mitochondrial genomes of dinoflagellates.
Genome Biology and Evolution 4: 59-72.
Jeans, J., M. Szabó, D. Campbell, A. Larkum, P. Ralph and R. Hill (2014). Thermal
bleaching induced changes in photosystem II function not reflected by changes
in photosystem II protein content of Stylophorapistillata. Coral Reefs 33: 131-
139.
Jeffrey, S. T. and G. Humphrey (1975). New spectrophotometric equations for
determining chlorophylls a, b, c 1 and c 2 in higher plants, algae and natural
phytoplankton. Biochemie und Physiologie der Pflanzen 167: 191-194.
Jensen, P. E., R. Bassi, E. J. Boekema, J. P. Dekker, S. Jansson, D. Leister, C.
Robinson and H. V. Scheller (2007). Structure, function and regulation of plant
photosystem I. Biochimica et Biophysica Acta (BBA)-Bioenergetics 1767:
335-352.
Jiang, W., Y. Hou and M. Inouye (1997). CspA, the major cold-shock protein of
Escherichia coli, is an RNA chaperone. Journal of Biological Chemistry 272:
196-202.
Johnson, J. G., J. S. Morey, M. G. Neely, J. C. Ryan and F. M. Van Dolah (2012).
Transcriptome remodeling associated with chronological aging in the
dinoflagellate, Karenia brevis. Marine genomics 5: 15-25.
Johnston, A. M. (1991). The acquisition of inorganic carbon by marine macroalgae.
Canadian Journal of Botany 69: 1123-1132.
Jones, R. J., O. Hoegh Guldberg, A. W. Larkum and U. Schreiber (1998).
Temperature induced bleaching of corals begins with impairment of the CO2
fixation mechanism in zooxanthellae. Plant, Cell & Environment 21: 1219-
1230.
Jordan, D. B. and W. L. Ogren (1983). Species variation in kinetic properties of
ribulose 1, 5-bisphosphate carboxylase/oxygenase. Archives of Biochemistry
and Biophysics 227: 425-433.
Kaplan, A., M. R. Badger and J. A. Berry (1980). Photosynthesis and the intracellular
inorganic carbon pool in the bluegreen alga Anabaena variabilis: response to
external CO2 concentration. Planta 149: 219-226.
Kaplan, A. and L. Reinhold (1999). CO2 concentrating mechanisms in photosynthetic
microorganisms. Annual Review of Plant Physiology and Plant Molecular
Biology 50: 539-570.
Kaplan, A., D. Zenvirth, Y. Marcus, T. Omata and T. Ogawa (1987). Energization and
activation of inorganic carbon uptake by light in cyanobacteria. Plant
Physiology 84: 210-213.
Karlsson, J., A. K. Clarke, Z. Y. Chen, S. Y. Hugghins, Y. I. Park, H. D. Husic, J. V.
Moroney and G. Samuelsson (1998). A novel alpha-type carbonic anhydrase
associated with the thylakoid membrane in Chlamydomonas reinhardtii is
required for growth at ambient CO2. Embo Journal 17: 1208-1216.
Karlsson, J., T. Hiltonen, H. D. Husic, Z. Ramazanov and G. Samuelsson (1995).
Intracellular carbonic anhydrase of Chlamydomonas reinhardtii. Plant
Physiology 109: 533-539.
Katoh, K. and D. M. Standley (2013). MAFFT Multiple Sequence Alignment
Software Version 7: Improvements in Performance and Usability. Molecular
Biology and Evolution 30: 772-780.
Keeling, P. J. (2009). Chromalveolates and the evolution of plastids by secondary
endosymbiosis. Journal of Eukaryotic Microbiology 56: 1-8.
Kerr, I. D. (2004). Sequence analysis of twin ATP binding cassette proteins involved
in translational control, antibiotic resistance, and ribonuclease L inhibition.
Biochemical and biophysical research communications 315: 166-173.
Khalifah, R. G. and D. N. Silverman (1991). Carbonic anhydrase kinetics and
molecular function. The Carbonic Anhydrases, Springer: 49-70.
Kimber, M. S. and E. F. Pai (2000). The active site architecture of Pisum sativum
beta-carbonic anhydrase is a mirror image of that of alpha-carbonic
anhydrases. Embo Journal 19: 1407-1418.
Kleypas, J. A. and K. K. Yates (2009). Coral reefs and ocean acidification.
Oceanography 22: 108-117.
Klodmann, J., S. Sunderhaus, M. Nimtz, L. Jänsch and H.-P. Braun (2010). Internal
architecture of mitochondrial complex I from Arabidopsis thaliana. The Plant
Cell 22: 797-810.
Kobiyama, A., N. Yoshida, S. Suzuki, K. Koike and T. Ogata (2005). Differences in
expression patterns of photosynthetic genes in the dinoflagellate Alexandrium
tamarense. European Journal of Protistology 41: 277-285.
Koziol, A. G., T. Borza, K.-I. Ishida, P. Keeling, R. W. Lee and D. G. Durnford
(2007). Tracing the evolution of the light-harvesting antennae in chlorophyll
a/b-containing organisms. Plant Physiology 143: 1802-1816.
Kramer, D. M. and J. R. Evans (2011). The importance of energy balance in
improving photosynthetic productivity. Plant Physiology 155: 70-78.
Krämer, W. E., I. Caamaño Ricken, C. Richter and K. Bischof (2012). Dynamic
regulation of photoprotection determines thermal tolerance of two phylotypes
of Symbiodinium clade A at two photon fluence rates. Photochemistry and
photobiology 88: 398-413.
Krueger, T., T. D. Hawkins, S. Becker, S. Pontasch, S. Dove, O. Hoegh-Guldberg, W.
Leggat, P. L. Fisher and S. K. Davy (2015). Differential coral bleaching—
Contrasting the activity and response of enzymatic antioxidants in symbiotic
partners under thermal stress. Comparative Biochemistry and Physiology Part
A: Molecular & Integrative Physiology 190: 15-25.
Kruger, N. J. and A. Von Schaewen (2003). The oxidative pentose phosphate
pathway: structure and organisation. Current Opinion in Plant Biology 63:
236-246.
Kültz, D. (2005). Molecular and evolutionary basis of the cellular stress response.
Annu. Rev. Physiol. 67: 225-257.
Lajeunesse, T. (2002). Diversity and community structure of symbiotic dinoflagellates
from Caribbean coral reefs. Marine Biology 141: 387-400.
Lajeunesse, T. and R. Trench (2000). Biogeography of two species of Symbiodinium
(Freudenthal) inhabiting the intertidal sea anemone Anthopleura elegantissima
(Brandt). The Biological Bulletin 199: 126-134.
Lajeunesse, T. C. (2001). Investigating the biodiversity, ecology, and phylogeny of
endosymbiotic dinoflagellates in the genus Symbiodinium using the ITS
region: in search of a “species” level marker. Journal of Phycology 37: 866-
880.
Lajeunesse, T. C., G. Lambert, R. A. Andersen, M. A. Coffroth and D. W. Galbraith
(2005). Symbiodinium (Pyrrhophyta) genome sizes (DNA content) are smallest
among dinoflagellates. Journal of Phycology 41: 880-886.
Lajeunesse, T. C., D. T. Pettay, E. M. Sampayo, N. Phongsuwan, B. Brown, D. O.
Obura, O. Hoegh Guldberg and W. K. Fitt (2010). Long standing
environmental conditions, geographic isolation and host symbiont specificity
influence the relative ecological dominance and genetic diversification of coral
endosymbionts in the genus Symbiodinium. Journal of Biogeography 37: 785-
800.
Lane, T., M. Saito, G. George, I. Pickering, R. Prince and F. Morel (2005).
Biochemistry: a cadmium enzyme from a marine diatom. Nature 435: 42.
Lane, T. W. and F. M. M. Morel (2000). Regulation of carbonic anhydrase expression
by zinc, cobalt, and carbon dioxide in the marine diatom Thalassiosira
weissflogii. Plant Physiology 123: 345-352.
Lapointe, M., T. D. B. Mackenzie and D. Morse (2008). An external delta-carbonic
anhydrase in a free-living marine dinoflagellate may circumvent diffusion-
limited carbon acquisition. Plant Physiology 147: 1427-1436.
Larkum, T. and C. Howe (1997). Molecular aspects of light-harvesting processes in
algae. Advances in Botanical Research 27: 257-330.
Laroche, J., A. Mortain-Bertrand and P. G. Falkowski (1991). Light intensity-induced
changes in cab mRNA and light harvesting complex II apoprotein levels in the
unicellular chlorophyte Dunaliella tertiolecta. Plant Physiology 97: 147-153.
Le, Q. H., R. Jovine, P. Markovic and D. Morse (2001). Peridinin-chlorophyll a-
protein is not implicated in the photosynthesis rhythm of the dinoflagellate
Gonyaulax despite circadian regulation of its translation. Biological rhythm
research 32: 579-594.
Leggat, W., M. R. Badger and D. Yellowlees (1999). Evidence for an inorganic
carbon-concentrating mechanism in the symbiotic dinoflagellate Symbiodinium
sp. Plant Physiology 121(4): 1247-1255.
Leggat, W., O. Hoegh-Guldberg, S. Dove and D. Yellowlees (2007). Analysis of an
EST library from the dinoflagellate (Symbiodinium sp.) symbiont of reef-
building corals1. Journal of Phycology 43: 1010-1021.
Leggat, W., E. M. Marendy, B. Baillie, S. M. Whitney, M. Ludwig, M. R. Badger and
D. Yellowlees (2002). Dinoflagellate symbioses: strategies and adaptations for
the acquisition and fixation of inorganic carbon. Functional Plant Biology 29:
309-322.
Leggat, W., T. Rees and D. Yellowlees (2000). Meeting the photosynthetic demand
for inorganic carbon in an alga–invertebrate association: preferential use of
CO2 by symbionts in the giant clam Tridacna gigas. Proceedings of the Royal
Society of London B: Biological Sciences 267: 523-529.
Leggat, W., F. Seneca, K. Wasmund, L. Ukani, D. Yellowlees and T. D. Ainsworth
(2011). Differential responses of the coral host and their algal symbiont to
thermal stress. Plos One 610.
Leggat, W., S. Whitney and D. Yellowlees (2004). Is coral bleaching due to the
instability of the zooxanthellae dark reactions? SYMBIOSIS-REHOVOT- 37:
137-154.
Leggat, W., D. Yellowlees and M. Medina (2011). Recent progress in Symbiodinium
transcriptomics. Journal of Experimental Marine Biology and Ecology 408:
120-125.
Lesser, M. and J. Shick (1989). Effects of irradiance and ultraviolet radiation on
photoadaptation in the zooxanthellae of Aiptasia pallida: primary production,
photoinhibition, and enzymic defenses against oxygen toxicity. Marine
Biology 102: 243-255.
Lesser, M. P. (1997). Oxidative stress causes coral bleaching during exposure to
elevated temperatures. Coral Reefs 16: 187-192.
Lesser, M. P. (2011). Coral bleaching: causes and mechanisms. Coral reefs: an
ecosystem in transition, Springer: 405-419.
Levin, R. A., V. H. Beltran, R. Hill, S. Kjelleberg, D. Mcdougald, P. D. Steinberg and
M. J. Van Oppen (2016). Sex, scavengers, and chaperones: Transcriptome
secrets of divergent Symbiodinium thermal tolerances. Molecular Biology and
Evolution 33: 2201-2215.
Lidie, K., J. Ryan, M. Barbier and F. Dolah (2005). Gene expression in Florida red
tide Dinoflagellate Karenia brevis: Analysis of an expressed sequence tag
library and development of DNA microarray. Marine Biotechnology 75: 481-
493.
Lien, Y.-T., H. Fukami and Y. Yamashita (2012). Symbiodinium clade C dominates
zooxanthellate corals (Scleractinia) in the temperate region of Japan.
Zoological science 29: 173-180.
Liljas, A. and M. Laurberg (2000). A wheel invented three times. EMBO reports 11:
16-17.
Lilley, R., P. J. Ralph and A. W. Larkum (2010). The determination of activity of the
enzyme Rubisco in cell extracts of the dinoflagellate alga Symbiodinium sp. by
manganese chemiluminescence and its response to short term thermal stress
of the alga. Plant, Cell & Environment 33: 995-1004.
Lin, S. (2011). Genomic understanding of dinoflagellates. Research in Microbiology
162: 551-569.
Lin, S., S. Cheng, B. Song, X. Zhong, X. Lin, W. Li, L. Li, Y. Zhang, H. Zhang, Z. Ji,
M. Cai, Y. Zhuang, X. Shi, L. Lin, L. Wang, Z. Wang, X. Liu, S. Yu, P. Zeng,
H. Hao, Q. Zou, C. Chen, Y. Li, Y. Wang, C. Xu, S. Meng, X. Xu, J. Wang, H.
Yang, D. A. Campbell, N. R. Sturm, S. Dagenais-Bellefeuille and D. Morse
(2015). The Symbiodinium kawagutii genome illuminates dinoflagellate gene
expression and coral symbiosis. Science 350: 691-694.
Ludwig, M. (2012). Carbonic anhydrase and the molecular evolution of C4
photosynthesis. Plant, Cell & Environment 35: 22-37.
Ma, Y., S. V. Pollock, Y. Xiao, K. Cunnusamy and J. V. Moroney (2011).
Identification of a novel gene, CIA6, required for normal pyrenoid formation
in Chlamydomonas reinhardtii. Plant Physiology 156: 884-896.
Macintyre, H. L., T. M. Kana, T. Anning and R. J. Geider (2002). Photoacclimation of
photosynthesis irradiance response curves and photosynthetic pigments in
microalgae and cyanobacteria. Journal of Phycology 38: 17-38.
Marek, L. F. and M. H. Spalding (1991). Changes in photorespiratory enzyme activity
in response to limiting CO2 in Chlamydomonas reinhardtii. Plant Physiology
97: 420-425.
Mariscal, V., J. Rexach, E. Fernández and A. Galván (2004). The plastidic nitrite
transporter NAR1;1 improves nitrate use efficiency for growth in
Chlamydomonas. Plant, Cell & Environment 27: 1321-1328.

Martinoia, E., E. Grill, R. Tommasini, K. Kreuz and N. Amrhein (1993). ATP-
dependent glutathione S-conjugate 'export' pump in the vacuolar membrane of
plants. Nature 364: 247-249.
Mass, T., S. Einbinder, E. Brokovich, N. Shashar, R. Vago, J. Erez and Z. Dubinsky
(2007). Photoacclimation of Stylophora pistillata to light extremes:
metabolism and calcification. Marine Ecology Progress Series 334: 93-102.
Matsuda, Y. and B. Colman (1995). Induction of CO2 and bicarbonate transport in the
green alga Chlorella ellipsoidea (I. Time Course of Induction of the Two
Systems). Plant Physiology 108: 247-252.
Matsuda, Y., T. Hara and B. Colman (2001). Regulation of the induction of
bicarbonate uptake by dissolved CO2 in the marine diatom, Phaeodactylum
tricornutum. Plant, Cell & Environment 24: 611-620.
Maxwell, D. P., D. E. Laudenbach and N. P. Huner (1995). Redox regulation of light-
harvesting complex II and cab mRNA abundance in Dunaliella salina. Plant
Physiology 109: 787-795.
Mayfield, A. B., P.-H. Chan, H. M. Putnam, C.-S. Chen and T.-Y. Fan (2012). The
effects of a variable temperature regime on the physiology of the reef-building
coral Seriatopora hystrix: results from a laboratory-based reciprocal transplant.
The Journal of Experimental Biology 215: 4183-4195.
Mayo, W. P., T. G. Williams, D. G. Birch and D. H. Turpin (1986). Photosynthetic
adaptation by Synechococcus leopoliensis in response to exogenous dissolved
inorganic carbon. Plant Physiology 80: 1038-1040.
McBride, B. B., G. Muller Parker and H. H. Jakobsen (2009). Low thermal limit of
growth rate of Symbiodinium californium (Dinophyta) in culture may restrict
the symbiont to southern populations of its host anemones (Anthopleura spp.;
Anthozoa, Cnidaria). Journal of Phycology 45: 855-863.
McGinty, E. S., J. Pieczonka and L. D. Mydlarz (2012). Variations in reactive oxygen
release and antioxidant activity in multiple Symbiodinium types in response to
elevated temperature. Microbial ecology 64: 1000-1007.
Meldrum, N. U. and F. J. W. Roughton (1933). Carbonic anhydrase. Its preparation
and properties. The Journal of physiology 80: 113-142.
Merrett, M., N. Nimer and L. Dong (1996). The utilization of bicarbonate ions by the
marine microalga Nannochloropsis oculata (Droop) Hibberd. Plant, Cell &
Environment 19: 478-484.
Meyer, E., G. Aglyamova and M. Matz (2011). Profiling gene expression responses of
coral larvae (Acropora millepora) to elevated temperature and settlement
inducers using a novel RNA Seq procedure. Molecular ecology 20: 3599-
3616.
Meyer, M. T., T. Genkov, J. N. Skepper, J. Jouhet, M. C. Mitchell, R. J. Spreitzer and
H. Griffiths (2012). Rubisco small-subunit α-helices control pyrenoid
formation in Chlamydomonas. Proceedings of the National Academy of
Sciences 109: 19474-19479.
Mihailovich, M., C. Militti, T. Gabaldon and F. Gebauer (2010). Eukaryotic cold
shock domain proteins: highly versatile regulators of gene expression.
BioEssays 32: 109-118.
Mitchell, P. (1961). Coupling of phosphorylation to electron and hydrogen transfer by
a chemi-osmotic type of mechanism. Nature 191: 144-148.
Mitra, M., S. Lato, R. Ynalvez, Y. Xiao and J. Moroney (2004). Identification of a
new chloroplast carbonic anhydrase in Chlamydomonas reinhardtii. Plant
Physiology 135: 173 - 182.
Mitra, M., C. B. Mason, Y. Xiao, R. A. Ynalvez, S. M. Lato and J. V. Moroney
(2005). The carbonic anhydrase gene families of Chlamydomonas reinhardtii.
Canadian Journal of Botany 83: 780-795.
Mitsuhashi, S. and S. Miyachi (1996). Amino acid sequence homology between N-
and C-terminal halves of a carbonic anhydrase in Porphyridium purpureum, as
deduced from the cloned cDNA. Journal of Biological Chemistry 271: 28703-
28709.
Moore, R. B., K. M. Ferguson, W. K. Loh, O. Hoegh-Guldberg and D. A. Carter
(2003). Highly organized structure in the non-coding region of the psbA
minicircle from clade C Symbiodinium. International Journal of Systematic and
Evolutionary Microbiology 53: 1725-1734.
Morey, J. S. and F. M. Van Dolah (2013). Global analysis of mRNA half-lives and de
novo transcription in a dinoflagellate, Karenia brevis. Plos One 8: e66347.
Morgan, D. O. (2007). The cell cycle: principles of control, New Science Press.
Moroney, J., Y. Ma, W. Frey, K. Fusilier, T. Pham, T. Simms, R. Dimario, J. Yang
and B. Mukherjee (2011). The carbonic anhydrase isoforms of
Chlamydomonas reinhardtii: intracellular location, expression, and
physiological roles. Photosynthesis Research 109: 133-149.
Moroney, J. V., S. G. Bartlett and G. Samuelsson (2001). Carbonic anhydrases in
plants and algae. Plant, Cell & Environment 24: 141-153.
Moroney, J. V., R. K. Togasaki, H. D. Husic and N. Tolbert (1987). Evidence that an
internal carbonic anhydrase is present in 5% CO2-grown and air-grown
Chlamydomonas. Plant Physiology 84: 757-761.
Moroney, J. V. and R. A. Ynalvez (2007). Proposed carbon dioxide concentrating
mechanism in Chlamydomonas reinhardtii. Eukaryotic Cell 6: 1251-1259.
Morse, D., P. M. Milos, E. Roux and J. W. Hastings (1989). Circadian regulation of
bioluminescence in Gonyaulax involves translational control. Proceedings of
the National Academy of Sciences 86: 172-176.
Morse, D., P. Salois, P. Markovic and J. W. Hastings (1995). A nuclear-encoded
Form-II rubisco in Dinoflagellates. Science 268: 1622-1624.
Moustafa, A., A. N. Evans, D. M. Kulis, J. D. Hackett, D. L. Erdner, D. M. Anderson
and D. Bhattacharya (2010). Transcriptome profiling of a toxic Dinoflagellate
reveals a gene-rich protist and a potential impact on gene expression due to
bacterial presence. Plos One 5: e9688.
Moya, A., L. Huisman, E. E. Ball, D. C. Hayward, L. C. Grasso, C. M. Chua, H. N.
Woo, J. P. Gattuso, S. Foret and D. J. Miller (2012). Whole transcriptome
analysis of the coral Acropora millepora reveals complex responses to CO(2)-
driven acidification during the initiation of calcification. Mol Ecol 21: 2440-
2454.
Müller, P., X.-P. Li and K. K. Niyogi (2001). Non-photochemical quenching. A
response to excess light energy. Plant Physiology 125: 1558-1566.
Muller Parker, G., K. W. Lee and C. B. Cook (1996). Changes in the ultrastructure
of symbiotic zooxanthellae (Symbiodinium sp., Dinophyceae) in fed and
starved sea anemones maintained under high and low light. Journal of
Phycology 32: 987-994.

Murchie, E., S. Hubbart, S. Peng and P. Horton (2005). Acclimation of photosynthesis
to high irradiance in rice: gene expression and interactions with leaf
development. Journal of Experimental Botany 56: 449-460.
Muscatine, L. (1990). The role of symbiotic algae in carbon and energy flux in corals.
Ecosystems of the world. Coral Reefs 25: 75-84.
Muscatine, L., P. Falkowski, Z. Dubinsky, P. Cook and L. Mccloskey (1989). The
effect of external nutrient resources on the population dynamics of
zooxanthellae in a reef coral. Proceedings of the Royal Society of London B:
Biological Sciences 236: 311-324.
Muscatine, L. and J. W. Porter (1977). Reef corals: mutualistic symbioses adapted to
nutrient-poor environments. Bioscience 27: 454-460.
Muscatine, L., L. R Mccloskey and R. E Marian (1981). Estimating the daily
contribution of carbon from zooxanthellae to coral animal respiration.
Limnology and Oceanography 26: 601-611.
Nanba, O. and K. Satoh (1987). Isolation of a photosystem II reaction center
consisting of D-1 and D-2 polypeptides and cytochrome b-559. Proceedings of
the National Academy of Sciences 84: 109-112.
Nash, E., A. Barbrook, R. Edwards-Stuart, K. Bernhardt, C. Howe and R. Nisbet
(2007). Organisation of the mitochondrial genome in the dinoflagellate
Amphidinium carterae. Molecular Biology and Evolution 24: 1528 - 1536.
Nassoury, N., M. Cappadocia and D. Morse (2003). Plastid ultrastructure defines the
protein import pathway in dinoflagellates. Journal of Cell Science 116: 2867-
2874.
Nassoury, N., L. Fritz and D. Morse (2001). Circadian changes in ribulose-1, 5-
bisphosphate carboxylase/oxygenase distribution inside individual chloroplasts
can account for the rhythm in dinoflagellate carbon fixation. The Plant Cell 13:
923-934.
Newman, E. A. (1994). A physiological measure of carbonic anhydrase in Müller
cells. Glia 11: 291-299.
Nielsen, H., J. Engelbrecht, S. Brunak and G. Von Heijne (1997). Identification of
prokaryotic and eukaryotic signal peptides and prediction of their cleavage
sites. Protein engineering 10: 1-6.
Nigg, E. A. (2001). Mitotic kinases as regulators of cell division and its checkpoints.
Nature reviews. Molecular cell biology 2: 21.

Nisbet, R. E. R., R. G. Hiller, E. R. Barry, P. Skene, A. C. Barbrook and C. J. Howe
(2008). Transcript analysis of dinoflagellate plastid gene minicircles. Protist
159: 31-39.
Niyogi, K. K. (1999). Photoprotection revisited: Genetic and molecular approaches.
Annual Review of Plant Physiology and Plant Molecular Biology 50: 333-359.
Norman, E. G. and B. Colman (1991). Purification and characterization of
phosphoglycolate phosphatase from the Cyanobacterium Coccochloris
peniocystis. Plant Physiology 95: 693-698.
Norman, J. and M. Gray (2001). A complex organization of the gene encoding
cytochrome oxidase subunit 1 in the mitochondrial genome of the
dinoflagellate, Crypthecodinium cohnii: homologous recombination generates
two different cox1 open reading frames. Journal of Molecular Evolution 53:
351 - 363.
Norris, B. and D. Miller (1994). Nucleotide sequence of a cDNA clone encoding the
precursor of the peridinin-chlorophyll a-binding protein from the dinoflagellate
Symbiodinium sp. Plant Molecular Biology 24: 673-677.
Oakley, C. A., G. W. Schmidt and B. M. Hopkinson (2014). Thermal responses of
Symbiodinium photosynthetic carbon assimilation. Coral Reefs 33: 501-512.
Ogawa, D., T. Bobeszko, T. Ainsworth and W. Leggat (2013). The combined effects
of temperature and CO2 lead to altered gene expression in Acropora aspera.
Coral Reefs 32: 895-907.
Okamoto, O. K. and J. Hastings (2003). Novel dinoflagellate clock related genes
identified through microarray analysis. Journal of Phycology 39: 519-526.
Okamoto, O. K. and J. W. Hastings (2003). Genome-wide analysis of redox-regulated
genes in a dinoflagellate. Gene 321: 73-81.
Osmond, C. (1981). Photorespiration and photoinhibition: some implications for the
energetics of photosynthesis. Biochimica et Biophysica Acta (BBA)-Reviews
on Bioenergetics 639: 77-98.
Park, H., B. Song and F. M. Morel (2007). Diversity of the cadmium containing
carbonic anhydrase in marine diatoms and natural waters. Environmental
microbiology 9: 403-413.
Patron, N., R. Waller, J. Archibald and P. Keeling (2005). Complex protein targeting
to dinoflagellate plastids. Journal of Molecular Biology 348: 1015 - 1024.

Pawlowski, J., M. Holzmann, J. F. Fahrni, X. Pochon and J. J. Lee (2001). Molecular
identification of algal endosymbionts in large miliolid foraminifera: 2.
Dinoflagellates. Journal of Eukaryotic Microbiology 48: 368-373.
Peng, H., D. Wei, G. Chen and F. Chen (2016). Transcriptome analysis reveals global
regulation in response to CO2 supplementation in oleaginous microalga
Coccomyxa subellipsoidea C-169. Biotechnology for Biofuels 9: 151.
Pfannschmidt, T., J. F. Allen and R. Oelmüller (2001). Principles of redox control in
photosynthesis gene expression. Physiologia Plantarum 112: 1-9.
Pfannschmidt, T., K. Bräutigam, R. Wagner, L. Dietzel, Y. Schröter, S. Steiner and A.
Nykytenko (2008). Potential regulation of gene expression in photosynthetic
cells by redox and energy state: approaches towards better understanding.
Annals of Botany 103: 599-607.
Pfannschmidt, T., A. Nilsson and J. F. Allen (1999). Photosynthetic control of
chloroplast gene expression. Nature 397: 625.
Phadtare, S. (2004). Recent developments in bacterial cold-shock response. Current
Issues in Molecular biology 6: 125-136.
Pilkis, S. J. and D. Granner (1992). Molecular physiology of the regulation of hepatic
gluconeogenesis and glycolysis. Annual review of physiology 54: 885-909.
Pochon, X. and R. D. Gates (2010). A new Symbiodinium clade (Dinophyceae) from
soritid foraminifera in Hawaii. Molecular Phylogenetics and Evolution 56:
492-497.
Pocker, Y. and J. S. Ng (1973). Plant carbonic anhydrase. Properties and carbon
dioxide hydration kinetics. Biochemistry 12: 5127-5134.
Polato, N. R., C. R. Voolstra, J. Schnetzer, M. K. Desalvo, C. J. Randall, A. M.
Szmant, M. Medina and I. B. Baums (2010). Location-specific responses to
thermal stress in larvae of the reef-building coral Montastraea faveolata. Plos
One 5: 11221.
Porter, J., L. Muscatine, Z. Dubinsky and P. Falkowski (1984). Primary production
and photoadaptation in light-and shade-adapted colonies of the symbiotic
coral, Stylophora pistillata. Proceedings of the Royal Society of London B:
Biological Sciences 222: 161-180.
Price, G. D. and M. R. Badger (1989). Expression of human carbonic anhydrase in the
Cyanobacterium Synechococcus PCC7942 creates a high CO2-requiring

phenotype : Evidence for a central role for carboxysomes in the CO2
concentrating mechanism. Plant Physiology 91: 505-513.
Price, G. D., S. Von Caemmerer, J. R. Evans, J.-W. Yu, J. Lloyd, V. Oja, P. Kell, K.
Harrison, A. Gallagher and M. R. Badger (1994). Specific reduction of
chloroplast carbonic anhydrase activity by antisense RNA in transgenic
tobacco plants has a minor effect on photosynthetic CO2 assimilation. Planta
193: 331-340.
Raines, C., P. Horsnell, C. Holder and J. Lloyd (1992). Arabidopsis thaliana carbonic
anhydrase: cDNA sequence and effect of CO2 on mRNA levels. Plant
Molecular Biology 20: 1143-1148.
Ratti, S., M. Giordano and D. Morse (2007). CO2 concentrating mechanisms of the
potentially toxic dinoflagellate Protoceratium reticulatum (Dinophyceae,
Gonyaulacales). Journal of Phycology 43: 693-701.
Raven, J. (1991). Physiology of inorganic C acquisition and implications for resource
use efficiency by marine phytoplankton: relation to increased CO2 and
temperature. Plant, Cell & Environment 14: 779-794.
Rawat, M. and J. Moroney (1991). Partial characterization of a new isoenzyme of
carbonic anhydrase isolated from Chlamydomonas reinhardtii. Journal of
Biological Chemistry 266: 9719-9723.
Rawat, M. and J. Moroney, V (1995). The regulation of carbonic anhydrase and
ribulose-1,5-bisphosphate carboxylase/oxygenase activase by light and CO2 in
Chlamydomonas reinhardtii. Plant Physiology 109: 937-944.
Rees, D. C., E. Johnson and O. Lewinson (2009). ABC transporters: the power to
change. Nature reviews. Molecular cell biology 10: 218.
Reichman, J. R., T. P. Wilcox and P. D. Vize (2003). PCP gene family in
Symbiodinium from Hippopus hippopus: Low levels of concerted evolution,
isoform diversity, and spectral tuning of chromophores. Molecular Biology
and Evolution 20: 2143-2154.
Reungprapavut, S., S. R. Krungkrai and J. Krungkrai (2004). Plasmodium falciparum
carbonic anhydrase is a possible target for malaria chemotherapy. Journal of
enzyme inhibition and medicinal chemistry 19: 249-256.

Richard, C., H. Ouellet and M. Guertin (2000). Characterization of the LI818
polypeptide from the green unicellular alga Chlamydomonas reinhardtii. Plant
Molecular Biology 42: 303-316.
Riebesell, U. (2004). Effects of CO2 enrichment on marine phytoplankton. Journal of
Oceanography 60: 719-729.
Riebesell, U., D. Wolf-Gladrow and V. Smetacek (1993). Carbon dioxide limitation of
marine phytoplankton growth rates. Nature 361: 249-251.
Riebesell, U., I. Zondervan, B. Rost, P. D. Tortell, R. E. Zeebe and F. M. Morel
(2000). Reduced calcification of marine plankton in response to increased
atmospheric CO2. Nature 407: 364-367.
Roberts, K., E. Granum, R. C. Leegood and J. A. Raven (2007). C3 and C4 pathways
of photosynthetic carbon assimilation in marine diatoms are under genetic, not
environmental, control. Plant Physiology 145: 230-235.
Roberts, S. B., T. W. Lane and F. M. M. Morel (1997). Carbonic anhydrase Iin the
marine diatom Thalassiosira weissflogii (Bacillariophyceae)1. Journal of
Phycology 33: 845-850.
Robison, J. D. and M. E. Warner (2006). Differential impacts of photoacclimation and
thermal stress on the photobiology of four different phylotypes of
Symbiodinium (Pyrrhophyta). Journal of Phycology 42: 568-579.
Rosic, N., M. Pernice, M. Rodriguez-Lanetty and O. Hoegh-Guldberg (2011).
Validation of housekeeping genes for gene expression studies in Symbiodinium
exposed to thermal and light stress. Marine Biotechnology 13: 355-365.
Rosic, N. N., M. Pernice, S. Dunn, S. Dove and O. Hoegh-Guldberg (2010).
Differential regulation by heat stress of novel cytochrome P450 genes from the
dinoflagellate symbionts of reef-building corals. Applied and Environmental
Microbiology 76: 2823-2829.
Rost, B., K.-U. Richter, U. L. F. Riebesell and P. J. Hansen (2006). Inorganic carbon
acquisition in red tide dinoflagellates. Plant, Cell & Environment 29: 810-822.
Rost, B., I. Zondervan and D. Wolf-Gladrow (2008). Sensitivity of phytoplankton to
future changes in ocean carbonate chemistry: current knowledge,
contradictions and research directions. Marine Ecology Progress Series 373:
227-238.
Rost, B. R., U. Riebesell, S. Burkhardt and D. S ltemeyer (2003). Carbon acquisition
of bloom-forming marine phytoplankton. Limnology and Oceanography 48:
55-67.
Roth, C. W., I. Holm, M. Graille, P. Dehoux, A. Rzhetsky, P. Wincker, J.
Weissenbach and P. T. Brey (2003). Identification of the Anopheles gambiae
ATP-binding cassette transporter superfamily genes. Molecules and cells 15:
150-158.
Rowan, R. (1998). Diversity and ecology of zooxanthellae on coral reefs. Journal of
Phycology 34: 407-417.
Rowan, R. (2004). Coral bleaching: thermal adaptation in reef coral symbionts. Nature
430: 742-742.
Rowan, R., S. M. Whitney, A. Fowler and D. Yellowlees (1996). Rubisco in marine
symbiotic dinoflagellates: Form II enzymes in eukaryotic oxygenic
phototrophs encoded by a nuclear multigene family. Plant Cell 8: 539-553.
Runcie, D. E., D. A. Garfield, C. C. Babbitt, J. A. Wygoda, S. Mukherjee and G. A.
Wray (2012). Genetics of gene expression responses to temperature stress in a
sea urchin gene network. Molecular ecology 21: 4547-4562.
Salvucci, M. E. and S. J. Crafts Brandner (2004). Inhibition of photosynthesis by
heat stress: the activation state of Rubisco as a limiting factor in
photosynthesis. Physiologia Plantarum 120: 179-186.
Santos, S. R., D. J. Taylor, R. A. Kinzie Iii, M. Hidaka, K. Sakai and M. A. Coffroth
(2002). Molecular phylogeny of symbiotic dinoflagellates inferred from partial
chloroplast large subunit (23S)-rDNA sequences. Molecular Phylogenetics and
Evolution 23: 97-111.
Satoh, D., Y. Hiraoka, B. Colman and Y. Matsuda (2001). Physiological and
molecular biological characterization of intracellular carbonic anhydrase from
the marine diatom Phaeodactylum tricornutum. Plant Physiology 126: 1459-
1470.
Savage, A., M. Goodson, S. Visram, H. Trapido-Rosenthal, J. Wiedenmann and A.
Douglas (2002). Molecular diversity of symbiotic algae at the latitudinal
margins of their distribution: dinoflagellates of the genus Symbiodinium in
corals and sea anemones. Marine Ecology Progress Series 244: 17-26.

Sawaya, M., G. Cannon, S. Heinhorst, S. Tanaka, E. Williams, T. Yeates and C.
Kerfeld (2006). The structure of beta-carbonic anhydrase from the
carboxysomal shell reveals a distinct subclass with one active site for the price
of two. Journal of Biological Chemistry 281: 7546 - 7555.
Sheps, J. A., S. Ralph, Z. Zhao, D. L. Baillie and V. Ling (2004). The ABC
transporter gene family of Caenorhabditis elegans has implications for the
evolutionary dynamics of multidrug resistance in eukaryotes. Genome biology
5: R15.
Shinopoulos, K. E. and G. W. Brudvig (2012). Cytochrome b 559 and cyclic electron
transfer within photosystem II. Biochimica et Biophysica Acta (BBA)-
Bioenergetics 1817: 66-75.
Shiraiwa, Y. and S. Miyachi (1985). Effects of temperature and CO2 concentration on
induction of carbonic anhydrase and changes in efficiency of photosynthesis in
Chlorella vulgaris 11h. Plant and Cell Physiology 26: 543-549.
Shoguchi, E., C. Shinzato, T. Kawashima, F. Gyoja, S. Mungpakdee, R. Koyanagi, T.
Takeuchi, K. Hisata, M. Tanaka, M. Fujiwara, M. Hamada, A. Seidi, M. Fujie,
T. Usami, H. Goto, S. Yamasaki, N. Arakaki, Y. Suzuki, S. Sugano, A.
Toyoda, Y. Kuroki, A. Fujiyama, M. Medina, Mary a. Coffroth, D.
Bhattacharya and N. Satoh (2013). Draft assembly of the Symbiodinium
minutum nuclear genome reveals dinoflagellate gene structure. Current
Biology 23: 1399-1408.
Silverman, D. N. (1991). The catalytic mechanism of carbonic anhydrase. Canadian
Journal of Botany 69: 1070-1078.
Silverstein, R. N., A. M. Correa, T. C. Lajeunesse and A. C. Baker (2011). Novel algal
symbiont (Symbiodinium spp.) diversity in reef corals of Western Australia.
Marine Ecology Progress Series 422: 63-75.
Smith, D. J., D. J. Suggett and N. R. Baker (2005). Is photoinhibition of zooxanthellae
photosynthesis the primary cause of thermal bleaching in corals? Global
Change Biology 11: 1-11.
Smith, G. and L. Muscatine (1999). Cell cycle of symbiotic dinoflagellates: variation
in G1 phase-duration with anemone nutritional status and macronutrient supply
in the Aiptasia pulchella–Symbiodinium pulchrorum symbiosis. Marine
Biology 134: 405-418.

Smith, K. S., N. J. Cosper, C. Stalhandske, R. A. Scott and J. G. Ferry (2000).
Structural and kinetic characterization of an archaeal β-Class carbonic
anhydrase. Journal of Bacteriology 182: 6605-6613.
Smith, K. S. and J. G. Ferry (1999). A plant-type (beta-class) carbonic anhydrase in
the thermophilic methanoarchaeon Methanobacterium thermoautotrophicum.
Journal of Bacteriology 181: 6247-6253.
Smith, K. S. and J. G. Ferry (2000). Prokaryotic carbonic anhydrases. Fems
Microbiology Reviews 24: 335-366.
Smith, K. S., C. Ingram-Smith and J. G. Ferry (2002). Roles of the conserved
aspartate and arginine in the catalytic mechanism of an Archaeal β-class
carbonic anhydrase. Journal of Bacteriology 184: 4240-4245.
Smith, K. S., C. Jakubzick, T. S. Whittam and J. G. Ferry (1999). Carbonic anhydrase
is an ancient enzyme widespread in prokaryotes. Proceedings of the National
Academy of Sciences of the United States of America 96: 15184-15189.
Soltes-Rak, E., M. E. Mulligan and J. R. Coleman (1997). Identification and
characterization of a gene encoding a vertebrate-type carbonic anhydrase in
cyanobacteria. Journal of Bacteriology 179: 769-774.
Somanchi, A., E. R. Handley and J. V. Moroney (1998). Chlamydomonas reinhardtii
cDNAs upregulated in low-CO2 conditions: expression and analyses. Canadian
Journal of Botany 76: 1003-1009.
Sørensen, J. G., T. N. Kristensen and V. Loeschcke (2003). The evolutionary and
ecological role of heat shock proteins. Ecology Letters 6: 1025-1037.
Soto, A. R., H. Zheng, D. Shoemaker, J. Rodriguez, B. A. Read and T. M. Wahlund
(2006). Identification and preliminary characterization of two cDNAs
encoding unique carbonic anhydrases from the marine alga Emiliania huxleyi.
Applied and environmental microbiology 72: 5500-5511.
Spalding, M. H. (2007). Microalgal carbon-dioxide-concentrating mechanisms:
Chlamydomonas inorganic carbon transporters. Journal of Experimental
Botany 59: 1463-1473.
Spalding, M. H., C. Critchley and W. L. Orgren (1984). Influence of carbon dioxide
concentration during growth on fluorescence induction characteristics of the
green alga Chlamydomonas reinhardii. Photosynthesis Research 5: 169-176.
Spalding, M. H. and W. L. Ogren (1982). Photosynthesis is required for induction of
the CO2-concentrating system in Chlamydomonas reinhardii. Febs Letters 145:
41-44.
Spalding, M. H., R. J. Spreitzer and W. L. Ogren (1983). Reduced inorganic carbon
transport in a CO2-requiring mutant of Chlamydomonas reinhardii. Plant
Physiology 73: 273-276.
Spencer, K. G., D. L. Kimpel, M. L. Fisher, R. K. Togasaki and S. Miyachi (1983).
Carbonic anhydrase in Chlamydomonas reinhardtii II. Requirements for
carbonic anhydrase induction. Plant and Cell Physiology 24: 301-304.
Stat, M., D. Carter and O. Hoegh-Guldberg (2006). The evolutionary history of
Symbiodinium and scleractinian hosts—symbiosis, diversity, and the effect of
climate change. Perspectives in Plant Ecology, Evolution and Systematics 8:
23-43.
Strop, P., K. S. Smith, T. M. Iverson, J. G. Ferry and D. C. Rees (2001). Crystal
structure of the ‚"cab"-type β-Class carbonic anhydrase from the Archaeon
Methanobacterium thermoautotrophicum. Journal of Biological Chemistry
276: 10299-10305.
Sültemeyer, D. F., A. G. Miller, G. S. Espie, H. P. Fock and D. T. Canvin (1989).
Active CO2 Transport by the green alga Chlamydomonas reinhardtii. Plant
Physiology 89: 1213-1219.
Sun, Z., Y. F. Chen and J. Du (2016). Elevated CO2 improves lipid accumulation by
increasing carbon metabolism in Chlorella sorokiniana. Plant Biotechnology
Journal 14: 557-566.
Sunderhaus, S., N. V. Dudkina, L. Jänsch, J. Klodmann, J. Heinemeyer, M. Perales, E.
Zabaleta, E. J. Boekema and H.-P. Braun (2006). Carbonic anhydrase subunits
form a matrix-exposed domain attached to the membrane arm of mitochondrial
complex I in plants. Journal of Biological Chemistry 281: 6482-6488.
Supuran, C. T. (2016). Structure and function of carbonic anhydrases. Biochemical
Journal 473: 2023-2032.
Suzuki, J. Y., D. W. Bollivar and C. E. Bauer (1997). Genetic analysis of chlorophyll
biosynthesis. Annual Review of Genetics 31: 61-89.
Syrjänen, L., M. Tolvanen, M. Hilvo, A. Olatubosun, A. Innocenti, A. Scozzafava, J.
Leppiniemi, B. Niederhauser, V. P. Hytönen and T. A. Gorr (2010).
Characterization of the first beta-class carbonic anhydrase from an arthropod
(Drosophila melanogaster) and phylogenetic analysis of beta-class carbonic
anhydrases in invertebrates. BMC biochemistry 11: 28.
Takahashi, S., S. Whitney, S. Itoh, T. Maruyama and M. Badger (2008). Heat stress
causes inhibition of the de novo synthesis of antenna proteins and
photobleaching in cultured Symbiodinium. Proceedings of the National
Academy of Sciences 105: 4203-4208.
Tamura, K., D. Peterson, N. Peterson, G. Stecher, M. Nei and S. Kumar (2011).
MEGA5: molecular evolutionary genetics analysis using maximum likelihood,
evolutionary distance, and maximum parsimony methods. Molecular Biology
and Evolution 28: 2731-2739.
Tashian, R. E. (1992). Genetics of the mammalian carbonic anhydrases. Advances in
genetics 30: 321-356.
Taylor, F. and U. Pollingher (1987). Ecology of dinoflagellates In: Taylor FJR (ed)
The Biology of Dinoflagellates. Blackwell Scientific Publications, Oxford 407:
429.
Tchernov, D., M. Y. Gorbunov, C. De Vargas, S. N. Yadav, A. J. Milligan, M.
Häggblom and P. G. Falkowski (2004). Membrane lipids of symbiotic algae
are diagnostic of sensitivity to thermal bleaching in corals. Proceedings of the
National Academy of Sciences of the United States of America 101: 13531-
13535.
Thornhill, D. J., T. C. Lajeunesse, D. W. Kemp, W. K. Fitt and G. W. Schmidt (2006).
Multi-year, seasonal genotypic surveys of coral-algal symbioses reveal
prevalent stability or post-bleaching reversion. Marine Biology 148: 711-722.
Tirumani, S., M. Kokkanti, V. Chaudhari, M. Shukla and B. J. Rao (2014). Regulation
of CCM genes in Chlamydomonas reinhardtii during conditions of light–dark
cycles in synchronous cultures. Plant Molecular Biology 85: 277-286.
Titlyanov, E., T. Titlyanova, K. Yamazato and R. Van Woesik (2001). Photo-
acclimation dynamics of the coral Stylophora pistillata to low and extremely
low light. Journal of Experimental Marine Biology and Ecology 263: 211-225.
Tonk, L., E. M. Sampayo, T. C. Lajeunesse, V. Schrameyer and O. Hoegh Guldberg
(2014). Symbiodinium (Dinophyceae) diversity in reef invertebrates along an
offshore to inshore reef gradient near Lizard Island, Great Barrier Reef.
Journal of Phycology 50: 552-563.
Tortell, P. D. (2000). Evolutionary and ecological perspectives on carbon acquisition
in phytoplankton. Limnology and Oceanography 45: 744-750.
Tsuzuki, M. and S. Miyachi (1989). The function of carbonic anhydrase in aquatic
photosynthesis. Aquatic botany 34: 85-104.
Tytler, E. M. and R. K. Trench (1986). Activities of enzymes in beta-carboxylation
reactions and of catalase in cell-free preparations from the symbiotic
Dinoflagellates Symbiodinium Spp. from a coral, a clam, a zoanthid and two
sea anemones. Proceedings of the Royal Society of London. Series B,
Biological Sciences 228: 483-492.
Van De Waal, D. B., U. John, P. Ziveri, G.-J. Reichart, M. Hoins, A. Sluijs and B. R.
Rost (2013). Ocean acidification reduces growth and calcification in a marine
dinoflagellate. Plos One 8: 65987.
Van Dolah, F. M., K. B. Lidie, J. S. Morey, S. A. Brunelle, J. C. Ryan, E. A. Monroe
and B. L. Haynes (2007). Microarray analysis of diurnal and circadian
regulated genes in the Florida red tide dinoflagellate Karenia brevis
(dinophyceae). Journal of Phycology 43: 741-752.
Van Oppen, M. J., J. K. Oliver, H. M. Putnam and R. D. Gates (2015). Building coral
reef resilience through assisted evolution. Proceedings of National Acadamy of
Science 112: 2307-2313.
Veldhuis, M. J. W., T. L. Cucci and M. E. Sieracki (1997). Cellular DNA content of
marine phytoplankton using two new fluorochromes: Taxonomic and
ecological implications1. Journal of Phycology 33: 527-541.
Villand, P., M. Eriksson and G. Samuelsson (1997). Carbon dioxide and light
regulation of promoters controlling the expression of mitochondrial carbonic
anhydrase in Chlamydomonas reinhardtii. Biochemical Journal 327: 51-57.
Von Wettstein, D., S. Gough and C. G. Kannangara (1995). Chlorophyll biosynthesis.
The Plant Cell 7: 1039-1057.
Voolstra, C. R., S. Sunagawa, J. A. Schwarz, M. A. Coffroth, D. Yellowlees, W.
Leggat and M. Medina (2009). Evolutionary analysis of orthologous cDNA
sequences from cultured and symbiotic dinoflagellate symbionts of reef-
building corals (Dinophyceae: Symbiodinium). Comparative Biochemistry and
Physiology Part D: Genomics and Proteomics 4: 67-74.
Vullo, D., J. Voipio, A. Innocenti, C. Rivera, H. Ranki, A. Scozzafava, K. Kaila and
C. T. Supuran (2005). Carbonic anhydrase inhibitors. Inhibition of the human
cytosolic isozyme VII with aromatic and heterocyclic sulfonamides.
Bioorganic and Medicinal Chemistry Letters 15: 971-976.
Wakabayashi, K. I., T. Ide and R. Kamiya (2009). Calcium dependent flagellar
motility activation in Chlamydomonas reinhardtii in response to mechanical
agitation. Cytoskeleton 66: 736-742.
Waller, R. F. and C. J. Jackson (2009). Dinoflagellate mitochondrial genomes:
stretching the rules of molecular biology. BioEssays 31: 237-245.
Walters, R. G. (2005). Towards an understanding of photosynthetic acclimation.
Journal of Experimental Botany 411: 435-447.
Wang, L.-H., Y.-H. Liu, Y.-M. Ju, Y.-Y. Hsiao, L.-S. Fang and C.-S. Chen (2008).
Cell cycle propagation is driven by light–dark stimulation in a cultured
symbiotic dinoflagellate isolated from corals. Coral Reefs 27: 823.
Wang, Y., D. Duanmu and M. H. Spalding (2011). Carbon dioxide concentrating
mechanism in Chlamydomonas reinhardtii: inorganic carbon transport and
CO2 recapture. Photosynthesis Research 109: 115-122.
Warner, M., W. Fitt and G. Schmidt (1996). The effects of elevated temperature on
the photosynthetic efficiency of zooxanthellae in hospite from four different
species of reef coral: a novel approach. Plant, Cell & Environment 19: 291-
299.
Warner, M. E., W. K. Fitt and G. W. Schmidt (1999). Damage to photosystem II in
symbiotic dinoflagellates: a determinant of coral bleaching. Proceedings of the
National Academy of Sciences 96: 8007-8012.
Warner, M. E., T. C. Lajeunesse, J. D. Robison and R. M. Thur (2006). The ecological
distribution and comparative photobiology of symbiotic dinoflagellates from
reef corals in Belize: potential implications for coral bleaching. Limnology and
Oceanography 51: 1887-1897.
Waterhouse, A. M., Procter, J.B., Martin, D.M.A, Clamp, M. And Barton, G. J.
(2009). Jalview Version 2—A multiple sequence alignment editor and analysis
workbench. Bioinformatics 25: 1189-1191.
Whitney, S. M. and T. J. Andrews (1998). The CO2/O2 specificity of single-subunit
ribulose-bisphosphate carboxylase from the dinoflagellate, Amphidinium
carterae. Functional Plant Biology 25: 131-138.
Whitney, S. M., D. C. Shaw and D. Yellowlees (1995). Evidence that some
dinoflagellates contain a ribulose-1, 5-bisphosphate carboxylase/oxygenase
related to that of the alpha-proteobacteria. Proceedings of the Royal Society of
London B: Biological Sciences 259: 271-275.
Wisecaver, J. H. and J. D. Hackett (2011). Dinoflagellate genome evolution. Annual
Review of Microbiology 65: 369-387.
Wolf-Gladrow, D. A., U. L. F. Riebesell, S. Burkhardt and J. Bijma (1999). Direct
effects of CO2 concentration on growth and isotopic composition of marine
plankton. Tellus B 51: 461-476.
Wolfe, K. H., C. W. Morden and J. D. Palmer (1992). Function and evolution of a
minimal plastid genome from a nonphotosynthetic parasitic plant. Proceedings
of the National Academy of Sciences 89: 10648-10652.
Wong, J. C., P. Thompson, J. Y. Xie, J.-W. Qiu and D. M. Baker (2016).
Symbiodinium clade C generality among common scleractinian corals in
subtropical Hong Kong. Regional Studies in Marine Science 8: 439-444.
Woodger, F. J., M. R. Badger and G. D. Price (2005). Sensing of inorganic carbon
limitation in Synechococcus PCC7942 is correlated with the size of the internal
inorganic carbon pool and involves oxygen. Plant Physiology 139: 1959-1969.
Wooldridge, S. A. (2009). A new conceptual model for the warm-water breakdown of
the coral–algae endosymbiosis. Marine and Freshwater Research 60: 483-496.
Wu, S., A. Huang, B. Zhang, L. Huan, P. Zhao, A. Lin and G. Wang (2015). Enzyme
activity highlights the importance of the oxidative pentose phosphate pathway
in lipid accumulation and growth of Phaeodactylum tricornutum under CO2
concentration. Biotechnology for Biofuels 8: 78.
Xiang, T., W. Nelson, J. Rodriguez, D. Tolleter and A. R. Grossman (2015).
Symbiodinium transcriptome and global responses of cells to immediate
changes in light intensity when grown under autotrophic or mixotrophic
conditions. Plant Journal 82: 67-80.
Xiao, L., B. Lian, C. Dong and F. Liu (2016). The selective expression of carbonic
anhydrase genes of Aspergillus nidulans in response to changes in mineral
nutrition and CO2 concentration. Microbiology Open 5: 60-69.
Xiong, J., J. Feng, D. Yuan, J. Zhou and W. Miao (2015). Tracing the structural
evolution of eukaryotic ATP binding cassette transporter superfamily.
Scientific Reports 5: 16724.
Xu, H. H. and F. R. Tabita (1996). Ribulose-1, 5-bisphosphate carboxylase/oxygenase
gene expression and diversity of Lake Erie planktonic microorganisms.
Applied and Environmental Microbiology 62: 1913-1921.
Xu, Y., L. Feng, P. Jeffrey, Y. Shi and F. Morel (2008). Structure and metal exchange
in the cadmium carbonic anhydrase of marine diatoms. Nature 452: 56 - 61.
Yamano, T. and H. Fukuzawa (2009). Carbon concentrating mechanism in a green
alga, Chlamydomonas reinhardtii, revealed by transcriptome analyses. Journal
of basic microbiology 49: 42-51.
Yamano, T., K. Miura and H. Fukuzawa (2008). Expression analysis of genes
associated with the induction of the carbon-concentrating mechanism in
Chlamydomonas reinhardtii. Plant Physiology 147: 340-354.
Yellowlees, D., M. L. Dionisio-Sese, K. Masuda, T. Maruyama, T. Abe, B. Baillie, M.
Tsuzuki and S. Miyachi (1993). Role of carbonic anhydrase in the supply of
inorganic carbon to the giant clam-zooxanthellate symbiosis. Marine Biology
115: 605-611.
Ynalvez, R. A., Y. Xiao, A. S. Ward, K. Cunnusamy and J. V. Moroney (2008).
Identification and characterization of two closely related β-carbonic
anhydrases from Chlamydomonas reinhardtii. Physiologia Plantarum 133: 15-
26.
Yoon, H. S., J. D. Hackett, F. M. Van Dolah, T. Nosenko, L. Lidie and D.
Bhattacharya (2005). Tertiary endosymbiosis driven genome evolution in
dinoflagellate algae. Molecular Biology and Evolution 22: 1299-1308.
Zabaleta, E., M. V. Martin and H.-P. Braun (2012). A basal carbon concentrating
mechanism in plants. Plant Science 187: 97-104.
Zhang, H., Y. B. Hou and S. J. Lin (2006). Isolation and characterization of
proliferating cell nuclear antigen from the dinoflagellate Pfiesteria piscicida.
Journal of Eukaryotic Microbiology 53: 142-150.
Zhang, H., Y. B. Hou, L. Miranda, D. A. Campbell, N. R. Sturm, T. Gaasterland and
S. J. Lin (2007). Spliced leader RNA trans-splicing in dinoflagellates.
Proceedings of the National Academy of Sciences of the United States of
America 104: 4618-4623.
Zhang, H. and S. Lin (2008). mRNA editing and spliced-leader RNA trans-splicing
groups Oxyrrhis, Noctiluca, Heterocapsa, and Amphidinium as basal lineages
of dinoflagellates. Journal of Phycology 44: 703-711.
Zhang, H. and S. Lin (2009). Retrieval of missing spliced leader in dinoflagellates.
Plos One 4: 4129.
Zhang, Z., B. Green and T. Cavalier-Smith (1999). Single gene circles in
dinoflagellate chloroplast genomes. Nature 400: 155 - 159.
Zhang, Z., B. R. Green and T. Cavalier-Smith (2000). Phylogeny of ultra-rapidly
evolving dinoflagellate chloroplast genes: a possible common origin for
sporozoan and dinoflagellate plastids. Journal of Molecular Evolution 51: 26-
40.
Zhao, Z., J. A. Sheps, V. Ling, L. L. Fang and D. L. Baillie (2004). Expression
analysis of ABC transporters reveals differential functions of tandemly
duplicated genes in Caenorhabditis elegans. Journal of Molecular Biology
344: 409-417.
Zimmerman, S. A. and J. G. Ferry (2008). The β and γ Classes of Carbonic
Anhydrase. Current Pharmaceutical Design 14: 716-721.
Appendices
Method for DNA ligation
DNA ligations were performed using pGEM®-T Vector System (Promega, USA) with a ratio
of insert to vector of 3:1 (10 µl final reaction volume). Purified DNA fragments were
incubated with pGEM®-T vector (1 µl), 2X rapid ligation buffer (5 µL), T4 DNA ligase (3
Weiss units/ µL; 1 µL) and distilled water (10 µL final volume) overnight at 4 0C for the
maximum number of transformants.
Method for preparation of competent cells
Competent cells of E. coli, strain: NM522) were prepared using a modified method of Cohen
et al 1972 (Sambrook et al 1989). A single colony was picked from an LB agar plate that had
previously been spread using a -80 º C glycerol stock and used to inoculate 5 ml of LB media
(Appendix Table 2.5) and shaken overnight at 37 º C. The resulting culture was then used to
inoculate 500 ml of LB media and again shaken overnight at 37 ºC for 3 – 4 hours or until the
OD600 reading was between 0.5 – 0.6. The cultures were then cooled to 0 ºC on ice for 30
min and harvested in pre-cooled 50 ml Falcon tubes by centrifugation at 3000g for 20 min at 2
ºC. The resulting pellet was resuspended in 25 ml ice-cold 0.1 M CaCl2 and incubated on ice
for 30 min. After incubation on ice, cells were recovered by centrifugation at 3 000 x g for 20
min at 2 ºC and the cell pellet resuspended again in 2 ml of ice-cold 0.1 M CaCl2. 200 µl of
the cell suspension was then aliquoted into pre-chilled sterile 1.5 ml microcentrifuge tubes and
snap-frozen in liquid nitrogen and stored at -80 ºC for later use.
Method for transformation of competent cells
An aliquot of frozen NM522 competent cells (200 µl) were thawed on ice before plasmid
DNA (10 µl of ligation reaction) was added and incubated on ice for 20 min. Bacterial cells
were then heat-shocked at 42 ºC for 90 sec in a water bath before returning to ice for a further
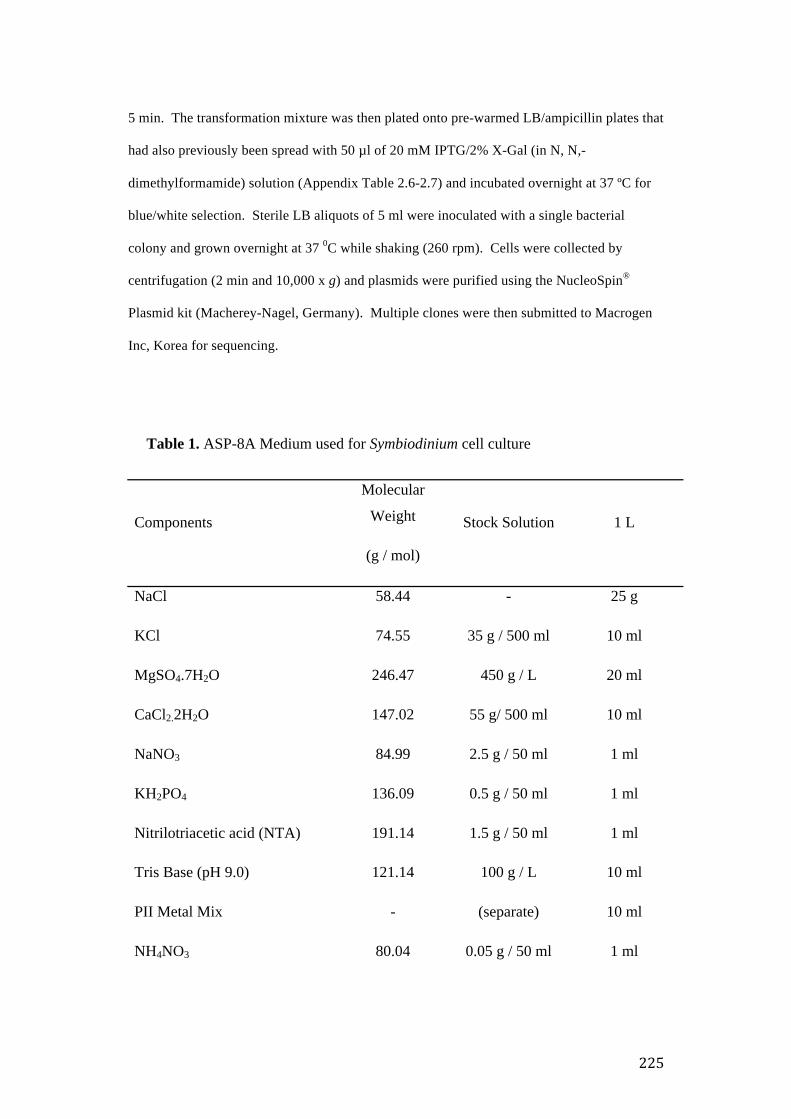
5 min. The transformation mixture was then plated onto pre-warmed LB/ampicillin plates that
had also previously been spread with 50 µl of 20 mM IPTG/2% X-Gal (in N, N,-
dimethylformamide) solution (Appendix Table 2.6-2.7) and incubated overnight at 37 ºC for
blue/white selection. Sterile LB aliquots of 5 ml were inoculated with a single bacterial
colony and grown overnight at 37 0C while shaking (260 rpm). Cells were collected by
centrifugation (2 min and 10,000 x g) and plasmids were purified using the NucleoSpin®
Plasmid kit (Macherey-Nagel, Germany). Multiple clones were then submitted to Macrogen
Inc, Korea for sequencing.
Table 1. ASP-8A Medium used for Symbiodinium cell culture
Components
Molecular
Weight
(g / mol)
Stock Solution 1 L
NaCl 58.44 - 25 g
KCl 74.55 35 g / 500 ml 10 ml
MgSO4.7H2O 246.47 450 g / L 20 ml
CaCl2.2H2O 147.02 55 g/ 500 ml 10 ml
NaNO3 84.99 2.5 g / 50 ml 1 ml
KH2PO4 136.09 0.5 g / 50 ml 1 ml
Nitrilotriacetic acid (NTA) 191.14 1.5 g / 50 ml 1 ml
Tris Base (pH 9.0) 121.14 100 g / L 10 ml
PII Metal Mix - (separate) 10 ml
NH4NO3 80.04 0.05 g / 50 ml 1 ml
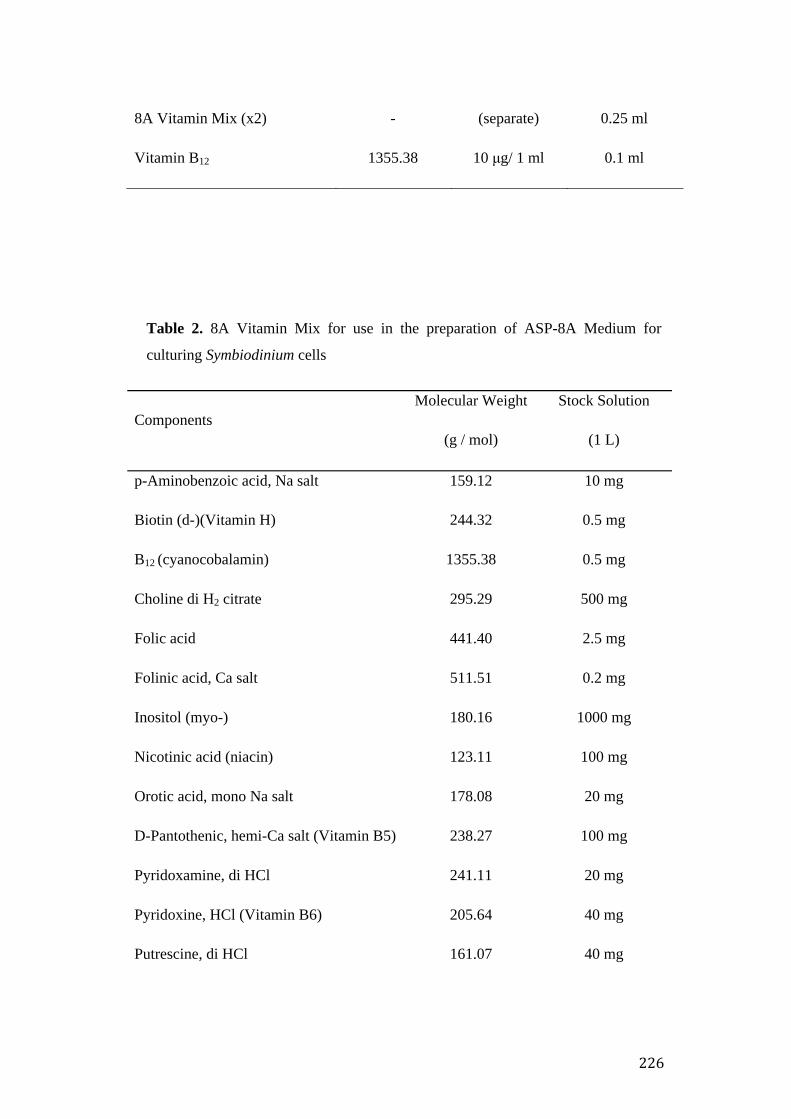
8A Vitamin Mix (x2) - (separate) 0.25 ml
Vitamin B12 1355.38 10 μg/ 1 ml 0.1 ml
Table 2. 8A Vitamin Mix for use in the preparation of ASP-8A Medium for
culturing Symbiodinium cells
Components Molecular Weight
(g / mol)
Stock Solution
(1 L)
p-Aminobenzoic acid, Na salt 159.12 10 mg
Biotin (d-)(Vitamin H) 244.32 0.5 mg
B12 (cyanocobalamin) 1355.38 0.5 mg
Choline di H2 citrate 295.29 500 mg
Folic acid 441.40 2.5 mg
Folinic acid, Ca salt 511.51 0.2 mg
Inositol (myo-) 180.16 1000 mg
Nicotinic acid (niacin) 123.11 100 mg
Orotic acid, mono Na salt 178.08 20 mg
D-Pantothenic, hemi-Ca salt (Vitamin B5) 238.27 100 mg
Pyridoxamine, di HCl 241.11 20 mg
Pyridoxine, HCl (Vitamin B6) 205.64 40 mg
Putrescine, di HCl 161.07 40 mg
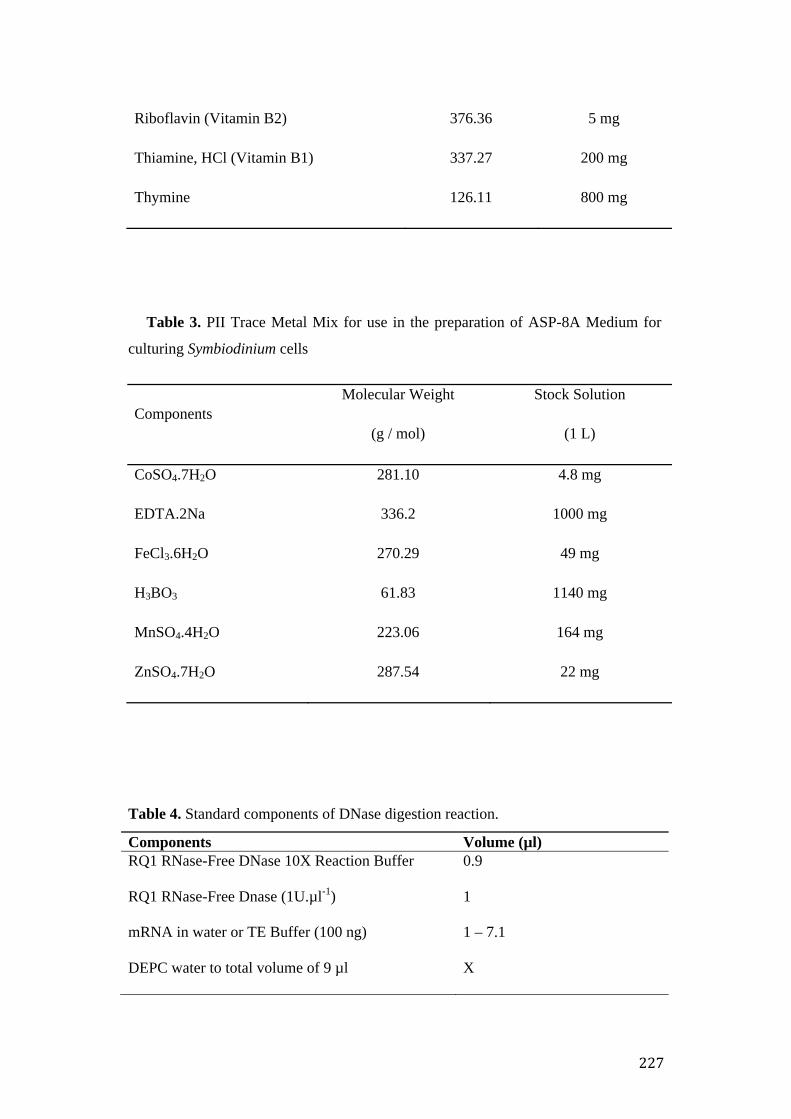
Riboflavin (Vitamin B2) 376.36 5 mg
Thiamine, HCl (Vitamin B1) 337.27 200 mg
Thymine 126.11 800 mg
Table 3. PII Trace Metal Mix for use in the preparation of ASP-8A Medium for
culturing Symbiodinium cells
Components Molecular Weight
(g / mol)
Stock Solution
(1 L)
CoSO4.7H2O 281.10 4.8 mg
EDTA.2Na 336.2 1000 mg
FeCl3.6H2O 270.29 49 mg
H3BO3 61.83 1140 mg
MnSO4.4H2O 223.06 164 mg
ZnSO4.7H2O 287.54 22 mg
Table 4. Standard components of DNase digestion reaction.
Components Volume (µl) RQ1 RNase-Free DNase 10X Reaction Buffer 0.9
RQ1 RNase-Free Dnase (1U.µl-1) 1
mRNA in water or TE Buffer (100 ng) 1 – 7.1
DEPC water to total volume of 9 µl X

Table 5. Standard components for Reverse transcription.
Components Volume (µl)
2X RT Reaction Mix 10
RT Enzyme Mix (SuperScriptTMIII Rand RNaseOUTTM)
2
DNase-treated mRNA (100 ng) 10
Table 6. Overview of illumina sequencing data, assembly and annotation statistics of
Symbiodinium clade F transcriptome.
Control
(n=5)
Treatment
(n=5)
Raw read data
Average reads per library size (pre-filter) 15767639
15534081
Average library size (post filter) 15667924 15435134
Assembly
Number of contigs in assembled
transcriptome
63908
Average contig length 1023
Annotation (number and percent)
Number of annotated contigs with
Blast2GO (FDR < 0.05)
20486 (32.05%)
Number of contigs used for differential
expression analysis
49538 (%)
Number of differentially expressed genes
(DEG)(p <0.05)
12728 (19.9%)
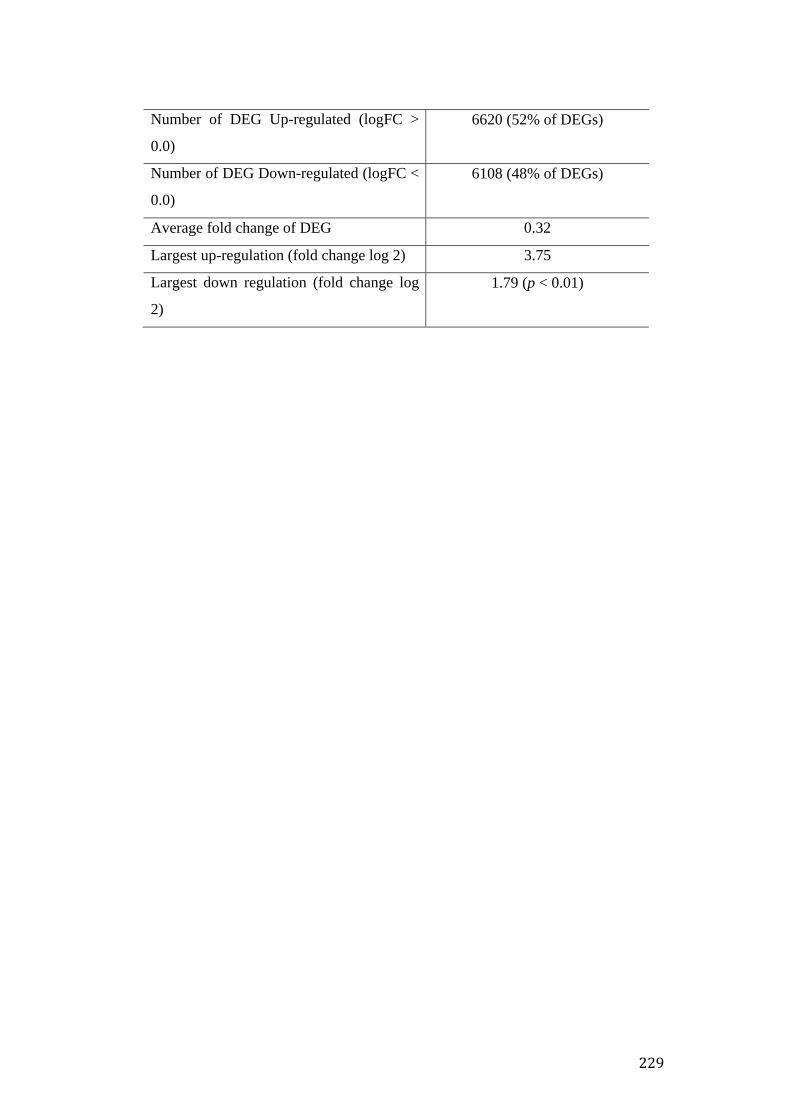
Number of DEG Up-regulated (logFC >
0.0)
6620 (52% of DEGs)
Number of DEG Down-regulated (logFC <
0.0)
6108 (48% of DEGs)
Average fold change of DEG 0.32
Largest up-regulation (fold change log 2) 3.75
Largest down regulation (fold change log
2)
1.79 (p < 0.01)
Top Related