


Languages
Pages
Legal

V-1
Chapter V
Phase Locked Loops for High Frequency Transmitters and Receivers By Mike Curtin
PLL Basics
A phase-locked loop is a feedback system
combining a voltage controlled oscillator and
a phase comparator so connected that the
oscillator frequency (or phase) accurately
tracks that of an
applied frequency- or phase-modulated signal.
Phase-locked loops can be used, for example,
to generate stable output frequency signals
from a fixed low-frequency signal. The phase
locked loop can be analyzed in general as a
negative feedback system with a forward gain
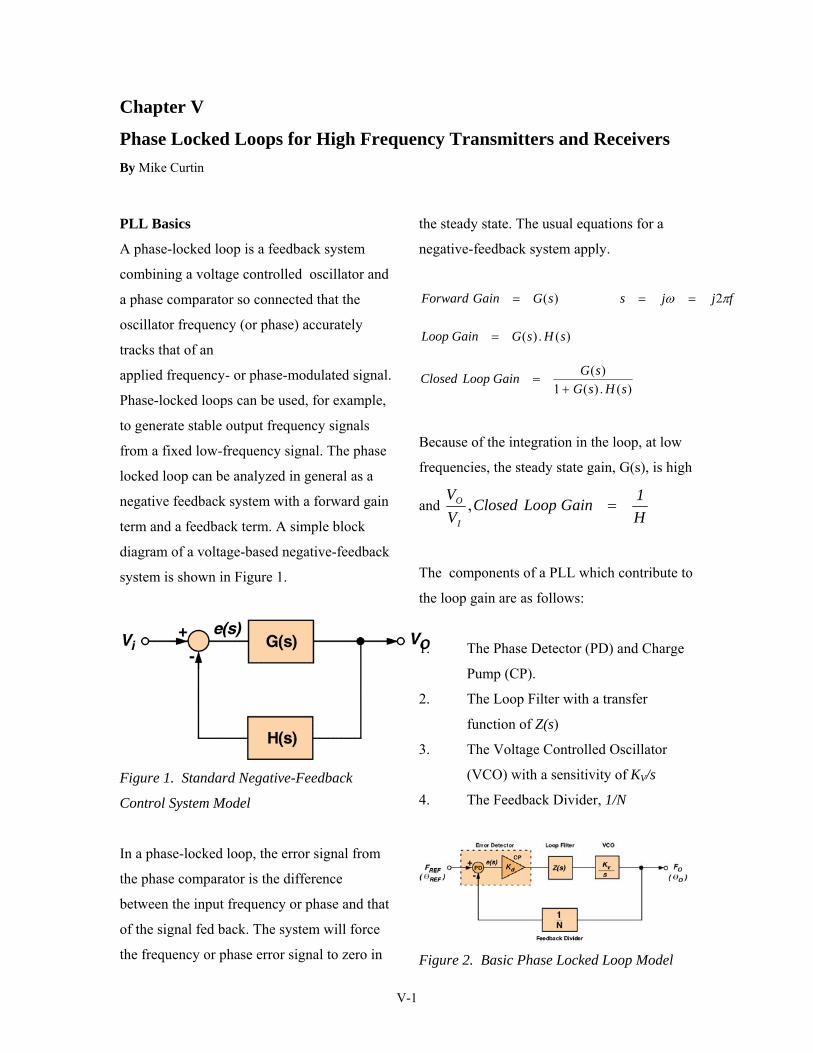
term and a feedback term. A simple block
diagram of a voltage-based negative-feedback
system is shown in Figure 1.
Figure 1. Standard Negative-Feedback
Control System Model
In a phase-locked loop, the error signal from
the phase comparator is the difference
between the input frequency or phase and that
of the signal fed back. The system will force
the frequency or phase error signal to zero in
the steady state. The usual equations for a
negative-feedback system apply.
Because of the integration in the loop, at low
frequencies, the steady state gain, G(s), is high
and H1GainLoopClosed
VV
I
O =,
The components of a PLL which contribute to
the loop gain are as follows:
1. The Phase Detector (PD) and Charge
Pump (CP).
2. The Loop Filter with a transfer
function of Z(s)
3. The Voltage Controlled Oscillator
(VCO) with a sensitivity of KV/s
4. The Feedback Divider, 1/N
Figure 2. Basic Phase Locked Loop Model
)(sGGainForward =
)(.)( sHsGGainLoop =
)(.)(1)(
sHsGsGGainLoopClosed
+=
fjjs πω 2==
V-2
If a linear element like a four-quadrant
multiplier is used as the phase detector, and
the loop filter and VCO are also analog
elements, this is called an analog, or linear
PLL (LPLL). If a digital phase detector
(EXOR gate or J-K flip flop) is used, and
everything else stays the same, the system is
called a digital PLL (DPLL).
If the PLL is built exclusively from digital
blocks, without any passive components or
linear elements, it becomes an all-digital PLL
(ADPLL). Finally, with information in digital
form, and the availability of sufficiently fast
processing, it is also possible to develop PLLs
in the software domain. The PLL function is
performed by software and runs on a DSP.
This is called a software PLL (SPLL).
Referring to Figure 2, a system for using a
PLL to generate higher frequencies than the
input, the VCO oscillates at an angular
frequency of ωD. A portion of this
frequency/phase signal is fed back to the error
detector, via a frequency divider with a ratio
1/N. This divided-down frequency is fed to
one input of the error detector. The other input
in this example is a fixed reference
frequency/phase. The error detector compares
the signals at both inputs. When the two signal
inputs are equal in phase and frequency, the
error will be zero and the loop is said to be in
a “locked” condition. If we simply look at the
error signal, the following equations may be
developed.
REFO
REFO
OREF
FNF
FNF
seWhen
NF
Fse
×=⇒
=⇒=
−=
0)(
)(
In commercial PLLs, the phase detector and
charge pump together form the error detector
block. When F ≠ (N × FREF), the error
detector will output source/sink current pulses
to the low pass
loop filter. This smoothes the current pulses
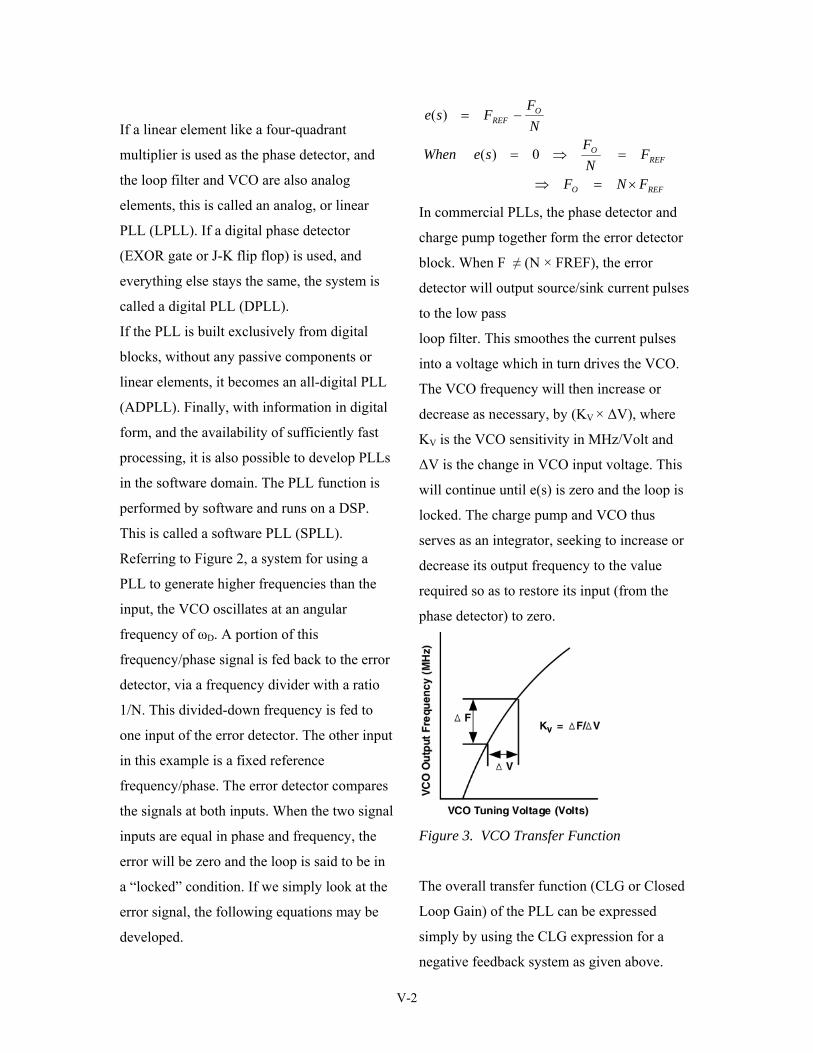
into a voltage which in turn drives the VCO.
The VCO frequency will then increase or
decrease as necessary, by (KV × ΔV), where
KV is the VCO sensitivity in MHz/Volt and
ΔV is the change in VCO input voltage. This
will continue until e(s) is zero and the loop is
locked. The charge pump and VCO thus
serves as an integrator, seeking to increase or
decrease its output frequency to the value
required so as to restore its input (from the
phase detector) to zero.
Figure 3. VCO Transfer Function
The overall transfer function (CLG or Closed
Loop Gain) of the PLL can be expressed
simply by using the CLG expression for a
negative feedback system as given above.

V-3
GainLoopGainForward
FF
REF
O
+=
1
NssZKKGHGainLoop vd )(.., =
ssZKKGGainForward vd )(.., =
When GH is much greater than 1, we can say
that the closed loop transfer function for the
PLL system is N and so REFOUT FNF .= .
The loop filter is of a low-pass nature. It
usually has one pole and one zero. The
transient response of the loop depends on;
1) the magnitude of the pole/zero,
2) the charge pump magnitude,
3) the VCO sensitivity,
4) the feedback factor, N.
All of the above must be taken into account
when designing the loop filter. In addition,
the filter must be designed to be stable
(usually a phase margin of π/4 is
recommended). The 3-dB cutoff frequency of
the response is usually called the loop
bandwidth, Bw. Large loop bandwidths result
in fast transient response. However, this is not
always advantageous, as we shall see later,
since there is a trade off between fast transient
response and reference spur attenuation.
PLL Synthesizer Basic Building Blocks
It is possible to break up the PLL synthesizer
into a number of basic building blocks. These
have already been touched upon, but we will
now deal with them in greater detail.
(i) The Phase Frequency
Detector, PFD
(ii) The Reference Counter, R
(iii) The Feedback Counter, N
The Phase Frequency Detector or PFD
The heart of a synthesizer is the phase detector
or phase frequency detector. This is where the
reference frequency signal is compared with
the signal fed back from the VCO output and
the resultant error is used to drive the loop
filter and VCO. In a Digital PLL (DPLL) the
phase detector or phase frequency detector is a
logical element. The three most common
implementations are :
(i) The EXOR gate
(ii) The J-K flip-flop
(iii) The phase frequency (PFD)

V-4
Figure 4. Typical PFD Using D-Type Flip
Flops
Here we will consider only the PFD since this
is the element used in the ADF41XX family of
PLL synthesizers. The PFD differs from the
EXOR gate and the J-K flip flop in that, its
output is a function of both the frequency
difference and phase difference between the
two inputs.
Figure 4 shows one implementation of a PFD.
It basically consists of two D-type flip flops,
with one Q output enabling a positive current
source and the other Q output enabling a
negative current source. Let’s assume in this
design that the D-type flip flop is positive
edge triggered. There are three possible states
for the combination of UP and DOWN from
the D-type flip flops. The state of 11, where
both outputs are high, is disabled by the AND
gate (U3) back to the CLR pins on the flip
flops. The state of 00 (Q1, Q2) means that
both P1 and N1 are turned off and the output ,
OUT is essentially in a high impedance state.
The state 10 means that P1 is turned on, N1 is
turned off and the output is at V+. The state
of 01 means P1 is turned off, N1 is turned on
and the output is at V-.
Lets consider how the circuit behaves if the
system is out of lock and the frequency on +IN
is much higher than the frequency on –IN.
Figure 5 is a diagram which shows the
relevant waveforms.
Figure 5. PFD Waveforms, Out of Frequency
and Phase Lock
Since the frequency on +IN is much higher
than on –IN, the output spends most of its time
in the high state. The first rising edge on +IN
sends the output high and this is maintained
until the first rising edge occurs on –IN. In a
practical system this means that the output to
the VCO is driven higher resulting in an
increase in frequency at –IN. This is exactly
what we want.
If the frequency on +IN was much lower than
on –IN, then we would get the opposite effect.
The output at OUT would spend most of its
time in the low condition. This would have
the effect of driving the VCO in the negative
direction and bringing the frequency at –IN
much closer to that at +IN. In this way,
locking is achieved.
Now let’s look at the waveforms when the
inputs are frequency locked and almost phase
locked. Figure 6 is the diagram.

V-5
Figure 6. PFD Waveforms, Out of Phase
Lock, In Frequency Lock
Since the phase on +IN is leading that on –IN,
the output is a series of positive current pulses.
These pulses will tend to drive the VCO so
that the –IN signal become phase –aligned
with the +IN signal.
When this occurs, if there was no delay
element between U3 and the CLR inputs of
U1 and U2, it would be possible for the OUT
signal to be in high impedance mode, with
neither positive or negative current pulses on
the output. This would not be a good thing to
happen. The VCO would drift until a
significant phase error developed and started
producing either positive or negative current
pulses once again. Looked at over a relatively
long period of time, the effect of this would be
to have the output of the charge pump
modulated by a signal that is a sub-harmonic
of the PFD input reference frequency. Since
this could be a low frequency signal it would
not be attenuated by the loop filter and would
result in very significant spurs in the VCO
output spectrum. The phenomenon is known
as the backlash effect and the delay element
between the output of U3 and the CLR inputs
of U1 and U2 ensures that it does not happen.
With the delay element, even when the +IN
and –IN are perfectly phase-aligned, there will
still be a current pulse generated at the charge
pump output. The duration of this delay is
equal to the delay inserted at the output of U3
and is known as the anti-backlash pulse width.
The Reference Counter
In the classical Integer-N synthesizer, the
resolution of the output frequency is
determined by the reference frequency applied
to the Phase Detector. So, for example, if
200kHz spacing is required (as in GSM
phones), then the reference frequency must be
200kHz. However, getting a stable 200kHz
frequency source is not easy and it makes
more sense to take a good crystal-based high
frequency source and divide it down. So, we
could have a 10MHz Frequency Reference,
divide this down by 50 and have the desired
frequency spacing. This is shown in the
diagram in Figure 7.
Figure 7. Using a Reference Counter in a
PLL Synthesizer
The Feedback Counter, N
The N counter or N divider, as it is sometimes
called, is the programmable element that sets
the output frequency in the PLL. In fact, the N
counter has become quite complex over the
years . Instead of being a straightforward N
counter it has evolved to include a prescaler
which can have a dual modulus.
If we confine ourselves to the basic divide-by-
N structure to feed back to the phase detector,
we can run into problems if very high

V-6
frequency outputs are required. For example,
let’s assume that a 900MHz output is required
with 10kHz spacing. We can use a 10MHz
Reference Frequency, and set the R-Divider at
1000. Then, the N-value in the feedback
would need to be around 90,000. This would
mean at least a 17-bit counter. This counter
would have to be capable of dealing with an
input frequency of 900MHz.
It makes sense to precede the programmable
counter with a fixed counter element to bring
the very high input frequency down to a range
at which standard CMOS will operate. This is
called the prescaler and is shown in Figure 8.
Figure 8. Basic Prescaler
However, using a standard prescaler
introduces other complications. The system
resolution is now degraded (F1 x P). The dual-
modulus prescaler addresses this issue.
The dual-modulus prescaler, shown below in
Figure 9, gives the advantages of the standard
prescaler without any loss in system
resolution. A dual-modulus prescaler is a
counter whose division ratio can be switched
from one value to another by an external
control signal. By using the dual-modulus
prescaler with an A and B counter one can still
maintain output resolution of F1. However,
the following conditions must be met:
1. The output signal of both counters is
HIGH if the counters have not timed
out.
2. When the B counter times out, its
output goes LOW and it immediately
loads both counters to their preset
values.
3. The value loaded to the B counter
must always be greater than that
loaded to the A counter.
Figure 9. The Dual-Modulus Prescaler
Assume that the B counter has just timed out
and both counters have been reloaded with the
values A and B. Let’s find the number of
VCO cycles necessary to get to the same state
again.
As long as the A counter has not timed out, the
prescaler is dividing down by P+1. So, both
the A and B counters will count down by 1
every time the prescaler counts (P + 1) VCO
cycles. This means the A counter will time
out after {(P + 1) × A)} VCO cycles. At this
point the prescaler is switched to (divide-by-
P). It is also possible to say that at this time

V-7
the B counter still has (B - A) cycles to go
before it times out. How long will it take to
do this: {(B - A) × P}. The system is now
back to the initial condition where we started.
The total number of VCO cycles needed for
this to happen is :
{(P + 1) × A } + {(B - A) × P}
= AP + A + BP - AP
= {(P × B) + A}
When using a dual modulus prescaler, it is
important to consider the lowest and highest
value of N possible . What we really want
here is the range over which it is possible to
change N is discrete integer steps .Consider
our expression for N: N = BP + A. To ensure
a continuous integer spacing for N, A must be
in the range 0 to (P - 1). Then, every time B is
incremented there is enough resolution to fill
in the all the integer values. As we have
already said for the dual modulus prescaler, B
must be greater than or equal to A for the dual
modulus prescaler to work. From these two
conditions, we can say that the smallest
division ratio possible while being able to
increment in discrete integer steps is:
NMIN = (Bmin x P) + Amin
= ((P-1) x P ) + 0
= P2 – P
The highest value of N is given by
NMAX = (Bmax x P) + Amax
In this case Amax and Bmax are simply
determined by the size of the A and B
counters.
Now, let’s take a practical example using the
ADF4111.
Lets assume the prescaler is programmed to
32/33.
A counter: 6 bits means A can be 26 - 1 = 63
B counter : 13 bits means B can be 213 - 1 =
8191
NMIN = P2 - P = 992
NMAX = (Bmax x P) + Amax
= (8191 x 32) + 63
= 262175
Fractional-N Synthesizers
Many of the emerging wireless
communication systems have a need for faster
switching and lower phase noise in the Local
Oscillator. This is particularly true in GSM
systems. We have seen that Integer-N
synthesizers require a PFD frequency which is
equal to the channel spacing. This can be quite
low and thus necessitates a high N. This high
N produces a phase noise that is
proportionately high. The low PFD frequency
in turn means a low loop bandwidth which
limits the PLL lock time. If we could divide
by a fraction in the feedback, then it would be
possible to use a higher reference frequency
and still achieve the desired channel spacing.
This lower number would also mean lower
phase noise. So, in theory, fractional-N

V-8
synthesis offer a means of improving both
phase noise and lock time in PLL’s.
If fact it is possible to implement division by a
fraction over a long period of time by
alternately dividing by two integers (divide by
2.5 can be achieved by dividing successively
by 2 and 3).
So, how do we decide to divide by X or (X+1)
(assuming that our fractional number is
between these two values)? Well, we can take
the fractional part of the number and allow it
to accumulate at the Reference Frequency rate.
Figure 10. The Fractional-N Synthesizer
Since it is based on integer-N, the fractional-N
PLL inherits many of the building blocks of its
predecessor. The PFD, charge pump, loop
filter, and VCO all work in the same way on
both platforms. The N-divider is different,
however. In a fractional-N PLL, the N-divider
is broken up into the integer divider (N) and a
modulus-M interpolator (M), which acts as the
fraction function by toggling the N-divider.
The interpolator is programmed with some
value (f). The average division factor is now N
+ f/M where:
0 < f < M
(N + f/M) = RFOUT / FPFD
This is the essence of fractional-N synthesis. It
means that the PFD frequency can be larger
than the RF channel resolution. In relation to
the GSM-900 example, it may be instructive
to examine how the fractional-N approach
handles the generation of 900-MHz output
signals with 200-kHz channel resolution. If a
modulus M of 10 is available, FPFD can be set
to 2 MHz. N is programmed to 450, f is 0, and
M is 10. To tune to 900.2 MHz RFOUT,
NAVERAGE must be 450.1, N is programmed to
450, f is 1, and M is 10. To achieve this, the
N-divider is toggled under the control of the
interpolator between N and N+1 and the
average taken. What effectively occurs is that
the N-divider divides by 450 nine times, and
then divides by 451 once every 10 PFD cycles.
The average over the 10 cycles of 450.1 is
taken as NAVERAGE, which is fed to
the PFD. However, much complex circuitry is
needed to implement this.
Interpolators can be implemented using the
overflow bit of an accumulator. Alternatively,
sigma-delta modulators are often employed for
this task due to their averaging function and
noise-shaping characteristics. In this case,
every time an N value is presented to the PFD,
it has been modulated by the sigma-delta
modulator. This introduces spurs to the loop at
FPFD/M.

V-9
IMPORTANT SPECIFICATIONS IN PLL
SYNTHESIZERS
Noise
In any oscillator design, frequency stability is
of critical importance. In general, it is
possible to separate stability into long-term
stability and short-term stability. Long-term
frequency stability is concerned with how the
output signal varies over a long period of time
(this can be hours, days or months). It is
usually specified in Df/f for a given period of
time and can be linear or exponential in
nature.
Short-term stability, on the other hand, is
concerned with variations that occur over a
period of seconds or less. These variations
can be random or periodic. We can use a
spectrum analyzer to look at short-term
stability of a signal. Figure 1 shows a typical
spectrum.
Figure 11. Short-term stability in oscillators
The discrete spurious components are non-
random in nature and can be the result of
known clock frequencies in the signal source,
power line interference or mixer products.
The random noise fluctuation shown in Figure
11 is called phase noise. It can be due to
thermal noise, shot noise or flicker noise in
active and passive devices.
Phase Noise In Voltage Controlled
Oscillators
Before we look at phase noise in a PLL
system, it is worth considering the phase noise
in a VCO. An ideal VCO would have no
phase noise. If we looked at the output on a
spectrum analyzer, we would see only one
spectral line. In practice of course, this is not
the case. There will be jitter on the output
and, looked at on a spectrum analyzer, this
will give rise to what we call phase noise. In
terms of understanding phase noise it is useful
to consider a phasor representation. Figure 2
shows the effect of superimposed noise
voltages on a carrier signal. We call this effect
phase noise.
Figure 12. Phasor Representation of Phase
Noise
A signal of angular velocity, v0, and peak
amplitude VSpk is shown. Superimposed on

V-10
this is an error signal of angular velocity, vm.
Durms represents the rms value of the phase
fluctuations and is expressed in rms degress .
In many radio systems there is an overall
integrated phase error specification which
must be met. This overall phase error is made
up of the PLL phase error, the modulator
phase error and the phase error due to base
band components. In GSM, for example, the
total allowed is 5 degrees rms. It is important
that each of the contributing components are
minimized. GSM designers like to keep the
PLL phase error below 1 degree rms in the
200kHz frequency band around the carrier.
Leeson’s Equation
Leeson developed an equation to describe the
different noise components in a VCO.
⎥⎥⎦
⎤
⎢⎢⎣
⎡⎟⎟⎠
⎞⎜⎜⎝
⎛≈
2
281log10
m
O
LPM f
fQA
FkTL
Where
LPM is single-sideband phase noise density
(dBc/Hz)
F is the device noise factor at operating power
level A (linear)
k is Boltzmann’s constant, 1.38 x 10⁻²³ ((J/K))
T is temperature (K)
A is oscillator output power (W)
QL is loaded Q (dimensionless)
fO is the oscillator carrier frequency
fm is the frequency offset from the carrier
For Leeson’s equation to be valid, the
following must be true:
fm, the offset frequency from the carrier is
greater than the 1/f flicker corner frequency;
the noise factor at the operating power level is
known;
the device operation is linear;
Q includes the effects of component losses,
device loading and buffer loading;
A single resonator is used in the oscillator.
Figure 13. Phase Noise in a VCO vs.
Frequency Offset
Leeson’s equation only applies between the
1/f flicker noise frequency (f1) and a frequency
past which amplified white noise dominates
(f2). This is shown in Figure 3. Typically, f1 is
less than 1kHz and should be as low as
possible. The frequency f2 is in the region of a
few MHz. High-performance oscillators
require devices specially selected for low 1/f
transition frequency. Some guidelines to
minimizing the phase noise in VCO’s are:
1. Keep the tuning voltage of the varactor
sufficiently high (typically between 3
and 3.8V)
2. Use filtering on the dc voltage supply.

V-11
3. Keep the inductor Q as high as possible.
Typical off-the-shelf coils provide a Q
of between 50 and 60.
4. Choose an active device that has
minimal noise figure as well as low
flicker frequency. The flicker noise can
be reduced by the use of feedback
elements
5. Most active device exhibit a bowl-
shaped “Noise Figue vs Bias Current”
curve. Use this information to choose
the optimal operating bias current for
the device.
6. Maximize the average power at the tank
circuit output.
7. When buffering the VCO, use devices
with the lowest possible Noise Figure.
Closing The Loop
We have looked at phase noise in a free-
running VCO and considered how it can be
minimized. Now, we will look at closing the
loop and consider what effect this will have on
phase noise.
Figure 14. PLL - Phase Noise contributors
Figure 14 shows the main phase noise
contributors in a PLL as well as the system
transfer function equations. The system may
be described by the following equations.
GHGGainLoopClosed+
=1
ssZKKG vd )(..
=
NH 1
=
⎟⎟⎠
⎞⎜⎜⎝
⎛+
⎟⎠⎞
⎜⎝⎛
=
sNsZKK
ssZKK
GainLoopClosedvd
vd
.)(..1
)(..
The term, SREF, is the noise that appears on the
reference input to the phase detector. It is
dependent on the reference divider circuitry
and the spectral purity of the main reference
signal. The term, SN, is the noise due to the
feedback divider appearing at the frequency
input to the PD. The term, SCP, is the noise due
to the phase detector implementation. The last
term, SVCO, is the phase noise of the VCO as
described by equations developed earlier .
The overall phase noise performance at the
output is dependent on each of the terms
described above. All the effects at the output
are added in an rms fashion to give the total
noise of the system. It is possible to write the
following:
STOT2 is the total phase noise power at the
output
X2 is the noise power at the output due to SN
and SREF.
Y2 is the noise power at the output due to SCP
2222 ZYXSTOT ++=

V-12
Z2 is the noise power at the output due to SVCO.
It can be clearly seen that the noise terms at
the PD inputs, SREF and SN, will be operated
on in the same fashion as FREF and will be
multiplied by the closed loop gain of the
system.
( )2
222
1. ⎟⎟
⎠
⎞⎜⎜⎝
⎛+
+=GH
GSSX NREF
At low frequencies, inside the loop bandwidth, 2222 .)(1 NSSXandGH NREF +=>>
At high frequencies, outside the loop
bandwidth,
01 2 ⇒<< XandG
The contribution to the overall output noise
due to the phase detector noise, SCP, can be
calculated by referencing SCP back to the input
of the PFD. The equivalent noise at the PD
input is SCP/Kd. This is then multiplied by the
Closed Loop Gain. So:
2
222
1.1. ⎟⎟
⎠
⎞⎜⎜⎝
⎛+⎟⎟
⎠
⎞⎜⎜⎝
⎛=
GHG
KSY
dCP
Finally, the contribution of the VCO noise,
SVCO, to the output phase noise is calculated in
a similar manner. The forward gain this time
is simply 1. Therefore the final output noise
term can be described as:
222
11. ⎟⎟
⎠
⎞⎜⎜⎝
⎛+
=GH
SZ VCO
G, the forward loop gain of the closed loop
response, is usually a low pass function and it
is very large at low frequencies and small at
high frequencies. H is a constant, 1/N. The
bottom term of the above expression is
therefore low pass. Therefore SVCO is actually
high pass filtered by the closed loop.
A similar description of the noise contributors
in a PLL/VCO is described in Reference 1.
Recall that the closed loop response is a low
pass filter with a 3 dB cutoff frequency, Bw,
denoted the loop bandwidth. For frequency
offsets at the output less than Bw, the dominant
terms in the output phase noise response are X
and Y, the noise terms due to reference noise,
N counter noise and charge pump noise.
Keeping SN and SREF to a minimum, keeping
Kd large and keeping N small will thus
minimize the phase noise inside the loop
bandwidth, Bw. Of course, keeping N small
will not always be possible since this is what
programs the output frequency.
For frequency offsets much greater than Bw,
the dominant noise term is that due to the
VCO, SVCO. This is due to the high pass
filtering of the VCO phase noise by the loop.
A small value of Bw would be desirable as it
would minimize the total integrated output
noise (phase error). However a small Bw
results in a slow transient response and
increased contribution from the VCO phase
noise inside the loop bandwidth. The loop
bandwidth calculation therefore must trade off
transient response versus total output
integrated phase noise.

V-13
To show the effect of closing the loop in a
PLL, it is possible to overlay the output of a
free-running VCO with the output of a VCO
as part of a PLL. This is shown in Figure 15
below. Note that the in-band noise of the PLL
has been attenuated compared to the free-
running VCO.
Figure 15. Phase Noise on a Free-Running
VCO vs. VCO in a PLL
Phase Noise Measurement
One of the most common ways of measuring
phase noise is with a high frequency spectrum
analyzer. Figure 16 is a representation of what
would be seen.
Figure 16. Phase Noise Definition
With the Spectrum Analyzer we can measure
the one-sided spectral density of phase
fluctuations per unit bandwidth. VCO phase
noise is best described in the frequency
domain where the spectral density is
characterized by measuring the noise
sidebands on either side of the output signal
center frequency. Single sideband phase noise
is specified in decibels relative to the carrier
(dBc/Hz) at a given frequency offset from the
carrier. The following equation describes this
SSB phase noise.
HzdBcPPfSSSB
SC /,log10)( ⎟⎟
⎠
⎞⎜⎜⎝
⎛=
Figure 7. Measuring Phase Noise with a
Spectrum Analyzer
The 10 MHz, 0dBm reference oscillator is
available on the spectrum analyzer rear panel
connector and it has excellent phase noise
performance. The R divider, N divider and the
phase detector are part of ADF4112
frequency synthesizer. These dividers are
programmed serially under the control of a
PC. The frequency and phase noise

V-14
performance are observed on the spectrum
analyzer.
Figure 18. Typical Spectrum Analyzer Output
Figure 18 illustrates a typical phase noise plot
of a PLL synthesizer using an ADF4112 PLL
with a Murata VCO, MQE520-1880. The
frequency and phase noise were measured in a
5 kHz span. The reference frequency used was
FREF = 200 kHz (R=50) and the output
frequency was 1880 MHz (N=9400) . If this
was an ideal-world PLL synthesizer then a
single discrete tone would be displayed along
with the spectrum analyzer’s noise floor. What
is displayed here is the tone and the phase
noise due to the loop components. The loop
filter values were chosen to give a loop
bandwidth of approximately 20 kHz. The flat
part of the phase noise for frequency offsets
less than the loop bandwidth is actually the
phase noise as described by X2 and Y2 in the
section “Closing The Loop” for cases where f
is inside the loop bandwidth. It is specified at
a 1 kHz offset. The value measured was –
85.86 dBc/Hz. This is the phase noise power
in a 1 Hz bandwidth. This value is made up of
the following:
(i). Relative power in dBc between the
carrier and the sideband noise at 1kHz
offset
(ii). The spectrum analyzer displays the
power for a certain resolution
bandwidth (RBW). In the plot, a 10Hz
RBW is used. To represent this power in
a 1Hz bandwidth, 10log(RBW) must be
subtracted from the value in (i).
(iii) A correction factor which takes into
account the implementation of the RBW,
the log display mode and detector
characteristic must be added to the
result in (ii).
Phase noise measurement with the HP 8561E
can be made quickly by using the marker
noise function, MKR NOISE. This function
takes into account the above three factors and
displays the phase noise in dBc/Hz.
The phase noise measurement above is the
total output phase noise at the VCO output. If
we want to estimate the contribution of the
PLL device (noise due to phase detector, R&N
dividers and the phase detector gain constant),
we must divide our result by N2 (or subtract
20*logN from the above result). This gives a
phase noise floor of {-85.86 -20*log(9400)} =
-165.3 dBc/ Hz.

V-15
Normalized Phase Noise Floor
The PLL synthesizer Normalized Phase Noise
Floor (or Figure of Merit, as it is sometimes
known) in the phase noise normalized for a 1
Hz PFD frequency and is defined by the
following equation:
NFPNPN PFDTOTSYNTH log20log10 −−=
PNSYNTH is the Normalized Phase Noise Floor
PNTOT is the measured phase noise at the PLL
output
FPFD is the PFD frequency
N is the value in the N counter
The Normalized Phase Noise Floor is a quick
and convenient way of comparing the noise
performance of PLL synthesizers.
Reference Spurs
In an integer-N PLL (where the output
frequency is an integer multiple of the
reference input), reference spurs are caused by
the fact that there is continuous update of the
charge pump output at the reference frequency
rate. Let’s once again consider the basic
model for the PLL. This is shown again in
Figure 19, below.
Figure 19. Basic PLL Model
When the PLL is in lock, the phase and
frequency inputs to the PFD (fREF and fN) are
essentially equal. In theory, one would expect
that there would be no output from the PFD, in
this case. However, this can create problems
and so the PFD is designed so that, in the
locked condition, the current pulses from the
charge pump will typically look like Figure
20.
Figure 20. Output current pulses from the
PFD Charge Pump
These pulses have a very narrow width but the
fact that they exist means that the dc voltage
driving the VCO is modulated by a signal of
frequency fREF. This produces what we call
Reference Spurs in the RF output and these
will occur at offset frequencies which are
integer multiples of fREF. It is possible to
detect reference spurs using a spectrum
analyzer. Simply increase the span to greater
than twice the reference frequency. A typical
plot is shown in Figure 11. In this case the
reference frequency is 200kHz and the
diagram clearly shows reference spurs at 6
200kHz from the RF output of 1880MHz. The
level of these spurs is –90dB. If we increased
the span to greater than four times the

V-16
reference frequency then we would also see
the spurs at (2 x fREF).
Figure 21. Output Spectrum showing
Reference Spurs
Charge Pump Leakage Current
When the CP output from the synthesizer is
programmed to the high impedance state, there
should, in theory, be no leakage current
flowing. In practice, of course, this is not the
case and there are applications where the level
of leakage current will have an impact on
overall system performance. It is important to
note that leakage current has a direct bearing
on reference (PFD) spur level at the output of
the PLL.
PLL Applications: Up-Conversion and
Down-Conversion in Base Stations
The Phase Locked Loop allows stable high
frequencies to be generated from a low-
frequency reference. Any system that requires
stable high frequency tuning can benefit from
the PLL technique. The stable high frequency
generated by the PLL is commonly known as
a Local Oscillator (LO) and these are used in
many systems like Wireless Basestations,
Wireless Handsets, Pagers, CATV Systems,
Clock Recovery and Generation Systems. A
good example of a PLL application is a GSM
Handset or Basestation. Figure 22 shows the
receive section of a GSM Basestation.
Figure 22. Signal Chain For GSM Base
Station Receiver
In the GSM system, there are 124 channels (8
users per channel) of 200kHz width in the RF
Band. The total bandwidth occupied is
24.8MHz, which must be scanned for activity.
The handset has a TX range of 880MHz to
915MHz and an RX range of 925MHz to
960MHz. Conversely, the base station has a
TX range of 925MHz to 960 MHz and an RX
range of 880MHz to 915MHz. For our
example lets just consider the base station
transmit and receive sections. The frequency
bands for GSM900 and DCS1800 Base
Station Systems are shown in Table 1. Table
2 shows the channel numbers for the carrier
frequencies (RF channels) within the
frequency bands of Table 1. Fl (n) is the
center frequency of the RF channel in the
lower band (RX) and Fu(n) is the
corresponding frequency in the upper band
(TX).

V-17
TX RX
P-GSM900 935 –960MHz 890-915MHz
DCS1800 1805-1880MHz 1710-1785MHz
E-GSM900 925-960MHz 880-915MHz
Table 1. Frequency Bands for GSM900 and DCS1800 Base Station Systems
RX TX
PGSM900 Fl(n) = 890 + 0.2 x (n) 1 ≤ n ≤ 124 Fu(n) = Fl(n) + 45
EGSM900 Fl(n) = 890 + 0.2 x (n)
Fl(n) = 890 + 0.2 x (n-1024)
0 ≤ n ≤ 124
975 ≤ n ≤ 1023
Fu(n) = Fl(n) +45
DCS1800 Fl(n) = 1710.2 + 0.2 x (n – 512) 512 ≤ n ≤ 885 Fu(n) = Fl(n) + 95
Table 2. Channel Numbering for GSM900 and DCS1800 Base Station Systems
The 900MHz RF input is filtered, amplified
and applied to the first stage mixer. The other
mixer input is driven from a tuned Local
Oscillator (LO). This must scan the input
frequency range to search for activity on any
of the channels. The actual implementation of
the LO is by means of the PLL technique
already described. If the 1st Intermediate
Frequency (IF) stage is centered at 240MHz,
then the LO must have a range of 640MHz to
675MHz in order to cover the RF Input Band.
When a 200kHz Reference Frequency is
chosen, then it will be possible to sequence the
VCO output through the full frequency range
in steps of 200kHz. For example, when an
output frequency of 650MHz is desired then N
will have a value of 3250. This 650MHz LO
will effectively check the 890MHz RF channel
(FRF – FLO = FIF or FRF = FLO + FIF) When N
is incremented to 3251, the LO frequency will
now be 650.2MHz and the RF channel
checked will be 890.2MHz. This is shown
graphically in Figure 23.
Figure 23. Tuning Frequencies For GSM
Base Station Receiver

V-18
It is worth noting that, in addition to the
tunable RF LO, the receiver section also uses a
fixed IF (in the example shown this is
240MHz). Even though frequency tuning is
not needed on this IF, the PLL technique is
still used. The reason for this is that it is an
affordable way of using the stable system
reference frequency to produce the high
frequency IF signal. Several synthesizers
manufacturers recognize this fact by offering
dual versions of the devices: one operating at
the high RF frequency (>800MHz) and one
operating at the lower IF frequency (500MHz
or less).
On the transmit side of the GSM system,
similar requirements exist. However, it is
more common to go directly from Base-band
to the final RF in the Transmit Section and this
means that the typical TX VCO for a base
station has a range of 925MHz – 960MHz (RF
Band for the Transmit Section).
Circuit Example
Figure 24 shows an actual implementation of
the local oscillator for the transmit section of a
GSM base station. We are assuming direct
Base Band to RF up-conversion . This circuit
uses the ADF4111 PLL Frequency
Synthesizer from ADI and the VCO190-902T
Voltage Controlled Oscillator from Sirenza
Corporation.
Figure 24. Transmitter Local Oscillator for GSM
The reference input signal is applied to the
circuit at FREFIN and is terminated in 50V.
This reference input frequency is typically
13MHz in a GSM system. In order to have a

V-19
channel spacing of 200kHz (the GSM
standard), the reference input must be divided
by 65, using the on-chip reference divider of
the ADF4111.
The ADF4111 is an integer-N PLL frequency
synthesizer, capable of operating up to an RF
frequency of 1.2GHz. In this integer-N type
of synthesizer, N can be programmed from 96
to 262,000 in discrete integer steps. In the case
of the handset transmitter, where we need an
output range of 880MHz to 915MHz., and
where the internal reference frequency is
200kHz, the desired N values will range from
4400 to 4575.
The charge pump output of the ADF4111 (pin
2) drives the loop filter. This filter is a 1st
Order lag lead type and it represented by Z(s)
in the block diagram of Figure 2. In
calculating the loop filter component values, a
number of items need to be considered. In this
example, the loop filter was designed so that
the overall phase margin for the system would
be 45 degrees. Other PLL system
specifications are given below:
Kd = 5mA
Kv = 8.66MHz/Volt
Loop Bandwidth = 12kHz.
FREF = 200kHz
N = 4500
Extra Reference Spur Attenuation of 10dB
All of these specifications are needed and used
to come up with the loop filter components
values shown in Figure 24.
The loop filter output drives the VCO which,
in turn, is fed back to the RF input of the PLL
synthesizer and also drives the RF Output
terminal. A T-circuit configuration with 18
ohm resistors is used to provide 50 ohm
matching between the VCO output, the RF
output and the RFIN terminal of the
ADF4111.
In a PLL system, it is important to know when
the system is in lock. In Figure 6, this is
accomplished by using the MUXOUT signal
from the ADF4111. The MUXOUT pin can
be programmed to monitor various internal
signal in the synthesizer. One of these is the
LD or lock detect signal. When MUXOUT is
chosen to select Lock Detect, it can be used in
the system to trigger the output power
amplifier, for example.
The ADF4111 uses a simple 4-wire serial
interface to communicate with the system
controller. The reference counter, the N
counter and various other on-chip functions
are programmed via this interface.
Receiver Sensitivity
Receiver sensitivity is the ability of the
receiver to respond to a weak signal. Digital
receivers use maximum bit error rate (BER) at
a certain RF level to specify performance. In
general, it is possible to say that device gains,
noise figures, image noise and LO wideband
noise all combine to produce an overall
equivalent noise figure. This is then used to
calculate the overall receiver sensitivity.
Wideband noise in the LO can elevate the IF
noise level and thus degrade the overall noise
factor. For example, wideband phase noise at

V-20
FLO + FIF will produce noise products at FIF.
This directly impacts the receiver sensitivity.
This wideband phase noise is primarily
dependant on the VCO phase noise.
Close in phase noise in the LO will also
impact sensitivity. Obviously, any noise close
to FLO will produce noise products close to FIF
and impact sensitivity directly.
Receiver Selectivity
Receiver selectivity describes the tendency of
a receiver to respond to channels adjacent to
the desired reception channel. Adjacent
Channel Interference (ACI) is a commonly
used term in wireless systems which is also
used to describe this phenomenon. When
considering the LO section, the reference
spurs are of particular importance with regard
to selectivity. Figure 25 is an attempt to
illustrate how a spurious signal at the LO,
occurring at the channel spacing, can
transform energy from an adjacent radio
channel directly onto FIF. This is of particular
concern if the desired received signal is weak
and the unwanted adjacent channel is strong,
which can often be the case. So, the lower the
reference spurs in the PLL, the better it will be
for system selectivity.
Figure 25. Adjacent Channel Interference
Open Loop Modulation
Open Loop Modulation is a simple and
inexpensive way of implementing FM. It also
allows higher data rates than modulating in
closed loop mode. For FM modulation, a
closed loop method works fine but the data
rate is limited by the loop bandwidth. A
system which uses open loop modulation is
the European cordless telephone system,
DECT. The output carrier frequencies are in a
range of 1.77GHz to 1.90GHz and the data
rate is high; 1.152Mbps.
A block diagram of open loop modulation is
shown in Figure 26. The principle of
operation is as follows: The loop is closed to
lock the RF output, fOUT = N. fREF. The
modulating signal is turned on and initially the
modulation signal is simply the dc mean of the
modulation. The loop is then opened, by
putting the CP output of the synthesizer into
high-impedance mode and the modulation data
is fed to the Gaussian filter. The modulating
voltage then appears at the VCO where it is
multiplied by KV. When the data burst
finishes, the loop is returned to the closed loop
mode of operation.
Figure 26. Block Diagram of Open Loop
Modulation.

V-21
As the VCO usually has a high sensitivity
(typical figures are between 20 and
80MHz/volt) any small voltage drift before the
VCO will cause the output carrier frequency to
drift. This voltage drift and hence the system
frequency drift is directly dependant on the
leakage current of the charge pump, CP, when
in the high impedance state. This leakage will
cause the loop capacitor to charge or discharge
depending on the polarity of the leakage
current. For example, a leakage current of
1nA would cause the voltage on the loop
capacitor (1000pF for example) to charge by
dV/dT. This, in turn, would cause the VCO to
drift. So, if the loop is open for 1ms and the
KV of the VCO is 50MHz/Volt, then the
frequency drift caused by 1nA leakage into a
1000pF loop capacitor would be 50kHz. In
fact the DECT bursts are generally shorter
(0.5ms) and so the drift will be even less in
practice for the loop capacitance and leakage
current used in our example. However, the
example does serve to illustrate the
importance of Charge Pump Leakage in this
type of application
ADIsimPLL
Traditionally, PLL Synthesizer design relied
on published application notes to assist in the
design of the PLL loop filter. It was necessary
to build prototype circuits to determine key
performance parameters such as lock time,
phase noise and reference spurious levels.
Optimisation was limited to ‘tweaking’
component values on the bench and repeating
lengthy measurements. Using ADIsimPLL
both streamlines and improves upon the
traditional design process. ADIsimPLL is
extremely user friendly and easy to use.
Starting with the “new PLL wizard” a designer
constructs a PLL by specifying the frequency
requirements of the PLL, selecting an
integer_N or Fractional-N implementation and
then choosing from a library of PLL chips,
library or custom VCO data, and a loop filter
from a range of topologies. The wizard
designs a loop filter and sets up the simulation
program to display key parameters including
phase noise, reference spurs, lock time, lock
detect performance and others.
ADIsimPLL operates with spreadsheet-like
simplicity and interactivity. The full range of
design parameters such as loop bandwidth,
phase margin, VCO sensitivity and component
values can be altered with real-time update of
the simulation results. This allows the user to
easily tailor and optimise the design for their
specific requirements. Varying the bandwidth,
for example, enables the user to observe the
trade-off between lock time and phase noise in
real-time and with bench-measurement
accuracy.
ADIsimPLL includes accurate models for
phase noise, enabling reliable prediction of the
synthesizer closed-loop phase noise. Users
report excellent correlation between
simulation and measurement.
ADIsimPLL also accurately simulates locking
behaviour in the PLL, including the most
significant non-linear effects. Unlike simple

V-22
linear simulators based on Laplace transform
solutions, ADIsimPLL includes the effects of
phase detector cycle slipping, charge pump
saturation, curvature in the VCO tuning law
and the sampling nature of the phase-
frequency detector. As well as providing
accurate simulation of frequency transients,
giving detailed lock-time predictions for
frequency and phase lock, ADIsimPLL also
simulates the lock detect circuit. For the first
time, designers can easily predict how the lock
detect circuit will perform without having to
resort to measurements.
The simulation engine in ADIsimPLL is fast,
with all results typically updating
‘instantaneously’, even transient simulations.
As well as providing an interactive
environment that enables the design to be
easily optimised, it also encourages the
designer to explore the wide range of design
options and parameters available.
Contrary to the traditional methods where to
design, build and then measure parameters
takes days, ADIsimPLL enables the user to
change the PLL circuit design and observe
instantly the performance changes.
ADIsimPLL allows the designer to work at a
higher level and directly modify derived
parameters such as the loop bandwidth, phase
margin, pole locations, and the effects of the
changes on performance are shown instantly
(and without burning fingers with a soldering
iron!).
If need be the designer can work directly at the
component level and observe the effects of
varying individual component values.
ADIsimPLL Version 2 includes many
enhancements including:
- the new PLL wizard now includes a short-
form selector guide for choosing the PLL chip,
displaying short-form data for all chips, with
inbuilt links to the product pages on the
Analog Devices website.
- Similar short-form selector guides are
available for choosing the VCO device, and
these contain links to detailed device data on
vendor’s websites. The data in the selector
guides can be sorted by any parameter.
- The chip-programming assistant enables
rapid calculation of programming register
values to set the chip any specified frequency.
This is also great for checking channels that
cannot be reached due to prescaler restrictions
- The range of loop filters has been expanded
to include a 4-pole passive filter and a non-
inverting active filter. As with all loop filter
designs in ADIsimPLL, these models
accurately include the thermal noise from
resistors, the op-amp voltage and current
noise, as well as predicting reference spurs
resulting from the op-amp bias current.
- Phase jitter results can now be displayed in
degrees, seconds or Error Vector Magnitude
(EVM)
- It is now possible to simulate the power-up
frequency transient.
- Support has been included for the new
Analog Devices PLL chips with integrated
VCO’s
V-23
With traditional design techniques, the
evaluation of new devices requires
construction, measurement and hand
optimization of a prototype, which is a
significant barrier to change and is often a key
reason for the continual use of ‘old’ PLL
chips. ADIsimPLL enables the rapid and
reliable evaluation of new high performance
PLL products from ADI. ADIsimPLL is the
most comprehensive PLL Synthesizer design
and simulation tool available today.
Simulations performed in ADIsimPLL include
all key non-linear effects that are significant in
affecting PLL performance. ADIsimPLL
removes at least one iteration from the design
process, thereby speeding the design- to-
market.
With ADIsimPLL you will get most PLL
Synthesizer designs right first time - even the
tough ones!
Download your ADIsimPLL Software from
http://www.analog.com/pll

V-24
The ADI Synthesizer Family
Figure 27. Block Diagram for the ADF4106
Below is a listing of the current ADI
synthesizer family. In includes both single
and dual integer-N and fractional-N devices. It
also includes the new integrated VCO family
(ADF4360 family).
ADF4110 Family Single Proprietary Integer-N Synthesizers
ADF4001 This single synthesizer operates up to 200 MHz
ADF4110 This single synthesizer operates up to 550 MHz
ADF4111 This single synthesizer operates up to 1.2 GHz
ADF4112 This single synthesizer operates up to 3.0 GHz.
ADF4113 This single synthesizer operates up to 3.8 GHz.
ADF4106 This single synthesizer operates up to 6.0 GHz
ADF4107 This single synthesizer operates up to 7.0 GHz
ADF4007 This single synthesizer operates up to 7.5 GHz
ADF4116 Family Single Second Source Integer-N Synthesizers
ADF4116 This single synthesizer operates up to 550 MHz. It is a second
source to the LMX2306.
ADF4117 This single synthesizer operates up to 1.2 GHz. It is a second
source to the LMX2316 .

V-25
ADF4118 This single synthesizer operates up to 3.0 GHz. It is a second
source to the LMX2326.
ADF4212L Dual Proprietary Integer-N Synthesizer
ADF4212L This dual synthesizer operates up to 510 MHz/2.4 GHz
ADF4218L Dual Second Source Integer-N Synthesizer
ADF4218L This dual synthesizer operates up to 510 MHz/ 3.0 GHz. It is a
second source to the LMX2330L from National Semiconductor.
ADF4153 Family Single Proprietary Fractional-N Synthesizer
ADF4153 This single synthesizer operates up to 4.0 GHz (16-pin package).
ADF4154 This single synthesizer operates up to 4.0 GHz (16-pin package).
ADF4156 This single synthesizer operates up to 6.4 GHz (16-pin package).
ADF4252 Dual Proprietary Fractional-N/Integer-N Synthesizer
ADF4252 This dual synthesizer operates up to 550MHz (Integer)/3.0 GHz
(Fractional).
ADF4360 Family Single Proprietary Integrated PLL Synthesizer and VCO
ADF4360-0 This single synthesizer operates from 2400 MHz to 2725 MHz
ADF4360-1 This single synthesizer operates from 2050 MHz to 2450 MHz
ADF4360-2 This single synthesizer operates from 1850 MHz to 2150 MHz
ADF4360-3 This single synthesizer operates from 1600 MHz to 1950 MHz
ADF4360-4 This single synthesizer operates from 1450 MHz to 1750 MHz
ADF4360-5 This single synthesizer operates from 1200 MHz to 1400 MHz
ADF4360-6 This single synthesizer operates from 1050 MHz to 1250 MHz
ADF4360-7 This single synthesizer operates from 350 MHz to 1800 MHz
ADF4360-8 This single synthesizer operates from 65 MHz to 400 MHz
References
1. Mini-Circuits Corporation, "VCO Designers Handbook", 1996.
2. L.W. Couch, "Digital and Analog Communications Systems" Macmillan Publishing
Company, New York, 1990.
3. P. Vizmuller, "RF Design Guide", Artech House, 1995.
V-26
4. R.L. Best, "Phase Locked Loops: Design, Simulation and Applications", 3rd
Edition, McGraw Hill, 1997.
5. Brendan Daly, Comparing Integer-N And Fractional-N Synthesizers, Microwaves &
RF, September 2001.
6. D.E. Fague, “Open Loop Modulation of VCOs for Cordless Telecommunications”,
RF Design, July 1994
Top Related