


Languages
Pages
Legal

+
The Practice of Statistics, 4th edition - For AP*
STARNES, YATES, MOORE
Chapter 1: Exploring Data Introduction
Data Analysis: Making Sense of Data

+ Chapter 1
Exploring Data
Introduction: Data Analysis: Making Sense of Data
1.1 Analyzing Categorical Data
1.2 Displaying Quantitative Data with Graphs
1.3 Describing Quantitative Data with Numbers
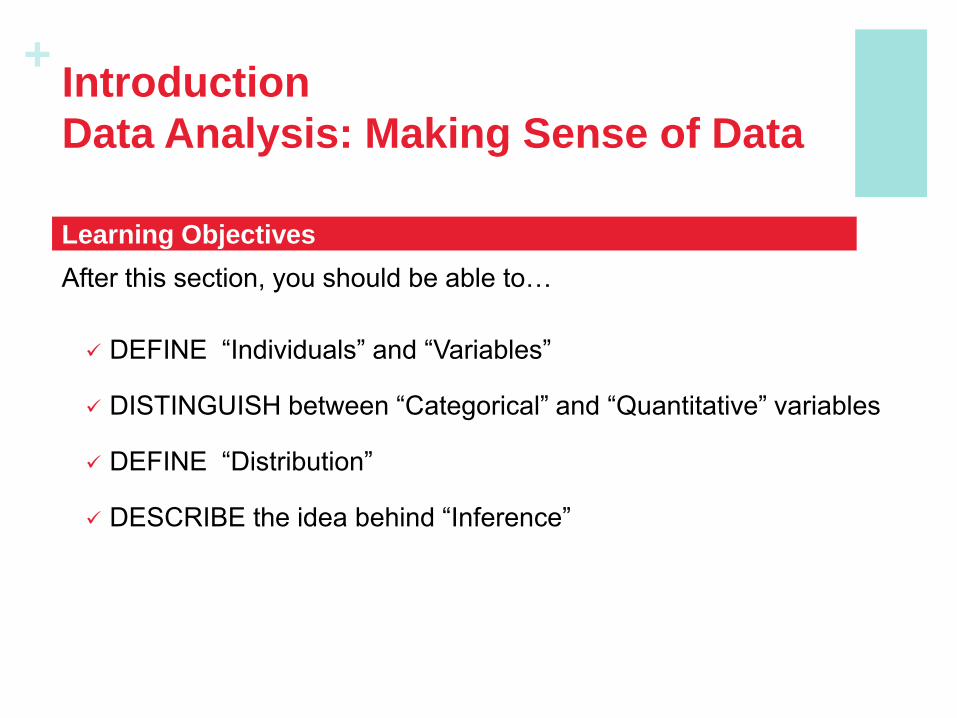
+ Introduction
Data Analysis: Making Sense of Data
After this section, you should be able to…
DEFINE “Individuals” and “Variables”
DISTINGUISH between “Categorical” and “Quantitative” variables
DEFINE “Distribution”
DESCRIBE the idea behind “Inference”
Learning Objectives

+
Data
Analy
sis
Statistics is the science of data.
Data Analysis is the process of organizing,
displaying, summarizing, and asking questions
about data.
Definitions:
Individuals – objects (people, animals, things)
described by a set of data
Variable - any characteristic of an individual
Categorical Variable
– places an individual into
one of several groups or
categories.
Quantitative Variable
– takes numerical values for
which it makes sense to find
an average.
+
Data
Analy
sis
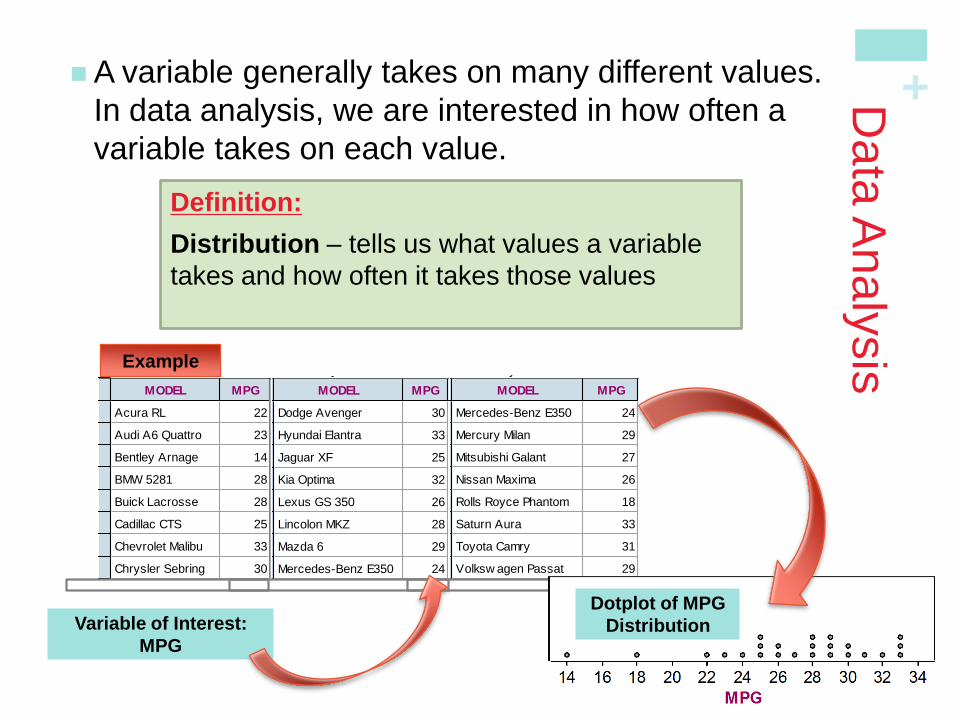
A variable generally takes on many different values.
In data analysis, we are interested in how often a
variable takes on each value.
Definition:
Distribution – tells us what values a variable
takes and how often it takes those values
2009 Fuel Economy Guide
MODEL MPG
1
2
3
4
5
6
7
8
9
Acura RL 22
Audi A6 Quattro 23
Bentley Arnage 14
BMW 5281 28
Buick Lacrosse 28
Cadillac CTS 25
Chevrolet Malibu 33
Chrysler Sebring 30
Dodge Avenger 30
2009 Fuel Economy Guide
MODEL MPG <new>
9
10
11
12
13
14
15
16
17
Dodge Avenger 30
Hyundai Elantra 33
Jaguar XF 25
Kia Optima 32
Lexus GS 350 26
Lincolon MKZ 28
Mazda 6 29
Mercedes-Benz E350 24
Mercury Milan 29
2009 Fuel Economy Guide
MODEL MPG <new>
16
17
18
19
20
21
22
23
24
Mercedes-Benz E350 24
Mercury Milan 29
Mitsubishi Galant 27
Nissan Maxima 26
Rolls Royce Phantom 18
Saturn Aura 33
Toyota Camry 31
Volksw agen Passat 29
Volvo S80 25
Variable of Interest:
MPG
Dotplot of MPG
Distribution
Example
+
Data
Analy
sis
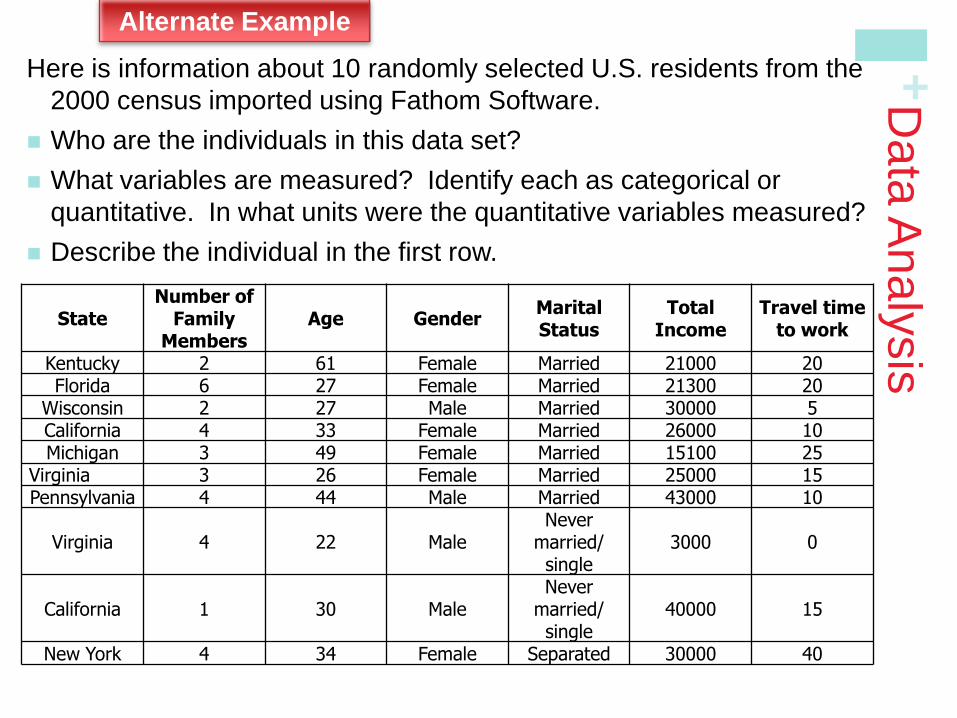
Here is information about 10 randomly selected U.S. residents from the
2000 census imported using Fathom Software.
Who are the individuals in this data set?
What variables are measured? Identify each as categorical or
quantitative. In what units were the quantitative variables measured?
Describe the individual in the first row.
Alternate Example
State Number of
Family Members
Age Gender Marital Status
Total Income
Travel time to work
Kentucky 2 61 Female Married 21000 20 Florida 6 27 Female Married 21300 20
Wisconsin 2 27 Male Married 30000 5 California 4 33 Female Married 26000 10 Michigan 3 49 Female Married 15100 25
Virginia 3 26 Female Married 25000 15 Pennsylvania 4 44 Male Married 43000 10
Virginia 4 22 Male Never
married/ single
3000 0
California 1 30 Male Never
married/ single
40000 15
New York 4 34 Female Separated 30000 40
+
2009 Fuel Economy Guide
MODEL MPG <new>
9
10
11
12
13
14
15
16
17
Dodge Avenger 30
Hyundai Elantra 33
Jaguar XF 25
Kia Optima 32
Lexus GS 350 26
Lincolon MKZ 28
Mazda 6 29
Mercedes-Benz E350 24
Mercury Milan 29
2009 Fuel Economy Guide
MODEL MPG <new>
16
17
18
19
20
21
22
23
24
Mercedes-Benz E350 24
Mercury Milan 29
Mitsubishi Galant 27
Nissan Maxima 26
Rolls Royce Phantom 18
Saturn Aura 33
Toyota Camry 31
Volksw agen Passat 29
Volvo S80 25
2009 Fuel Economy Guide
MODEL MPG
1
2
3
4
5
6
7
8
9
Acura RL 22
Audi A6 Quattro 23
Bentley Arnage 14
BMW 5281 28
Buick Lacrosse 28
Cadillac CTS 25
Chevrolet Malibu 33
Chrysler Sebring 30
Dodge Avenger 30
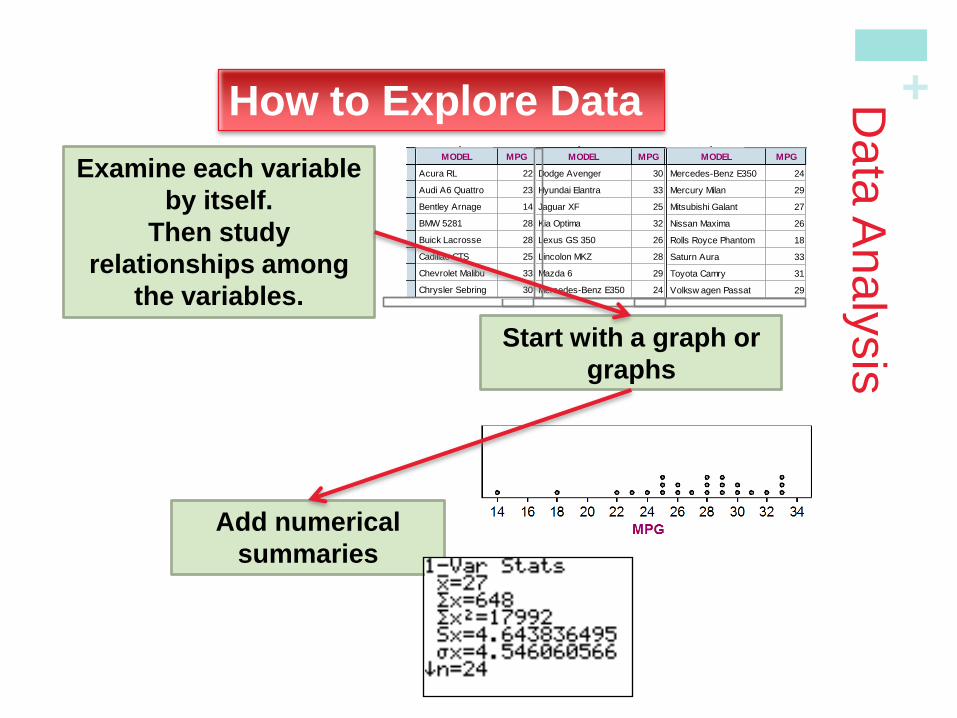
Add numerical
summaries
Data
Analy
sis
Examine each variable
by itself.
Then study
relationships among
the variables.
Start with a graph or
graphs
How to Explore Data
+
Data
Analy
sis
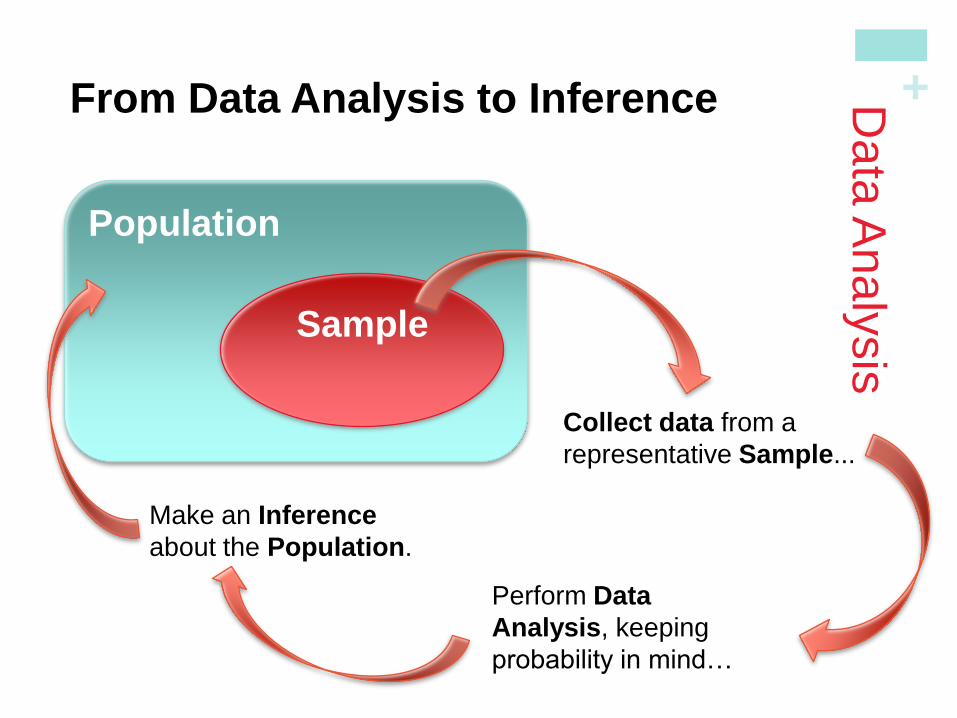
From Data Analysis to Inference
Population
Sample
Collect data from a
representative Sample...
Perform Data
Analysis, keeping
probability in mind…
Make an Inference
about the Population.
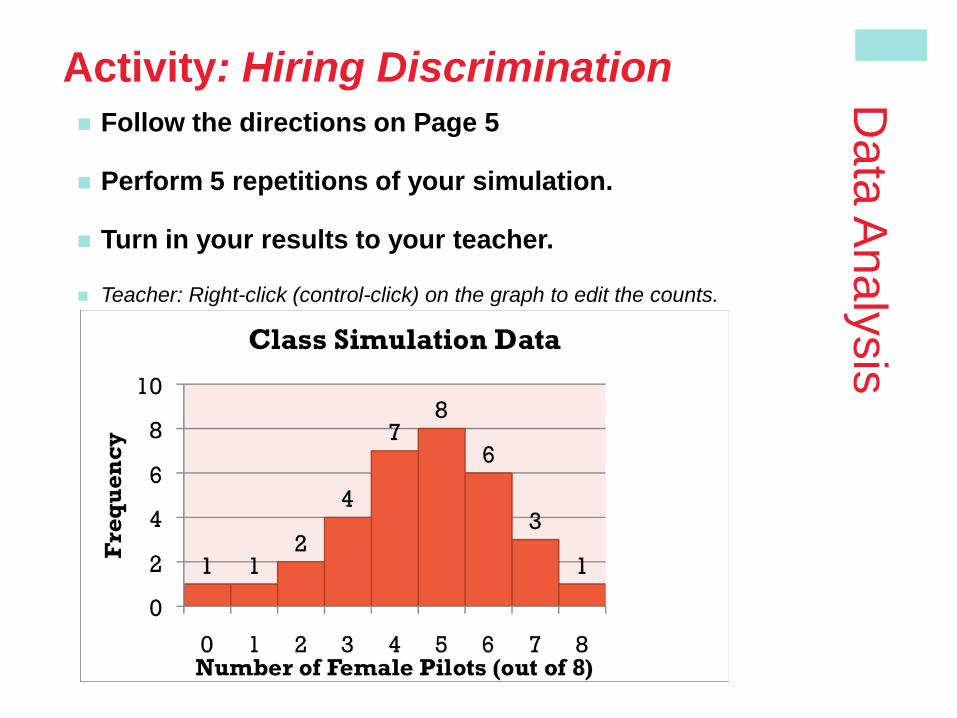
Activity: Hiring Discrimination Follow the directions on Page 5
Perform 5 repetitions of your simulation.
Turn in your results to your teacher.
Teacher: Right-click (control-click) on the graph to edit the counts.
Data
Analy
sis

+ Introduction
Data Analysis: Making Sense of Data
In this section, we learned that…
A dataset contains information on individuals.
For each individual, data give values for one or more variables.
Variables can be categorical or quantitative.
The distribution of a variable describes what values it takes and how often it takes them.
Inference is the process of making a conclusion about a population based on a sample set of data.
Summary
+ Looking Ahead…
We’ll learn how to analyze categorical data.
Bar Graphs
Pie Charts
Two-Way Tables
Conditional Distributions
We’ll also learn how to organize a statistical problem.
In the next Section…
Top Related