


Languages
Pages
Legal


Changes in the distribution of red foxes (Vulpes vulpes) in urban areas in Great Britain: findings and limitations of a mediadriven nationwide survey Article
Published Version
Creative Commons: Attribution 3.0 (CCBY)
Open Access
Scott, D. M., Berg, M. J., Tolhurst, B. A., Chauvenet, A. L. M., Smith, G. C., Neaves, K., Lochhead, J. and Baker, P. J. (2014) Changes in the distribution of red foxes (Vulpes vulpes) in urban areas in Great Britain: findings and limitations of a mediadriven nationwide survey. PLoS ONE, 9 (6). e99059. ISSN 19326203 doi: https://doi.org/10.1371/journal.pone.0099059 Available at http://centaur.reading.ac.uk/37315/
It is advisable to refer to the publisher’s version if you intend to cite from the work. Published version at: http://europepmc.org/articles/PMC4053368
To link to this article DOI: http://dx.doi.org/10.1371/journal.pone.0099059
Publisher: Public Library of Science
All outputs in CentAUR are protected by Intellectual Property Rights law, including copyright law. Copyright and IPR is retained by the creators or other copyright holders. Terms and conditions for use of this material are defined in

the End User Agreement .
www.reading.ac.uk/centaur
CentAUR
Central Archive at the University of Reading
Reading’s research outputs online

Changes in the Distribution of Red Foxes (Vulpes vulpes)in Urban Areas in Great Britain: Findings and Limitationsof a Media-Driven Nationwide SurveyDawn M. Scott1*, Maureen J. Berg1, Bryony A. Tolhurst1, Alienor L. M. Chauvenet2, Graham C. Smith2,
Kelly Neaves3, Jamie Lochhead3, Philip J. Baker4
1 Biology and Biomedical Sciences Division, University of Brighton, Brighton, East Sussex, United Kingdom, 2 National Wildlife Management Centre, Animal Health and
Veterinary Laboratories Agency, York, Yorkshire, United Kingdom, 3 Windfall Films, London, United Kingdom, 4 School of Biological Sciences, University of Reading,
Reading, Berkshire, United Kingdom
Abstract
Urbanization is one of the major forms of habitat alteration occurring at the present time. Although this is typicallydeleterious to biodiversity, some species flourish within these human-modified landscapes, potentially leading to negativeand/or positive interactions between people and wildlife. Hence, up-to-date assessment of urban wildlife populations isimportant for developing appropriate management strategies. Surveying urban wildlife is limited by land partition andprivate ownership, rendering many common survey techniques difficult. Garnering public involvement is one solution, butthis method is constrained by the inherent biases of non-standardised survey effort associated with voluntary participation.We used a television-led media approach to solicit national participation in an online sightings survey to investigatechanges in the distribution of urban foxes in Great Britain and to explore relationships between urban features and foxoccurrence and sightings density. Our results show that media-based approaches can generate a large national database onthe current distribution of a recognisable species. Fox distribution in England and Wales has changed markedly within thelast 25 years, with sightings submitted from 91% of urban areas previously predicted to support few or no foxes. Data werehighly skewed with 90% of urban areas having ,30 fox sightings per 1000 people km22. The extent of total urban area wasthe only variable with a significant impact on both fox occurrence and sightings density in urban areas; longitude andpercentage of public green urban space were respectively, significantly positively and negatively associated with sightingsdensity only. Latitude, and distance to nearest neighbouring conurbation had no impact on either occurrence or sightingsdensity. Given the limitations associated with this method, further investigations are needed to determine the associationbetween sightings density and actual fox density, and variability of fox density within and between urban areas in Britain.
Citation: Scott DM, Berg MJ, Tolhurst BA, Chauvenet ALM, Smith GC, et al. (2014) Changes in the Distribution of Red Foxes (Vulpes vulpes) in Urban Areas in GreatBritain: Findings and Limitations of a Media-Driven Nationwide Survey. PLoS ONE 9(6): e99059. doi:10.1371/journal.pone.0099059
Editor: Zoe G. Davies, University of Kent, United Kingdom
Received August 3, 2013; Accepted May 10, 2014; Published June 11, 2014
Copyright: � 2014 Scott et al. This is an open-access article distributed under the terms of the Creative Commons Attribution License, which permitsunrestricted use, distribution, and reproduction in any medium, provided the original author and source are credited.
Funding: The research was funded by Channel 4. The funders had input into the final web site design which aided data collection, however the funders had norole in data analysis or preparation of the manuscript.
Competing Interests: The authors declare that the co-authors Jamie Lochhead and Dr Kelly Neaves are affiliated to Windfall Films. The authors declare thatChannel 4 was a commercial funder of the project. However, this does not alter their adherence to all the PLOS ONE policies on sharing data and materials.
* E-mail: [email protected]
Introduction
The world is becoming increasingly urbanized to accommodate
the growing human population [1]. In general terms, urbanization
leads to the fragmentation and degradation of natural habitats,
typically resulting in negative effects on biodiversity [2] [3] [4] and
ecosystem services [5]. However, some species can benefit from
urbanization by exploiting new habitats and the resources therein
[6] [7]. Carnivores considered to be ‘urban exploiters’ are typically
medium-sized, dietary generalists that have high reproductive
potential and are behaviourally flexible [8] [7]. Such species
benefit from the increased availability of anthropogenic food
sources and refugia [9], and can reach higher population densities
in urban areas than in rural habitats [7] [10]. Living at high
densities in close proximity to one another can, however, affect
both humans and carnivores. For example, conflicts can arise as a
consequence of noise disturbance and damage to property [3] [11]
[12]; actual or perceived injuries to people or companion animals
[3] [13] [14]; and concerns regarding the transmission of zoonoses
[15] [16] or veterinary diseases [17] [18]. Yet, contact with nature
can also have positive benefits for human health and well-being
[19] [20] [21] and, in many parts of the world, urban residents
seek to engage with the wildlife around them, for example, by
providing food for garden visitors [9] [22]. Urban wildlife also
provide ecosystem services and maintain ecological processes [7]
[23]. Timely assessment of urban wildlife populations is thus
important for monitoring their benefits and for conflict mitigation
and resolution.
The red fox (Vulpes vulpes) is globally the most widespread wild
terrestrial carnivore [24]. In the last century, this species has
colonized urban areas within Europe, Australia, the USA, Canada
and Japan [6] [10] [15] [25][26]. It is found throughout mainland
rural Britain and was first reported to be resident in urban areas in
southern England during the 1930s [27]. Historically, there has
been a strong latitudinal and longitudinal bias in the occurrence of
PLOS ONE | www.plosone.org 1 June 2014 | Volume 9 | Issue 6 | e99059

Distribution of Red Foxes in Urban Areas in Great Britain
PLOS ONE | www.plosone.org 2 June 2014 | Volume 9 | Issue 6 | e99059
foxes in English towns and cities, being more common in southern
regions and rarer in northern and eastern urban areas [28][29],
most likely influenced by the availability of suitable suburban
habitats [30].
Urban fox densities typically range from 2–12 adults km22 [31],
but can occasionally exceed 30 km22 [10]. In the mid-1990s, the
pre-breeding urban population in Britain was estimated as 33,000
individuals [30] [27]. Since the mid-1990s, however, there has
been mounting evidence that urban fox numbers and distribution
are likely to have changed including: localized increases in density
in response to anthropogenic feeding [10] [32]; an outbreak of
sarcoptic mange (Sarcoptes scabiei) that reduced fox density by .
95% in some areas [10] [33]; the colonization of some cities and
towns, including some previously considered unsuitable for foxes
[34]; and the general expansion and changing structure of urban
areas in response to a growing human population and changes in
its socioeconomic profile [3] [35]. During this period there have
also been several widely-publicized incidents of foxes allegedly
biting people [36] and other incidents of conflict, which have led
to calls for the implementation of management, as well as
increased scientific and public interest in identifying changes in
urban fox populations over the course of the last 25 years. In
addition, because of their potential role as a vector in disease
transmission, monitoring their geographic spread and abundance
remains of paramount importance [37].
Quantifying the density and distribution of urban wildlife does,
however, pose a number of logistical problems, principally because
most land is privately-owned making it difficult to use conventional
survey techniques. In contrast, the presence of humans at survey
locations lends itself to the use of questionnaire surveys and
‘‘citizen science’’ based approaches have been used successfully to
monitor urban wildlife [38]. Questionnaire surveys can be a
powerful research tool for quantifying species’ distributions across
large geographic scales within urban [3,39,40] and other [41,42]
habitats [43]. Historically, participants have most frequently been
recruited using postal surveys [43], but these can be labour-
intensive and expensive [44]. In the modern era, web-based
questionnaires potentially represent a more efficient approach for
conducting large-scale surveys with significant logistical and cost
advantages [45] [46]. However, they are potentially associated
with some of the limitations evident in other approaches (e.g., non-
random recruitment of participants, reliability of information
supplied [43]) in addition to other issues [45]. For example, it is
often difficult to target residents in specific areas, such that
obtaining information from a representative random sample of
people across the entire geographical range of a species can be
problematic [47]. Despite this, participant recruitment and
geographical reach can both be increased via media coverage
[48]. Consequently, web-based questionnaires conducted in
conjunction with national media could be an efficient way to
obtain current data on a species’ distribution over a wide
geographic area.
In this study, we assessed the current distribution of urban red
foxes in Great Britain (GB) using sightings submitted by the
general public via a web-based questionnaire associated with a
national television program. These data were used to identify
changes in the geographic spread of foxes in urban areas and to re-
assess the validity of predictive distribution models produced 25
years ago [29–31,49]. We also explored the relationship between
urban features and fox occurrence and sightings density.
Specifically we tested whether occurrence and sightings density
were (1) lower in northern urban areas [34]; (2) higher in larger
urban areas as these are more likely to contain larger suburban
zones (i.e. houses and adjacent gardens that are preferred by this
species) [31]; (3) lower in urban areas with a higher percentage of
public green space as these areas are not typically favoured by
foxes because of the lack of secure refugia and high levels of
disturbance; and (4) higher in urban areas with closer neighbour-
ing cities, since isolated conurbations may experience lower rates
of dispersal from existing populations. We also investigated
whether the density of fox sightings reflected expected patterns
in the relative density of urban fox populations based upon
predictive models developed in the 1980s [29]. Finally, we discuss
the limitations of this media-based citizen science approach for
surveying urban fox populations.
Methods
Ethical ApprovalThe project was approved by The Pharmacy and Biomedical
Sciences School Ethics Committee of The University of Brighton
on 23rd April 2012 (Approval code: 1138). Project entitled:
‘Attitudes towards foxes in an urban environment’; investigator:
Dr. Dawn Scott. Sightings data were submitted anonymously and
publicly volunteered.
The study areaGreat Britain consists of England, Wales and Scotland. It covers
229,848 km2 of which 6.3% (14,546 km2) was classified as urban
based on the 2001 urban boundaries of conurbations containing $
20,000 people [50]. The UK (GB and Northern Ireland) human
population is projected to increase from 62.3 million in 2010 to
67.2 million by 2020; of these, .80% will live in urban areas [51].
Data collection and participant recruitmentBetween 29th April and 14th May 2012, the British public were
asked to submit the date, time and location of any direct visual
sightings of red foxes in urban areas during 2012 via a website
produced in association with a nationwide series of television
programs called ‘‘Foxes live: wild in the city’’ on Channel 4, one of
the major terrestrial broadcasters. Accompanying images could be
submitted with sightings records. The first one-hour program was
broadcast on the 29th April 2012 at 8pm. This was followed by a
series of six 1-minute programs in the following week at
approximately 6pm, concluding with three one-hour programmes
at 8pm on 7th, 8th and 9th May. Online submission via the website
(http://foxes.channel4.com/) closed on midnight of the 14th May
2012. An interactive link with Google maps enabled accurate geo-
referencing of submitted information. Sightings were checked for
errors in date and location and any obviously erroneous data (e.g.,
located off-shore) were removed prior to analysis. As our focus was
on foxes in urban areas, any sightings originating from non-urban
locations were also excluded.
Patterns in urban fox distribution and densityUrban fox sightings were mapped using Arc GIS 10 [52]. Initial
urban boundaries were defined using the most up-to-date urban
boundary data set (Census 2001 Urban Areas) [50]; urban areas
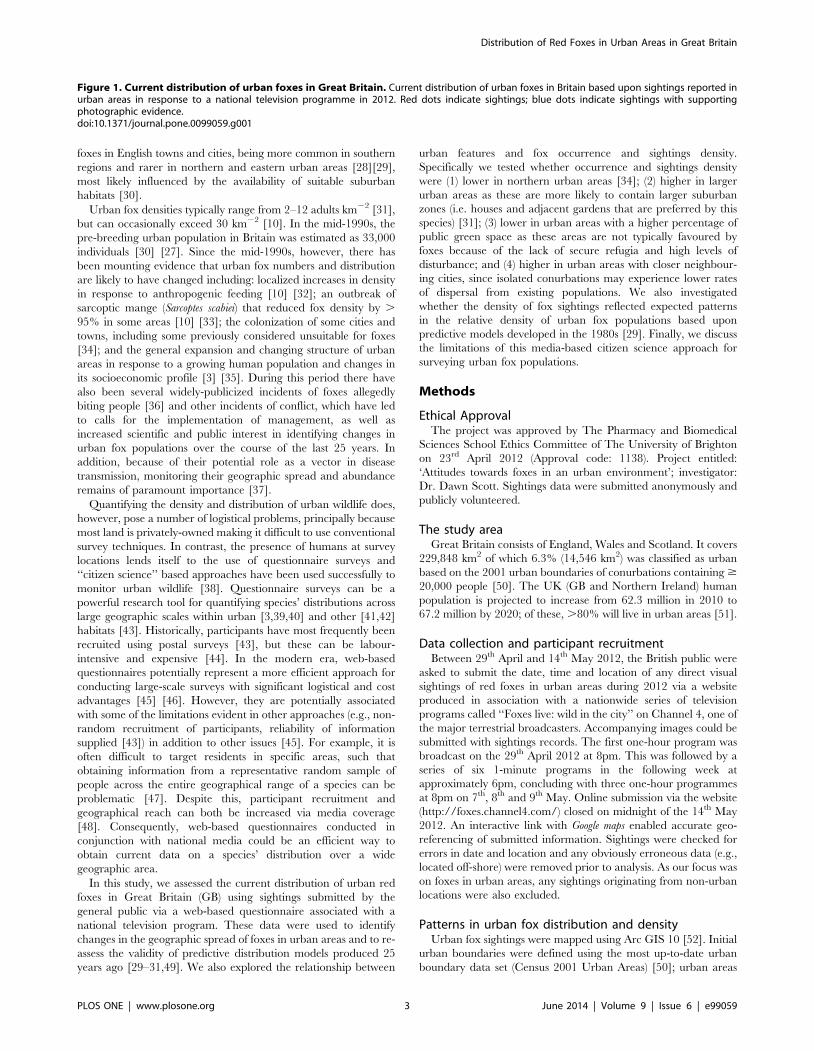
Figure 1. Current distribution of urban foxes in Great Britain. Current distribution of urban foxes in Britain based upon sightings reported inurban areas in response to a national television programme in 2012. Red dots indicate sightings; blue dots indicate sightings with supportingphotographic evidence.doi:10.1371/journal.pone.0099059.g001
Distribution of Red Foxes in Urban Areas in Great Britain
PLOS ONE | www.plosone.org 3 June 2014 | Volume 9 | Issue 6 | e99059

Distribution of Red Foxes in Urban Areas in Great Britain
PLOS ONE | www.plosone.org 4 June 2014 | Volume 9 | Issue 6 | e99059
were defined as conurbations with populations of $20,000 people.
These boundaries were used to identify the broad-scale distribu-
tion of foxes in urban areas across Britain.
However, since the frequency of sightings needs to be corrected
for human density, a second more precise urban layer was created
using a more restricted definition of urban extent and which
focussed only on England and Wales to increase comparability
with previous analyses [30]. A map of administrative urban areas
was created using the lower layer super output area 2011
shapefiles from the Office of National Statistics (ONS) [51], the
mid-2010 ONS population survey [53] and the 2007 Land Cover
map (LCM 2007 [54]). Polygons in which the total human density
was $1000 people km22 were identified and conurbations defined
as groups of these contiguous polygons. Conurbations with ,
30,000 people were removed. The 1 km resolution land cover
raster layer (LCM 2007) was then superimposed onto the map of
administrative urban areas and cells not classified as urban or
suburban (land cover classes 22 and 23) were removed. A grid with
a 262 km resolution was then applied using the fishnet tool in Arc
GIS 10: grid cells were retained if the centre of the 4 km2 area fell
within an administrative urban area. This resulted in 144 towns
and cities (hereafter ‘‘conurbations’’) across England and Wales
(see Table S1).
Total urban area (km2), total human population, human
density, fox sightings density, latitude, longitude and Euclidean
distance to nearest neighbour (calculated from the midpoint of
each conurbation) were calculated for each town and city. The
three latter measures were calculated based on the recorded
location of cities in the OS OpenData Stategi settlement data set
(www.ordnancesurvey.co.uk). To estimate the proportion of semi-
natural habitats in each conurbation, our map of urban areas was
superimposed onto one created by Richardson and Mitchell (2010)
which map used the Generalised Land Use Database (GLUD;
England) and the Coordination of Information on the Environ-
ment (CORINE; England and Wales) to determine the area of
green space (.5 m2 excluding residential gardens) in conurbations
calculated at the level of electoral wards [55]. The percentage of
green space in wards that intersected each conurbation was then
calculated. Observed fox sightings density was corrected for
‘‘survey effort’’ by dividing by human density (hereafter ‘‘sightings
density’’).
To quantify changes in urban fox distribution over the last 25
years, and to determine if sightings density concurred with
predictive models developed in the 1980s, we compared our data
with those of Harris and Smith (1987) [30]. In particular, we: (a)
calculated the proportion of cities (n = 65) that were deemed to
have zero or very low fox densities in the 1980s [30], but which
had sightings submitted in 2012; and examined whether there was
a correlation between current sightings density and (b) mean fox
density (family groups km22) as determined in 14 ‘predictor’ cities
by Harris and Smith (1987) and (c) predicted mean fox density in a
subset of 55 cities estimated using a habitat suitability model
developed by these authors [30]. In addition, 2012 data recorded
for Scotland were compared to data collected during a 2006 local
authority questionnaire survey of Scottish cities [56].
The impact of latitude, longitude, extent of (log-transformed)
urban area, distance to nearest neighbouring city, the percentage
of green space, and the interaction between extent of urban area
and percentage of green space on sightings density were
investigated using multivariate models in R (v3.0.2) [57]. Sightings
density was distributed as a zero-inflated continuous variable, a
type of distribution for which there is no standard analytical
approach and for which transformation is unlikely to normalise the
data. Therefore, we followed a two-step procedure similar to that
for analysing zero-inflated count data. Firstly, the sightings data
were converted to a binomial response variable (foxes present or
absent) and investigated the probability of fox presence using a
generalised linear model with a binomial error structure. Secondly,
conurbations with a sightings density of zero were removed and
the remaining data normalised using a log-transformation: linear
regression was then used to investigate factors affecting sightings
density given that it was greater than zero. We initially investigated
the presence of spatial autocorrelation in both the binary variable
(presence/absence) and the sightings density variable using
permutation tests for Moran’s I and Geary C’s statistics (package
spdep in R [58]). This involved creating a connectivity matrix
between each point of the datasets. Several maximum distances
between connected points were tested (i.e. 1, 5 and 10 km) and the
most appropriate connectivity matrix was identified. The matrix
was then weighted based on spatial interactions [59]. Because we
had no a priori knowledge of the shape of these interactions, we ran
permutation tests using the matrix weighted by all available
specifications in the package spdep (1000 simulations). If spatial
autocorrelation was evident in the data, Moran eigenvectors that
model positive correlation (MEM method; see [60]) were used as
covariates in the regressions [59].
For both statistical procedures, Akaike’s Information Criterion
for small datasets (AICc) [61] was used to rank models and create a
set of candidate models that best explained the data: we considered
models that contributed to 95% of the cumulative weight as
plausible and used model averaging across the set to estimate
parameter values [58]. To assess model fit, we used goodness-of-fit
testing and calculation of over-dispersion metrics for the gener-
alised linear models and inspected patterns of the residuals for
linear models. Predictor variables that were found to be important
in both the binomial regression and the linear regression were
considered potentially important for explaining patterns of
occurrence.
Results
Viewing figures for the first television broadcast were estimated
as 1.9 million (Channel 4 pers. comm.), equivalent to 3.0% of the
British population [53]. Overall, 17,477 sightings were submitted
during the 15-day period: 55 records were excluded due to errors
in date and/or location; 15,705 records were from urban areas
and, of these, 2808 (17.9%) had photos or images of foxes
attached. Sightings spanned the period January 18th to May 14th
2012 inclusive, with 47.0% of sightings occurring between
19:00BST and midnight.
Patterns in urban fox distributionAll English and Scottish conurbations previously reported to
have urban fox populations [30] [34] were identified in the current
survey i.e. no established fox populations had disappeared
(Figure 1). However, it is clear that the geographic extent of foxes
in urban areas has increased since 1987 and further since 2001,
with foxes sighted in many northern and eastern conurbations
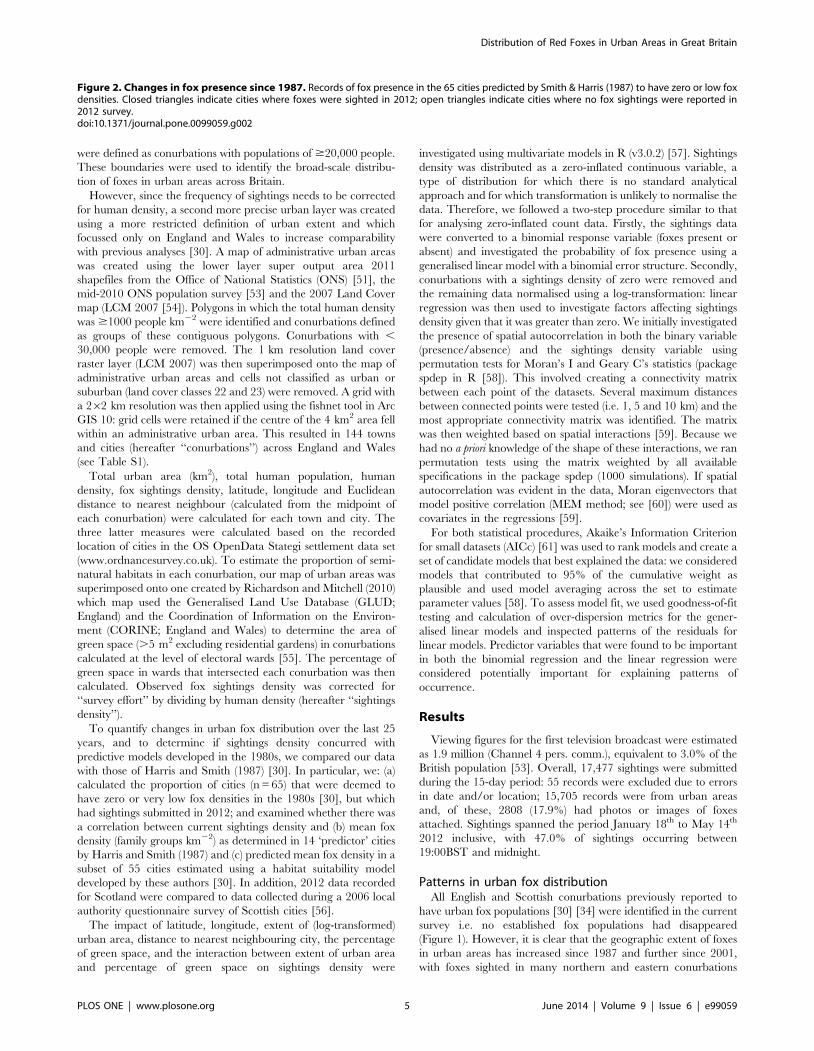
Figure 2. Changes in fox presence since 1987. Records of fox presence in the 65 cities predicted by Smith & Harris (1987) to have zero or low foxdensities. Closed triangles indicate cities where foxes were sighted in 2012; open triangles indicate cities where no fox sightings were reported in2012 survey.doi:10.1371/journal.pone.0099059.g002
Distribution of Red Foxes in Urban Areas in Great Britain
PLOS ONE | www.plosone.org 5 June 2014 | Volume 9 | Issue 6 | e99059

Distribution of Red Foxes in Urban Areas in Great Britain
PLOS ONE | www.plosone.org 6 June 2014 | Volume 9 | Issue 6 | e99059

where they had previously been absent (Figure 2). Of the 65 cities
reported to have few or no foxes present in 1987 59 (90.8%) had
sightings submitted in 2012. Consequently, there is now little
apparent longitudinal or latitudinal pattern in occurrence.
Sightings in Scottish towns and cities were similar to those
reported in 2006 [56].
The majority of conurbations had a low sightings density
(Figure 3): 40.3% had ,2 fox sightings per 1000 people km22 and
90.3% had ,30 fox sightings per 1000 people km22. Due to
recent amalgamations of urban areas (Birmingham, Dudley,
Solihull, Walsall and Wolverhampton), only eight of the 14
predictor cities in [30] were directly comparable to the conurba-
tions identified in this study (Bath, Bournemouth/Poole, Bristol,
Cheltenham, Coventry, Gloucester, Leicester, Nottingham). Based
on these eight locations, there was no significant correlation
between mean fox density (family groups km22) [30] and sightings
density (Pearson’s correlation: r = 0.302, p = 0.430).
Similarly, directly comparable data were only available for 15
cities where mean fox density had been estimated by Harris and
Smith (1987) [30]. Predicted mean fox density was not significantly
correlated with sightings density (Pearson’s correlation: r = 0.142,
p = 0.615).
Probability of fox presence in conurbationsWe found no evidence of spatial autocorrelation in the binary
variable (n = 144; optimal neighbouring distance 1 km); for both
permutation tests and all weighting specifications, p-values were .
0.5. We therefore did not need to account for spatial autocorre-
lation in further analyses of presence/absence data.
Twelve models plausibly fitted the presence/absence data and
all possible covariates appeared at least once in the candidate set.
For each plausible model, the dispersion parameter was ,1.06
indicating little over-dispersion in the data. Moreover, no
candidate models showed evidence of a poor fit using the un-
weighted sums of squares (all P-values .0.31). We thus proceeded
with model averaging across the 12 models (Table 1). The only
covariate for which 95% confidence intervals did not include zero
was the extent of the urban area: foxes were more likely to have
been reported in larger cities.
Correlates of sightings densitySimilarly, there was no evidence of spatial autocorrelation in the
non-zero sightings data (n = 129; optimal neighbouring distance
1 km); for both permutation tests and all weighting specifications,
p-values were .0.7. Consequently, there was no need to account
for spatial autocorrelation in further analyses of these data.
Six candidate models were identified, which contained each
explanatory variable at least once. Visual examination of plots of
model residuals versus both fitted and leverage values showed very
little pattern, indicating that they were a good fit to the data.
Model averaged values indicated that urban area (on the log scale),
longitude and percentage of public green space all had a 95%
confidence interval that did not include zero (Table 2): urban
extent and longitude were positively related, while percentage of
public green space was negatively related, to non-zero sightings
density.
Discussion
Colonisation of conurbations by foxesAs evident from earlier studies [34] [40], the distribution of
urban foxes in Great Britain appears to have changed markedly in
the last 25 years. For example, sightings were recorded from 91%
of 65 cities where they had previously been considered rare or
absent in an earlier study in the 1980s [30]. Consequently, the
historic north/south divide in the presence of foxes in urban areas
is now less pronounced. The reasons associated with this
expansion are, however, unclear.
Although several studies have considered the factors associated
with contemporary colonisations of urban habitats by birds (e.g.,
[62,63]), there are comparatively few data for mammals [64] [7].
Colonisation is likely to be a multi-faceted process involving, at the
most basic level, the availability of suitable habitats within the new
location(s) and a source population of individuals capable of
moving into those areas.
Although some public green spaces, such as woodlands, may be
favoured by low-density populations [65], established urban fox
populations tend to exhibit a strong preference for residential
gardens, particularly medium-sized gardens associated with low-
density housing constructed in the inter-war years [30]. This is
likely to explain the observed negative relationship between
sightings density and public green spaces, as residential green
spaces would provide greater opportunities for both refugia and
food resources in comparison to large open spaces, such as
amenity grasslands. Therefore, one possible explanation for the
observed changes in occurrence could be that the infrastructure of
recently colonized locations has changed to more closely match
that present in cities where foxes have been present for longer [31].
Yet the majority of development in Britain in this time period has
been associated with changes that are not likely to have been
beneficial for foxes e.g., in-filling of existing gardens (‘‘garden
grabbing’’), the re-use of derelict land and the construction of
high-density housing with small gardens [3,35]. Consequently,
substantially more information is required to be able to identify
why foxes have undergone a period of rapid colonisation in the last
two decades. Of particular help would be identifying the spatio-
temporal pattern of colonisation within individual cities in relation
to the changes in the associated infrastructure [66,67].
Source populations for the colonisation of conurbations could
be either from the surrounding rural landscape or from foxes
dispersing from towns and cities already occupied. Although the
colonisation of some European cities has been attributed to a rise
in rural fox populations following the successful management of
rabies [6,26], data on patterns of change in rural fox populations
in Britain are not entirely clear, partly because of the limitations
associated with the monitoring methods currently being used (e.g.,
‘‘game bags’’, faecal counts, road traffic casualties).However, in a
review of these data, Battersby (2005) [68] concluded that, at a
national level, fox populations appear to have been relatively
stable since circa 1995, the time period corresponding to the
present study. Therefore, whilst acknowledging their limitations,
those data available do not appear to strongly support a hypothesis
of rapidly changing rural fox populations as a factor driving the
colonisation of new urban areas.
Two mechanisms that might favour colonisation are: (i) if
colonising individuals originated from nearby urban conurbations;
and/or (ii) if rural individuals were able to access patches of semi-
Figure 3. Density of fox sightings in Great Britain. Density of fox sightings based on publicity submitted sightings in the 144 cities used withinstatistical models. The size of circles depicts the number of fox sightings per 1000 people per km2.doi:10.1371/journal.pone.0099059.g003
Distribution of Red Foxes in Urban Areas in Great Britain
PLOS ONE | www.plosone.org 7 June 2014 | Volume 9 | Issue 6 | e99059

natural habitat within the urban matrix and use these as a stepping
stone from which to further colonise the wider urban landscape.
We could not, however, find evidence to support either
mechanism; neither nearest neighbour distance nor the percentage
cover of green space significantly affected the likelihood that a
conurbation was occupied per se. In part, these non-significant
differences could have arisen because foxes are capable of
dispersing over large distances [72], such that immigrating
individuals could have arisen from more distant conurbations.
One further factor that could promote colonisation is the
preference for habitats similar to those experienced in an
individual’s natal range [69][70,71][72]. Distinguishing the origins
of colonising individuals, the number of founder events, and the
relatedness between rural and urban populations with the use of
genetic studies [26] would significantly help to elucidate the
colonisation process.
Limitations of the studyThe main limitations of the current study were associated with
the approach used to enlist volunteers, the extent of coverage
achieved, and the non-standardisation of effort to allow validation
of null data. Although media-driven web-based surveys have the
potential for collecting a large amount of data at a national scale
[38], there are biases associated with the audience reached and
hence the suitability of information received [73]. For example,
participants in this study would have been limited to the subset of
people that actively chose to watch the television program and
who were motivated to report sightings of foxes. Moreover, the
reliance on a web-based approach further restricted responses to
those with access to appropriate technology and the necessary
technical skill to submit information correctly; this is not likely to
have been a significant issue in this study, since a single fox
territory typically contains several hundred households and
internet provision and mobile phone coverage in urban areas in
Britain is very high. In addition, problems associated with
volunteer recruitment can be further minimised by making the
information requested as simple as possible, although this in turn
limits the amount of detailed information that can be collected
[73]. In this regard, there is a compromise between broadcasters
and scientists, with final decisions predominantly in the hands of
the former. With simplifications in design to engage a wider
audience, we have had to restrict analyses to consider relationships
at relatively broad spatial scales.
The reliance on sightings of foxes alone is also associated with
an absence of negative information. The submission of negative
information does, however, pose its own particular problems, since
many non-scientists are intrinsically less aware of the usefulness of
information relating to the absence of a species. Furthermore,
there is then the difficulty of discriminating between true
(participants had not observed foxes in the specified time period)
and false (people had not submitted a sighting even though they
had observed foxes) absences. These can be identified using follow-
up ‘‘ground-truthing’’ studies in a sub-set of cities to determine the
presence/absence of foxes but perhaps more usefully to quantify
the relationship between true densities relative to sightings density.
Table 1. Model-averaged estimates of explanatory variables in models examining the presence/absence of fox sightings.
Parameter Mean S.E. 95% C.I. Relative Importance
Intercept 7.82 33.92 [258.67–74.31] -
Latitude 20.84 0.51 [21.85–0.16] 0.53
Longitude 0.09 0.36 [20.61–0.79] 0.20
Log (Urban extent) 5.49 2.13 [1.32–9.66] 1.00
Distance to neighbour 20.03 0.04 [20.1–0.05] 0.33
% green space 20.04 0.06 [20.15–0.07] 0.37
% green space * log (urban extent) 20.25 0.25 [20.75–0.25] 0.12
Model-averaged estimates for the explanatory variables present in the 11 top models of probability of fox presence. The relative importance is the sum of the AICweight over all models including the explanatory variable. Significant variables are shown in bold.doi:10.1371/journal.pone.0099059.t001
Table 2. Model-averaged estimates of explanatory variables in models examining corrected density of fox sightings for thoseconurbations where $1 sightings were submitted.
Parameter Mean S.E. 95% C.I. Relative Importance
Intercept 21.85 4.41 [210.5–6.8] -
Latitude 20.13 0.07 [20.27–0.01] 0.81
Longitude 0.22 0.06 [0.1–0.34] 1.00
Log (Urban extent) 1.25 0.09 [1.07–1.43] 1.00
Distance to neighbour 20.002 0.007 [20.02–0.01] 0.29
% green space 20.03 0.01 [20.05– 20.01] 1.00
% green space * log (urban extent) 0.01 0.01 [20.01–0.02] 0.39
Model-averaged estimates for the explanatory variables present in the six top models of corrected fox sightings for those conurbations where at least one sighting wassubmitted. S.E. stands for standard error and C.I. for confidence interval. The relative importance is the sum of the AIC weight over all models including the explanatoryvariable. Significant variables are shown in bold.doi:10.1371/journal.pone.0099059.t002
Distribution of Red Foxes in Urban Areas in Great Britain
PLOS ONE | www.plosone.org 8 June 2014 | Volume 9 | Issue 6 | e99059
However, these will likely be expensive and time-consuming,
factors which would probably be highly influential in influencing
decisions to adopt a media-driven approach in the first place. It is
recommended, therefore, that researchers should aim to maximise
capture of both negative data and survey effort where possible, by
emphasizing the need for these data in the recruitment process and
survey design. In addition, it is our experience that one media
appearance is likely to result in additional invitations which can
potentially provide opportunities for some ground-truthing; for
example, using this approach we have been able to confirm the
presence of foxes in some towns and cities not identified in the
primary data set presented here. In addition, with standardisation
in effort and methodological approach, longitudinal media-based
studies could be implemented to monitor changes in both
distribution and relative abundance, although this is likely to be
difficult given the different objectives of broadcast media versus
scientists.
One further potential problem to consider in citizen science
based surveys is the reliability of the information received [45]. In
this study, we requested sightings of a distinctive, well-known
animal for which there are no morphologically similar species
present in Britain (other than some domestic dogs). Furthermore,
most sightings are likely to have been made over short distances
e.g., within the participant’s garden. Therefore, we are confident
that those sightings reported were reliable: further validation of the
information received was achieved by asking people to submit
photographs. All photos were checked and confirmed to be of
foxes with no errors in identification, although one was a
deliberate erroneous ‘‘sighting’’ as it was a modified image.
However, it was not possible to eliminate deliberately false
reporting. For example, foxes have previously been associated
with a hoax on one offshore island [74] and are the subject of
heated debate concerning the need for culling in both rural and
urban habitats following a ban on hunting foxes with dogs and
alleged attacks on people [36] respectively. Consequently, there is
the possibility that some sightings could have been erroneous [45],
although reports of foxes in many conurbations were corroborated
by at least one sighting accompanied with a photograph (see
Figure 1).
In contrast, the data collected are more problematic in the
context of elucidating patterns in the relative density of foxes
between urban areas and quantifying the distribution of foxes
within individual locations. Although coverage in terms of overall
viewing figures was very good, with 3.0% of the British population
watching the first program, clearly demonstrating the potential of
media-based studies in ecological studies, only 17,477 sightings
were submitted (,0.1% of the total population). Given that fox
densities vary markedly within individual conurbations [31,75,76],
this low coverage presents considerable challenges for obtaining
detailed information about fox ecology at fine spatial scales,
particularly in less favourable and less populated habitats within
the urban landscape. Therefore, the primary limitation in this
study was getting viewers to submit sightings rather than
increasing the number of viewers. This is likely to be a significant
issue in media-driven studies generally and one that may be hard
to resolve, since there is often limited scope for explaining
methodological approaches in detail although approaches for
incentivising viewers do exist (e.g., corporate sponsors offering
prizes).
Perhaps not surprisingly, therefore, with the exception of urban
extent, we did not detect any statistically significant relationships
between sightings density and the mean density of foxes in cities in
the 1980s either for those locations where foxes were surveyed
directly or where density was estimated using the resultant habitat
suitability model [30]. Although it is fair to assume that these
results, at least in part, reflect the limitations of the current
methodology (i.e. larger cities are occupied by more potential
participants), the absence of any significant relationship would also
arise if fox populations within these cities had changed differently
relative to one another over the past 25 years. However, with one
notable exception [77] [78], there are no up-to-date estimates of
fox density in any towns or cities in Britain. Nevertheless the
results of this and previous studies suggest that new conurbations
have been colonised [34], that some populations have been
impacted by sarcoptic mange [33] [32] and that others may have
increased locally in response to anthropogenic feeding [32].
Consequently, there is a need to re-examine the habitat suitability
model developed by Harris and Smith (1987) [30] to determine
whether it still adequately describes the distribution of foxes within
and between towns and cities in Britain. Such studies would also
benefit from considering total fox density rather than the density of
family groups, since long-term studies have indicated that group
size and productivity are more variable than previously assumed
[32] [77] [78].
Conclusions
This study has demonstrated that urban foxes are now more
widespread within Great Britain than previously recorded, and
that many towns and cities previously considered unsuitable now
contain fox populations, albeit probably at relatively low densities.
The ecological processes underlying these recent colonisation
events are unclear and require further investigation, but this
altered distribution does pose concerns in the context of the
possible introduction and management of zoonotic diseases and
parasitic infections [79–82]. Therefore, there is a need to revise
and extend earlier models for predicting the distribution and
densities of urban foxes.
From a methodological perspective, the television programs that
formed the basis for collecting the sightings data were very
successful in mapping the changing distribution of foxes in towns
and cities. However, a number of problems are evident in the
context of using these data to investigate fine-scale processes, most
notably due to the pattern of coverage associated with participants
and because the emphasis on the submission of positive
information makes it difficult to identify true and false absences.
Consequently, detailed follow-up studies are required to address
some of these constraints.
Supporting Information
Table S1 144 cities used in multivariate additivemodels. The table shows for each conurbation latitude and
longitude, extent of urban area (in km2), the total population
present, the human density, % public green space and the
observed fox density. Yellow highlighted cities are those previous
used as predictor cities in the 1987 model by Harris and Smith.
Grey highlighted are cities previously believed to have few or no
foxes present in 1987 and pink highlights are cities with previous
predicted mean fox densities estimates from 1987.
(DOCX)
Licence S1 Digimap licence agreement.
(DOCX)
Licence S2 Ordinance Survey (OS) open data licence.
(PDF)
Distribution of Red Foxes in Urban Areas in Great Britain
PLOS ONE | www.plosone.org 9 June 2014 | Volume 9 | Issue 6 | e99059
Acknowledgments
We are grateful to: Channel 4 for their funding and support, especially
Sara Ramsden, Marilena Marino and Kate Quilton; David Dugan and all
the production staff at Windfall Films, especially Peter Fison and Mark
Evans; Jaron Ghani and Clare Maguire at Numiko and Ian Mann at
Beyond Analysis for support with data management; and Naomi Charman
for processing all of the images. Finally, we would especially like to thank
all the people who took the time and effort to submit their fox sightings and
photographs.
Author Contributions
Conceived and designed the experiments: DMS JL KN BAT PJB.
Performed the experiments: DMS JL KN BAT PJB. Analyzed the data:
DMS BAT MJB PJB ALMC GCS. Contributed reagents/materials/
analysis tools: MJB ALMC GCS. Wrote the paper: DMS MJB BAT
ALMC GCS KN JL PJB.
References
1. UNFPA (2007)The state of world population: New York: UNFPA, 1992-. 108 p.
2. McKinney ML (2008) Effects of urbanization on species richness: A review ofplants and animals. Urban Ecosystems 11: 161–176.
3. Baker PJ, Harris S (2007) Urban mammals: what does the future hold? Ananalysis of the factors affecting patterns of use of residential gardens in Great
Britain. Mamm. Rev. 37: 297–315.
4. Knapp S, Kuehn I, Mosbrugger V, Klotz S (2008) Do protected areas in urban
and rural landscapes differ in species diversity? Biodivers Conserv 17: 1595–
1612.
5. Eigenbrod F, Bell VA, Davies HN, Heinemeyer A, Armsworth PR, et al. (2011)
The impact of projected increases in urbanization on ecosystem services.Proc R Soc Lond B Biol Sci 278: 3201–3208.
6. Gloor S, Bontadina F, Hegglin D, Deplazes P, Breitenmoser U (2001) The rise ofurban fox populations in Switzerland. Mamm Biol 66: 155–164.
7. Bateman PW, Fleming PA (2012) Big city life: carnivores in urban environments.J Zoo 287: 1–23.
8. Fuller TK, Destefano S, Warren PS (2010) Carnivore behavior and ecology, andrelationship to urbanization; Gehrt SD, Riley SPD, Cypher BL, editors. 13–19
p.
9. Contesse P, Hegglin D, Gloor S, Bontadina F, Deplazes P (2004) The diet of
urban foxes (Vulpes vulpes) and the availability of anthropogenic food in the city ofZurich, Switzerland. Mamm Biol 69: 81–95.
10. Soulsbury CD, Baker PJ, Iossa G, Harris S (2010)Red foxes (Vulpes vulpes); Gehrt
SD, Riley SPD, Cypher BL, editors. 63–75 p.
11. Harris S (1984) Ecology of uban badgers Meles meles - distribution in Britian and
habitat selection, persecution, food and damage in the city of Bristol. BiolConserv 28: 349–375.
12. Delahay RJ, Davison J, Poole DW, Matthews AJ, Wilson CJ, et al. (2009)Managing conflict between humans and wildlife: trends in licensed operations to
resolve problems with badgers Meles meles in England. Mamm Rev 39: 53–66.
13. Gehrt SD, Riley SPD, Cypher BL (2010) Urban carnivores: ecology, conflict,
and conservation. Baltimore: Johns Hopkins University Press.
14. White LA, Gehrt SD (2009) Coyote attacks on humans in the United States and
Canada. Hum Dimens Wildl 14: 419–432.
15. Jenkins DJ, Craig NA (1992) The role of foxes Vulpes vulpes in the epidemiology of
Echinococcus granulosus in urban environments. Med J Aust 157: 754–756.
16. Smith GC, Harris S (1991) Rabies in urban foxes (Vulpes vulpes) in Britain: the use
of a spatial stochastic simulation model to examine the pattern of spread and
evaluate the efficacy of different control regimes. Philos Trans R Soc Lond B BiolSci 334: 459–479.
17. Samuel WM (1981) Attempted experimental transfer of sarcoptic mange(Sarcoptes scabiei, Acarina: Sarcoptidae) among red fox, coyote, wolf and dog.
J Wildl Dis 17: 343–347.
18. Chappuis F (2012) Echinococcosis: the threat of the urban fox. Rev Med Suisse
8: 989–990, 992–983.
19. Keniger LE, Gaston KJ, Irvine KN, Fuller RA (2013) What are the Benefits of
Interacting with Nature? Int J Environ Res Public Health 10: 913–935.
20. Fuller RA, Irvine KN, Devine-Wright P, Warren PH, Gaston KJ (2007)
Psychological benefits of greenspace increase with biodiversity. Biol Lett 3: 390–394.
21. Bowler DE, Buyung-Ali LM, Knight TM, Pullin AS (2010) A systematic reviewof evidence for the added benefits to health of exposure to natural environments.
BMC Public Health 10.
22. Davies ZG, Fuller RA, Dallimer M, Loram A, Gaston KJ (2012) Householdfactors influencing participation in bird feeding activity: a national scale analysis.
PloSONE 7: e39692–e39692.
23. Tratalos J, Fuller RA, Warren PH, Davies RG, Gaston KJ (2007) Urban form,
biodiversity potential and ecosystem services. Landsc Urban Plan 83: 308–317.
24. Harris S, Baker P (2001) Urban foxes. New edition. 1–152 p.
25. Crooks KR, Riley SPD, Gehrt SD, Gosselink TE, Van Deelen TR(2010)Community ecology of urban carnivores; Gehrt SD, Riley SPD, Cypher
BL, editors. 185–196 p.
26. Wandeler P, Funk SM, Largiader CR, Gloor S, Breitenmoser U (2003) The city-
fox phenomenon: genetic consequences of a recent colonization of urbanhabitat. Mol Ecol 12: 647–656.
27. Harris S, Morris P, Wray S, Yalden D (1995) A review of British mammals:population estimates and conservation status of British mammals other than
cetaceans. JNCC, 1–168 p.
28. Lloyd HG (1980) Habitat requirements of the red fox. Zimen, E. pp. P7–26.
29. Harris S, Rayner JMV (1986) Models for predicting urban fox (Vulpes vulpes)
numbers in British -cities and thier application for rabies control. J Anim Ecol
55: 593–603.
30. Harris S, Smith GC (1987) The use of sociological data to explain the
distribution and numbers of urban foxes (Vulpes vulpes) in England and Wales.
Symp Zool Soc Lond 58: 313–328.
31. Harris S, Rayner JMV (1986) Urban fox (Vulpes vulpes) population estimates and
habitat requirements in several Brtisih cities. J Anim Ecol 55: 575–591.
32. Baker PJ, Funk SM, Harris S, White PC (2000) Flexible spatial organization of
urban foxes, Vulpes vulpes, before and during an outbreak of sarcoptic mange.
Anim Behav 59: 127–146.
33. Soulsbury CD, Iossa G, Baker PJ, Cole NC, Funk SM, et al. (2007) The impact
of sarcoptic mange Sarcoptes scabiei on the British fox Vulpes vulpes population.
Mamm Rev 37: 278–296.
34. Wilkinson D, Smith GC (2001) A preliminary survey for changes in urban fox
(Vulpes vulpes) densities in England and Wales, and implications for rabies control.
Mamm Rev 31: 107–110.
35. Pauleit S, Ennos R, Golding Y (2005) Modeling the environmental impacts of
urban land use and land cover change - a study in Merseyside, UK. Landsc
Urban Plan 71: 295–310.
36. Cassidy A, Mills B (2012) ‘‘Fox Tots Attack Shock’’: Urban Foxes, Mass Media
and Boundary-Breaching. Environ Commun 6: 494–511.
37. Smith GC, Wilkinson D (2003) Modeling control of rabies outbreaks in red fox
populations to evaluate culling, vaccination, and vaccination combined with
fertility control. J Wildl Dis 39: 278–286.
38. Lye GC, Osborne JL, Park KJ, Goulson D (2012) Using citizen science to
monitor Bombus populations in the UK: nesting ecology and relative abundance
in the urban environment. J Insect Conserv 16: 697–707.
39. Hof AR, Bright PW (2009) The value of green-spaces in built-up areas for
western hedgehogs. Lutra 52: 69–82.
40. Toms MP, Newson SE (2006) Volunteer surveys as a means of inferring trends
in garden mammal populations. Mamm Rev 36: 309–317.
41. Patton V, Ewald JA, Smith AA, Newey S, Iason GR, et al. (2010) Distribution of
mountain hares Lepus timidus in Scotland: results from a questionnaire. Mamm
Rev 40: 313–326.
42. Thorn M, Green M, Keith M, Marnewick K, Bateman PW, et al. (2011) Large-
scale distribution patterns of carnivores in northern South Africa: implications
for conservation and monitoring. Oryx 45: 579–586.
43. White PCL, Jennings NV, Renwick AR, Barker NHL (2005) Questionnaires in
ecology: a review of past use and recommendations for best practice. J Appl Ecol
42: 421–430.
44. Reading CJ, Buckland ST, McGowan GM, Jayasinghe G, Gorzula S, et al.
(1996) The distribution and status of the adder (Vipera berus L) in Scotland
determined from questionnaire surveys. J Biogeogr 23: 657–667.
45. Hunter J, Alabri A, van Ingen C (2013) Assessing the quality and trustworthiness
of citizen science data. Concurr Comput 25: 454–466.
46. Ritter P, Lorig K, Laurent D, Matthews K (2004) Internet versus mailed
questionnaires: A randomized comparison. JMIR 6: 19–25.
47. Tulloch AIT, Possingham HP, Joseph LN, Szabo J, Martin TG (2013) Realising
the full potential of citizen science monitoring programs. Biol Conserv 165: 128–
138.
48. Adams J, White M (2008) Health behaviours in people who respond to a web-
based survey advertised on regional news media. Eur J Public Health 18: 335–
338.
49. Harris S, Rayner JMV (1986) A discriminant analysis of the current distribution
of urban foxes (Vulpes vulpes) in Britian. J Anim Ecol 55: 605–611.
50. ONS (2004) Census 2001. Office for National Statistics.
51. ONS (2011) National Population Projections, 2010-Based Statistical Bulletin.
52. ESRI (2011) ArcGIS Desktop: Release 10: Environmental Systems Research
Institute.
53. ONS (2010) Census 2010. Office for National Statistics.
54. CEH (2011) Land Cover Map 2007.Available: http://www.ceh.ac.uk/
landcovermap2007.html.
55. Richardson EA, Mitchell R (2010) Gender differences in relationships between
urban green space and health in the United Kingdom. Soc Sci Med 71: 568–
575.
56. Campbell SaH, G. (2007) Urban Fox Populations In Scottish Towns And Cities
2006. In: Management PUW, editor. Scotland: Scotland.gov.uk.
Distribution of Red Foxes in Urban Areas in Great Britain
PLOS ONE | www.plosone.org 10 June 2014 | Volume 9 | Issue 6 | e99059

57. R Core Development Team (2013) R: A language and environment for
statistical computing. R Foundation for Statistical Computing, Vienna, Austria.Available: http://www.R-project.org/
58. Bivand R (2014) spdep: Spatial dependence: weighting schemes, statistics and
models. 0.5-71 ed. pp. R package.59. Borcard D, Gillet FO, Legendre P (2011) Numerical ecology with R. New York;
London: Springer.60. Dray S, Legendre P, Peres-Neto PR (2006) Spatial modelling: a comprehensive
framework for principal coordinate analysis of neighbour matrices (PCNM).
Ecol Modell 196: 483–493.61. Burnham KP, Anderson DR (2002) Model selection and multi-model inference:
a practical information-theoretic approach. New York; London: Springer.62. Moller AP (2008) Flight distance of urban birds, predation, and selection for
urban life. Behav Ecol Sociobiol 63: 63–75.63. Moller AP (2009) Successful city dwellers: a comparative study of the ecological
characteristics of urban birds in the Western Palearctic. Oecologia 159: 849–
858.64. Iossa G, Soulsbury CD, Baker PJ, Harris S (2010) A taxonomic analysis of urban
carnivore ecology;Gehrt SD, Riley SPD, Cypher BL, editors. 173–180 p.65. Newman TJ, Baker PJ, Simcock E, Saunders G, White PCL, et al. (2003)
Changes in red fox habitat preference and rest site fidelity following a disease-
induced population decline. Acta Theriol 48: 79–91.66. Baker P, Funk S, Harris S, Newman T, Saunders G, et al. (2004) The impact of
human attitudes on the social and spatial organisation of urban foxes (Vulpes
vulpes) before and after an outbreak of sarcoptic mange. In: W.W. Shaw
LKHLV, editor; 2004 May 1-5; Tucson, Arizona. pp. 153–163.67. Devenish-Nelson ES, Harris S, Soulsbury CD, Richards SA, Stephens PA (2013)
Demography of a carnivore, the red fox, Vulpes vulpes: what have we learnt from
70 years of published studies? Oikos 122: 705–716.68. Battersby J (2005) UK mammals: species status and population trends. Tracking
Mammals Partnership Report 1: 1–116 p.69. Stamps JA, Krishnan VV, Willits NH (2009) How different types of natal
experience affect habitat preference. Am Nat 174: 623–630.
70. Selonen V, Hanski IK, Desrochers A (2007) Natal habitat-biased dispersal in the
Siberian flying squirrel. Proc Biol Sci 274: 2063–2068.71. Davis JM, Stamps JA (2004) The effect of natal experience on habitat
preferences. Trends Ecol Evol 19: 411–416.
72. Gosselink TE, Piccolo KA, van Deelen TR, Warner RE, Mankin PC (2010)Natal Dispersal and Philopatry of Red Foxes in Urban and Agricultural Areas of
Illinois. J Wildl Manage 74: 1204–1217.73. Tregidgo DJ, West SE, Ashmore MR (2013) Can citizen science produce good
science? Testing the OPAL Air Survey methodology, using lichens as indicators
of nitrogenous pollution. Environ Pollut 182: 448–451.74. Harris S, Yalden DW (2008) Mammals of the British Isles: handbook.
Southampton: Mammal Society.75. Harris S (1977) Distribution, habitat utilization and age structure of a suburban
fox (Vulpes vulpes) population. Mamm Rev 7: 25–39.76. Harris S (1981) An estimation of the number of foxes Vvulpes vulpes) in the city of
Bristol, and some possible factors affecting thier distribution. J Appl Ecol 18:
455–465.77. Baker P, Newman T, Harris S (2001) Bristol’s foxes - 40 years of change. British
Wildlife 12: 411–417.78. Iossa G, Soulsbury CD, Baker PJ, Edwards KJ, Harris S (2009) Behavioral
changes associated with a population density decline in the facultatively social
red fox. Behav Ecol 20: 385–395.79. Smith GC, Fooks AR (2006) Wildlife rabies control policy in Great Britain. Dev
Biol (Basel) 125: 113–118.80. Brochier B, De Blander H, Hanosset R, Berkvens D, Losson B, et al. (2007)
Echinococcus multilocularis and Toxocara canis in urban red foxes (Vulpes vulpes)in Brussels, Belgium. Prev Vet Med 80: 65–73.
81. Learmount J, Zimmer IA, Conyers C, Boughtflower VD, Morgan CP, et al.
(2012) A diagnostic study of Echinococcus multilocularis in red foxes (Vulpes vulpes)from Great Britain. Vet Parasitol 190: 447–453.
82. Smith GC, Gangadharan B, Taylor Z, Laurenson MK, Bradshaw H, et al.(2003) Prevalence of zoonotic important parasites in the red fox (Vulpes vulpes) in
Great Britain. Vet Parasitol 118: 133–142.
Distribution of Red Foxes in Urban Areas in Great Britain
PLOS ONE | www.plosone.org 11 June 2014 | Volume 9 | Issue 6 | e99059
Top Related