


Languages
Pages
Legal


CedarRapids/IowaCity
RegionalDataReportOctober2010
Compiled by Ma Fisher, MS
University of Iowa Department of Urban and Regional Planning
Contacts:DeeBaird,PriorityOne,(319)730‐1420orJoeRaso,ICADGroup,(319)354‐3939
Alliant Energy
Cedar Rapids Area Chamber of Commerce
Entrepreneurial Development Center
Iowa City Area Chamber of Commerce
Iowa City Area Development Group
John Pappajohn Entrepreneurial Center
Kirkwood Community College
Kirkwood Small Business Development Center
MidAmerican Energy Company
Priority One
University of Iowa Research Founda on
University of Iowa Small Business
Development Center
The report was commissioned by the Corridor Business Alliance,
with direct support from Kirkwood Community College
The Corridor Business Alliance

1
Table of Contents
1. Population 2
2. Labor Market 6
3. Income and Wages 12
4. Poverty 19
5. Housing Costs 26
6. Residential Building Permits 31
7. Business Starts 37
8. Patents 41
9. Capital Investment 46
10. Crime 50
11. School Enrollment 57
12. Graduation Rates 64
13. Education 69
2
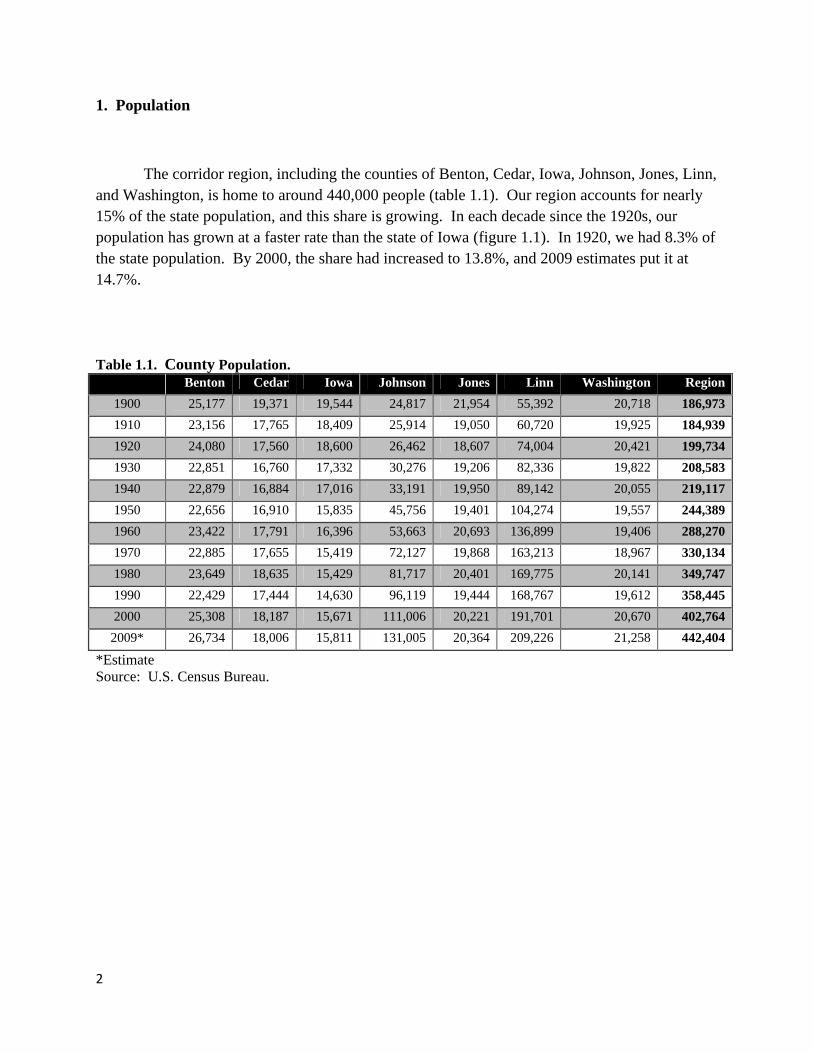
1. Population
The corridor region, including the counties of Benton, Cedar, Iowa, Johnson, Jones, Linn, and Washington, is home to around 440,000 people (table 1.1). Our region accounts for nearly 15% of the state population, and this share is growing. In each decade since the 1920s, our population has grown at a faster rate than the state of Iowa (figure 1.1). In 1920, we had 8.3% of the state population. By 2000, the share had increased to 13.8%, and 2009 estimates put it at 14.7%.
Table 1.1. County Population. Benton Cedar Iowa Johnson Jones Linn Washington Region
1900 25,177 19,371 19,544 24,817 21,954 55,392 20,718 186,973
1910 23,156 17,765 18,409 25,914 19,050 60,720 19,925 184,939
1920 24,080 17,560 18,600 26,462 18,607 74,004 20,421 199,734
1930 22,851 16,760 17,332 30,276 19,206 82,336 19,822 208,583
1940 22,879 16,884 17,016 33,191 19,950 89,142 20,055 219,117
1950 22,656 16,910 15,835 45,756 19,401 104,274 19,557 244,389
1960 23,422 17,791 16,396 53,663 20,693 136,899 19,406 288,270
1970 22,885 17,655 15,419 72,127 19,868 163,213 18,967 330,134
1980 23,649 18,635 15,429 81,717 20,401 169,775 20,141 349,747
1990 22,429 17,444 14,630 96,119 19,444 168,767 19,612 358,445
2000 25,308 18,187 15,671 111,006 20,221 191,701 20,670 402,764
2009* 26,734 18,006 15,811 131,005 20,364 209,226 21,258 442,404
*Estimate Source: U.S. Census Bureau.

3
Figure 1
Source: U
Joall of theflat or dolosing neof their 1
‐
Po
pu
lati
on G
row
th
.1. Populat
U.S. Census Bu
ohnson and L region’s gro
own over theearly 20% of1900 populat
10%
‐5%
0%
5%
10%
15%
20%
tion Growth
ureau.
Linn Countyowth in the le past 100 yef its populatitions, while
Reg
Stat
h: The Stat
y account forlast century ears (figure 1on. Benton,Johnson and
ion
te
e vs. The Co
r 75% of the(figure 1.2). 1.3). Iowa C, Cedar, Wasd Linn have g
orridor.
e regions cur The remain
County has sshington, angrown by 34
rrent populatning 5 counteen the shar
nd Jones are 47% and 246
tion, and neaties have beerpest declineall within 106%, respectiv
arly en , 0% vely.

4
Figure 1
Source: U
Figure 1
Source: U
Po
pu
lati
on
Po
pu
lati
on
.2. County
U.S. Census Bu
.3. County
U.S. Census Bu
B
C
Io
Jo
W
Population
ureau.
Population
ureau.
Benton
CedarIowa
JohnsonJones
LinnWashingto
Benton
Cedar
owa
ones
Washington
ns, 1900 - 20
ns, 1900 – 20
on
009.
000
5
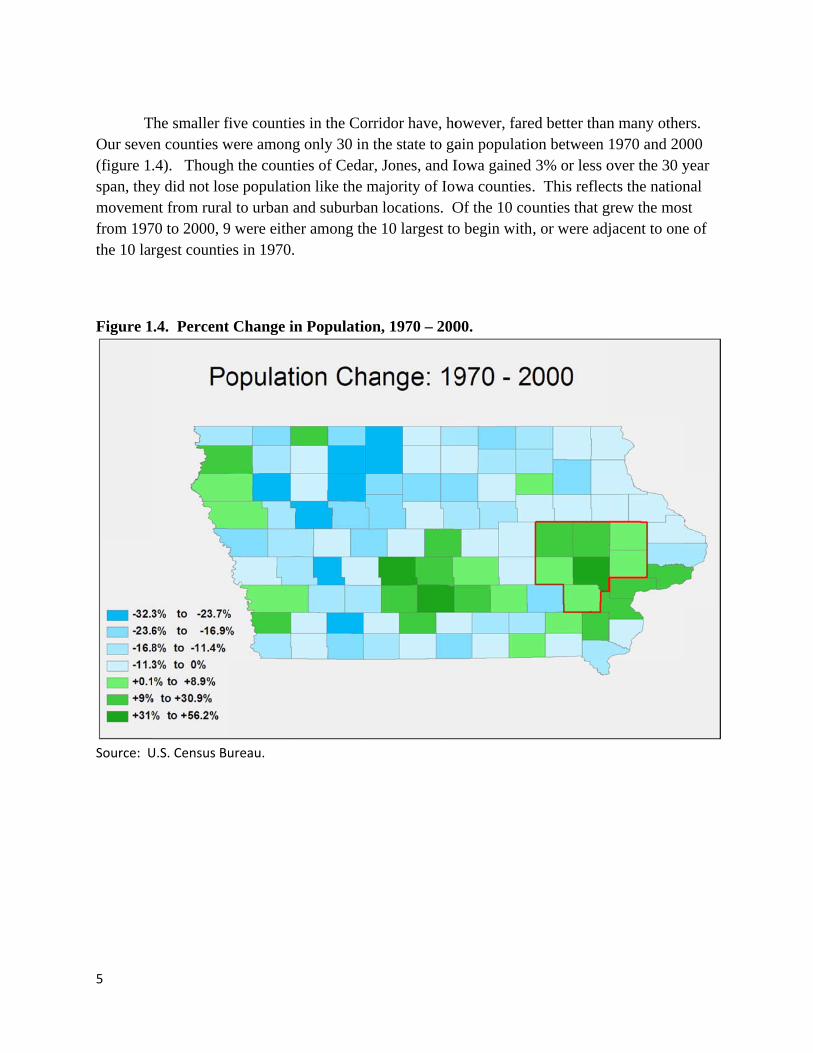
TOur seve(figure 1span, themovemenfrom 197the 10 lar
Figure 1
Source: U
The smaller fen counties w.4). Thoughy did not losnt from rura
70 to 2000, 9rgest countie
.4. Percent
U.S. Census Bu
five countieswere among h the countiese populationl to urban an
9 were eitheres in 1970.
t Change in
ureau.
s in the Corrionly 30 in thes of Cedar, n like the mand suburban r among the
Population
idor have, hohe state to gaJones, and Iajority of Iowlocations. O10 largest to
n, 1970 – 200
owever, fareain populatioIowa gained wa countiesOf the 10 couo begin with
00.
ed better thanon between 3% or less o. This reflecunties that g, or were adj
n many othe1970 and 20over the 30 ycts the nationgrew the mosjacent to one
ers. 000 year nal st e of
6
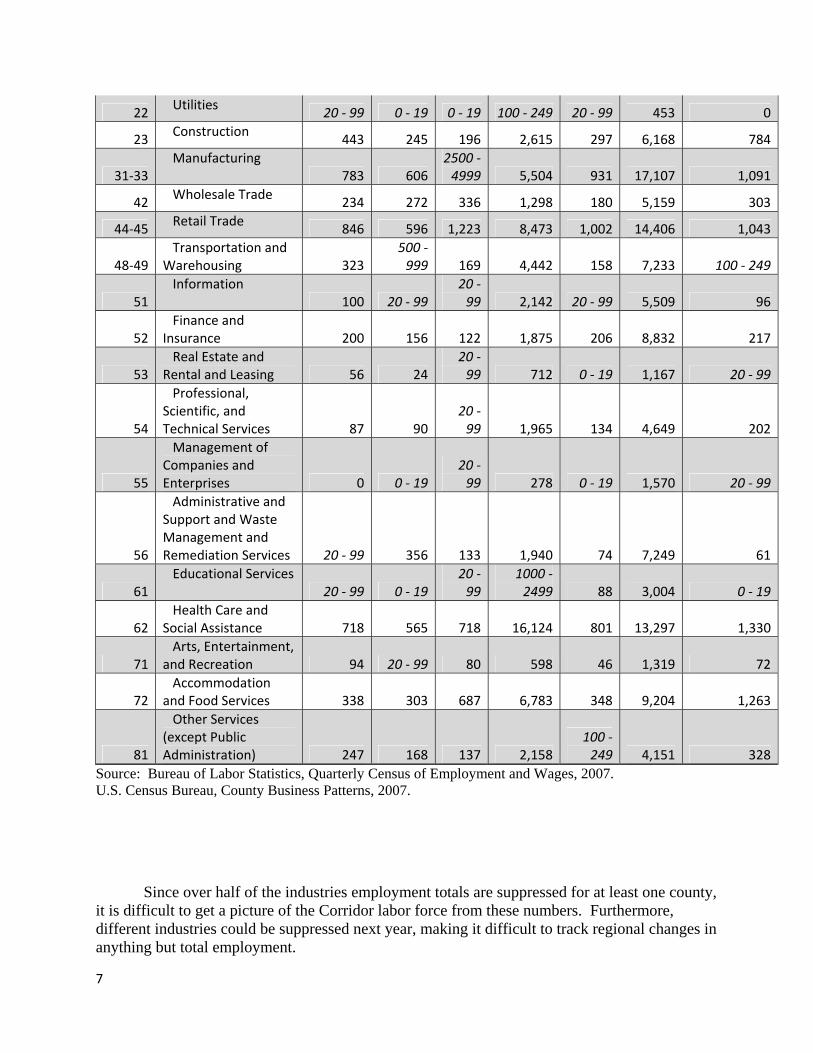
2. Labor Market
Figures for employment come from two sources. The Census Bureau releases a report each year called County Business Pattern (CBP). This report includes, among other things, the number of employees in a county in each of some 1,200 sectors. These surveys do not include farmers, the self-employed, or government employees (with the exception of health care workers and public school teachers).
The Quarterly Census of Employment and Wages (QCEW), released by the Bureau of Labor Statistics, covers a slightly different set of industries, but it includes most government workers.
In order to protect firm’s information, the reports will not release employment figures for industries or sectors which are dominated by a few large employers. Of the 19 industries covered by County Business Patterns, only 8 had reportable figures for all seven counties (table 2.1). Unlike the QCEW, the CBP will report an employment range, and from these we can at least establish a minimum industry employment for the region (table 2.2).
Table 2.1. Employment by Industry by County, 2007. NAICS Code Description Benton Cedar Iowa Johnson Jones Linn Washington
Private Employment (BLS) 4,131 4,189 8,162 50,688 5,113 110,567 6,584
Total Government Employment (BLS) 1,521 1,090 1,084 23,346 1,430 12,832 1,453
Federal 70 108 70 1,492 61 1,126 71
State 128 N/A 29 N/A 415 559 68
Local 1,324 N/A 985 N/A 954 11,148 1,315
‐‐‐‐‐‐
Total Employment (CBP)
4,627 4,198 7,876 59,267 4,675 110,578 7,044
11
Agriculture, Forestry, Fishing and Hunting 0 ‐ 19 20 ‐ 99
20 ‐ 99 0 ‐ 19 0 ‐ 19 20 ‐ 99 0 ‐ 19
21 Mining
20 ‐ 99 0 0 20 ‐ 99 20 ‐ 99 51 20 ‐ 99
7
22 Utilities
20 ‐ 99 0 ‐ 19 0 ‐ 19 100 ‐ 249 20 ‐ 99 453 0
23 Construction
443 245 196 2,615 297 6,168 784
31‐33 Manufacturing
783 6062500 ‐ 4999 5,504 931 17,107 1,091
42 Wholesale Trade
234 272 336 1,298 180 5,159 303
44‐45 Retail Trade
846 596 1,223 8,473 1,002 14,406 1,043
48‐49 Transportation and Warehousing 323
500 ‐ 999 169 4,442 158 7,233 100 ‐ 249
51 Information
100 20 ‐ 9920 ‐ 99 2,142 20 ‐ 99 5,509 96
52 Finance and Insurance 200 156 122 1,875 206 8,832 217
53 Real Estate and Rental and Leasing 56 24
20 ‐ 99 712 0 ‐ 19 1,167 20 ‐ 99
54
Professional, Scientific, and Technical Services 87 90
20 ‐ 99 1,965 134 4,649 202
55
Management of Companies and Enterprises 0 0 ‐ 19
20 ‐ 99 278 0 ‐ 19 1,570 20 ‐ 99
56
Administrative and Support and Waste Management and Remediation Services 20 ‐ 99 356 133 1,940 74 7,249 61
61 Educational Services
20 ‐ 99 0 ‐ 1920 ‐ 99
1000 ‐ 2499 88 3,004 0 ‐ 19
62 Health Care and Social Assistance 718 565 718 16,124 801 13,297 1,330
71 Arts, Entertainment, and Recreation 94 20 ‐ 99 80 598 46 1,319 72
72 Accommodation and Food Services 338 303 687 6,783 348 9,204 1,263
81
Other Services (except Public Administration) 247 168 137 2,158
100 ‐ 249 4,151 328
Source: Bureau of Labor Statistics, Quarterly Census of Employment and Wages, 2007. U.S. Census Bureau, County Business Patterns, 2007. Since over half of the industries employment totals are suppressed for at least one county, it is difficult to get a picture of the Corridor labor force from these numbers. Furthermore, different industries could be suppressed next year, making it difficult to track regional changes in anything but total employment.

8
Chmura Economics makes available, for a fee, estimates for the suppressed BLS employment figures. Table 2.2 gives the estimated employment totals for the seven counties. Health care, education, retail, and manufacturing are the largest industries, with around 30,000 employees each. These figures include both private and public sector employees. Table 2.2. Regional Employment by Industry, 2009. Industry Employment
Accommodation and Food Services 18,847
Administrative and Support and Waste Management and Remediation Services 11,927
Agriculture, Forestry, Fishing and Hunting 947
Arts, Entertainment, and Recreation 2,182
Construction 11,309
Educational Services 29,005
Finance and Insurance 11,099
Health Care and Social Assistance 33,782
Information 7,549
Management of Companies and Enterprises 725
Manufacturing 30,295
Mining, Quarrying, and Oil and Gas Extraction 326
Other Services (except Public Administration) 6,080
Professional, Scientific, and Technical Services 6,754
Public Administration 8,504
Real Estate and Rental and Leasing 2,777
Retail Trade 27,726
Transportation and Warehousing 13,930
Utilities 1,225
Wholesale Trade 7,632
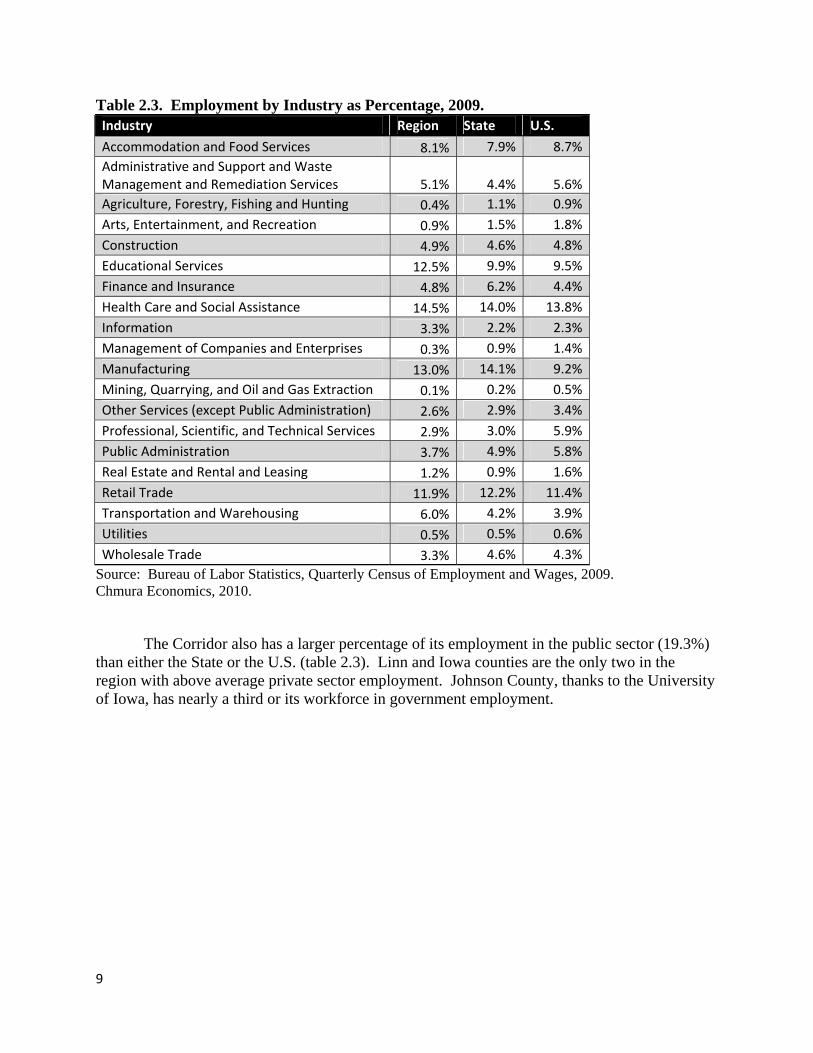
TOTAL 232,624 Source: Chmura Economics, 2010. The Corridor had a higher percentage of its workforce in Education (12.5%) and Health Care and Social Assistance (14.5%), compared to the nation and the State of Iowa (table 2.3). In manufacturing and retail, the Corridor devoted a smaller percentage than the State, but larger than the U.S. The Corridor also has a significantly greater percentage of its workforce in the Information (3.3%) and the Transportation and Warehousing (6.0%) industries, compared the U.S. and the State of Iowa.
9
Table 2.3. Employment by Industry as Percentage, 2009. Industry Region State U.S.
Accommodation and Food Services 8.1% 7.9% 8.7%
Administrative and Support and Waste Management and Remediation Services 5.1% 4.4% 5.6%
Agriculture, Forestry, Fishing and Hunting 0.4% 1.1% 0.9%
Arts, Entertainment, and Recreation 0.9% 1.5% 1.8%
Construction 4.9% 4.6% 4.8%
Educational Services 12.5% 9.9% 9.5%
Finance and Insurance 4.8% 6.2% 4.4%
Health Care and Social Assistance 14.5% 14.0% 13.8%
Information 3.3% 2.2% 2.3%
Management of Companies and Enterprises 0.3% 0.9% 1.4%
Manufacturing 13.0% 14.1% 9.2%
Mining, Quarrying, and Oil and Gas Extraction 0.1% 0.2% 0.5%
Other Services (except Public Administration) 2.6% 2.9% 3.4%
Professional, Scientific, and Technical Services 2.9% 3.0% 5.9%
Public Administration 3.7% 4.9% 5.8%
Real Estate and Rental and Leasing 1.2% 0.9% 1.6%
Retail Trade 11.9% 12.2% 11.4%
Transportation and Warehousing 6.0% 4.2% 3.9%
Utilities 0.5% 0.5% 0.6%
Wholesale Trade 3.3% 4.6% 4.3%
Source: Bureau of Labor Statistics, Quarterly Census of Employment and Wages, 2009. Chmura Economics, 2010. The Corridor also has a larger percentage of its employment in the public sector (19.3%) than either the State or the U.S. (table 2.3). Linn and Iowa counties are the only two in the region with above average private sector employment. Johnson County, thanks to the University of Iowa, has nearly a third or its workforce in government employment.

10
Table 2.3. Private vs. Public Sector Employment, 2009. Private Public
Benton 72.6% 27.4%
Cedar 79.9% 20.1%
Iowa 87.4% 12.6%
Johnson 67.1% 32.9%
Jones 76.8% 23.2%
Linn 89.1% 10.9%
Washington 81.0% 19.0%
REGION 80.7% 19.3%
STATE 83.6% 16.4%
U.S. 83.2% 16.8%
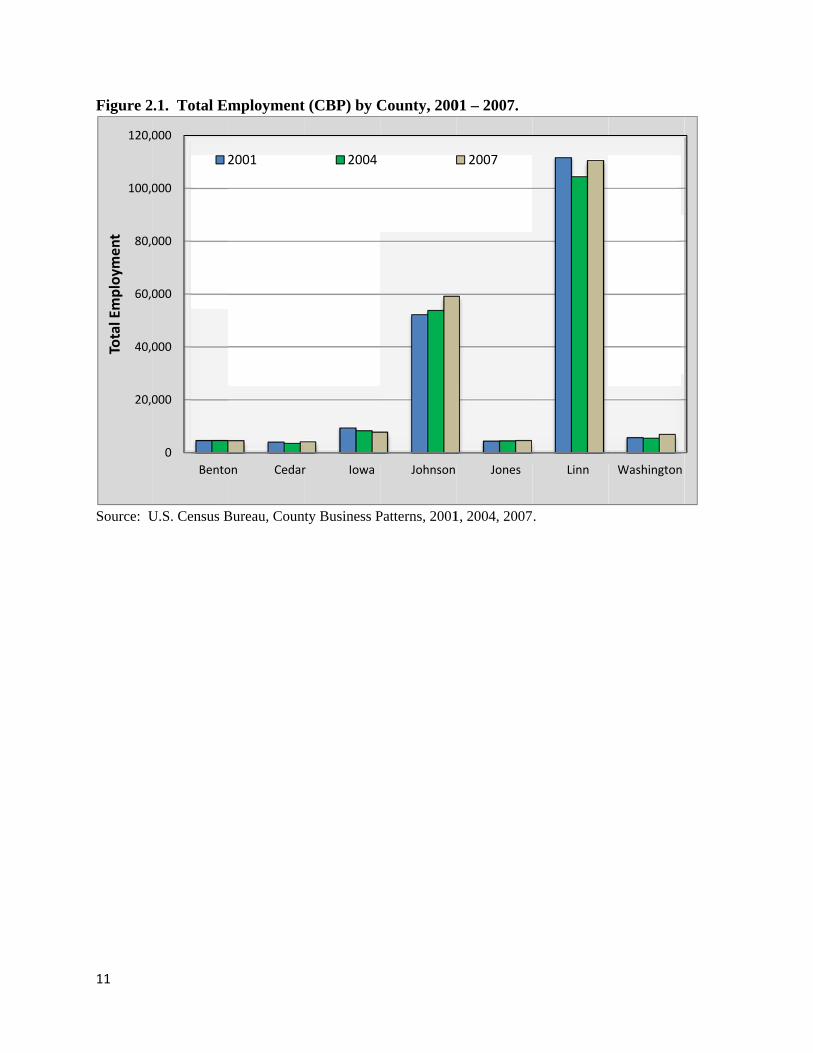
Source: Bureau of Labor Statistics, Quarterly Census of Employment and Wages, 2010. By County Business Pattern figures, regional employment dipped between 2001 and 2004, but rebounded in 2007 (table 2.3). The 2004 drop of more than 7,000 jobs was approximately the drop in Linn County alone. By 2007, Linn County was still 1,000 jobs short of its 2001 mark, and Iowa County was down 1,500 jobs to 7,876. Growth in Johnson and Washington Counties pushed the region up to 198,265 jobs, 6,000 more than in 2001. Table 2.3. Total Employment (CBP), 2001 – 2007
2001 2004 2007
Benton 4,612 4,641 4,627
Cedar 4,114 3,629 4,198
Iowa 9,459 8,403 7,876
Johnson 52,276 53,876 59,267
Jones 4,457 4,555 4,675
Linn 111,650 104,433 110,578
Washington 5,783 5,578 7,044
REGION 192,351 185,115 198,265
STATE 1,255,162 1,241,864 1,303,436
U.S. 115,061,184 115,074,924 120,604,265
Source: U.S. Census Bureau, County Business Patterns, 2001, 2004, 2007.
11
Figure 2
Source: U
20,0
40,0
60,0
80,0
100,0
120,0
Tota
l Em
plo
yme
nt
2.1. Total E
U.S. Census B
0
000
000
000
000
000
000
Bento
mployment
Bureau, Coun
on Cedar
2001
t (CBP) by C
nty Business P
r Iowa
2004
County, 200
Patterns, 2001
Johnson
01 – 2007.
1, 2004, 2007
Jones
2007
.
Linn Washington

12
3. Income and Wages
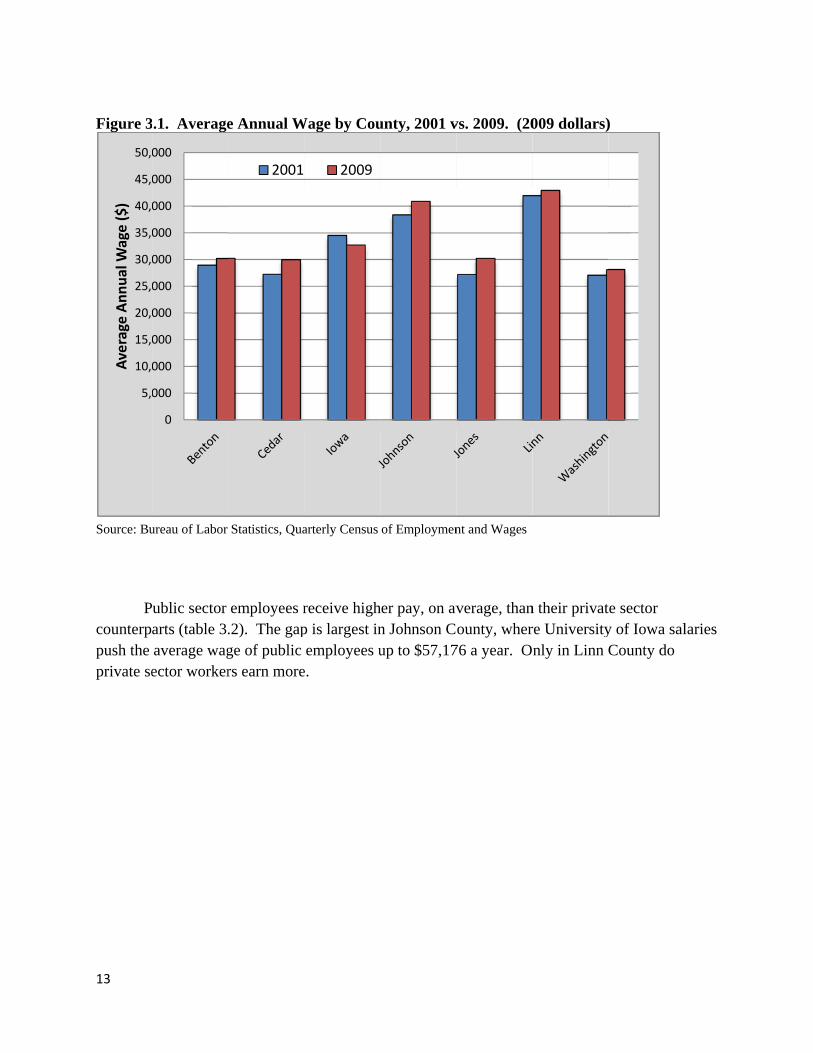
Average compensation for workers in the Corridor is above the state average (table 3.1). In 2001, workers in the region made about $3,000 (11.5%) more than the state average, but regional wages have grown more slowly than the state average. Accounting for inflation, regional wages increased by 3.9% between 2001 to 2009, compared to 6.4% for the state, although they finished around 10% above the state average. During this period, regional wages grew slightly faster than national wages, but finished 11% lower. Table 3.1. Average Annual Wage by County, 2001 vs. 2009. (2009 dollars).
2001 2009 Change
Benton 28,990 30,229 4.27%Cedar 27,274 29,966 9.87%Iowa 34,542 32,745 -5.20%Johnson 38,356 40,905 6.65%Jones 27,242 30,216 10.92%Linn 41,973 42,976 2.39%Washington 27,094 28,144 3.88%Region 38,976 40,480 3.86%State 34,933 37,165 6.39%U.S. 43,875 45,551 3.82%
Source: Bureau of Labor Statistics, Quarterly Census of Employment and Wages Within the region, there are some large disparities (figure 3.1). Linn and Johnson are the only two counties with average pay higher than the state, but they account for 85% of the total jobs. The difference between the lowest (Washington) and highest (Linn) paying counties is almost $15,000. ……………………………
13
Figure 3
Source: Bu
Pcounterppush the private se
5,0
10,0
15,0
20,0
25,0
30,0
35,0
40,0
45,0
50,0
Ave
rage A
nn
ual W
age (
$)
.1. Average
ureau of Labor
ublic sector arts (table 3.average wagector worker
0
000
000
000
000
000
000
000
000
000
000
e Annual W
Statistics, Qua
employees r.2). The gapge of public rs earn more
2001
Wage by Cou
arterly Census
receive highp is largest inemployees u
e.
2009
unty, 2001 v
of Employmen
her pay, on avn Johnson Cup to $57,17
vs. 2009. (20
nt and Wages
verage, thanounty, wher
76 a year. O
009 dollars)
n their privatre Universitynly in Linn C
)
te sector y of Iowa salCounty do
laries

14
Table 3.2
Benton
Cedar
Iowa
Johnson
Jones
Linn
Washing
Region
State
U.S. Source: Bu Figure 3
Source: Bu
$10,0
$20,0
$30,0
$40,0
$50,0
$60,0
Ave
rage A
nn
ual W
age (
$)
2. 2009 Ave
Pub
$34,0
$30,8
$33,5
n $57,1
$35,4
$40,6
gton $33,6
$48,6
$41,4
$47,5ureau of Labor
.2. 2009 An
ureau of Labor
$0
000
000
000
000
000
000
erage Annu
blic Priva
012 $28,8
876 $29,7
523 $32,6
176 $32,9
451 $28,6
660 $43,2
632 $26,8
694 $38,5
492 $36,3
548 $45,1Statistics, Qua
nnual Avera
Statistics, Qua
Public
Private
ual Wage, Pu
ate To
00 $30,2
37 $29,9
33 $32,7
21 $40,9
37 $30,2
60 $42,9
57 $28,1
20 $40,4
16 $37,1
46 $45,5arterly Census
age Wage by
arterly Census
ublic vs. Pri
otal
229
966
745
905
216
976
144
480
165
551 of Employmen
y County, P
of Employmen
ivate. (2009
nt and Wages
Public vs. Pr
nt and Wages
9 dollars)
rivate. (20009 dollars).

15
Wage figures from the Bureau of Labor Statistics report what the average employee would earn by working full time, year round. Income figures from the Census Bureau or the Bureau of Economic Analysis report all the income a person or household receives in a year, from all sources, regardless of whether or how much they work. Table 3.3. Per Capita Income, 2001 – 2008 (2009 dollars). County 2001 2002 2003 2004 2005 2006 2007 2008 Change
Benton $33,641 $33,757 $32,688 $33,872 $32,890 $33,317 $34,866 $36,210 7.63%
Cedar $35,016 $35,138 $35,062 $36,019 $34,352 $34,664 $36,339 $37,469 7.00%
Iowa $37,210 $38,618 $37,818 $39,132 $36,605 $36,536 $37,058 $38,423 3.26%
Johnson $36,361 $36,409 $36,013 $36,895 $36,438 $37,330 $38,364 $38,088 4.75%
Jones $28,142 $28,258 $27,730 $28,342 $27,347 $27,588 $28,260 $28,556 1.47%
Linn $38,229 $38,059 $37,998 $38,487 $38,493 $39,285 $40,189 $39,983 4.59%
Washington $33,737 $33,706 $33,931 $36,028 $35,654 $37,027 $38,470 $38,430 13.91%
Region $36,512 $36,519 $36,262 $37,044 $36,629 $37,386 $38,412 $38,432 5.26%
State $33,795 $34,386 $34,338 $35,990 $35,516 $36,059 $36,996 $37,376 10.59%
U.S. $37,729 $37,520 $37,627 $38,479 $38,913 $40,117 $40,759 $40,023 6.08%
Source: Bureau of Economic Analysis, Regional Economic Accounts, 2010. Figure 3.3. Per Capita Income, 2001 – 2008 (2009 dollars).
Source: Bureau of Economic Analysis, Regional Economic Accounts, 2010.
0
5,000
10,000
15,000
20,000
25,000
30,000
35,000
40,000
45,000
2001 2002 2003 2004 2005 2006 2007 2008
Inco
me
REGION STATE U.S.

16
A(table 3.3U.S. and Llowest ($ Figure 3
Source: B TincarcerainstitutioCounty (
$5,0
$10,0
$15,0
$20,0
$25,0
$30,0
$35,0
$40,0
$45,0
Inco
me
As with wage3). Regional 10.6% for th
Linn County $28,556) by
.4. Per Cap
Bureau of Eco
The low per cated populatinalized poputable 3.4).
$0
000
000
000
000
000
000
000
000
000
Be
es, per capitaincome grewhe State of Ihas the highsubstantial m
pita Income
onomic Analy
capita incomion. The Joulation) is st
enton Ce
a income is tw only 5.3%Iowa. hest per capitmargin (figur
e, 2008. (200
ysis, Regional
me in Jones Cnes County till the lowes
edar Iow
the corridor % between 20
ta income ($re 3.4).
09 dollars).
l Economic A
County is to smedian houst in the regi
wa Johnso
is below the001 and 200
$39,983), and
Accounts, 201
some degreesehold incomion, but is ju
on Jones
e nation but a8, compared
d Jones Cou
10.
e a reflectionme (which e
ust behind W
s Linn
above the stad to 6.1% for
unty has the
n of the largexcludes the
Washington
Washingto
ate r the
e
on

17
Table 3.4. Median Income by Household Type, 1990 - 2008. (2009 dollars.) All Households Family Households Non‐Family Households
1990 2000 2006‐2008 1990 2000
2006‐2008 1990 2000
2006‐2008
Benton $42,610 $52,858 $57,253 $50,675 $61,920 $69,169 $22,107 $28,474 $28,417
Cedar $45,489 $52,573 N/A $52,387 $60,860 N/A $25,687 $29,333 N/A
Iowa $43,628 $51,357 N/A $52,013 $60,980 N/A $22,033 $29,385 N/A
Johnson $45,734 $49,909 $54,863 $65,011 $74,891 $78,776 $26,752 $30,117 $31,325
Jones $40,183 $46,656 $46,458 $46,194 $55,153 $57,594 $19,965 $27,612 $27,422
Linn $52,751 $57,566 $54,267 $62,608 $70,384 $70,143 $28,806 $34,038 $32,595
Washington $42,385 $48,717 $53,138 $49,728 $56,856 $61,912 $24,497 $27,222 $29,612
STATE $43,053 $49,173 $50,271 $51,967 $59,807 $63,370 $23,292 $27,975 $28,537
U.S. $49,335 $52,319 $53,986 $57,820 $62,350 $65,404 $28,299 $32,025 $32,642
Source: U.S. Census Bureau, 1990 Census, 2000 Census, American Community Survey.
Johnson County had the third lowest median household income in 2000. In median income for family households, Johnson County was the regions highest (figure 3.5). The population of family households excludes much of the student population
Though we can’t compute a regional median from the county medians, the seven counties are in the range of the state and national medians for all households and for non-family households. For family households, the five smallest are in the range of state and national median, but Linn and Johnson are well above them.

18
Figure 3
Source: U
$10,
$20,
$30,
$40,
$50,
$60,
$70,
$80,
$90,
$100,
Me
dia
n In
com
e.5. Median
U.S. Census B
$0
000
000
000
000
000
000
000
000
000
000
Bent
n Income by
Bureau, 2000
on Ceda
HH In
Household
Census.
ar Iowa
ncome
d Type, 2000
a Johnso
Fam Incom
0. (2009 dol
on Jone
me N
llars)
s Linn
Non Fam Inco
Washing
ome
gton

19
4. Poverty
The U.S. Census Bureau calculates poverty rates by comparing a households income to the poverty levels established for that family size and composition. Income is before taxes and includes, most notably, wages from work, social security and pension payments, and public assistance in the form of cash (but not food assistance or housing vouchers). The thresholds were established in 1963, and are adjusted each year for inflation. They do not account for geographic variation in the cost of living.
Table 4.1. 2009 Poverty Thresholds.
Size of family unit None One Two Three Four Five Six
Seven
Eight or more
One person (unrelated individual)....
Under 65 years.......................
11,161
65 years and over....................
10,289
Two people............................
Householder under 65 years...........
14,366
14,787
Householder 65 years and over......
12,968
14,731
Three people..........................
16,781
17,268
17,285
Four people...........................
22,128
22,490
21,756
21,832
Five people...........................
26,686
27,074
26,245
25,603
25,211
Six people............................
30,693
30,815
30,180
29,571
28,666
28,130
Seven people..........................
35,316
35,537
34,777
34,247
33,260
32,108
30,845
Eight people..........................
39,498
39,847
39,130
38,501
37,610
36,478
35,300
35,000
Nine people or more...................
47,514
47,744
47,109
46,576
45,701
44,497
43,408
43,138
41,476
Source: U.S. Census Bureau.

20
Poverty rates in the corridor are slightly lower than rates for the State of Iowa, and generally 3 percentage points below the national rate.
Between 1990 and 2000, poverty rates dropped in the U.S., in the state of Iowa, and in all seven counties (table 4.2). The Iowa poverty rate dropped more sharply than the national rate. The biggest drops in the corridor were in Benton and Cedar counties. Both saw drops of around 5 percentage points, while the number of those living in poverty was cut nearly in half.
Poverty rates have come back up across the board in recent years. The American Community Survey (ACS) is an ongoing sample survey of households across the nation. The sample size is such that three year averages were available for five counties in the corridor. Unfortunately, Cedar and Iowa Counties are too small to allow reliable estimates, even over three years. With the long form being discontinued in the 2010 census, it is unclear when we will again have poverty rates for counties of this size.
Table 4.2. Poverty rates. 1990 2000 2006‐2008
Benton 11.4% 6.1% 6.8%Cedar 10.2% 5.5% N/AIowa 8.2% 5.0% N/AJohnson 17.1% 15.0% 16.8%Jones 11.5% 8.6% 11.1%Linn 8.6% 6.5% 9.9%Washington 9.5% 7.6% 9.1%Region 11.2% 8.8% N/AState 11.5% 9.1% 11.2%U.S. 13.1% 12.4% 13.2%Source: U.S. Census Bureau, 1990 Census, 2000 Census, American Community Survey.

21
Figure 4.1. National, State, and Regional Poverty Rates.
Source: U.S. Census Bureau, 1990 Census, 2000 Census.
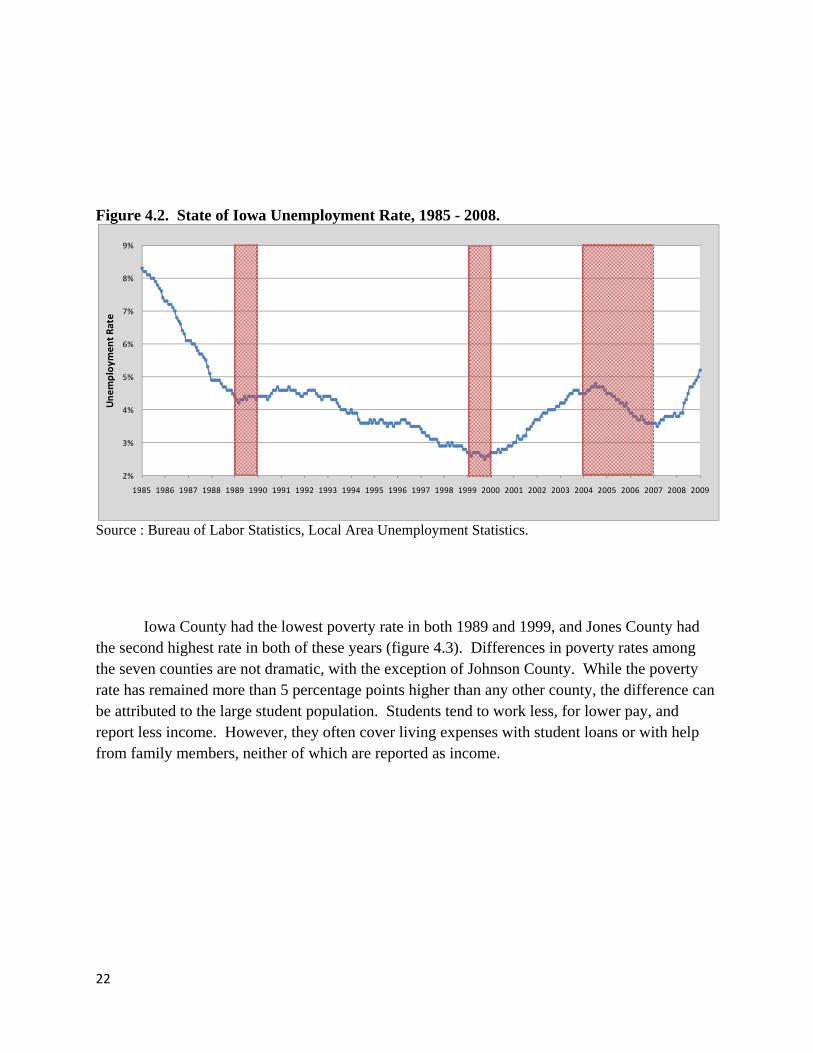
The drop in poverty rates between 1990 and 2000, and the recent resurgence are more likely a result of the business cycles than any permanent structural change. The red shaded areas of figure 4.2 signify the periods for which poverty rates are estimated in the 1990 census, 2000 census, and the 2006 – 2008 ACS average. The 2000 census poverty rates derive from income received during 1999, in which unemployment rates were significantly lower than in 1989 or during the three years of the most recent ACS estimates.
0%
2%
4%
6%
8%
10%
12%
14%
1990 2000
Po
vert
y R
ate
Region
State
U.S.
22
Figure 4.2. State of Iowa Unemployment Rate, 1985 - 2008.
Source : Bureau of Labor Statistics, Local Area Unemployment Statistics. Iowa County had the lowest poverty rate in both 1989 and 1999, and Jones County had the second highest rate in both of these years (figure 4.3). Differences in poverty rates among the seven counties are not dramatic, with the exception of Johnson County. While the poverty rate has remained more than 5 percentage points higher than any other county, the difference can be attributed to the large student population. Students tend to work less, for lower pay, and report less income. However, they often cover living expenses with student loans or with help from family members, neither of which are reported as income.
2%
3%
4%
5%
6%
7%
8%
9%
1985 1986 1987 1988 1989 1990 1991 1992 1993 1994 1995 1996 1997 1998 1999 2000 2001 2002 2003 2004 2005 2006 2007 2008 2009
Un
em
plo
yme
nt
Rat
e

23
Figure 4.3. County Poverty Rates.
Source: U.S. Census Bureau, 1990 Census, 2000 Census.
While we do not have data on poverty rates among the non-student population, the Decennial Census and the American Community Survey (ACS) report poverty rates by different household types. Focusing on the household population eliminates students living in dormitories, but students living alone or with friends off campus are still considered to be in households. The population in family households counts some students, and excludes many non-students, but it nonetheless paints a very different picture of poverty in the corridor.
0%
2%
4%
6%
8%
10%
12%
14%
16%
18%
20%
1990 2000
Po
vert
y R
ate
Benton Cedar Iowa Johnson Jones Linn Washington

24
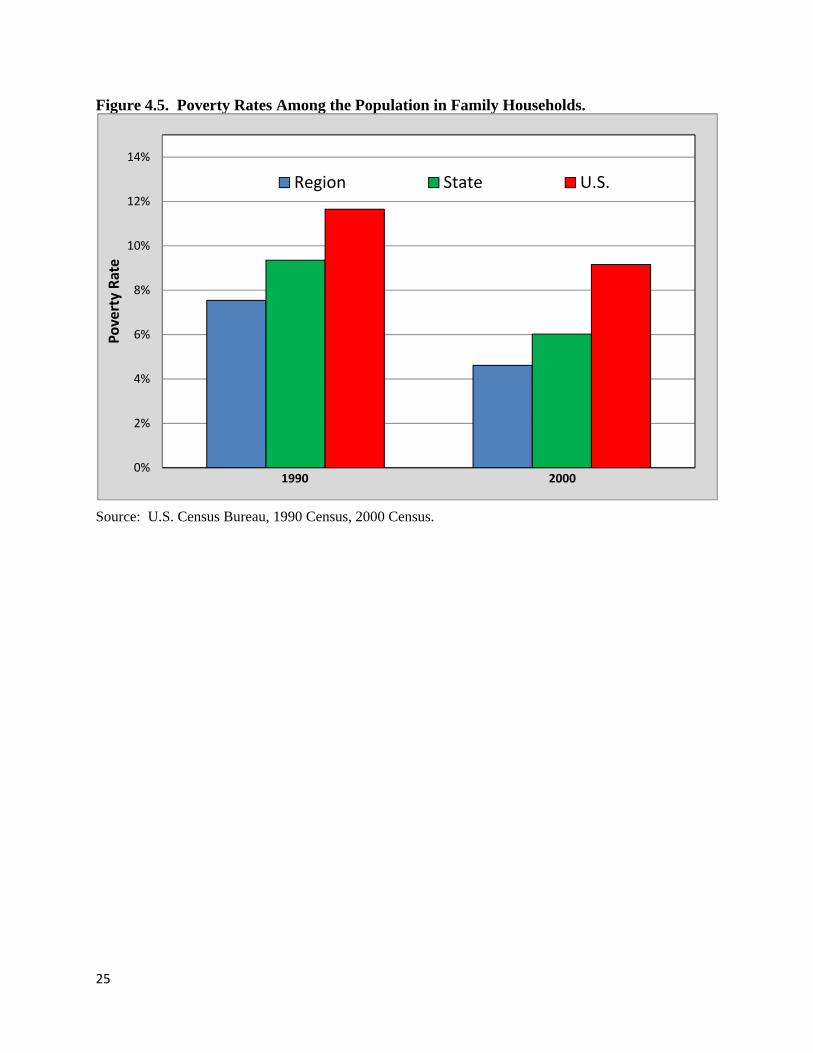
Figure 4.4. 2000 Poverty Rates Among the Population in Family Households.
Source: U.S. Census Bureau, 2000 Census.
Considering only family households, Johnson County no longer stands out (figure 4.4). The poverty rate in the Corridor in 1999 was 4.6%, compared to 6% in the State of Iowa and 9.2% in the U.S. (table 4.3). 2006 – 2008 estimates were not available for Cedar and Iowa counties, but only Jones County had a poverty rate higher than the State average in the most recent ACS.
Table 4.3. 1990 Poverty Rates Among the Population in Family Households.
1990 2000 2006-2008Benton 10.0% 4.6% 4.16%
Cedar 9.1% 4.0% N/A
Iowa 6.7% 3.4% N/A
Johnson 7.8% 5.2% 6.60%
Jones 10.0% 6.2% 7.71%
Linn 6.6% 4.3% 6.17%
Washington 8.3% 5.1% 7.17%
Region 7.5% 4.6% N/A
State 9.4% 6.0% 7.20%
U.S. 11.6% 9.2% 9.63%Source: U.S. Census Bureau, 1990 Census, 2000 Census, ACS.
0%
1%
2%
3%
4%
5%
6%
7%
8%P
ove
rty
Rat
e
Benton Cedar Iowa Johnson Jones Linn Washington
25
Figure 4.5. Poverty Rates Among the Population in Family Households.
Source: U.S. Census Bureau, 1990 Census, 2000 Census.
0%
2%
4%
6%
8%
10%
12%
14%
Po
vert
y R
ate
1990 2000
Region State U.S.
26
5. Housing Costs
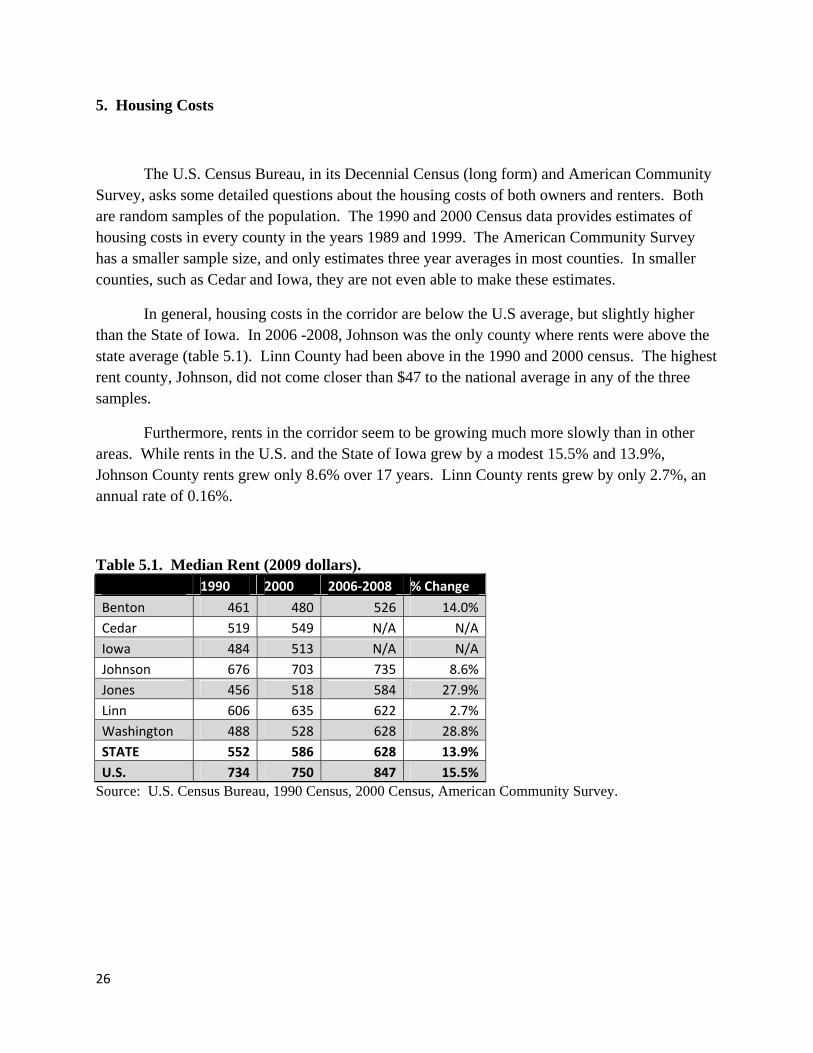
The U.S. Census Bureau, in its Decennial Census (long form) and American Community Survey, asks some detailed questions about the housing costs of both owners and renters. Both are random samples of the population. The 1990 and 2000 Census data provides estimates of housing costs in every county in the years 1989 and 1999. The American Community Survey has a smaller sample size, and only estimates three year averages in most counties. In smaller counties, such as Cedar and Iowa, they are not even able to make these estimates.
In general, housing costs in the corridor are below the U.S average, but slightly higher than the State of Iowa. In 2006 -2008, Johnson was the only county where rents were above the state average (table 5.1). Linn County had been above in the 1990 and 2000 census. The highest rent county, Johnson, did not come closer than $47 to the national average in any of the three samples.
Furthermore, rents in the corridor seem to be growing much more slowly than in other areas. While rents in the U.S. and the State of Iowa grew by a modest 15.5% and 13.9%, Johnson County rents grew only 8.6% over 17 years. Linn County rents grew by only 2.7%, an annual rate of 0.16%.
Table 5.1. Median Rent (2009 dollars). 1990 2000 2006‐2008 % Change
Benton 461 480 526 14.0%
Cedar 519 549 N/A N/A
Iowa 484 513 N/A N/A
Johnson 676 703 735 8.6%
Jones 456 518 584 27.9%
Linn 606 635 622 2.7%
Washington 488 528 628 28.8%
STATE 552 586 628 13.9%
U.S. 734 750 847 15.5%
Source: U.S. Census Bureau, 1990 Census, 2000 Census, American Community Survey.

27
Figure 5
Source: U Figure 5
Source: U
$0
$100
$200
$300
$400
$500
$600
$700
$800
$900
Me
dia
n R
en
t
$0
$100
$200
$300
$400
$500
$600
$700
$800
$900
Me
dia
nR
en
t5.1. 2006 - 2
U.S. Census B
5.2. Median
U.S. Census B
0
0
0
0
0
0
0
0
0
0Bento
0
0
0
0
0
0
0
0
0
0
2008 Median
Bureau, 1990
n Rent 1990
Bureau, 1990
on John
19
n Rent (200
Census, 2000
– 2008. (20
Census, 2000
son Jon
990
9 dollars).
0 Census, Am
009 dollars)
0 Census, Am
nes Linn
2000
merican Comm
merican Comm
n Washi
2
munity Survey
munity Survey
ngton S
006 ‐ 2008
y.
y.
State U.S
S.

28
Inaverage iJohnson appears tJohnson
Onationallynational r Table 5.2
Benton Cedar Iowa JohnsonJones Linn WashingSTATEU.S.
Source: U Figure 5
Source: U
$0
$200
$400
$600
$800
$1,000
$1,200
$1,400
$1,600
$1,800
Me
dia
n O
wn
er
Co
stn owner occuin the most rCounty to beto be more eand Linn ha
Owner costs hy, while cosrates.
2. Median O19
788
n 1279
gton 7E 8
11U.S. Census B
5.3. 2006 - 2
U.S. Census B
0
0
0
0
0
0
0
0
0
0Bento
upied housinrecent sample above the nxpensive forve been conhave grown t growth in B
Owner Cost990 200781 100857 97814 92207 136733 93976 115779 92877 99169 131Bureau, 1990
2008 Median
Bureau, 1990
on Johns
ng units, the le (table 5.2)nation. Comr owners. Wsistently higmore slowlyBenton, Jone
t (2009 doll00 2006-201 177 N20 N63 1
0 150 121 198 110 1
Census, 2000
n Owner Co
Census, 2000
son Jon
median own). The 1990 mpared to the
While the smagher, Johnsony in Linn andes, and Wash
ars). 2008 Ch
187 5N/AN/A437 1038 4247 2116 4
1136 291508 290 Census, Am
ost (2009 do
0 Census, Am
es Linn
ner cost is agand 2000 cee State of Ioaller five coun by at least d Johnson Chington Cou
hange2.1%N/AN/A
9.0%1.6%7.8%3.3%9.5%9.0%
merican Comm
ollars).
merican Comm
Washin
gain below tensus did fin
owa, howeveunties have $300 a mon
Counties thanunties has ex
munity Survey
munity Survey
ngton St
the national nd owner coser, the regioncomparable
nth. n they have xceeded state
y.
y.
tate U.S
sts in n costs,
e and
.

29
Hcosts as dthe perceless of th
Table 5.3
Benton Cedar Iowa JohnsonJones Linn WashingSTATEU.S.
Source: U
Figure 5
Source: U
0%
10%
20%
30%
% o
f In
com
eHome ownersdo those in thentages increheir income t
3. Owner C
19111
n 11
gton 1E 1
U.S. Census B
5.3. Owner
U.S. Census B
%
%
%
%Bento
s in the Corrhe rest of the
eased slightlytoward hous
Costs as a Pe
990 2006.2 19.7.1 19.6.5 119 20.
4.6 26.5 19.6.8 19.
17.3 19.21 21.
Bureau, 1990
Costs as Pe
Bureau, Ame
on Johns
ridor pay aboe state, arouy, but not neing than the
ercentage o
00 2006-2.6 .4 N9 N
.3 220 2.3 2.4 2.1 2.7 Census, 2000
rcentage of
erican Commu
son Jon
out the samend 22% (tab
early as much national ave
f Income, m
200822
N/AN/A22.422.621.421.421.4
250 Census, Am
f Income, me
unity Survey,
es Linn
e percentage ble 5.3). Durh as they diderage in 200
median valu
merican Comm
edian value
2008
Washin
of their incoring the reced elsewhere.00, before th
e.
munity Survey
e, 2006 – 200
ngton St
ome to housient housing b. Iowans stil
he housing bu
y.
08.
tate U.S
ing boom, ll pay ubble.
.

30
Rthan the spercentagmedians.percentagcan some
Table 5.4
Benton
Cedar
Iowa
Johnson
Jones
Linn
Washing
STATE
U.S.
Source: U Figure 5
Source: U
0%
10%
20%
30%
40%
% o
f In
com
eRenters in thestate averagege of income While Johnge of incomeetimes pay re
4. Rent as %
1990
2
2
1
2
1
2
gton 2
2
2U.S. Census B
5.4. Rent as
U.S. Census B
%
%
%
%
%Bento
e corridor hae (table 5.4).e spent on renson Countye is also a prent from oth
% of Income
0 2000
22.7 2
21.4 1
19.2 19.
28.3 30.
18.5 20.
23.2 22.
20.5 20.
24.1 23.
26.4 25.Bureau, 1990
% of Incom
Bureau, Amer
on Johns
ave tended to. The excepent has been y does have troduct the laher sources.
e, median v
2006‐20
20 25
19 N
.9 N
.5 33
.2 24
.4 25
.5 27
.2 27
.5 29Census, 2000
me, median v
rican Commu
son Jon
o spend a smtion is Johnssignificantly
the highest rrge student p
alue.
008
5.7
N/A
N/A
3.0
4.5
5.9
7.9
7.0
9.80 Census, Am
value, 2006
unity Survey,
es Linn
maller percenson County, y higher thanrents in the rpopulation, w
merican Comm
– 2008.
2008
Washin
ntage of their where the mn the State o
region, the hiwho work an
munity Survey
ngton St
r income on median or National igh rent as and earn less
y.
tate U.S
rent
a but
.
31
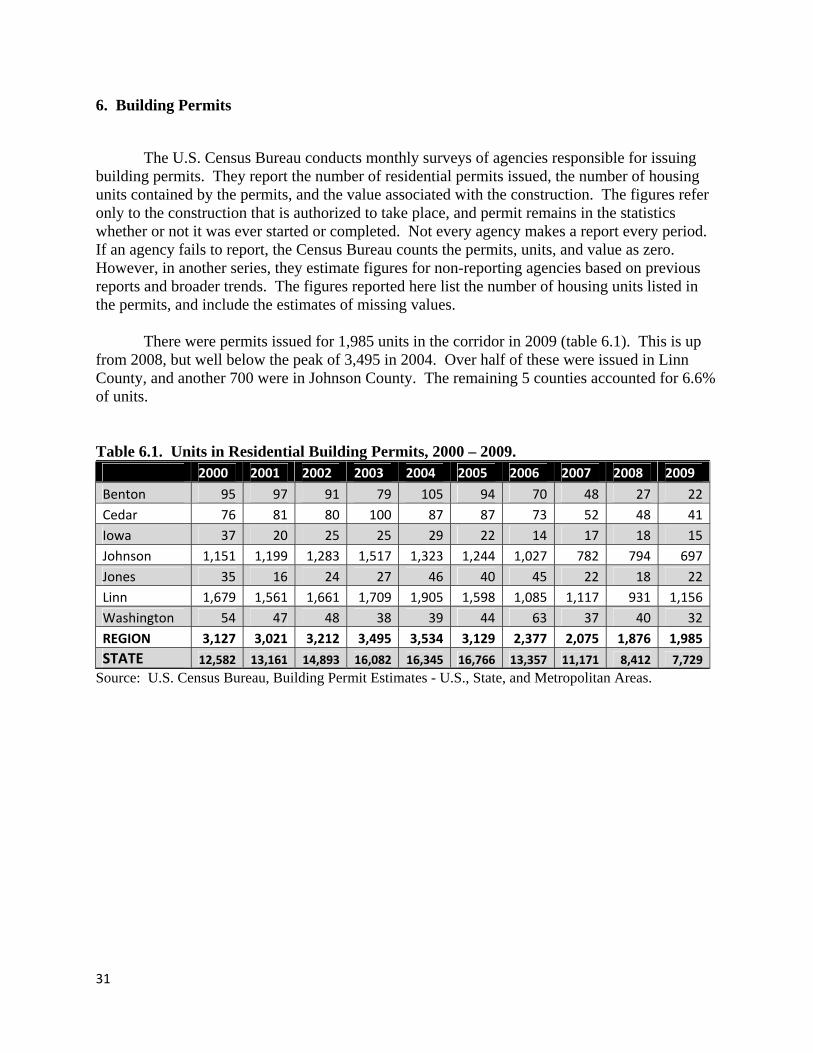
6. Building Permits
The U.S. Census Bureau conducts monthly surveys of agencies responsible for issuing building permits. They report the number of residential permits issued, the number of housing units contained by the permits, and the value associated with the construction. The figures refer only to the construction that is authorized to take place, and permit remains in the statistics whether or not it was ever started or completed. Not every agency makes a report every period. If an agency fails to report, the Census Bureau counts the permits, units, and value as zero. However, in another series, they estimate figures for non-reporting agencies based on previous reports and broader trends. The figures reported here list the number of housing units listed in the permits, and include the estimates of missing values. There were permits issued for 1,985 units in the corridor in 2009 (table 6.1). This is up from 2008, but well below the peak of 3,495 in 2004. Over half of these were issued in Linn County, and another 700 were in Johnson County. The remaining 5 counties accounted for 6.6% of units. Table 6.1. Units in Residential Building Permits, 2000 – 2009. 2000 2001 2002 2003 2004 2005 2006 2007 2008 2009
Benton 95 97 91 79 105 94 70 48 27 22
Cedar 76 81 80 100 87 87 73 52 48 41
Iowa 37 20 25 25 29 22 14 17 18 15
Johnson 1,151 1,199 1,283 1,517 1,323 1,244 1,027 782 794 697
Jones 35 16 24 27 46 40 45 22 18 22
Linn 1,679 1,561 1,661 1,709 1,905 1,598 1,085 1,117 931 1,156
Washington 54 47 48 38 39 44 63 37 40 32
REGION 3,127 3,021 3,212 3,495 3,534 3,129 2,377 2,075 1,876 1,985
STATE 12,582 13,161 14,893 16,082 16,345 16,766 13,357 11,171 8,412 7,729
Source: U.S. Census Bureau, Building Permit Estimates - U.S., State, and Metropolitan Areas.
32
Figure 6
Source: U
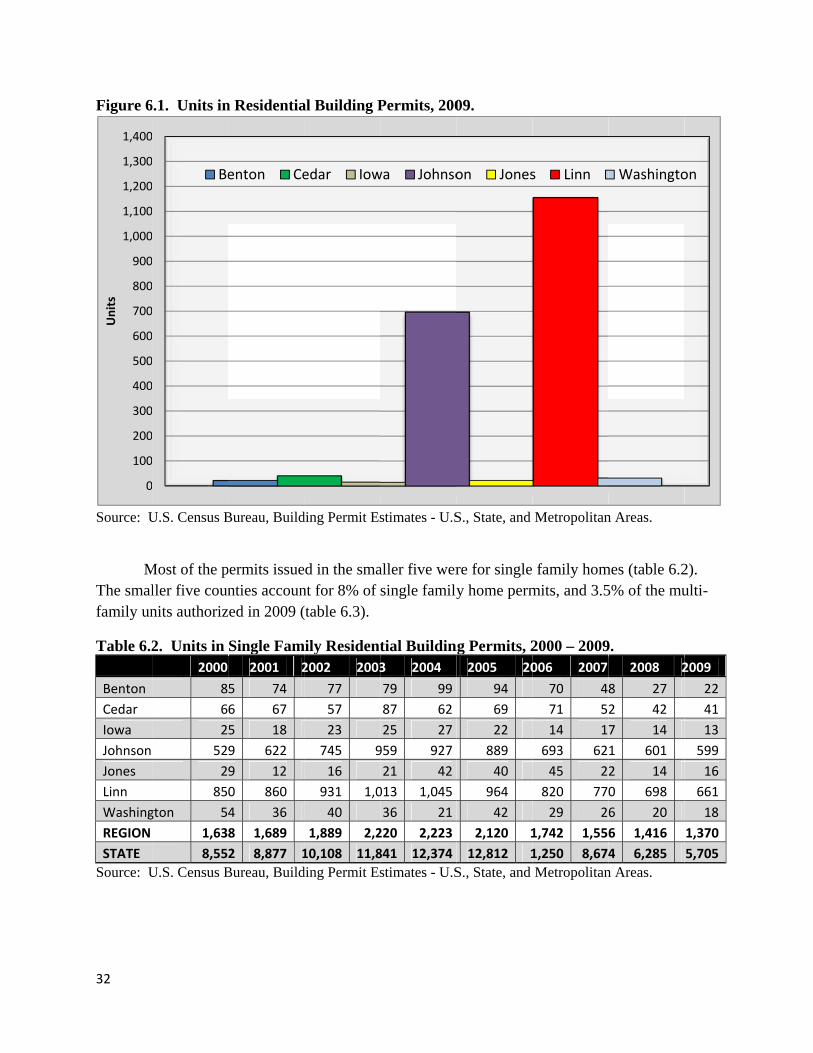
MThe smalfamily un
Table 6.2
Benton
Cedar
Iowa
Johnson
Jones
Linn
Washing
REGION
STATE
Source: U
0
100
200
300
400
500
600
700
800
900
1,000
1,100
1,200
1,300
1,400
Un
its
6.1. Units in
U.S. Census B
Most of the pller five counnits authoriz
2. Units in 2000
8
6
2
52
2
85
gton 5
1,63
8,55
U.S. Census B
0
0
0
0
0
0
0
0
0
0
0
0
0
0
0
Be
n Residentia
Bureau, Build
permits issuenties accoun
zed in 2009 (
Single Fam2001 2
5 74
6 67
5 18
9 622
9 12
0 860
4 36
8 1,689
2 8,877 1
Bureau, Build
enton Ce
al Building P
ding Permit Es
ed in the smant for 8% of (table 6.3).
mily Resident2002 2003
77
57
23
745 9
16
931 1,0
40
1,889 2,2
10,108 11,8
ding Permit Es
edar Iow
Permits, 200
stimates - U.S
aller five wersingle family
tial Buildin3 2004
79 99
87 62
25 27
959 927
21 42
013 1,045
36 21
220 2,223
841 12,374
stimates - U.S
wa Johnso
09.
S., State, and
re for singley home perm
ng Permits, 22005 20
94
69
22
889
40
964
42
2,120 1
12,812 1
S., State, and
on Jones
Metropolitan
family hommits, and 3.5
2000 – 2009006 2007
70 4
71 5
14 1
693 62
45 2
820 77
29 2
1,742 1,55
1,250 8,674
Metropolitan
s Linn
n Areas.
mes (table 6.25% of the mu
9. 2008 2
8 27
2 42
7 14
1 601
2 14
0 698
6 20
6 1,416
4 6,285
n Areas.
Washingto
2). ulti-
2009
22
41
13
599
16
661
18
1,370
5,705
on

33
Figure 6
Source: U
Table 6.3
Benton
Cedar
Iowa
Johnson
Jones
Linn
Washing
REGION
STATE
Source: U
0
100
200
300
400
500
600
700
800U
nit
s6.2. Units in
U.S. Census B
3. Units in 2000
1
1
1
62
82
gton
1,48
4,03
U.S. Census B
0
0
0
0
0
0
0
0
0
Be
n Single Fam
Bureau, Build
Multi-Fami2001 2
0 23
0 14
2 2
2 577
6 4
9 701
0 11
9 1,332
0 4,284
Bureau, Build
enton Ce
mily Residen
ding Permit Es
ily Resident2002 2003
14
23 1
2
538 55
8
730 69
8
1,323 1,27
4,785 4,24
ding Permit Es
edar Iow
ntial Buildin
stimates - U.S
tial Building3 2004
0 6
13 25
0 2
58 396
6 4
96 860
2 18
75 1,311
41 3,971
stimates - U.S
wa Johnso
ng Permits,
S., State, and
g Permits, 22005 200
0
18
0
355 3
0
634 2
2
1,009 6
3,954 3,1
S., State, and
on Jones
2009.
Metropolitan
2000 – 20096 2007
0 0
2 0
0 0
34 161
0 0
65 347
34 11
35 519
07 2,497
Metropolitan
s Linn
n Areas.
. 2008 200
0
6
4
193
4
233 4
20
460 6
2,127 2,0
n Areas.
Washingto
09
0
0
2
98
6
495
14
615
024
on

34
Figure 6
Source: U
Tin multi-fin 2008 tthe remai Table 6.4
REGION
STATE
Source: U
0
100
200
300
400
500
600U
nit
s6.3. Units in
U.S. Census B
The Corridor family buildthe region hainder of the
4. Percent o
2000
47.6%
32.0%
U.S. Census B
0
0
0
0
0
0
0
Be
n Multi-Fam
Bureau, Build
is more urbdings (table 6ad a lower pestate.
of Units in M
2001 2
% 44.1% 4
% 32.6% 3
Bureau, Build
enton Ce
mily Residen
ding Permit Es
an than the s6.4). Howevercentage of
Multi-Fami
2002 2003
41.2% 36.5
32.1% 26.4
ding Permit Es
edar Iow
ntial Buildin
stimates - U.S
state as a whver, that gap f unit-permit
ily Permits,
3 2004
% 37.1%
4% 24.3%
stimates - U.S
wa Johnso
ng Permits,
S., State, and
hole, and hashas been sh
ts issued for
200 - 2009.
2005 200
32.2% 26.7
23.6% 23.3
S., State, and
on Jones
2009.
Metropolitan
s a larger shahrinking this
multi-family
6 2007
7% 25.0%
3% 22.4%
Metropolitan
s Linn
n Areas.
are of its houpast decadey housing th
2008 200
24.5% 31.
25.3% 26.
n Areas.
Washingto
using , and
han
09
0%
2%
on

35
Figure 6
Source: U
T6.5). SinCorridorin the regearlier thyear, unit
0%
10%
20%
30%
40%
50%
% M
ult
i Fam
ily
6.4. Percent
U.S. Census B
The trend in Cnce 1990, alm. The two exgion, and thehan they did ts in the Cor
%
%
%
%
%
%
2000
t of Units in
Bureau, Build
Corridor buimost every yxceptions wee current dowstatewide. Arridor increa
2001 2002
Multi-Fam
ding Permit Es
ilding permityear that permere the houswnturn. PermAnd while insed after fou
2 2003
mily Permits
stimates - U.S
ts have closemits increaseing boom inmits in the Cn 2009 units ur years of d
2004 200
, 200 - 2009
S., State, and
ely followeded in the Sta
n the late 90sCorridor beg
fell statewideclines.
05 2006
Region
9.
Metropolitan
d state-wide tate, they alsos, which peakan falling inde for the fou
2007 20
State
n Areas.
trends (figuro increased inked a year la
n 2005, a yeaurth consecu
008 2009
re n the ater ar utive

36
Figure 6.5. Units in Residential Building Permits, 1990 - 2009.
Source: U.S. Census Bureau, Building Permit Estimates - U.S., State, and Metropolitan Areas.
0
2,000
4,000
6,000
8,000
10,000
12,000
14,000
16,000
18,000
0
1,000
2,000
3,000
4,000
5,000
1990 1995 2000 2005 2010
Bu
ildin
g P
erm
its: S
TATE
Bu
ildin
g P
erm
its
: R
EGIO
N
REGION
STATE

37
7. Business Starts
Data on business starts comes from the National Establishment Time Series (NETS) database, compiled by Walls and Associates and Dunn and Bradstreet. While the source data is proprietary and quite expensive, the Edward Lowe Foundation has made limited data available online through their website YourEconomy.org. The series tracks establishments as they open, expand, relocate, and close. An establishment is a single physical location.
Between 2001 and 2004, around 6,500 new establishments sprung up in the Corridor (table 7.1). This means that of all the establishments in operation in 2004, 6,500 of them were not in existence in 2001. Another 311 of the establishments existed in both years, but in different counties. Some may have moved with the region, and some may have come from outside (table 7.2). 229 of the Corridor establishment existing in 2001 had moved counties by 2004, so the period saw more establishment move into the Corridor than out.
The region saw 6,700 business starts between 2004 and 2007, 200 more than during the previous 3 years. The Nation and the State of Iowa saw relatively larger increases in business starts during that period.
Table 7.1. Business Starts.
2001‐2004 2004‐2007
Benton 328 353
Cedar 239 263
Iowa 236 296
Johnson 1,863 1,973
Jones 279 249
Linn 3,255 3,189
Washington 347 378
REGION 6,547 6,701
STATE 50,278 64,957
U.S. 5,422,697 7,343,426Source: Walls and Associates, National Establishment Time Series.

38
Table 7.2
Benton
Cedar
Iowa
Johnson
Jones
Linn
Washing
REGION
STATE
Source: W L2001 and Figure 7
Source: W
1,00
2,00
3,00
4,00
Bu
sin
ess S
tart
s
2. Business
gton
3
Walls and Ass
Linn and Johns2004. They a
7.1. Busines
Walls and Ass
0
00
00
00
00
Bent
s Relocation2001‐2004
IN
23
16
17
87
20
126
22
311*
635
sociates, Nati
son Counties accounted for
ss Starts, 20
sociates, Nati
ton Ceda
n.
OUT
27
16
13
53
22
79
19
229*
937
*changed count
ional Establis
accounted for only 70.1%
04 – 2007.
ional Establis
ar Iowa
2004 ‐ 200
IN
17
9
17
80
6
93
10
232*
564
ty, possibly with
hment Time S
or the vast majbetween 200
hment Time S
Johnson
07
OUT
22
11
10
48
9
79
17
196*
632
hin region
Series.
ajority (76.4%4 – 2007.
Series.
Jones
%) of business
Linn W
s starts betwee
Washington
en
39
Tcoverageand Emp
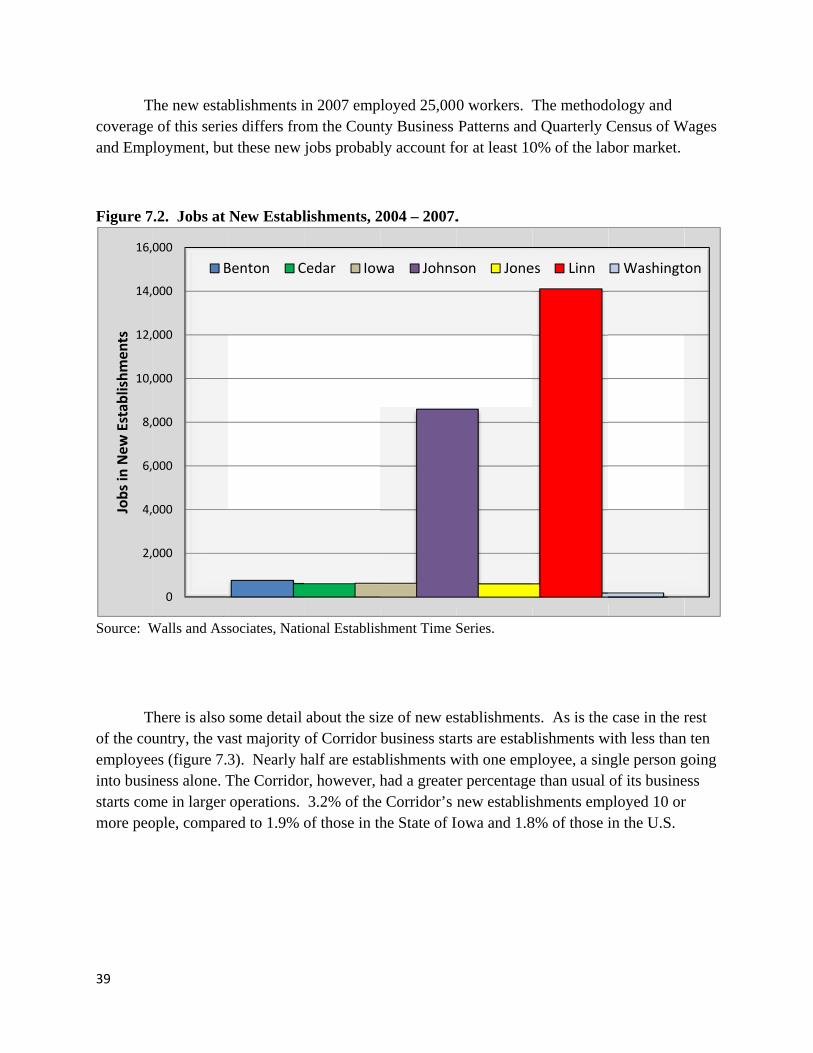
Figure 7
Source: W
Tof the couemployeeinto businstarts commore peo
2,
4,
6,
8,
10,
12,
14,
16,
Job
s in N
ew E
stab
lish
me
nts
The new estabe of this serieployment, bu
7.2. Jobs at
Walls and Ass
There is also untry, the vaes (figure 7.3ness alone. Tme in larger ople, compar
0
000
000
000
000
000
000
000
000
B
blishments ies differs frout these new j
New Establ
sociates, Nati
some detail ast majority 3). Nearly hThe Corridoroperations.
red to 1.9% o
Benton C
in 2007 empom the Counjobs probabl
lishments, 2
ional Establis
about the sizof Corridor
half are estabr, however, h3.2% of the
of those in th
Cedar Iow
loyed 25,00nty Business ly account fo
2004 – 2007.
hment Time S
ze of new esbusiness stablishments whad a greate
e Corridor’s he State of I
wa Johns
0 workers. TPatterns and
for at least 10
.
Series.
stablishmentarts are estabwith one emper percentagenew establis
Iowa and 1.8
son Jone
The methodd Quarterly C0% of the lab
ts. As is the blishments wployee, a sine than usual shments emp8% of those i
es Linn
dology and Census of Wbor market.
case in the rwith less thanngle person gof its busine
ployed 10 orin the U.S.
Washingt
Wages
rest n ten going ess r
on

40
Figure 7.3. Business Starts by Establishment Size, 2004 -2007.
Source: Walls and Associates, National Establishment Time Series.
45.0%
51.8%
3.2%
51.2%
46.8%
1.9%
45.4%
52.8%
1.8%
0%
10%
20%
30%
40%
50%
60%
1(self employed) 2 ‐ 9 10 +
% o
f B
usi
ne
ss S
tart
s
Size of Establishment (employees)
Region State U.S.

41
8. Patents
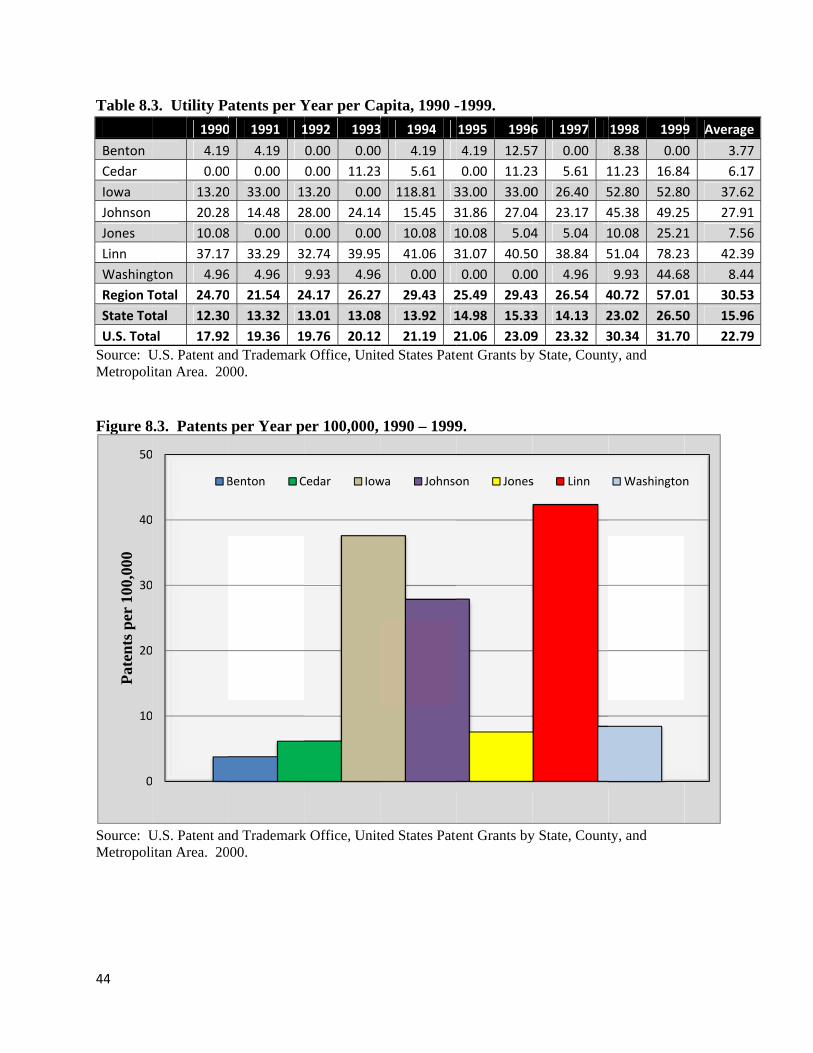
The U.S. Patent and Trademark office released a report in 2000 detailing the number of utility patents (patents for invention, as opposed to design) in each county in the United States from 1990 to 1999. Each patent was assigned the residing county of the first inventor listed. This may not always be the county in which the inventor worked.
In nine of the ten years reported, Linn County had the most patents issued, followed by Johnson County. The exception was 1994, when Iowa County had 18 patents to Johnson County’s 16 (table 8.1).
Table 8.1. Utility Patents by Year.
1990 1991 1992 1993 1994 1995 1996 1997 1998 1999
Benton 1 1 0 0 1 1 3 0 2 0
Cedar 0 0 0 2 1 0 2 1 2 3
Iowa 2 5 2 0 18 5 5 4 8 8
Johnson 21 15 29 25 16 33 28 24 47 51
Jones 2 0 0 0 2 2 1 1 2 5
Linn 67 60 59 72 74 56 73 70 92 141
Washington 1 1 2 1 0 0 0 1 2 9
REGION 94 82 92 100 112 97 112 101 155 217
STATE 349 378 369 371 395 425 435 401 653 752
U.S. 47,497 51,308 52,376 53,340 56,160 55,836 61,200 61,813 80,417 84,029Source: U.S. Patent and Trademark Office, United States Patent Grants by State, County, and Metropolitan Area. 2000.

42
Figure 8
Source: UMetropoli
Dstate of Iit was a cfigures w
0
100
200
300
400
500
600
700
800
900
Tota
l Pat
en
ts8.1. Total U
U.S. Patent anitan Area. 20
During the 90owa (table 8close second
were arrived
0
0
0
0
0
0
0
0
0
0
B
Utility Patent
nd Trademark000.
0s, the Corrid8.2, figure 8.d to Linn Couat using the
Benton C
ts 1990 -199
k Office, Unit
dor accounte2). While Iounty in patenaverage of e
Cedar Iow
99.
ted States Pate
ed for more owa County nts per 100,0each county’
wa Johnso
ent Grants by
than 1 in evwas a distan
000 people (’s 1990 and
on Jones
y State, Count
ery 4 patentnt third in to(table 8.3). (2000 popula
s Linn
ty, and
s issued in thotal patents is(The per 100ation.)
Washington
he ssued, 0,000
n

43
Table 8.2
Benton
Cedar
Iowa
Johnson
Jones
Linn
Washing
REGION
STATE
U.S. Source: UMetropoli
Figure 8
Source: UMetropoli
2. Total Ut
Paten
n
gton
N 1,
4,
603,U.S. Patent anitan Area. 20
8.2. Total U
U.S. Patent anitan Area. 20
ility Patents
nts Per Ye
9
11
57
289
15
764
17
162
528
976 nd Trademark000.
Utility Patent
nd Trademark000.
s, 1990 – 19
ear Per 100,00
3.
6.
37.
27.
7.
42.
8.
30.
15.
22.k Office, Unit
ts, 1990 – 19
k Office, Unit
99.
00
.77
.17
.62
.91
.56
.39
.44
.53
.96
.79ted States Pate
999.
ted States Pate
ent Grants by
ent Grants by
y State, Count
y State, Count
ty, and
ty, and
44
Table 8.3
Benton
Cedar
Iowa
Johnson
Jones
Linn
Washing
Region T
State To
U.S. Tota
Source: UMetropoli Figure 8
Source: UMetropoli
0
10
20
30
40
50
Pat
ents
per
100
,000
3. Utility P
1990
4.19
0.00
13.20
20.28
10.08
37.17
gton 4.96
Total 24.70
tal 12.30
al 17.92
U.S. Patent anitan Area. 20
8.3. Patents
U.S. Patent anitan Area. 20
0
0
0
0
0
0
B
atents per Y
0 1991 1
9 4.19
0 0.00
0 33.00 1
8 14.48 2
8 0.00
7 33.29 3
6 4.96
0 21.54 2
0 13.32 1
2 19.36 1
nd Trademark000.
per Year p
nd Trademark000.
Benton C
Year per Ca
1992 1993
0.00 0.00
0.00 11.23
3.20 0.00
8.00 24.14
0.00 0.00
2.74 39.95
9.93 4.96
4.17 26.27
3.01 13.08
9.76 20.12
k Office, Unit
er 100,000,
k Office, Unit
Cedar Iow
apita, 1990 -
3 1994
0 4.19
5.61
0 118.81 3
4 15.45 3
0 10.08 1
41.06 3
6 0.00
7 29.43 2
8 13.92 1
2 21.19 2
ted States Pate
1990 – 1999
ted States Pate
wa Johnso
-1999.
1995 1996
4.19 12.57
0.00 11.23
33.00 33.00
31.86 27.04
10.08 5.04
31.07 40.50
0.00 0.00
25.49 29.43
14.98 15.33
21.06 23.09
ent Grants by
9.
ent Grants by
on Jones
6 1997
7 0.00
3 5.61 1
0 26.40 5
4 23.17 4
4 5.04 1
0 38.84 5
0 4.96
3 26.54 4
3 14.13 2
9 23.32 3
y State, Count
y State, Count
s Linn
1998 1999
8.38 0.00
11.23 16.84
52.80 52.80
45.38 49.25
10.08 25.21
51.04 78.23
9.93 44.68
40.72 57.01
23.02 26.50
30.34 31.70
ty, and
ty, and
Washington
9 Average
0 3.77
4 6.17
0 37.62
5 27.91
1 7.56
3 42.39
8 8.44
1 30.53
0 15.96
0 22.79
n

45
In each year, the Corridor was above the national average in patents per capita, and significantly above the state average (figure 8.4). Over the decade, the Corridor averaged 30.5 patents per year per 100,000, nearly twice the state average of 16. The national average was 22.8 (table 8.2). Most of the innovation took place in Johnson and Linn Counties.
Figure 8.4. Patents per Year per 100,000, 1990 - 1999
Source: U.S. Patent and Trademark Office, United States Patent Grants by State, County, and Metropolitan Area. 2000.
0
10
20
30
40
50
60
1990 1991 1992 1993 1994 1995 1996 1997 1998 1999
Pat
en
ts p
er
10
0,0
00
Region State U.S.

46
9. Capit
Alevel, theexpendituthey havehas not y
Gheadingsgovernmgovernmlisted hav
Figure 9
Source: UGovernme
$50,000,
$100,000,
$150,000,
$200,000,
tal Investme
Although datae Census of Gures for evere been aggre
yet been aggr
Governments of ‘construc
ments within tment would b
ve not been a
9.1. Public C
U.S. Census Bents.
$0
,000
,000
,000
,000
B
ent
a on capital Governmentry governmeegated by coregated.
s report capitction’ and ‘othe county. e included, badjusted for
Capital Inve
ureau, Gover
Benton C
investment bts, conductedent body in thunty. The 2
tal expendituother capital Investments
but not invesinflation.
estment by
rnments Divis
1997
Cedar Iow
by the privatd every five he nation. F
2007 Census
ures in over outlays’. In
s funded by gstments mad
County, 199
sion. 1997 Ce
wa Johnso
te sector is nyears, repor
For the data cof Governm
80 categoriencluded are igrants from
de directly by
97 and 2002
ensus of Gove
on Jones
not availablerts the revenucollected in
ments has bee
es divided beinvestments the State or y such bodie
2. (2009 Do
ernments, 200
2002
s Linn
e at the countues and 1997 and 20en released b
etween the bmade by Federal
es. The figur
ollars)
02 Census of
Washington
ty
002 but
broad
res
f
n

47
Linn andinvestme(figure 9
Figure 9
Source: UGovernme
Incounterpamountinwhich neconstruct
$
$10
$20
$30
$40
$50
$60
$70
$80
$90
$1,00
Inve
stm
en
t p
er
Cap
ita
d Johnson, thent in both ye.2), Linn Co
9.2. Public C
U.S. Census Bents.
n both years,arts in the reng to aroundearly tripled tion (tables 9
$0
00
00
00
00
00
00
00
00
00
00
Be
he two most pears (figure 9
ounty was no
Capital Inve
ureau, Gover
, the governmest of the statd $100 per pefrom 42 mil9.1 and 9.2).
19
nton Ced
populous co9.1). Thoug
ot significant
estment Per
rnments Divis
ments of thete (figure 9.3erson. Muchlion to 117 m
997
dar Iowa
ounties, accogh they also mtly higher tha
r Capita, 19
sion. 1997 Ce
e corridor reg3). The gap h of the incremillion. Joh
a Johnso
unted for themade the laran Cedar an
997 and 2002
ensus of Gove
gion investedwas much m
ease came inhnson County
n Jones
e majority (orgest investm
nd Iowa coun
2. (2009 do
ernments, 200
d more per cmore pronoun Linn Couny spent 17 m
2002
Linn
over 80%) oments per capnties in 1997
ollars)
02 Census of
capita than thunced in 200nty constructmillion more
Washington
of pita
7.
f
heir 02, ion, on
n

48
Table 9.1. Public Capital Investment, 1997. (2009 dollars)
County Construction Other Capital
OutlaysTotal Capitial
Investment
Benton 5,675,540 2,212,204 7,887,744
Cedar 4,404,358 4,342,870 8,747,228
Iowa 5,302,606 2,242,948 7,545,554
Johnson 74,142,918 11,421,923 85,564,841
Jones 5,854,655 2,589,147 8,443,802
Linn 56,865,003 41,398,289 98,263,293
Washington 4,929,673 2,348,545 7,278,218
Region Total 157,174,752 66,555,927 223,730,679
State Total 1,054,939,248 449,856,687 1,504,795,935 Source: U.S. Census Bureau, Governments Division. 1997 Census of Governments.
Table 9.2. Public Capital Investment, 2002. (2009 dollars)
County Construction Other Capital
OutlaysTotal Capitial
Investment Benton 9,562,936 2,853,736 12,416,672
Cedar 5,566,752 2,992,070 8,558,822
Iowa 7,548,745 1,912,826 9,461,571
Johnson 86,464,731 12,172,202 98,636,934
Jones 7,097,967 3,172,142 10,270,109
Linn 139,949,915 28,212,987 168,162,902
Washington 7,094,389 2,424,423 9,518,812
Region Total 263,285,435 53,740,386 317,025,821
State Total 1,519,505,109 422,433,967 1,941,939,076 Source: U.S. Census Bureau, Governments Division. 2002 Census of Governments.
The size of these increases illustrates just how variable these figures are. Major projects could fall in a Census of Government year or they could fall in between years. These public investments may bring benefits to the region for a long period of time. Large projects are almost always paid for over a long period, while the expenditures are limited to one or two years.

49
Table 9.3. Public Capital Investment Per Capita, 1997 vs. 2002. (2009 dollars) 1997 2002
Benton $311 $490
Cedar $481 $471
Iowa $481 $603
Johnson $771 $888
Jones $417 $508
Linn $512 $878
Washington $352 $460
REGION $556 $787
STATE $517 $667 Source: U.S. Census Bureau, Governments Division. 1997 Census of Governments, 2002 Census of Governments.
Figure 9.3. Public Capital Investment Per Capita, 1997 and 2002. (2009 dollars)
Source: U.S. Census Bureau, Governments Division. 1997 Census of Governments, 2002 Census of Governments.
$0
$100
$200
$300
$400
$500
$600
$700
$800
1997 2002
Pu
blic C
apit
al In
vest
me
nt
Region State
50
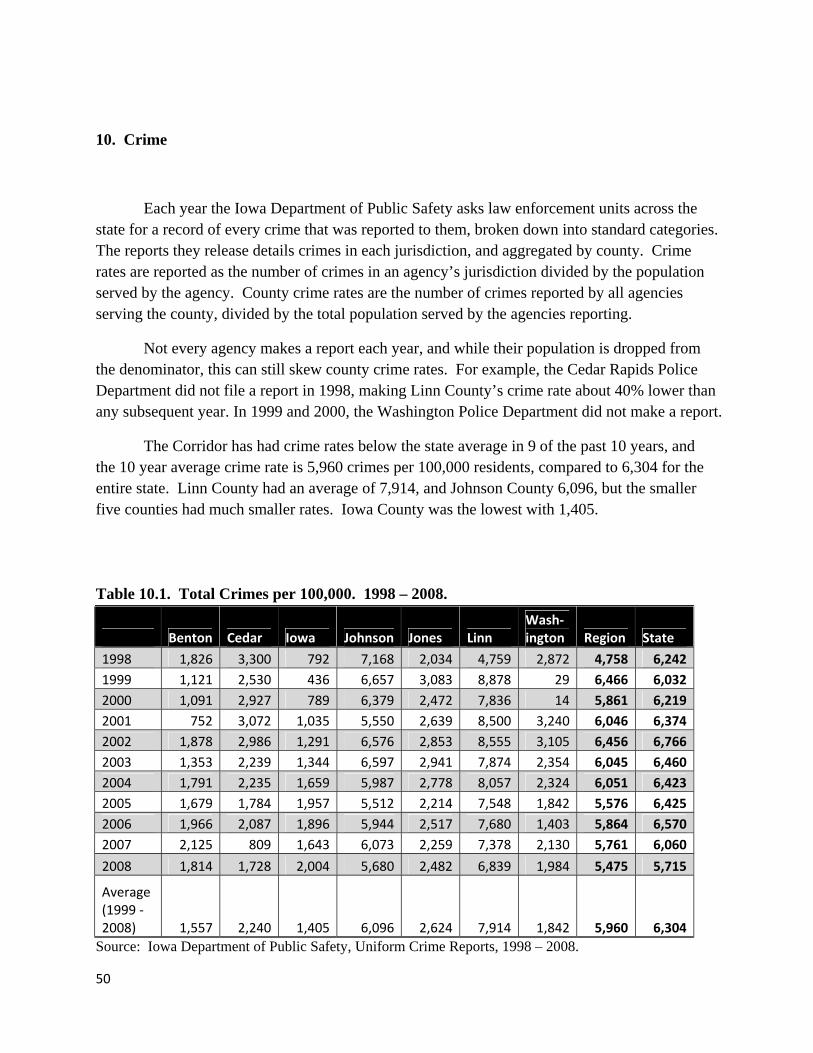
10. Crime
Each year the Iowa Department of Public Safety asks law enforcement units across the state for a record of every crime that was reported to them, broken down into standard categories. The reports they release details crimes in each jurisdiction, and aggregated by county. Crime rates are reported as the number of crimes in an agency’s jurisdiction divided by the population served by the agency. County crime rates are the number of crimes reported by all agencies serving the county, divided by the total population served by the agencies reporting.
Not every agency makes a report each year, and while their population is dropped from the denominator, this can still skew county crime rates. For example, the Cedar Rapids Police Department did not file a report in 1998, making Linn County’s crime rate about 40% lower than any subsequent year. In 1999 and 2000, the Washington Police Department did not make a report.
The Corridor has had crime rates below the state average in 9 of the past 10 years, and the 10 year average crime rate is 5,960 crimes per 100,000 residents, compared to 6,304 for the entire state. Linn County had an average of 7,914, and Johnson County 6,096, but the smaller five counties had much smaller rates. Iowa County was the lowest with 1,405. Table 10.1. Total Crimes per 100,000. 1998 – 2008.
Benton Cedar Iowa Johnson Jones Linn Wash‐ington Region State
1998 1,826 3,300 792 7,168 2,034 4,759 2,872 4,758 6,242
1999 1,121 2,530 436 6,657 3,083 8,878 29 6,466 6,032
2000 1,091 2,927 789 6,379 2,472 7,836 14 5,861 6,219
2001 752 3,072 1,035 5,550 2,639 8,500 3,240 6,046 6,374
2002 1,878 2,986 1,291 6,576 2,853 8,555 3,105 6,456 6,766
2003 1,353 2,239 1,344 6,597 2,941 7,874 2,354 6,045 6,460
2004 1,791 2,235 1,659 5,987 2,778 8,057 2,324 6,051 6,423
2005 1,679 1,784 1,957 5,512 2,214 7,548 1,842 5,576 6,425
2006 1,966 2,087 1,896 5,944 2,517 7,680 1,403 5,864 6,570
2007 2,125 809 1,643 6,073 2,259 7,378 2,130 5,761 6,060
2008 1,814 1,728 2,004 5,680 2,482 6,839 1,984 5,475 5,715
Average (1999 ‐ 2008) 1,557 2,240 1,405 6,096 2,624 7,914 1,842 5,960 6,304
Source: Iowa Department of Public Safety, Uniform Crime Reports, 1998 – 2008.

51
Figure 10.1. Crimes per 100,000 persons, 1998 – 2008.
Source: Iowa Department of Public Safety, Uniform Crime Reports, 1998 – 2008.
Figure 10.2. Total Crimes per Year per 100,000, 1999 – 2008.
Source: Iowa Department of Public Safety, Uniform Crime Reports, 1999 – 2008.
0
1,000
2,000
3,000
4,000
5,000
6,000
7,000
8,000
1998 1999 2000 2001 2002 2003 2004 2005 2006 2007 2008
Cri
me
s p
er
10
0,0
00
Region State
0
1,000
2,000
3,000
4,000
5,000
6,000
7,000
8,000
9,000
Cri
me
s p
er
10
0,0
00 p
op
ula
tio
n
Benton Cedar Iowa Johnson Jones Linn Washington

52
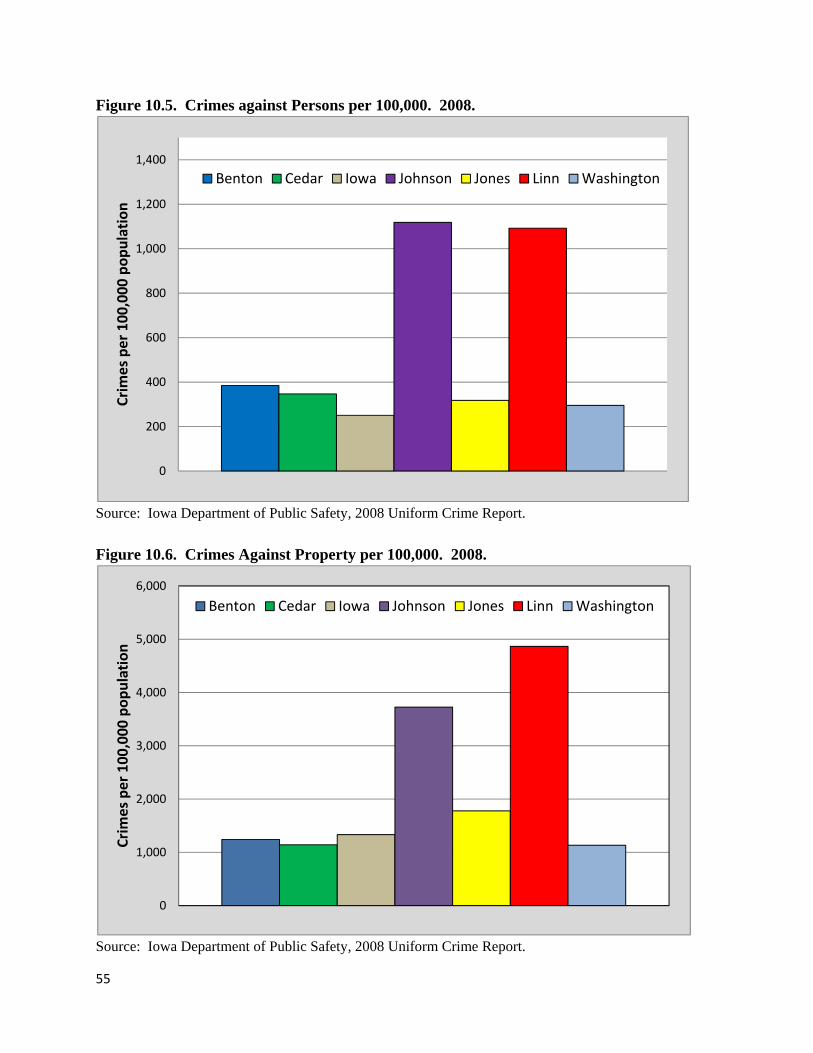
The region was also below the state average in the rate of crimes against persons (assault, murder, etc.), and crimes against property (theft, fraud, etc.), but was above the average in crimes against society (gambling, narcotics, etc.) (tables 10.2, 10.3, 10.4). Certain crimes, such as possession of alcohol under the legal age, are not counted in reports, or Johnson County may have fared worse.
Figure 10.3. Crimes per 100,000 by Victim, 1999 – 2008.
Source: Iowa Department of Public Safety, Uniform Crime Reports, 1999 – 2008.
In 2008 in total crime and in each of the three sub-categories, Linn County had the highest rate, followed by Johnson County, followed at a safe distance by the other five (figures 10.4, 10.5, 10.6, 10.7).
1000
4312
648
1154
4541
610
0
1,000
2,000
3,000
4,000
5,000
6,000
Cri
me
s p
er
10
0,0
00 p
op
ula
tio
n
Against Persons
Region State
Against Property Against Society

53
Table 10.2. Crimes Against Persons per 100,000. 1998 – 2008.
Benton Cedar Iowa Johnson Jones Linn Wash‐ington Region State
1998 131 521 122 1,036 447 856 516 739 1,097
1999 138 311 45 979 461 1,499 0 1,038 1,104
2000 118 288 125 964 493 1,410 0 989 1,124
2001 44 391 153 816 550 1,482 596 1,004 1,123
2002 295 466 197 930 537 1,406 598 1,024 1,157
2003 256 342 208 962 537 1,321 482 980 1,104
2004 286 303 325 941 594 1,302 435 981 1,169
2005 281 333 249 944 569 1,313 430 977 1,184
2006 335 430 223 1,128 514 1,287 279 1,027 1,217
2007 456 118 167 1,207 423 1,266 299 1,037 1,196
2008 384 347 250 1,119 318 1,092 295 939 1,158
Average (1999 ‐ 2008) 259 333 194 999 500 1,338 341 1,000 1,154
Source: Iowa Department of Public Safety, Uniform Crime Reports, 1998 – 2008.
Table 10.3. Crimes Against Property per 100,000. 1998 – 2008.
Benton Cedar Iowa Johnson Jones Linn Wash‐ington Region State
1998 1,555 2,473 580 5,575 1,533 3,403 2,160 3,624 4,637
1999 881 1,842 366 5,071 2,510 6,653 0 4,880 4,439
2000 867 2,096 588 4,731 1,905 5,767 0 4,330 4,577
2001 645 2,219 760 4,231 2,000 6,163 2,242 4,447 4,675
2002 1,319 1,967 865 5,052 2,158 6,257 2,126 4,769 4,976
2003 883 1,369 984 5,069 1,969 5,837 1,489 4,486 4,720
2004 1,122 1,417 1,202 4,421 1,816 5,877 1,463 4,387 4,596
2005 1,007 1,119 1,230 3,912 1,380 5,430 1,160 3,950 4,566
2006 1,202 1,286 1,177 3,960 1,601 5,578 733 4,101 4,691
2007 1,410 427 1,025 4,099 1,519 5,218 1,371 3,992 4,221
2008 1,241 1,141 1,334 3,725 1,779 4,867 1,132 3,782 3,948
Average (1999 ‐ 2008) 1,058 1,488 953 4,427 1,864 5,765 1,172 4,312 4,541
Source: Iowa Department of Public Safety, Uniform Crime Reports, 1998 – 2008.

54
Table 10.4. Crimes Against Society per 100,000. 1998 – 2008.
Benton Cedar Iowa Johnson Jones Linn Wash‐ington Region State
1998 140 305 90 557 54 500 196 395 508
1999 102 377 26 607 113 726 29 548 489
2000 106 543 75 684 73 659 14 543 518
2001 63 462 121 503 89 855 402 595 576
2002 264 553 229 594 158 892 381 663 633
2003 214 527 151 566 435 715 383 579 636
2004 384 514 131 625 368 878 425 683 659
2005 390 333 478 656 265 806 253 648 675
2006 430 371 496 856 403 815 391 735 662
2007 259 263 451 767 316 894 459 733 642
2008 188 240 420 837 386 880 556 754 609
Average (1999 ‐ 2008) 240 418 258 670 261 812 329 648 610
Source: Iowa Department of Public Safety, Uniform Crime Reports, 1998 – 2008.
Figure 10.4. Total crimes per 100,000. 2008.
Source: Iowa Department of Public Safety, 2008 Uniform Crime Report.
0
1,000
2,000
3,000
4,000
5,000
6,000
7,000
8,000
Cri
me
s p
er
10
0,0
00 p
op
ula
tio
n
Benton Cedar Iowa Johnson Jones Linn Washington
55
Figure 10.5. Crimes against Persons per 100,000. 2008.
Source: Iowa Department of Public Safety, 2008 Uniform Crime Report.
Figure 10.6. Crimes Against Property per 100,000. 2008.
Source: Iowa Department of Public Safety, 2008 Uniform Crime Report.
0
200
400
600
800
1,000
1,200
1,400
Cri
me
s p
er
10
0,0
00 p
op
ula
tio
n
Benton Cedar Iowa Johnson Jones Linn Washington
0
1,000
2,000
3,000
4,000
5,000
6,000
Cri
me
s p
er
10
0,0
00 p
op
ula
tio
n
Benton Cedar Iowa Johnson Jones Linn Washington

56
Figure 10.7. Crimes Against Society per 100,000. 2008.
Source: Iowa Department of Public Safety, 2008 Uniform Crime Report.
0
250
500
750
1,000
Cri
me
s p
er
10
0,0
00 p
op
ula
tio
n
Benton Cedar Iowa Johnson Jones Linn Washington

57
11. Scho
Swill take the regio
Figure 1
Source: I
S67,395 (tstatewide
ool Enrollm
chool Distrithe school dn (figure 11
1.1. Grant
Iowa Departm
ince the 96/9table 11.1, 1e enrollment
ment
ct boundariedistricts of th.1).
Wood AEA
ment of Educa
97 school ye1.2). This ist has decline
es do not follhe Grant Wo
A and the Co
ation.
ear, enrollmes not dramatd slightly (fi
low those ofood Area Edu
orridor Stu
ent in the Grtic growth ovfigure 11.2).
f the Countieucation Asso
udy Region.
rant Wood Aver 13 years
es. This secociation to b
AEA has rise, but over th
tion and the be the school
en from 61,5his same peri
next ls of
80 to iod,
58
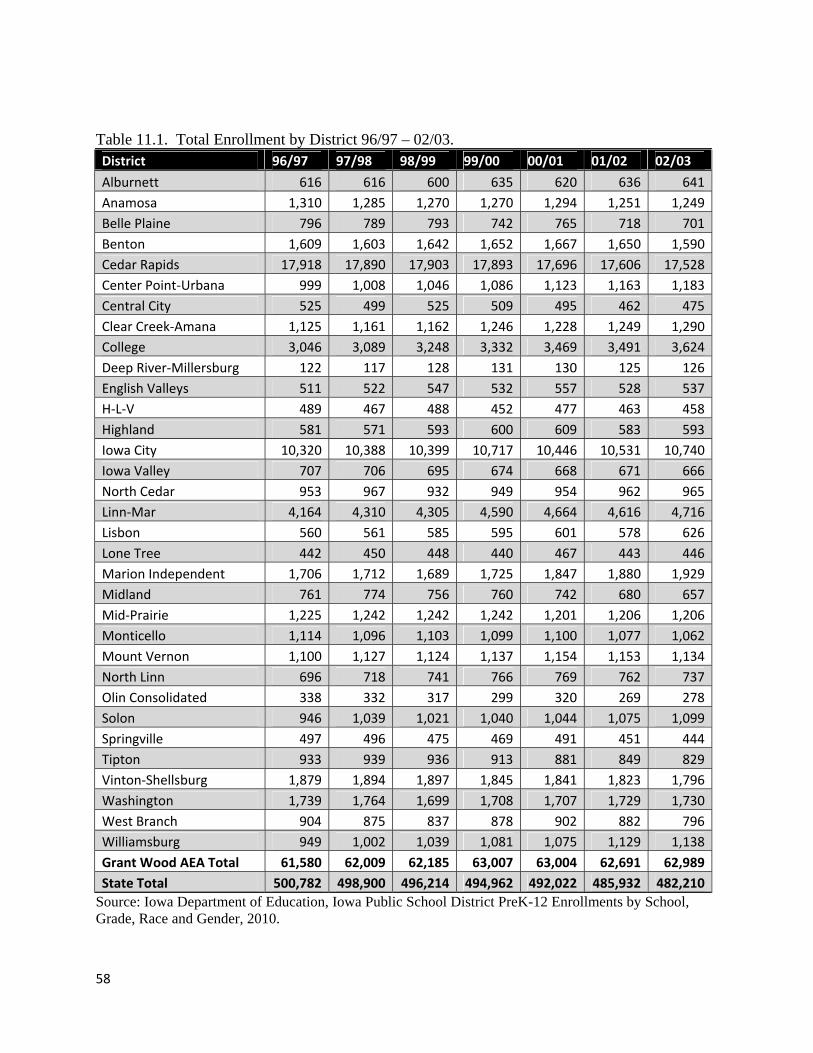
Table 11.1. Total Enrollment by District 96/97 – 02/03. District 96/97 97/98 98/99 99/00 00/01 01/02 02/03
Alburnett 616 616 600 635 620 636 641
Anamosa 1,310 1,285 1,270 1,270 1,294 1,251 1,249
Belle Plaine 796 789 793 742 765 718 701
Benton 1,609 1,603 1,642 1,652 1,667 1,650 1,590
Cedar Rapids 17,918 17,890 17,903 17,893 17,696 17,606 17,528
Center Point‐Urbana 999 1,008 1,046 1,086 1,123 1,163 1,183
Central City 525 499 525 509 495 462 475
Clear Creek‐Amana 1,125 1,161 1,162 1,246 1,228 1,249 1,290
College 3,046 3,089 3,248 3,332 3,469 3,491 3,624
Deep River‐Millersburg 122 117 128 131 130 125 126
English Valleys 511 522 547 532 557 528 537
H‐L‐V 489 467 488 452 477 463 458
Highland 581 571 593 600 609 583 593
Iowa City 10,320 10,388 10,399 10,717 10,446 10,531 10,740
Iowa Valley 707 706 695 674 668 671 666
North Cedar 953 967 932 949 954 962 965
Linn‐Mar 4,164 4,310 4,305 4,590 4,664 4,616 4,716
Lisbon 560 561 585 595 601 578 626
Lone Tree 442 450 448 440 467 443 446
Marion Independent 1,706 1,712 1,689 1,725 1,847 1,880 1,929
Midland 761 774 756 760 742 680 657
Mid‐Prairie 1,225 1,242 1,242 1,242 1,201 1,206 1,206
Monticello 1,114 1,096 1,103 1,099 1,100 1,077 1,062
Mount Vernon 1,100 1,127 1,124 1,137 1,154 1,153 1,134
North Linn 696 718 741 766 769 762 737
Olin Consolidated 338 332 317 299 320 269 278
Solon 946 1,039 1,021 1,040 1,044 1,075 1,099
Springville 497 496 475 469 491 451 444
Tipton 933 939 936 913 881 849 829
Vinton‐Shellsburg 1,879 1,894 1,897 1,845 1,841 1,823 1,796
Washington 1,739 1,764 1,699 1,708 1,707 1,729 1,730
West Branch 904 875 837 878 902 882 796
Williamsburg 949 1,002 1,039 1,081 1,075 1,129 1,138
Grant Wood AEA Total 61,580 62,009 62,185 63,007 63,004 62,691 62,989
State Total 500,782 498,900 496,214 494,962 492,022 485,932 482,210
Source: Iowa Department of Education, Iowa Public School District PreK-12 Enrollments by School, Grade, Race and Gender, 2010.

59
Table 11.2. Total Enrollment by District, 02/03 – 09/10. District 03/04 04/05 05/06 06/07 07/08 08/09 09/10
Alburnett 631 605 608 627 627 629 613
Anamosa 1,268 1,273 1,308 1,330 1,391 1,363 1,385
Belle Plaine 672 658 636 627 612 613 578
Benton 1,561 1,577 1,614 1,588 1,657 1,682 1,728
Cedar Rapids 17,324 17,307 17,234 17,263 16,838 16,875 17,177
Center Point‐Urbana 1,207 1,232 1,269 1,388 1,473 1,548 1,510
Central City 467 459 454 441 480 453 474
Clear Creek‐Amana 1,320 1,361 1,393 1,419 1,438 1,510 1,572
College 3,697 3,857 3,978 4,083 4,199 4,328 4,729
Deep River‐Millersburg 119 99 121 110 85 57 N/A
English Valleys 525 487 512 509 529 508 566
H‐L‐V 442 450 384 409 374 357 358
Highland 603 655 678 696 738 745 772
Iowa City 10,620 10,637 10,822 11,180 11,615 11,449 11,815
Iowa Valley 656 644 632 639 635 641 618
North Cedar 993 936 922 904 935 923 880
Linn‐Mar 4,902 5,079 5,277 5,639 5,894 6,121 6,346
Lisbon 608 603 567 596 607 631 631
Lone Tree 447 457 465 497 504 506 530
Marion Independent 1,959 1,945 2,024 2,041 2,062 2,048 2,072
Midland 601 560 545 532 509 510 456
Mid‐Prairie 1,224 1,223 1,247 1,228 1,305 1,291 1,315
Monticello 1,058 1,055 1,092 1,073 1,095 1,067 1,057
Mount Vernon 1,184 1,190 1,198 1,225 1,275 1,250 1,236
North Linn 749 726 733 736 778 767 757
Olin Consolidated 290 254 243 229 224 209 199
Solon 1,158 1,179 1,218 1,252 1,244 1,270 1,291
Springville 440 448 456 453 434 408 438
Tipton 826 852 875 903 874 888 869
Vinton‐Shellsburg 1,822 1,828 1,799 1,773 1,755 1,680 1,734
Washington 1,721 1,664 1,781 1,726 1,721 1,766 1,734
West Branch 790 768 769 762 763 772 799
Williamsburg 1,151 1,111 1,152 1,159 1,093 1,126 1,156
Grant Wood AEA Total 63,035 63,179 64,006 65,037 65,763 65,991 67,395
State Total 481,226 478,319 483,482 483,122 485,115 487,559 490,417
Source: Iowa Department of Education, Iowa Public School District PreK-12 Enrollments by School, Grade, Race and Gender, 2010.

60
Figure 11.2. Total Enrollment 96/97 – 09/10, State and Grant Wood AEA.
Source: Iowa Department of Education, Iowa Public School District PreK-12 Enrollments by School, Grade, Race and Gender, 2010.
The modest growth of the Grant Wood AEA as a whole masked some dramatic growth and decline in individual districts. The College Community, Linn-Mar, and Center-Point Urbana districts have all grown by more than 50% since 1996 (table 11.3). Midland and Olin Consolidated have contracted by more than 40%, and Deep River Millersburg had gone from 122 students to 57 by 08/09.
0
100,000
200,000
300,000
400,000
500,000
600,000
700,000
800,000
0
10,000
20,000
30,000
40,000
50,000
60,000
70,000
80,000
Tota
l En
rollm
en
t (S
tate
)
Tota
l En
rollm
en
t (G
ran
t W
oo
d)
Grant Wood AEA
State Total

61
Table 11.3. Change in Total Enrollment by District. 96/97 – 09/10.
District Change 1996 ‐ 2010
College 55.25%
Linn‐Mar 52.40%
Center Point‐Urbana 51.15%
Clear Creek‐Amana 39.73%
Solon 36.47%
Highland 32.87%
Williamsburg 21.81%
Marion Independent 21.45%
Lone Tree 19.91%
Iowa City 14.49%
Lisbon 12.68%
Mount Vernon 12.36%
English Valleys 10.76%
North Linn 8.76%
Benton 7.40%
Mid‐Prairie 7.35%
Anamosa 5.73%
Washington ‐0.29%
Alburnett ‐0.49%
Cedar Rapids ‐4.14%
Monticello ‐5.12%
Tipton ‐6.86%
North Cedar ‐7.66%
Vinton‐Shellsburg ‐7.72%
Central City ‐9.71%
West Branch ‐11.62%
Springville ‐11.87%
Iowa Valley ‐12.59%
H‐L‐V ‐26.79%
Belle Plaine ‐27.39%
Midland ‐40.08%
Olin Consolidated ‐41.12%
Deep River‐Millersburg N/A
Grant Wood AEA Total 9.44%
State Total ‐2.07%
Source: Iowa Department of Education, Iowa Public School District PreK-12 Enrollments by School, Grade, Race and Gender, 2010
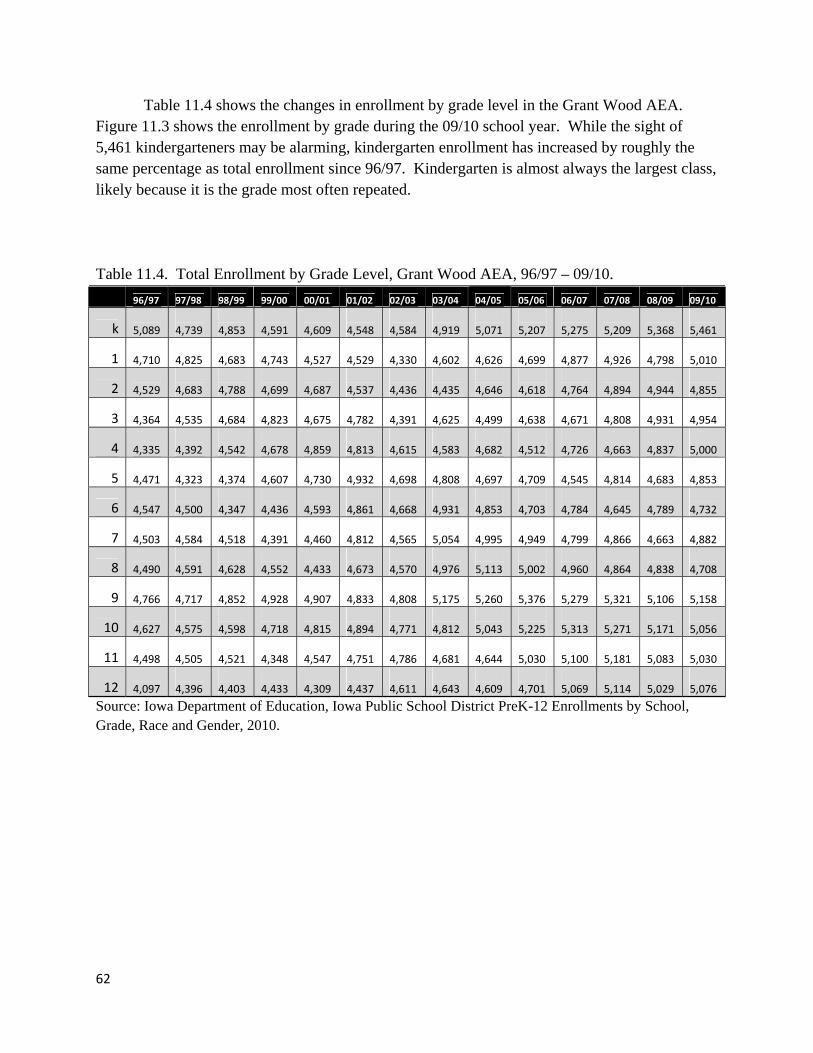
62
Table 11.4 shows the changes in enrollment by grade level in the Grant Wood AEA. Figure 11.3 shows the enrollment by grade during the 09/10 school year. While the sight of 5,461 kindergarteners may be alarming, kindergarten enrollment has increased by roughly the same percentage as total enrollment since 96/97. Kindergarten is almost always the largest class, likely because it is the grade most often repeated. Table 11.4. Total Enrollment by Grade Level, Grant Wood AEA, 96/97 – 09/10.
96/97 97/98 98/99 99/00 00/01 01/02 02/03 03/04 04/05 05/06 06/07 07/08 08/09 09/10
k 5,089
4,739
4,853
4,591
4,609
4,548
4,584
4,919
5,071
5,207
5,275
5,209
5,368
5,461
1 4,710
4,825
4,683
4,743
4,527
4,529
4,330
4,602
4,626
4,699
4,877
4,926
4,798
5,010
2 4,529
4,683
4,788
4,699
4,687
4,537
4,436
4,435
4,646
4,618
4,764
4,894
4,944
4,855
3 4,364
4,535
4,684
4,823
4,675
4,782
4,391
4,625
4,499
4,638
4,671
4,808
4,931
4,954
4 4,335
4,392
4,542
4,678
4,859
4,813
4,615
4,583
4,682
4,512
4,726
4,663
4,837
5,000
5 4,471
4,323
4,374
4,607
4,730
4,932
4,698
4,808
4,697
4,709
4,545
4,814
4,683
4,853
6 4,547
4,500
4,347
4,436
4,593
4,861
4,668
4,931
4,853
4,703
4,784
4,645
4,789
4,732
7 4,503
4,584
4,518
4,391
4,460
4,812
4,565
5,054
4,995
4,949
4,799
4,866
4,663
4,882
8 4,490
4,591
4,628
4,552
4,433
4,673
4,570
4,976
5,113
5,002
4,960
4,864
4,838
4,708
9 4,766
4,717
4,852
4,928
4,907
4,833
4,808
5,175
5,260
5,376
5,279
5,321
5,106
5,158
10 4,627
4,575
4,598
4,718
4,815
4,894
4,771
4,812
5,043
5,225
5,313
5,271
5,171
5,056
11 4,498
4,505
4,521
4,348
4,547
4,751
4,786
4,681
4,644
5,030
5,100
5,181
5,083
5,030
12 4,097
4,396
4,403
4,433
4,309
4,437
4,611
4,643
4,609
4,701
5,069
5,114
5,029
5,076
Source: Iowa Department of Education, Iowa Public School District PreK-12 Enrollments by School, Grade, Race and Gender, 2010.

63
Figure 11
Source: IoGrade, Ra
.
k
1
2
3
4
5
6
7
8
9
10
11
12
Gra
de
1.3. 09/10 E
owa Departmace and Gend
0
Enrollment b
ent of Educater, 2010.
1,000
by Grade, Gr
tion, Iowa Pu
2,000
rant Wood A
blic School D
3,000
Enrollment
AEA.
District PreK-
4,000
-12 Enrollmen
4,8
4
4,8
4,8
4,73
4,
4,70
5,00
nts by School
5,461
5,010
855
4,954
853
853
32
,882
8
5,158
5,056
5,030
5,076
00 6,
l,
,000

64
12. Graduation Rates
The Iowa Department of Education calculates graduation rates by dividing the number of graduating seniors in a school or district by the number of 9th graders four years earlier. When students transfer during their high school careers, they boost the graduation rates of the schools they transfer to, and deflate the rates of the schools they leave. When students take longer than four years to graduate, they will hurt the graduation rate one year, but inflate it in some later year.
For these and other reasons, comparisons from year to year between schools and districts may be misleading. The graduation rates of districts in the Grant Wood AEA, however, were 2.5 to 4.5 percentage points higher than the statewide average for each graduating class between 1998 and 2007 (table 12.1, figure 12.1).
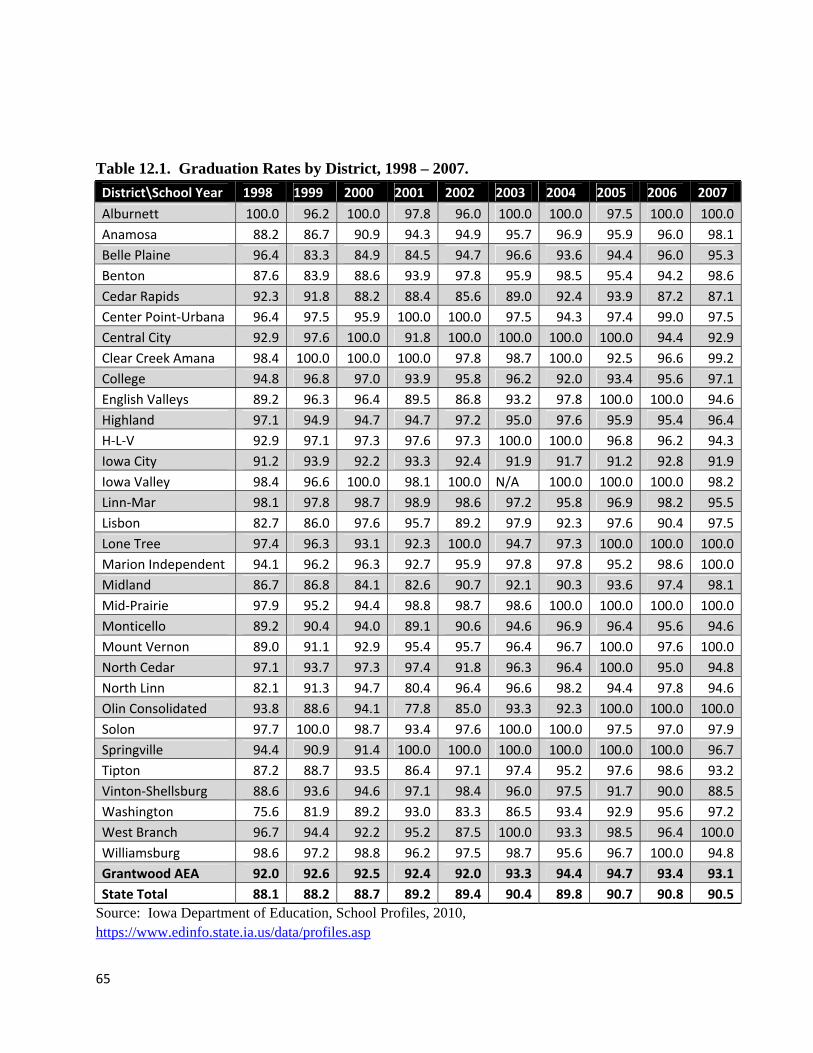
65
Table 12.1. Graduation Rates by District, 1998 – 2007.
District\School Year 1998 1999 2000 2001 2002 2003 2004 2005 2006 2007
Alburnett 100.0 96.2 100.0 97.8 96.0 100.0 100.0 97.5 100.0 100.0
Anamosa 88.2 86.7 90.9 94.3 94.9 95.7 96.9 95.9 96.0 98.1
Belle Plaine 96.4 83.3 84.9 84.5 94.7 96.6 93.6 94.4 96.0 95.3
Benton 87.6 83.9 88.6 93.9 97.8 95.9 98.5 95.4 94.2 98.6
Cedar Rapids 92.3 91.8 88.2 88.4 85.6 89.0 92.4 93.9 87.2 87.1
Center Point‐Urbana 96.4 97.5 95.9 100.0 100.0 97.5 94.3 97.4 99.0 97.5
Central City 92.9 97.6 100.0 91.8 100.0 100.0 100.0 100.0 94.4 92.9
Clear Creek Amana 98.4 100.0 100.0 100.0 97.8 98.7 100.0 92.5 96.6 99.2
College 94.8 96.8 97.0 93.9 95.8 96.2 92.0 93.4 95.6 97.1
English Valleys 89.2 96.3 96.4 89.5 86.8 93.2 97.8 100.0 100.0 94.6
Highland 97.1 94.9 94.7 94.7 97.2 95.0 97.6 95.9 95.4 96.4
H‐L‐V 92.9 97.1 97.3 97.6 97.3 100.0 100.0 96.8 96.2 94.3
Iowa City 91.2 93.9 92.2 93.3 92.4 91.9 91.7 91.2 92.8 91.9
Iowa Valley 98.4 96.6 100.0 98.1 100.0 N/A 100.0 100.0 100.0 98.2
Linn‐Mar 98.1 97.8 98.7 98.9 98.6 97.2 95.8 96.9 98.2 95.5
Lisbon 82.7 86.0 97.6 95.7 89.2 97.9 92.3 97.6 90.4 97.5
Lone Tree 97.4 96.3 93.1 92.3 100.0 94.7 97.3 100.0 100.0 100.0
Marion Independent 94.1 96.2 96.3 92.7 95.9 97.8 97.8 95.2 98.6 100.0
Midland 86.7 86.8 84.1 82.6 90.7 92.1 90.3 93.6 97.4 98.1
Mid‐Prairie 97.9 95.2 94.4 98.8 98.7 98.6 100.0 100.0 100.0 100.0
Monticello 89.2 90.4 94.0 89.1 90.6 94.6 96.9 96.4 95.6 94.6
Mount Vernon 89.0 91.1 92.9 95.4 95.7 96.4 96.7 100.0 97.6 100.0
North Cedar 97.1 93.7 97.3 97.4 91.8 96.3 96.4 100.0 95.0 94.8
North Linn 82.1 91.3 94.7 80.4 96.4 96.6 98.2 94.4 97.8 94.6
Olin Consolidated 93.8 88.6 94.1 77.8 85.0 93.3 92.3 100.0 100.0 100.0
Solon 97.7 100.0 98.7 93.4 97.6 100.0 100.0 97.5 97.0 97.9
Springville 94.4 90.9 91.4 100.0 100.0 100.0 100.0 100.0 100.0 96.7
Tipton 87.2 88.7 93.5 86.4 97.1 97.4 95.2 97.6 98.6 93.2
Vinton‐Shellsburg 88.6 93.6 94.6 97.1 98.4 96.0 97.5 91.7 90.0 88.5
Washington 75.6 81.9 89.2 93.0 83.3 86.5 93.4 92.9 95.6 97.2
West Branch 96.7 94.4 92.2 95.2 87.5 100.0 93.3 98.5 96.4 100.0
Williamsburg 98.6 97.2 98.8 96.2 97.5 98.7 95.6 96.7 100.0 94.8
Grantwood AEA 92.0 92.6 92.5 92.4 92.0 93.3 94.4 94.7 93.4 93.1
State Total 88.1 88.2 88.7 89.2 89.4 90.4 89.8 90.7 90.8 90.5
Source: Iowa Department of Education, School Profiles, 2010, https://www.edinfo.state.ia.us/data/profiles.asp

66
Figure 12.1. Graduation Rates, 1998 – 2007.
Source: Iowa Department of Education, School Profiles, 2010, https://www.edinfo.state.ia.us/data/profiles.asp
The district graduation rates for the class of 2007 show considerable variation with the AEA. Seven districts graduated 100%, and two graduated below 90% (figure 12.2). Figure 12.3 shows the 10 year average graduation rates of each district. There is still considerable variation (89.6% to 99.0%). The Washington, Midland, and Cedar Rapids districts are the only three below 92%, and all are right around the state average. 11 of the AEA’s 33 districts have 10 year graduation rates above 97%.
80%
85%
90%
95%
100%
1998 1999 2000 2001 2002 2003 2004 2005 2006 2007
Gra
du
atio
n R
ate
Grant Wood AEA State Total

67
Figure 1
Source: Ihttps://ww
Cen
Cl
Ma
O
V
2.2. Gradu
Iowa Departmww.edinfo.sta
Alburn
Anamo
Belle Pla
Bent
Cedar Rap
nter Point‐Urba
Central C
ear Creek Ama
Colle
English Vall
Highla
H‐
Iowa C
Iowa Val
Linn‐M
Lisb
Lone T
rion Independe
Midla
Mid‐Pra
Montice
Mount Vern
North Ced
North L
Olin Consolidat
So
Springv
Tipt
Vinton‐Shellsb
Washingt
West Bran
Williamsb
uation Rates
ment of Educaate.ia.us/data/p
80%
nett
osa
ine
ton
pids
ana
City
ana
ege
eys
and
L‐V
City
lley
Mar
bon
ree
ent
and
irie
ello
non
dar
Linn
ted
lon
ville
ton
urg
ton
nch
urg
s, 2006 – 200
ation, School profiles.asp
85%
07 School Y
Profiles, 2010
87.1%
88.5%
90%
Year.
0,
92.9%
91.9%
93.2
%
% 9
9
95.3%
97
%
97.1
94.6%
96.4%
94.3%
9
95.5%
97
9
94.6%
94.8%
94.6%
9
96.7%
2%
97.2
94.8%
95%
100.0%
98.1%
98.6%
.5%
99.2%
1%
98.2%
.5%
100.0%
100.0%
98.1%
100.0%
100.0%
100.0%
7.9%
%
2%
100.0%
100%

68
Figure 1
Source: Ihttps://ww
Cen
Cl
Ma
O
V
2.3. Gradu
Iowa Departmww.edinfo.sta
Alburn
Anamo
Belle Pla
Bent
Cedar Rap
nter Point‐Urba
Central C
ear Creek Ama
Colle
English Vall
Highla
H‐
Iowa C
Iowa Val
Linn‐M
Lisb
Lone T
rion Independe
Midla
Mid‐Pra
Montice
Mount Vern
North Ced
North L
Olin Consolidat
So
Springv
Tipt
Vinton‐Shellsb
Washingt
West Bran
Williamsb
uation Rates
ment of Educaate.ia.us/data/p
80%
nett
osa
ine
ton
pids
ana
City
ana
ege
eys
and
L‐V
City
lley
Mar
bon
ree
ent
and
irie
ello
non
dar
Linn
ted
lon
ville
ton
urg
ton
nch
urg
s, 1998 – 200
ation, School profiles.asp
85%
07, ten-year
Profiles, 2010
89
88.9%
90%
r average.
0,
93
92.0%
93
9.6%
92.3%
92.7%
90.2%
93.1
92.7%
92.5%
93
93
%
% 9
3.8%
.4%
97
97.0
95.3%
94.4%
95.9%
96.9%
97
%
97.1
96.5%
1%
95.5%
96.0%
%
%
9
97.
.5%
3.6%
95.4%
97.
95%
98.7%
7.6%
%
98.3%
%
99.0%
7.6%
1%
98.4%
98.0%
3%
.4%
100%

69
13. Education
By any measure of educational attainment, the corridor ranks above the U.S. and the State of Iowa (Figure 13.1). Table 13.1 shows the percentage of the population 25 and older that has achieved at least a ninth grade education, a high school diploma, and so forth.
The difference between the corridor and the state is greatest in the percentage of residents with at least some college and with at least an Associate’s degree. This is partly a reflection of the presence of Kirkwood and the University of Iowa, but only to the extent that enrollment is of older “non-traditional” students, since this statistic does not include those under 25.
Table 13.1. Educational Attainment, Percentage Achieving Given Level or Higher.
9th Grade
12th grade
Some College
Associates’ Degree
Bachelor's Degree
Higher Degree
Benton 95.0% 87.8% 44.5% 22.9% 13.9% 3.7%
Cedar 95.3% 87.7% 45.8% 24.0% 16.3% 3.6%
Iowa 93.9% 87.0% 44.9% 23.1% 15.8% 4.3%
Johnson 97.2% 93.7% 73.9% 55.0% 47.6% 21.4%
Jones 94.0% 85.3% 43.0% 20.3% 12.7% 3.3%
Linn 97.2% 90.6% 60.2% 36.9% 27.7% 7.2%
Washington 91.0% 82.5% 43.4% 23.9% 16.4% 4.8%
Region 96.3% 90.1% 59.0% 37.3% 28.9% 9.7%
State 94.4% 86.1% 50.0% 28.6% 21.2% 6.5%
U.S. 92.5% 80.4% 51.8% 30.7% 24.4% 8.9% Source: U.S. Census Bureau, 2000 Census.
In each measure, Johnson County has the highest percentage, followed by Linn County (Figure 13.2). Compared to the U.S., Johnson County has about twice the percentage with at least a Bachelor’s Degree and about twice the percentage with an advanced degree.
The remaining 5 counties are near the state and above the national rate for the percent achieving at least a high school diploma. At higher levels, these five counties are below both Iowa and the U.S. Washington County has the lowest percentage of 9 and 12 grade completion, while Jones County is the lowest at higher levels of attainment.

70
Figure 1
Source: U
Figure 1
Source: U
0%
10%
20%
30%
40%
50%
60%
70%
80%
90%
100%
0%
10%
20%
30%
40%
50%
60%
70%
80%
90%
100%
3.1. Educa
U.S. Census B
3.2. Educa
U.S. Census B
9th Grade
9th Grade
tional Attai
Bureau, 2000
tional Attai
Bureau, 2000
12th grade
e 12th grad
inment, Per
Census
inment, Per
Census
e Some Coll
de Some Co
rcentage Ach
rcentage Ach
ege AccociaDegr
Region
ollege AccocDeg
hieving Giv
hieving Giv
ates'ree
BachDe
n Stat
ciates'gree
BacDe
ven Level or
ven Level or
helor'segree
High
te U.S
chelor'segree
High
Be
Ced
Iow
Joh
Jon
Lin
Wa
r Higher.
r Higher.
her Degree
S.
her Degree
nton
dar
wa
hnson
nes
n
ashington

71
All counties in the region have shown improvement since 1990, as have the U.S and State of Iowa (table 13.2). Figures for 1990 and 2000 are sampled data from the U.S. Census. The figures for 2006 – 2008 are three year averages based on the American Community Survey (ACS) sample, which does not cover Benton or Cedar County.
Washington and Iowa counties in particular have become significantly better educated over the past 18 years. Their percentages of High School graduates have both caught up with the state average. While still lagging behind the state, the percentage with Bachelor’s degrees in these counties jumped from around 11% to 19% (table 13.3).
Table 13.2. Percent with at least High School Diploma. 1990 2000 2006‐2008
Benton 78.2% 87.8% N/A
Cedar 79.3% 87.7% N/A
Iowa 76.4% 87.0% 90.7%
Johnson 90.6% 93.7% 95.6%
Jones 78.7% 85.3% 89.5%
Linn 84.9% 90.6% 92.9%
Washington 76.9% 82.5% 88.7%
Region 84.3% 90.1% N/A
State 80.1% 86.1% 89.6%
U.S. 75.2% 80.4% 84.5%
Source: U.S. Census Bureau, 1990 Census, 2000 Census, American Community Survey.

72
Figure 1
Source: U
Wmore cursaw educthe corrid
0%
20%
40%
60%
80%
100%
% w
ith a
t le
ast
HS
Dip
lom
a3.3. Percen
U.S. Census B
Without estimrrent than thecational gaindor remains
%
%
%
%
%
%
nt with at le
Bureau, 1990
mates for Bene 2000 censu
ns well in linsignificantly
ast a High S
Census, 2000
nton and Ceus. Between
ne with the fiy above aver
1990
School Diplo
0 Census, Am
dar Countiesn 1990 and 2ive largest, arage in educa
2000
oma.
merican Comm
s, we cannot2000, howevand there is eation level.
munity Survey
t make regiover, the two severy reason
2006 ‐ 2008
y.
onal estimatesmallest counn to suspect t
8
es nties that

73
Table 13
Benton
Cedar
Iowa
Johnson
Jones
Linn
Washing
Region
State
U.S. Source: U Figure 1
Source: U
0%
10%
20%
30%
40%
50%
60%
% w
ith a
t le
ast
Bac
hlo
r's
3.3. Percent19
n
gton
U.S. Census B
3.4. Percen
U.S. Census B
%
%
%
%
%
%
%
t with at lea90 200
9.6% 1
12.8% 1
11.1% 1
44.0% 4
10.6% 1
21.5% 2
11.7% 1
24.0% 2
16.9% 2
20.3% 2Bureau, 1990
nt with at le
Bureau, 1990
ast Bachelor0 2006
13.9%
16.3%
15.8%
47.6%
12.7%
27.7%
16.4%
28.9%
21.2%
24.4%Census, 2000
ast a Bache
Census, 2000
1990
r’s Degree.‐2008
N/A
N/A
19.1%
51.9%
14.3%
29.0%
18.6%
N/A
24.2%
27.4%0 Census, Am
elor’s Degre
0 Census, Am
2000
merican Comm
ee
merican Comm
munity Survey
munity Survey
2006 ‐ 2008
y.
y.
8
Top Related