


Languages
Pages
Legal

IZA DP No. 3737
Caste Based Discrimination: Evidence and Policy
Zahra Siddique
DI
SC
US
SI
ON
PA
PE
R S
ER
IE
S
Forschungsinstitutzur Zukunft der ArbeitInstitute for the Studyof Labor
September 2008
Caste Based Discrimination:
Evidence and Policy
Zahra Siddique IZA
Discussion Paper No. 3737 September 2008
IZA
P.O. Box 7240 53072 Bonn
Germany
Phone: +49-228-3894-0 Fax: +49-228-3894-180
E-mail: [email protected]
Any opinions expressed here are those of the author(s) and not those of IZA. Research published in this series may include views on policy, but the institute itself takes no institutional policy positions. The Institute for the Study of Labor (IZA) in Bonn is a local and virtual international research center and a place of communication between science, politics and business. IZA is an independent nonprofit organization supported by Deutsche Post World Net. The center is associated with the University of Bonn and offers a stimulating research environment through its international network, workshops and conferences, data service, project support, research visits and doctoral program. IZA engages in (i) original and internationally competitive research in all fields of labor economics, (ii) development of policy concepts, and (iii) dissemination of research results and concepts to the interested public. IZA Discussion Papers often represent preliminary work and are circulated to encourage discussion. Citation of such a paper should account for its provisional character. A revised version may be available directly from the author.
IZA Discussion Paper No. 3737 September 2008
ABSTRACT
Caste Based Discrimination: Evidence and Policy*
Caste-based quotas in hiring have existed in the public sector in India for decades. Recently there has been debate about introducing similar quotas in private sector jobs. This paper uses an audit study to determine the extent of caste-based discrimination in the Indian private sector. On average low-caste applicants need to send 20 percent more resumes than high-caste applicants to get the same callback. Differences in callback which favor high-caste applicants are particularly large when hiring is done by male recruiters or by Hindu recruiters. This finding suggests that the differences in callback between high and low-caste applicants are not entirely due to statistical discrimination. High-caste applicants are also differentially favored by firms with a smaller scale of operations, while low-caste applicants are favored by firms with a larger scale of operations. This finding is consistent with taste-based theories of discrimination and with commitments made by large firms to hire actively from among low-caste groups. JEL Classification: C93, J71, J78, O15 Keywords: field experiments, discrimination, public policy, human resources Corresponding author: Zahra Siddique IZA P.O. Box 7240 53072 Bonn Germany E-mail: [email protected]
* I am grateful to the Centre for the Study of Developing Societies in Delhi for sharing the aggregate National Election Study data. I have benefitted greatly from numerous discussions and comments by Chris Taber at different stages of the project. Thanks to Dan Hamermesh, Chuck Manski, Wallace Mok, Joel Mokyr, Chiaki Moriguchi, Dale Mortensen, Devah Pager, Alex Tetenov, Rakesh Vohra, Sergio Urzua, and Martin Zelder for their comments and suggestions and to Ani Gupta, Siddarth Madhav and Vishy Pingali for their invaluable help in the fieldwork. Financial support from Northwestern’s Graduate Research Grant is gratefully acknowledged. All errors are my own.

The caste system in India has existed for thousands of years and operates by dividing
society into hierarchical groups by birth, with the hierarchy being defined on a purity
scale. The caste functions as a closed group whose members are restricted in their choice
of occupation and degree of social interaction in a manner that is reminiscent of European
Guilds in the Middle Ages.1 These restrictions have led to large socioeconomic differen-
tials between different caste groups. Localized affirmative action policies to improve the
welfare of low-caste individuals were introduced in the 1930s in individual states such as
Tamil Nadu, but nationwide introduction of affirmative action did not occur until after
Indian independence in the 1940s. The Indian government initiated national affirmative
action policies to improve the status and living conditions of low-caste groups (Scheduled
Castes and Scheduled Tribes) by introducing caste-based quotas in political representa-
tion, public sector jobs and education. The quotas were later extended to a larger number
of disadvantaged caste groups (Other Backward Castes). However, despite sixty years
of affirmative action programs in India, the socioeconomic divide between high and low-
caste groups persists. Current debate centers on whether or not to introduce caste-based
quotas in the private sector which would mandate hiring of low-caste employees.2
This paper utilizes an audit study to determine the extent of caste-based discrimi-
nation in the hiring practices of businesses in the Indian private sector. The caste cate-
gorization conventions used by the Indian government for affirmative action and welfare
programs are followed. The categorization scheme (in ascending hierarchical order) is:
the untouchable castes are categorized as Scheduled Castes (SC), backward tribes outside
the caste system as Scheduled Tribes (ST), disadvantaged castes which do not belong to
the untouchable castes as Other Backward Castes (OBC) and the residual category con-
sisting primarily of the high or forward castes as Other Castes. The SC, ST, and OBC
consist of the historically disadvantaged groups while the Other Castes consist of groups
which have historically been and, continue to be, in a strong socioeconomic position.
For instance, the 2004-05 median per capita consumer expenditure bracket (in Rupees),
1Freitas, 2007[15].2See for instance ‘With Reservations’ in the Economist, 10/4/2007, ‘We have a few Reservations’ in
the Economist, 5/27/2006, Vol. 379 Issue 8479, p38-38 as well as ‘Caste and Cash’ in the Economist,4/29/2006, Vol. 379 Issue 8475, p46-46.
1
within urban areas of India, was [580,675] for the SC, [790,930] for the ST, [675,790] for
the OBC and [1100,1380] for the Other category.3
The economic impact of caste has been studied extensively.4 Some studies use micro
level datasets to analyze caste-based discrimination in urban settings of India. A study of
factory workers in Poona (Lambert, 1963[23]) finds evidence of substantial wage discrimi-
nation against workers belonging to backward caste groups. Others use data from cotton
mills in Bombay (Morris, 1965[31]) and for shoemakers in Agra (Lynch, 1965[27]) to find
evidence of discrimination. Banerjee and Knight (1985)[6] use survey data to determine
wage and occupation discrimination for migrant workers in Delhi by using decomposition
techniques. They find wage discrimination to be higher than occupation discrimination
and discrimination in formal sector jobs to be higher than discrimination in informal
sector jobs.
All of these studies collect data in non-experimental settings. Hence the disparities
they report in wages and occupation choice fail to control fully for differences in produc-
tivity and differences in preferences between high and low-caste workers. As a result,
they do not provide a direct test of the hypothesis that discrimination is present. The
resume-based audit study that I carry out uses an experimental design to document the
extent of caste-based discrimination in white collar, private sector jobs in the city of Chen-
nai. Given the design of the study (described in section two), differences in productivity
across high and low-caste workers which are observable to employers but not observable
to the researcher are eliminated, enabling a more direct test of discrimination to be car-
ried out. However differences in productivity across high and low-caste workers which
are unobservable to both the employer and the researcher are not eliminated. Therefore
the disparities in outcomes observed between high and low-caste workers might either be
the result of differences in productivity which are unobservable to both the employer and
the researcher (statistical discrimination), or the result of employer prejudice. Although
3Data from the NSS carried out in 2004-05 (61st Round).4See for instance Akerlof (1976)[2] for a theoretical model of caste-based discrimination, Munshi and
Rozensweig[32] for a study of caste-based networks and the role of these networks in the workplace aswell as Banerjee and Somanathan (2006)[5] and Pande (2003)[34] for a study of the effects of caste-basedquotas in political representation.
2
the study does not provide a direct test of whether discrimination arises as a result of
statistical discrimination or employer prejudice, I will argue that the results suggest that
at least some of the discrimination observed is the result of prejudice against low-caste
applicants.
Job applications were made for entry level white collar jobs which were based in Chen-
nai and advertised on job search web sites between March and December of 2006. Two
resumes were sent for each job vacancy, one being randomly assigned a high-caste sound-
ing name and the other a low-caste sounding name. The resumes depicted applicants of
approximately the same level of productivity. On average, a high-caste applicant had to
send 6.2 resumes to get one callback while a low-caste applicant had to send 7.4 resumes
to get one callback, a difference of approximately 20 percent. The nature of the audit
study also allowed me to look at the variation in callback gaps associated with recruiter
and firm characteristics. The effect of low caste on callback is negative for male recruiters
and for Hindu recruiters, but it is positive for female recruiters and for non-Hindu re-
cruiters. The effect of low caste on callback is negative for firms with a larger scale of
operations (with multiple domestic offices or with foreign offices) but positive for firms
with a smaller scale of operations (without multiple domestic offices or without foreign
offices).
Caste-based affirmative action policy has a long history in India. This paper does
not provide a conclusive argument for or against caste-based affirmative action. It does
provide convincing evidence on whether or not there exists discrimination in the white
collar labor market within India. The existence of large scale discrimination would cer-
tainly strengthen the case for a caste-based affirmative action quota. The study finds
that particular groups of recruiters and firms discriminate significantly against low-caste
workers in comparison to high-caste workers.
The paper is organized as follows: the first section gives information on the city of
Chennai in which the audit study was carried out including the caste affiliation and
employment of the city’s labor force. The second section gives details of the fieldwork.
The third section provides the results from the audit study. The fourth section gives an
3

interpretation of these results and their policy implications. The last section concludes.
I. Background
Chennai is located in the south of India, on the Coromandel Coast of the Bay of Bengal.
With a population in 2001 of 4.3 million5 it is one of the largest metropolitan cities in
India. It is also the capital of the state of Tamil Nadu and has served as an important
administrative and commercial center since the time of the British. According to the
2001 census, Chennai has a literacy rate of 85.3 percent and 1.5 million workers.
A. Caste Composition and Inequality
Hindus formed 85 percent of the urban population of Tamil Nadu in 2004-05.6 Of the
Hindus, 15.3 percent belong to the SC and ST while 76.4 percent belong to the OBC.
This leaves the high-castes in a small minority (at 8.3 percent). These proportions stand
in stark contrast to the overall urban Hindu population of India, of which 20.5 percent
was SC and ST and 36.9 percent OBC in 2004-05. Low-caste groups in Tamil Nadu
do relatively worse than the high-caste groups in terms of per capita consumption. The
median per capita consumer expenditure bracket (in Rupees), within the urban areas of
Tamil Nadu, was [580,675] for the SC, [675,790] for the ST, [790,930] for the OBC and
[1880,2540] for the Other category.
B. Labor Market Statistics by Caste Category
Tamil Nadu is among the most prosperous and urbanized states of the country; it does
better than the Indian average on every labor market measure. Tamil Nadu has a higher
labor force participation rate than the rest of the country. The labor force participation
rate for men in both Tamil Nadu and in India is higher than it is for women. For men,
there is not a large difference in the participation rates across the different caste categories
5Census of India, 2001.6All data in this section is taken from the NSS carried out in 2004-05 (61st Round), unless otherwise
stated.
4
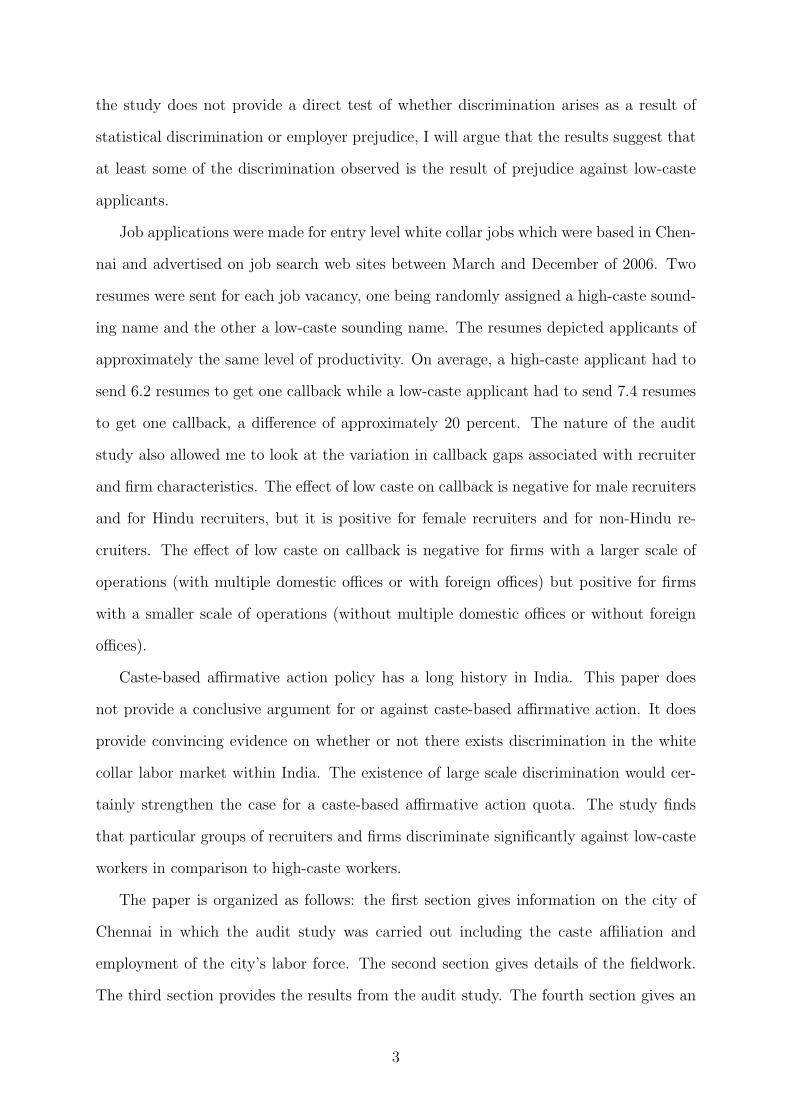
but among women the high caste other category has the lowest participation rates.
Figure 1: Labor Force Participation Rates
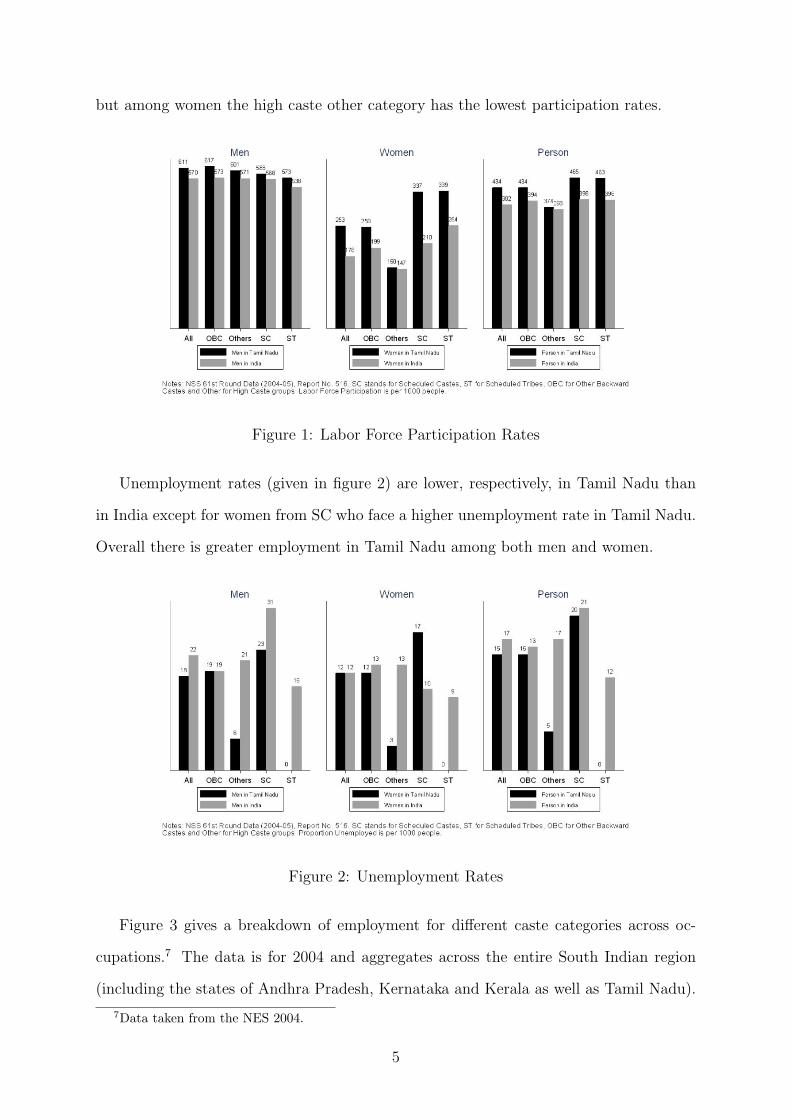
Unemployment rates (given in figure 2) are lower, respectively, in Tamil Nadu than
in India except for women from SC who face a higher unemployment rate in Tamil Nadu.
Overall there is greater employment in Tamil Nadu among both men and women.
Figure 2: Unemployment Rates
Figure 3 gives a breakdown of employment for different caste categories across oc-
cupations.7 The data is for 2004 and aggregates across the entire South Indian region
(including the states of Andhra Pradesh, Kernataka and Kerala as well as Tamil Nadu).
7Data taken from the NES 2004.
5

The figure shows that the low-caste groups (SC, ST, and OBC) slightly dominate the
high-caste groups among service workers and markedly dominate the high-caste groups
among skilled, semi skilled and unskilled workers and those working in agriculture. High-
caste groups slightly dominate the low-caste groups among administrative, managerial,
and clerical workers and markedly dominate the low-caste groups among professionals,
government officials, and businessmen/self-employed. In the occupations which form the
focus of the audit study, the differences between high and low-caste groups are not very
large (service and administrative jobs), therefore it is not a priori obvious if there is
discrimination present in hiring which sets a particular caste group at a disadvantage in
comparison to another for the kind of jobs in my sample.
Figure 3: Employment by Caste across Occupations
C. Employment and Industry
The main industries of Chennai have traditionally been automobile and automobile parts,
but since the late 1990s there has been a high growth in outsourced jobs from the West.
Industries such as software services, hardware manufacturing, customer services and call
centers have become increasingly important over the past decade.
6

A detailed breakdown of employment by industry type for Chennai and all large
cities of India (those with a population greater than a million people) for 2004-05 is
given in figure 4. The figure indicates that workers in Chennai are employed primarily
in manufacturing, trade, transport, and services, which is no different from other large
Indian cities. However relatively more workers are involved in services in Chennai than
in other large cities of India.
Figure 4: Industry in Chennai
Chennai is located in a region in which the lower caste groups outnumber the high-
castes by a large margin. The low-castes, particularly the low-caste women, have been
active participants in the labor market, with labor force participation rates which are
higher than the rest of the country. Currently Chennai has seen a boom in outsourced
jobs from the West; it has become a center of growth for a new kind of job and occupation.
Outsourced jobs in customer service and other white collar professions have provided jobs
to large numbers of workers. Are the new jobs providing an avenue for the lower castes
to improve their lot or not? The next sections describe in detail the audit study, the data
collection, and the results obtained.
7
II. Fieldwork
Evidence of discrimination is generally obtained by using survey data to run regressions
of labor market outcomes on attributes of workers that correlate with productivity; dif-
ferences in the outcomes across different groups is taken as evidence of discrimination.
However survey data does not include all correlates of productivity used by employers to
make hiring and wage decisions. This makes it possible that what is taken as discrimi-
nation is the difference in productivity across different groups which is observable to the
employer but not to the researcher.8 There is also little survey data on hiring decisions
made by employers (as opposed to wage decisions) and measurement of discrimination in
hiring is difficult to carry out. These problems have led researchers to rely on evidence
from either natural experiments9 or from audit studies.
Resume-based audits (known also as correspondence testing) involve sending resumes
of hypothetical workers to employers who have identical productivity but who vary in
the characteristic of interest (ethnicity, race or gender). The earliest resume-based audits
were carried out in the UK by Jowell and Prescott-Clark (1970)[22], McIntosh and Smith
(1974)[28], and Firth (1981, 1982)[11][12]. Riach and Rich (1991, 1995)[36][37] also carry
out a resume-based audit in Victoria, Australia. Recent examples of resume based audits
are Weichselbaumer (2003)[39] and Bertrand and Mullainathan (2004)[8].
The resume-based audit study used to measure caste based discrimination was carried
out over a period of ten months between March 2006 and December 2006 in the city of
Chennai. The sample of firms was those which posted job vacancies online on job web
sites. These job vacancies were all located in Chennai and no firm was audited twice.
Job web sites are a new phenomenon and are used extensively for recruitment into white
collar jobs in India. The largest of such sites have as many as 20,000 recruiters and 9
million resume postings. The majority of jobs posted on the job web sites are in IT
related fields, call centers and customer services, marketing, management, and in human
resources.
8For a review of the literature on race differentials in the US see Altonji and Blank, 1999[3].9Goldin and Rouse, 1996[16].
8

Recruiters post job vacancies on the web site and applicants post resumes. The
recruiters can directly get in touch with applicants who have posted publicly available
resumes. The applicants can also be the ones to contact the recruiter in response to a
particular job vacancy posted by the recruiter. The method used in the study was that
the resume of the applicants were not made publicly available and applicants contacted
the recruiter in response to specific job vacancies. An additional feature introduced by the
main web site that was used in the study (accounting for 70 percent of the observations)
early in the data collection was that individual applicants who belonged to low-caste
groups could declare their caste status. Low-caste applicants in the study had their
status declared as low income OBC.10
Prior to carrying out the study, a list of low and high-caste names was constructed that
would easily convey caste affiliation. The conventions for Indian names vary across the
country. Distinctively high or low-caste Tamil names were used, with high-caste names
having Sanskrit roots and low-caste names having Tamil roots. For instance, names such
as Iyer or Iyengar belong exclusively to the high Brahmin castes. For each of the fictitious
identities, an e-mail address was created that was carefully monitored over the course of
the audit study.
In order to carry out the audit study, a set of fictitious resumes were needed which
were close enough to resumes of actual job seekers so as not to arouse suspicion on
the part of employers. Resumes of actual job seekers from cities other than Chennai
as posted on different job web sites were used. All contact and identity information
about the individual applicants was removed from these resumes. Information from the
different resumes was mixed so as to obtain a set of resumes which depicted applicants
of approximately the same productivity for a particular job category. All resumes for a
particular job category depicted applicants who had obtained the same degree and had
the same set of skills.
10After the audit study was completed the callback gaps were checked for heterogeneity across website used (since an important difference was whether or not low caste status had been declared). It wasfound that there were no differences in the callback gap across the different web sites but that the mainweb site used had higher callback for all applicants than the other web sites, probably due to the higherpopularity of this web site among recruiting firms.
9
Job search web sites were used to identify job vacancies to which the applications
could be sent; a variety of different job search web sites were used for the purpose.
Once a particular employer and job vacancy advertisement were identified, two resumes
corresponding to the specifications of the vacancy were selected. If the vacancy specified
a gender preference (for instance a female for a front office/administration job) then
names of the specified gender only were used. The first resume was equally likely to be
assigned a high-caste name or a low-caste name. Once the name assignment had been
made to the first resume, the second resume was assigned a high-caste name if the first
resume was assigned a low-caste name and a low-caste name if the first resume had been
assigned a high-caste name. This forced half the resumes to be high-caste and half to
be low-caste, with each firm receiving one low-caste resume and one high-caste resume.
When assigning names to the two resumes, the name was also equally likely to be a male
name or a female name (unless the vacancy specified a gender preference). After the
name assignment was made, additional contact information was added to the resumes, a
profile of the applicant created on the job web site and the resumes e-mailed in response
to the job vacancy. The two resumes were e-mailed within a few days of each other.
Callback by employers was measured by monitoring the e-mail addresses of fictitious
applicants as well as by monitoring a number of telephone lines which had been obtained
for the purpose in India. When a call was made to the telephone lines, it was either taken
and the offer of interview rejected or the number and time of the call noted (the telephone
numbers were matched with those given by the employer in the advertisement).
By the nature of its design, a resume-based audit eliminates productivity correlates
that are observable to the employer but which are not observable to the researcher. All
the productivity correlates which are used by the firm in making the callback decision are
contained in the resume which is sent in response to the job vacancy advertisement. This
is an important advantage for using data from an audit study instead of using survey data
to look at differential callback, since I can rule out differences in productivity correlates
observable to the firm but not to me as a cause of the differential callback. However it
is important to note that it is still possible that there are some productivity correlates
10
used by the firm in making the callback decision which are unobservable to both the
firm and to me. For instance if the firm considers a good English accent an important
productivity correlate for customer services jobs and it infers from the high-caste name
that the individual is likely to have a good primary education and a good English accent,
then this is a productivity correlate which the firm uses in making the callback decision
but one which is not directly observable to either the firm or to me.
Another advantage of using the data from the present study is that the caste-specific
names were randomly assigned to the resumes. The same resumes were sometimes asso-
ciated with a high-caste name and at other times with a low-caste name. The random-
ization ensured that the low callback rates observed for low-caste applicants were not
simply due to the low-caste names being associated with low quality resumes but due to
their low-caste. However, since I do not vary the quality of the resumes being sent to the
same firm, the randomization step is not crucial for the interpretation of my results.
III. Results
The audit study was carried out between March, 2006 and December, 2006. A total
of 523 job vacancies in customer services and front office/administration were applied
to, and 1046 resumes were sent (two for each job). Job vacancies were selected from
different online job search web sites and applications were made via e-mail. All jobs
were entry-level jobs and all respondents had an undergraduate degree in the same field
(from colleges which were ranked the same in that field of study) as well as ten to
twelve months of experience. The study did not vary the quality of resumes across the
applicants. This meant that although the two resumes used for a particular job vacancy
were not identical, they were nevertheless perfectly comparable in terms of education,
skills, and experience. Callback was measured via e-mail and through the telephone
numbers provided to recruiters.
The callback rate for high-caste applicants was 16.1 percent while the callback rate for
low-caste applicants was 13.6 percent, with a 20 percent higher chance that a high-caste
11
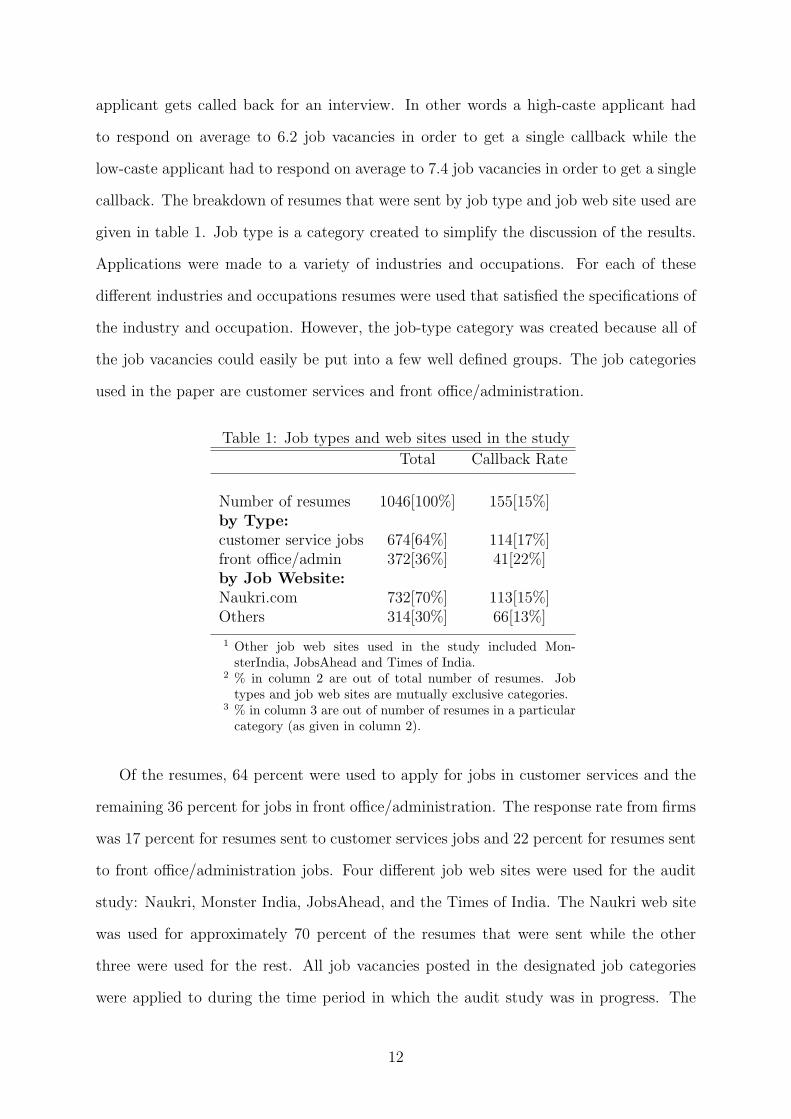
applicant gets called back for an interview. In other words a high-caste applicant had
to respond on average to 6.2 job vacancies in order to get a single callback while the
low-caste applicant had to respond on average to 7.4 job vacancies in order to get a single
callback. The breakdown of resumes that were sent by job type and job web site used are
given in table 1. Job type is a category created to simplify the discussion of the results.
Applications were made to a variety of industries and occupations. For each of these
different industries and occupations resumes were used that satisfied the specifications of
the industry and occupation. However, the job-type category was created because all of
the job vacancies could easily be put into a few well defined groups. The job categories
used in the paper are customer services and front office/administration.
Table 1: Job types and web sites used in the study
Total Callback Rate
Number of resumes 1046[100%] 155[15%]by Type:customer service jobs 674[64%] 114[17%]front office/admin 372[36%] 41[22%]by Job Website:Naukri.com 732[70%] 113[15%]Others 314[30%] 66[13%]
1 Other job web sites used in the study included Mon-sterIndia, JobsAhead and Times of India.
2 % in column 2 are out of total number of resumes. Jobtypes and job web sites are mutually exclusive categories.
3 % in column 3 are out of number of resumes in a particularcategory (as given in column 2).
Of the resumes, 64 percent were used to apply for jobs in customer services and the
remaining 36 percent for jobs in front office/administration. The response rate from firms
was 17 percent for resumes sent to customer services jobs and 22 percent for resumes sent
to front office/administration jobs. Four different job web sites were used for the audit
study: Naukri, Monster India, JobsAhead, and the Times of India. The Naukri web site
was used for approximately 70 percent of the resumes that were sent while the other
three were used for the rest. All job vacancies posted in the designated job categories
were applied to during the time period in which the audit study was in progress. The
12
main constraint in choosing job vacancies was the frequency with which new firms posted
vacancies. Naukri was used more often than any of the others due to the large number of
postings on it by different firms, as it is the most popular job website in India at present.
Not only did it have the highest number of job postings but also the highest response
rates by the firms that were contacted (15 percent instead of the 13 percent response rate
by firms posting vacancies on other websites).
A. Symmetry of Treatment by Job Vacancy
In this section I carry out tests on the null hypothesis of symmetry in treatment by re-
cruiters for high and low caste applicants. Specifically, the tests determine whether the
number of applicant pairs in which the high caste applicant is favored is significantly
different from the number of applicant pairs in which the low caste applicant is favored.
This is a weaker test than a test which tests for zero differences in callback but the advan-
tage of this test is that it allows for the possibility of race neutral chance or randomness
in hiring. Of the 523 job vacancies that were applied to in customer services and front
office/administration, there were 28 applicant pairs for which the low-caste applicant was
called back and the high-caste applicant was not, and 41 applicant pairs for which the
high-caste applicant was called back and the low-caste applicant was not (as given in
table 2). For 43 applicant pairs both the high and low-caste applicants received callback,
while for 411 applicant pairs neither of the applicants received callback. The symmetry
tests which are used in this paper are the likelihood ratio test and the conditional sign
test.11
For the likelihood ratio test the null hypothesis to be tested is that the number of job
vacancies (firms) in which the high-caste applicant is favored is equal to the number of
job vacancies (firms) in which the low-caste applicant is favored. Given that the outcomes
follow a multinomial distribution, the constrained and unconstrained likelihood may be
estimated and the chi square statistic estimated from these. It is then simple to use the
11A detailed discussion of the tests is found in Heckman and Siegelman (1992)[20] and Lehman(1986)[24]. Monte Carlo simulations are given in Appendix 1 to check the size and power of the twotests.
13
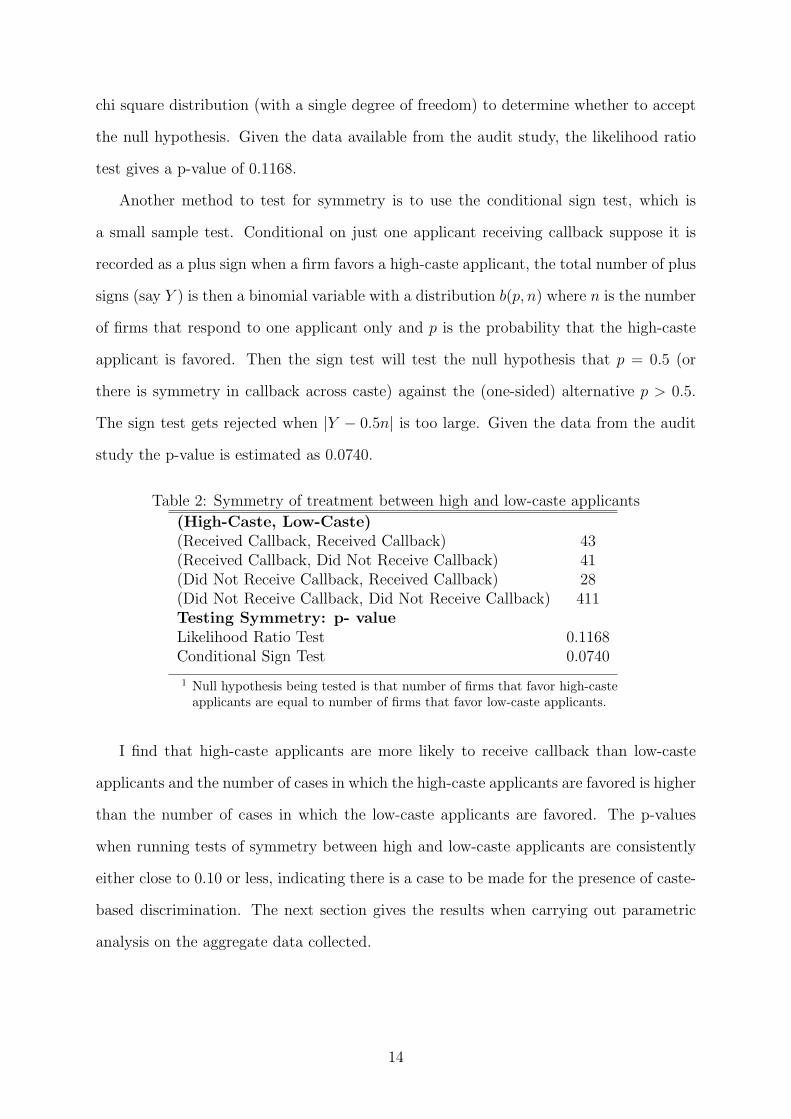
chi square distribution (with a single degree of freedom) to determine whether to accept
the null hypothesis. Given the data available from the audit study, the likelihood ratio
test gives a p-value of 0.1168.
Another method to test for symmetry is to use the conditional sign test, which is
a small sample test. Conditional on just one applicant receiving callback suppose it is
recorded as a plus sign when a firm favors a high-caste applicant, the total number of plus
signs (say Y ) is then a binomial variable with a distribution b(p, n) where n is the number
of firms that respond to one applicant only and p is the probability that the high-caste
applicant is favored. Then the sign test will test the null hypothesis that p = 0.5 (or
there is symmetry in callback across caste) against the (one-sided) alternative p > 0.5.
The sign test gets rejected when |Y − 0.5n| is too large. Given the data from the audit
study the p-value is estimated as 0.0740.
Table 2: Symmetry of treatment between high and low-caste applicants
(High-Caste, Low-Caste)(Received Callback, Received Callback) 43(Received Callback, Did Not Receive Callback) 41(Did Not Receive Callback, Received Callback) 28(Did Not Receive Callback, Did Not Receive Callback) 411Testing Symmetry: p- valueLikelihood Ratio Test 0.1168Conditional Sign Test 0.0740
1 Null hypothesis being tested is that number of firms that favor high-casteapplicants are equal to number of firms that favor low-caste applicants.
I find that high-caste applicants are more likely to receive callback than low-caste
applicants and the number of cases in which the high-caste applicants are favored is higher
than the number of cases in which the low-caste applicants are favored. The p-values
when running tests of symmetry between high and low-caste applicants are consistently
either close to 0.10 or less, indicating there is a case to be made for the presence of caste-
based discrimination. The next section gives the results when carrying out parametric
analysis on the aggregate data collected.
14
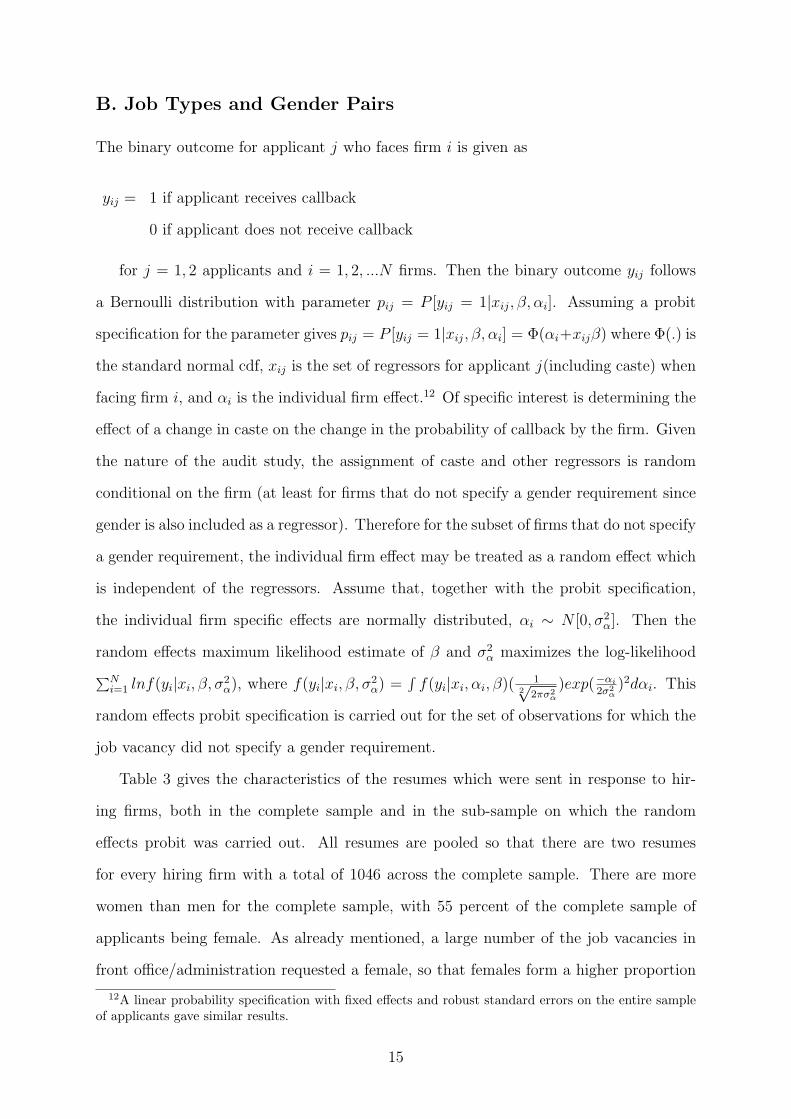
B. Job Types and Gender Pairs
The binary outcome for applicant j who faces firm i is given as
yij = 1 if applicant receives callback
0 if applicant does not receive callback
for j = 1, 2 applicants and i = 1, 2, ...N firms. Then the binary outcome yij follows
a Bernoulli distribution with parameter pij = P [yij = 1|xij, β, αi]. Assuming a probit
specification for the parameter gives pij = P [yij = 1|xij, β, αi] = Φ(αi+xijβ) where Φ(.) is
the standard normal cdf, xij is the set of regressors for applicant j(including caste) when
facing firm i, and αi is the individual firm effect.12 Of specific interest is determining the
effect of a change in caste on the change in the probability of callback by the firm. Given
the nature of the audit study, the assignment of caste and other regressors is random
conditional on the firm (at least for firms that do not specify a gender requirement since
gender is also included as a regressor). Therefore for the subset of firms that do not specify
a gender requirement, the individual firm effect may be treated as a random effect which
is independent of the regressors. Assume that, together with the probit specification,
the individual firm specific effects are normally distributed, αi ∼ N [0, σ2α]. Then the
random effects maximum likelihood estimate of β and σ2α maximizes the log-likelihood∑N
i=1 lnf(yi|xi, β, σ2α), where f(yi|xi, β, σ2
α) =∫
f(yi|xi, αi, β)( 12√
2πσ2α
)exp(−αi
2σ2α)2dαi. This
random effects probit specification is carried out for the set of observations for which the
job vacancy did not specify a gender requirement.
Table 3 gives the characteristics of the resumes which were sent in response to hir-
ing firms, both in the complete sample and in the sub-sample on which the random
effects probit was carried out. All resumes are pooled so that there are two resumes
for every hiring firm with a total of 1046 across the complete sample. There are more
women than men for the complete sample, with 55 percent of the complete sample of
applicants being female. As already mentioned, a large number of the job vacancies in
front office/administration requested a female, so that females form a higher proportion
12A linear probability specification with fixed effects and robust standard errors on the entire sampleof applicants gave similar results.
15
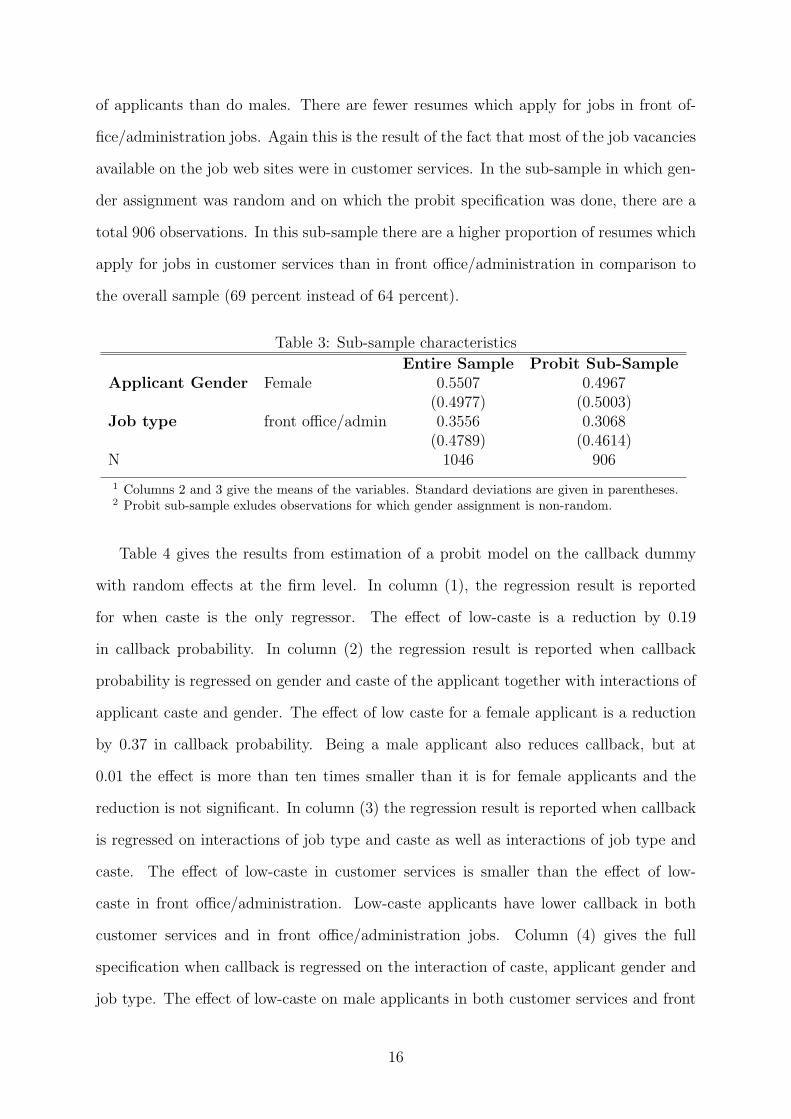
of applicants than do males. There are fewer resumes which apply for jobs in front of-
fice/administration jobs. Again this is the result of the fact that most of the job vacancies
available on the job web sites were in customer services. In the sub-sample in which gen-
der assignment was random and on which the probit specification was done, there are a
total 906 observations. In this sub-sample there are a higher proportion of resumes which
apply for jobs in customer services than in front office/administration in comparison to
the overall sample (69 percent instead of 64 percent).
Table 3: Sub-sample characteristics
Entire Sample Probit Sub-SampleApplicant Gender Female 0.5507 0.4967
(0.4977) (0.5003)Job type front office/admin 0.3556 0.3068
(0.4789) (0.4614)N 1046 906
1 Columns 2 and 3 give the means of the variables. Standard deviations are given in parentheses.2 Probit sub-sample exludes observations for which gender assignment is non-random.
Table 4 gives the results from estimation of a probit model on the callback dummy
with random effects at the firm level. In column (1), the regression result is reported
for when caste is the only regressor. The effect of low-caste is a reduction by 0.19
in callback probability. In column (2) the regression result is reported when callback
probability is regressed on gender and caste of the applicant together with interactions of
applicant caste and gender. The effect of low caste for a female applicant is a reduction
by 0.37 in callback probability. Being a male applicant also reduces callback, but at
0.01 the effect is more than ten times smaller than it is for female applicants and the
reduction is not significant. In column (3) the regression result is reported when callback
is regressed on interactions of job type and caste as well as interactions of job type and
caste. The effect of low-caste in customer services is smaller than the effect of low-
caste in front office/administration. Low-caste applicants have lower callback in both
customer services and in front office/administration jobs. Column (4) gives the full
specification when callback is regressed on the interaction of caste, applicant gender and
job type. The effect of low-caste on male applicants in both customer services and front
16
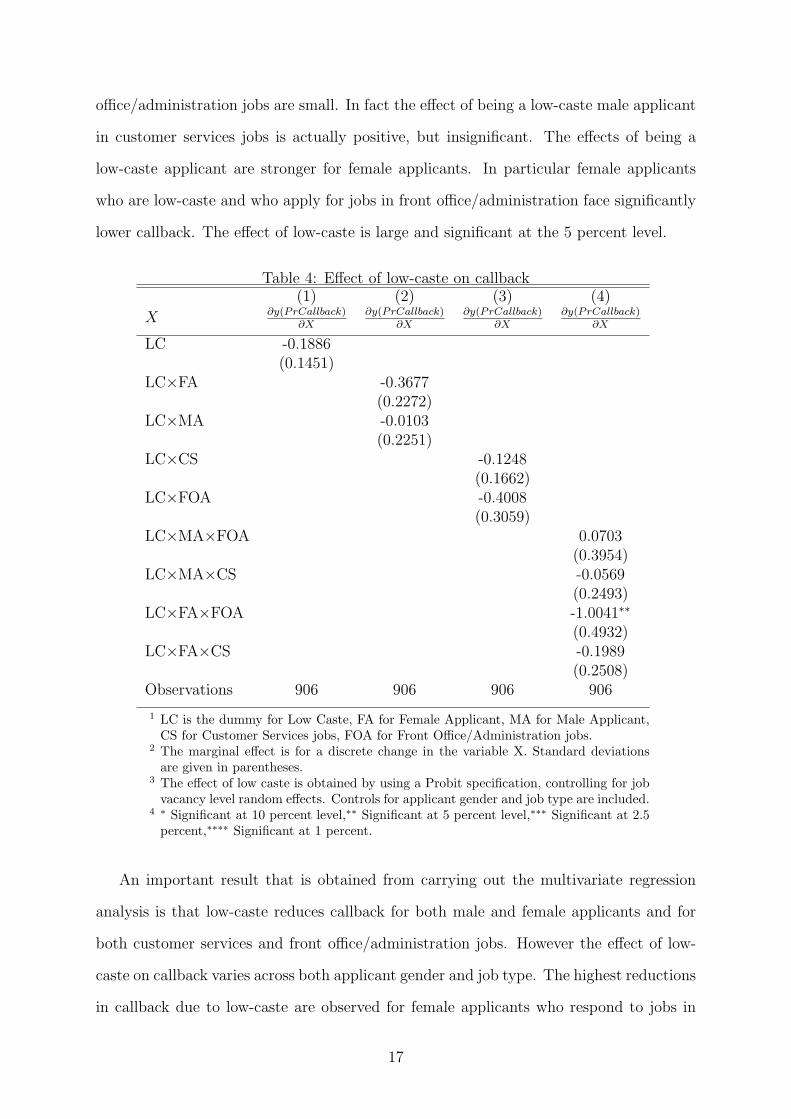
office/administration jobs are small. In fact the effect of being a low-caste male applicant
in customer services jobs is actually positive, but insignificant. The effects of being a
low-caste applicant are stronger for female applicants. In particular female applicants
who are low-caste and who apply for jobs in front office/administration face significantly
lower callback. The effect of low-caste is large and significant at the 5 percent level.
Table 4: Effect of low-caste on callback(1) (2) (3) (4)
X ∂y(PrCallback)∂X
∂y(PrCallback)∂X
∂y(PrCallback)∂X
∂y(PrCallback)∂X
LC -0.1886(0.1451)
LC×FA -0.3677(0.2272)
LC×MA -0.0103(0.2251)
LC×CS -0.1248(0.1662)
LC×FOA -0.4008(0.3059)
LC×MA×FOA 0.0703(0.3954)
LC×MA×CS -0.0569(0.2493)
LC×FA×FOA -1.0041∗∗
(0.4932)LC×FA×CS -0.1989
(0.2508)Observations 906 906 906 906
1 LC is the dummy for Low Caste, FA for Female Applicant, MA for Male Applicant,CS for Customer Services jobs, FOA for Front Office/Administration jobs.
2 The marginal effect is for a discrete change in the variable X. Standard deviationsare given in parentheses.
3 The effect of low caste is obtained by using a Probit specification, controlling for jobvacancy level random effects. Controls for applicant gender and job type are included.
4 ∗ Significant at 10 percent level,∗∗ Significant at 5 percent level,∗∗∗ Significant at 2.5percent,∗∗∗∗ Significant at 1 percent.
An important result that is obtained from carrying out the multivariate regression
analysis is that low-caste reduces callback for both male and female applicants and for
both customer services and front office/administration jobs. However the effect of low-
caste on callback varies across both applicant gender and job type. The highest reductions
in callback due to low-caste are observed for female applicants who respond to jobs in
17
front office/administration. While a very detailed disaggregation is affected by the small
number of observations, it is important to note that there is no job type or gender
disaggregation in which low-caste is associated with higher callback. The next sections
examine the callback gaps between high and low-caste applicants when information on
recruiter and firm characteristics is incorporated in the analysis.
C. Recruiter Characteristics
Each employer advertisement for a job vacancy that was used in the study had the name
of the contact person in the firm. It was possible to find some characteristics of the
recruiter by looking at the list of names that were compiled from these advertisements.
Names were available for 379 recruiters. The callback decision is probably made by these
individuals.
50 percent of the names were definitely male and 41 percent were definitely female.
About 74 percent of the names were typical Hindu names and 16 percent were definitely
not Hindu names (of which 55 percent were typical Christian names and 17 percent
were typical Muslim names). This provides some information regarding the sample of
recruiters who are making the hiring decision and were the subjects of the study.
In table 5 the callback gaps by caste and recruiter name characteristics are given.
There are heterogeneities in the callback gaps across the recruiter characteristics. The
ratio of number of cases in which high-caste applicants are favored to number of cases
in which low-caste applicants are favored is 2.1 for male recruiters and 1.5 for Hindu
recruiters. It is 0.9 for female recruiters and 0.4 for non-Hindu recruiters. Tests of
symmetry (the likelihood ratio and conditional sign tests) are performed on the different
sub-samples with the results given in table 5. Tests of homogeneity (the one-sided Fisher
exact test) across recruiter characteristics are also carried out. The p-value for the test
across recruiter gender is 0.136 and the p-value across recruiter religion is 0.118.
The effect of low-caste on callback across the different recruiter characteristics can
also be obtained. Table 6 gives the characteristics for sub-samples for which recruiter
characteristics are available and for which the probit regressions are carried out.
18

Table 5: Callback Gaps across Applicant Pairs by Recruiter Characteristics
(I) (II) (III) (IV)(0,0) (1,0) (0,1) (1,1) (II)/(III) LR CS
Male Recruiters 149 17 8 17 2.1 0.07∗ 0.05∗∗
Female Recruiters 121 10 11 13 0.9 0.83 0.50Hindu Recruiters 215 25 16 25 1.5 0.16 0.11Non Hindu Recruiters 48 2 5 5 0.4 0.25 0.23(High-Caste, Low-Caste) 295 30 22 32 1.3 0.27 0.17
1 LR is for Likelihood Ratio test, CS for Conditional Sign test.2 (0,0) if neither applicant received callback, (1,0) if high caste applicant received callback, low
caste did not, (0,1) if low caste received callback high caste did not and (1,1) if both receivedcallback.
3 ∗ Significant at 10 percent level,∗∗ Significant at 5 percent level,∗∗∗ Significant at 2.5percent,∗∗∗∗ Significant at 1 percent.
Table 6: Sub-sample with recruiter characteristics
Entire Sample Probit Sub-SampleApplicant GenderFemale 0.5377 0.4836
(0.4990) (0.5002)Job typefront office/admin 0.3774 0.3309
(0.4851) (0.4710)Recruiter Characteristicsmale recruiters 0.5692 0.5636
(0.4956) (0.4964)Hindu recruiters 0.8208 0.8291
(0.3839) (0.3768)N 636 550
1 Columns 2 and 3 give the means of the variables. Standard deviations are given inparentheses.
2 Probit sub-sample exludes observations for which gender assignment is non-random.
Table 7 presents the estimation results from probit regressions with random effects
at the firm level. Dummies for female applicants, job types and recruiter characteristics
are included in the specifications. Again, low-caste reduces callback, as given in column
(1). The effect of low-caste on callback is low, at just 0.08. Column (2) shows the
effects of low-caste on callback separately for male and female recruiters. The effect of
low-caste on callback is negative for male recruiters but positive for female recruiters.
These effects are larger than in column (1), with low-caste reducing callback by 0.34
for male recruiters and increasing callback by 0.22 for female recruiters. Column (3)
lists the effects of low-caste on callback separately for Hindu and non-Hindu recruiters.
19

The effects of low-caste are negative for Hindu recruiters but positive for non-Hindu
recruiters. Again these effects are larger in magnitude than those in column (1). For
Hindu recruiters low-caste reduces callback by 0.21 while for non-Hindu recruiters low-
caste actually increases callback by 0.62. Finally column (3) gives the effects of low-
caste when recruiter gender and recruiter religion are interacted with low-caste. From
this specification the largest effects associated with low-caste are found among Hindu
recruiters who are male. Low-caste reduces callback by as much as 0.51 among this
group of recruiters, and this reduction in callback is statistically significant. For all
other groups of recruiters the effects are positive and the largest in magnitude for female
recruiters who are non-Hindus.
Table 7: Effect of Low-Caste on Callback with Recruiter Characteristics(1) (2) (3) (4)
X ∂y(PrCallback)∂X
∂y(PrCallback)∂X
∂y(PrCallback)∂X
∂y(PrCallback)∂X
LC -0.0819(0.1848)
LC×MR -0.3398(0.2556)
LC×FR 0.2202(0.2754)
LC×HR -0.2061(0.2026)
LC×NHR 0.6181(0.4970)
LC×MR×HR -0.5090∗
(0.2831)LC×MR×NHR 0.5334
(0.6146)LC×FR×HR 0.1336
(0.2942)LC×FR×NHR 0.7290
(0.6658)Observations 550 550 550 550
1 LC is the dummy for Low Caste, MR for Male Recruiter, FR for Female Recruiter,HR for Hindu Recruiter, NHR for non-Hindu Recruiter.
2 The marginal effect is for a discrete change in the variable X. Standard deviations aregiven in parentheses.
3 The effect of low caste is obtained by using a Probit specification, controlling for jobvacancy level random effects. Controls for applicant gender and job type are included.
4 ∗ Significant at 10 percent level,∗∗ Significant at 5 percent level,∗∗∗ Significant at 2.5percent,∗∗∗∗ Significant at 1 percent.
20

The differences in callback gaps across recruiter gender and religion are interesting be-
cause recruiter characteristics are seldom available for analysis in empirical studies. This
may potentially have implications for an interpretation of why discrimination arises in
the first place. Heterogeneity in callback across recruiter characteristics such as recruiter
gender is more consistent with a taste based theory of discrimination rather than an
asymmetric information theory of discrimination. This paper suggests that inclusion of
recruiter characteristics is important to understand fully how discrimination gets played
out in the labor market.
D. Firm Characteristics
To analyze how the callback gaps varied by firm characteristics it was important to obtain
more information on firms that advertised for vacancies on job search web sites. In most
cases the firms that advertised for vacancies also included a web site address in the job
vacancy. Some of the job search web sites also had publicly available information on the
web site addresses of their clients. In short it was possible to find the web sites of most
firms that were present in the sample (around 53 percent of the total). These web sites
had some information that may be used to determine the scale of operations of these
firms. The location information of the branch offices for different firms was a source of
information which was utilized in this regard. Using the web sites, it was found that 30
percent of these firms had offices in foreign locations outside of India and that 44 percent
of the firms had offices in more than one city within India. These measures were used as
firm characteristics to compare the callback gaps across the different firms (serving as a
measure of large and small firms respectively).
Table 8 gives the callback gaps across caste and across firm characteristics. There is
substantial heterogeneity in callback gaps across the different firm characteristics. High-
caste applicants are favored by firms without foreign offices and without multiple domestic
offices in a larger number of cases than are low-caste applicants favored. On the other
hand low-caste applicants are favored by firms with foreign offices and with multiple
domestic offices in a larger number of cases than are high-caste applicants favored.
21

The callback gaps (ratios) vary from 1.8 for firms without multiple domestic offices
to 0.8 for firms with multiple domestic offices and 2.1 for firms without foreign offices
to 0.6 for firms with foreign offices. When data is disaggregated by firm characteristics
the symmetry tests reject the null hypothesis of symmetry for firms without multiple
domestic offices and without foreign offices. These firms significantly favor the high-caste
applicants in more cases than they favor the low-caste applicants. Firms with multiple
domestic offices and foreign offices favor low-caste applicants over high-caste applicants.
Tests of homogeneity of callbacks across firm characteristics (the one-sided Fisher exact
test) give a p-value of 0.057 when the test is carried out for homogeneity in callback across
firms with and without foreign offices. The p-value is 0.154 when the test is carried out
for homogeneity of callback across firms with and without multiple domestic offices.
Table 8: Callback Gaps across Applicant Pairs by Firm Characteristics
(I) (II) (III) (IV)(0,0) (1,0) (0,1) (1,1) (II)/(III) LR CS
Firms with FO 68 4 7 6 0.6 0.36 0.27Firms without FO 145 21 10 19 2.1 0.05∗∗ 0.04∗∗
Firms with MDO 106 5 6 7 0.8 0.76 0.50Firms without MDO 106 20 11 18 1.8 0.10∗ 0.07∗
(High-Caste, Low-Caste) 213 25 17 25 1.5 0.22 0.14
1 FO is for Foreign Offices, MDO is for Multiple Domestic Offices.2 LR is for Likelihood Ratio test, CS for Conditional Sign test.3 (0,0) if neither applicant received callback, (1,0) if high caste applicant received callback, low
caste did not, (0,1) if low caste received callback high caste did not and (1,1) if both receivedcallback.
4 ∗ Significant at 10 percent level,∗∗ Significant at 5 percent level,∗∗∗ Significant at 2.5percent,∗∗∗∗ Significant at 1 percent.
Parametric analysis of the callback dummy is carried out with the introduction of
firm characteristics along the same lines as the previous two sections. Instead of recruiter
characteristics, firm characteristics are added to the set of regressors. The sub-sample for
which firm characteristics are available is of 279 firms and 558 applicants. The sub-sample
in which the gender assignment was non-random (and on which the probit specification
is run) consists of 478 observations.
Table 10 presents the estimation results from running a random effects probit regres-
sion. The regression is run for the sub-sample of applicants who apply to firms for which
22
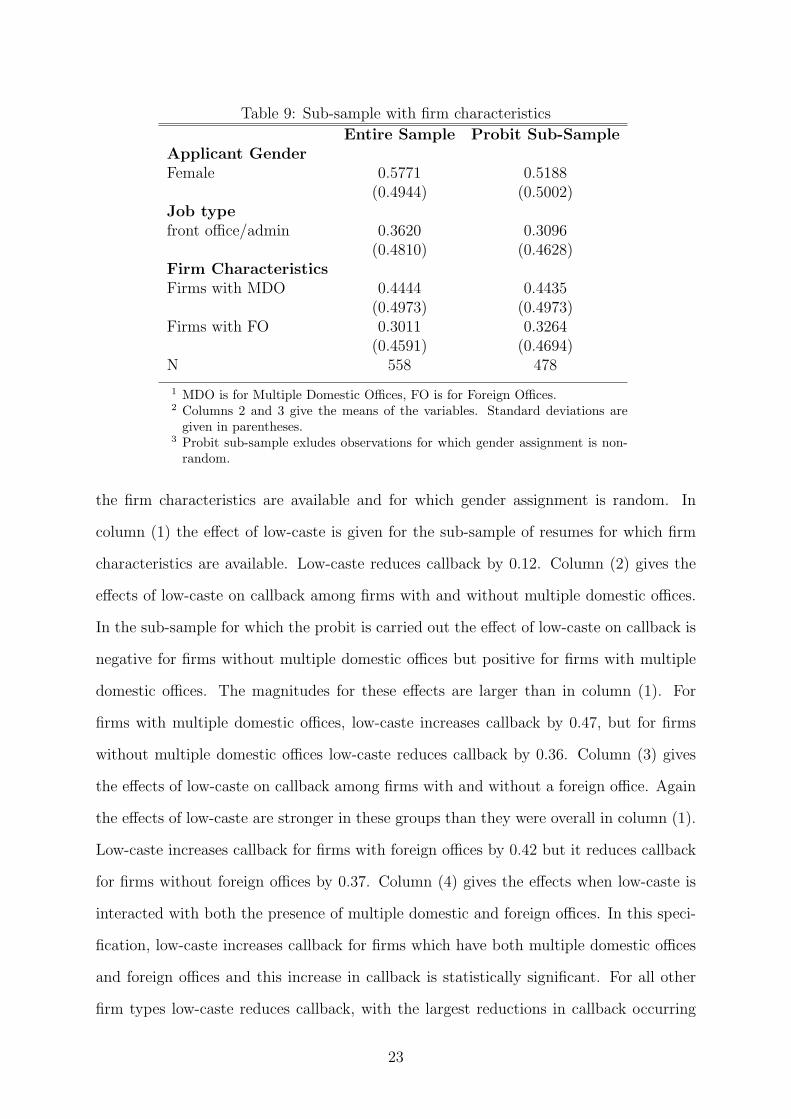
Table 9: Sub-sample with firm characteristics
Entire Sample Probit Sub-SampleApplicant GenderFemale 0.5771 0.5188
(0.4944) (0.5002)Job typefront office/admin 0.3620 0.3096
(0.4810) (0.4628)Firm CharacteristicsFirms with MDO 0.4444 0.4435
(0.4973) (0.4973)Firms with FO 0.3011 0.3264
(0.4591) (0.4694)N 558 478
1 MDO is for Multiple Domestic Offices, FO is for Foreign Offices.2 Columns 2 and 3 give the means of the variables. Standard deviations are
given in parentheses.3 Probit sub-sample exludes observations for which gender assignment is non-
random.
the firm characteristics are available and for which gender assignment is random. In
column (1) the effect of low-caste is given for the sub-sample of resumes for which firm
characteristics are available. Low-caste reduces callback by 0.12. Column (2) gives the
effects of low-caste on callback among firms with and without multiple domestic offices.
In the sub-sample for which the probit is carried out the effect of low-caste on callback is
negative for firms without multiple domestic offices but positive for firms with multiple
domestic offices. The magnitudes for these effects are larger than in column (1). For
firms with multiple domestic offices, low-caste increases callback by 0.47, but for firms
without multiple domestic offices low-caste reduces callback by 0.36. Column (3) gives
the effects of low-caste on callback among firms with and without a foreign office. Again
the effects of low-caste are stronger in these groups than they were overall in column (1).
Low-caste increases callback for firms with foreign offices by 0.42 but it reduces callback
for firms without foreign offices by 0.37. Column (4) gives the effects when low-caste is
interacted with both the presence of multiple domestic and foreign offices. In this speci-
fication, low-caste increases callback for firms which have both multiple domestic offices
and foreign offices and this increase in callback is statistically significant. For all other
firm types low-caste reduces callback, with the largest reductions in callback occurring
23
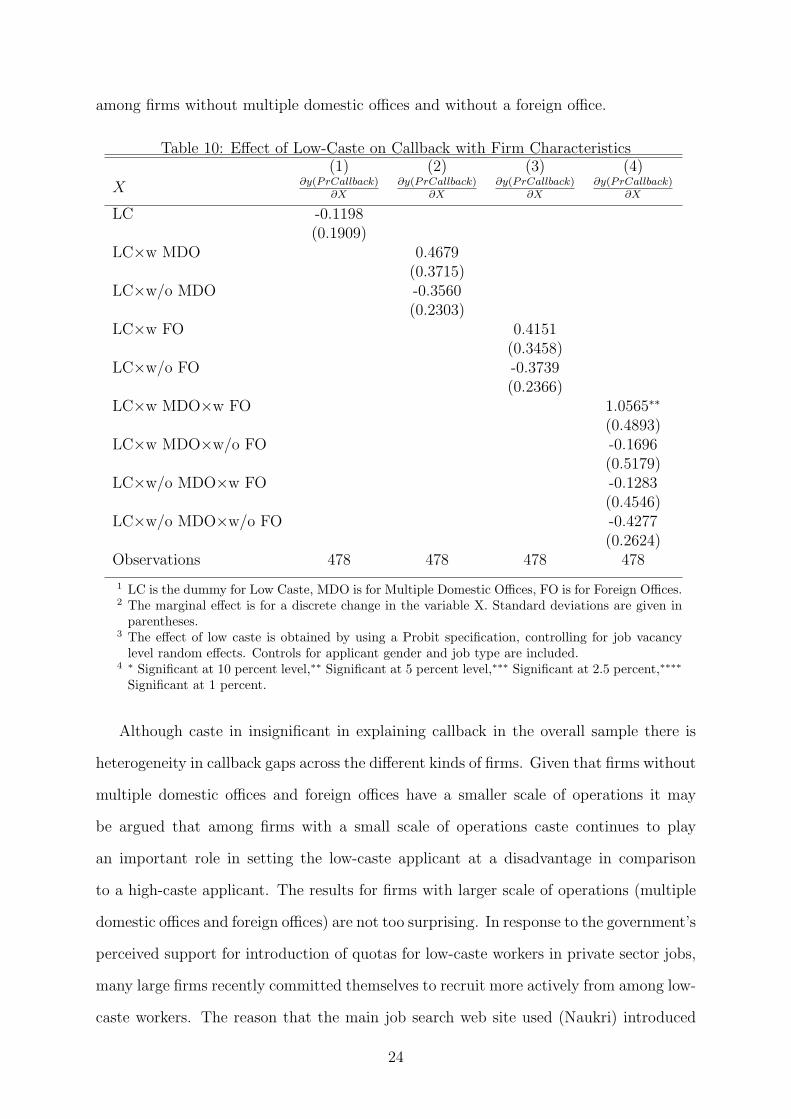
among firms without multiple domestic offices and without a foreign office.
Table 10: Effect of Low-Caste on Callback with Firm Characteristics(1) (2) (3) (4)
X ∂y(PrCallback)∂X
∂y(PrCallback)∂X
∂y(PrCallback)∂X
∂y(PrCallback)∂X
LC -0.1198(0.1909)
LC×w MDO 0.4679(0.3715)
LC×w/o MDO -0.3560(0.2303)
LC×w FO 0.4151(0.3458)
LC×w/o FO -0.3739(0.2366)
LC×w MDO×w FO 1.0565∗∗
(0.4893)LC×w MDO×w/o FO -0.1696
(0.5179)LC×w/o MDO×w FO -0.1283
(0.4546)LC×w/o MDO×w/o FO -0.4277
(0.2624)Observations 478 478 478 478
1 LC is the dummy for Low Caste, MDO is for Multiple Domestic Offices, FO is for Foreign Offices.2 The marginal effect is for a discrete change in the variable X. Standard deviations are given in
parentheses.3 The effect of low caste is obtained by using a Probit specification, controlling for job vacancy
level random effects. Controls for applicant gender and job type are included.4 ∗ Significant at 10 percent level,∗∗ Significant at 5 percent level,∗∗∗ Significant at 2.5 percent,∗∗∗∗
Significant at 1 percent.
Although caste in insignificant in explaining callback in the overall sample there is
heterogeneity in callback gaps across the different kinds of firms. Given that firms without
multiple domestic offices and foreign offices have a smaller scale of operations it may
be argued that among firms with a small scale of operations caste continues to play
an important role in setting the low-caste applicant at a disadvantage in comparison
to a high-caste applicant. The results for firms with larger scale of operations (multiple
domestic offices and foreign offices) are not too surprising. In response to the government’s
perceived support for introduction of quotas for low-caste workers in private sector jobs,
many large firms recently committed themselves to recruit more actively from among low-
caste workers. The reason that the main job search web site used (Naukri) introduced
24

the feature allowing applicants to declare their caste status was precisely because they
expected caste status to be beneficial to applicants given the commitments made. The
results from the study indicate that although low-caste applicants are more actively
sought by firms which have a larger scale of operations this is not the case for firms with
a smaller scale of operations. Low-caste applicants still face a serious disadvantage in
callback when facing these firms. These results also follow naturally from taste-based
theories of discrimination. These theories argue that non-discriminating firms do not
incur the costs associated with hiring less productive workers from preferred groups and
such firms should be making higher profits and growing faster than non-discriminating
firms. For this interpretation, firm size is a consequence of firm practices (discriminate
or not) rather than the other way around. Either or both of these interpretations would
be consistent with the evidence.
E. Average Treatment Effects
An important finding of the paper, that the gap in callback between high and low-caste
applicants is higher in some sub populations than in others, also holds when looking at
the average treatment effect across the population and in the different sub populations.
Let the outcome be the callback probability which takes the value Y (1) among high-caste
applicants and the value Y (0) among low-caste applicants. Then the average treatment
effect is given by ATE = E[Y (1) − Y (0)]. Given the randomization carried out during
the field experiment, the ATE simplifies considerably to ATE = E[Y |High Caste] −
E[Y |Low Caste]. The average treatment effect may be found simply by comparing the
sample averages and a confidence interval constructed around the treatment effects by
using the bootstrap. I use 200 bootstrap replications to find the 90 percent confidence
intervals around the Average Treatment Effects. In addition I also find the 90 percent
confidence intervals around the Average Treatment Effects for specific sub-populations.
These confidence intervals are given in table 11.
The average treatment effect for the entire population is 0.02. This is the expected dif-
ference in callback probability between all applicants being high-caste and all applicants
25
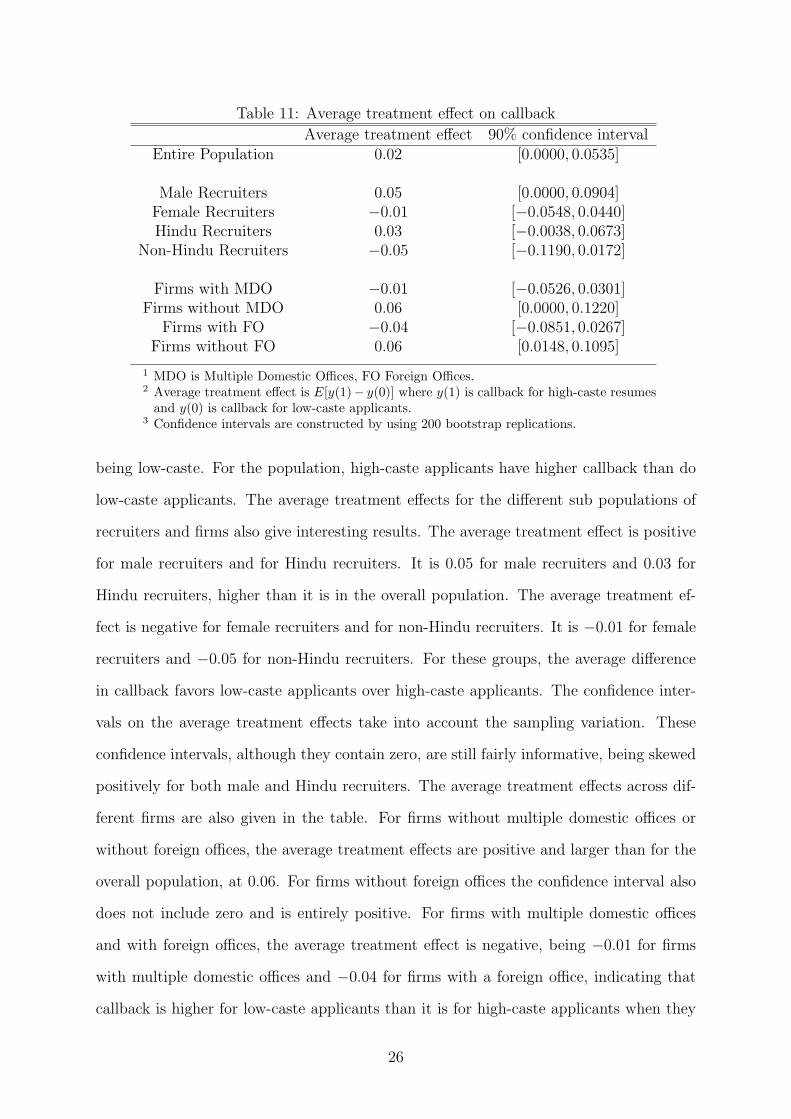
Table 11: Average treatment effect on callback
Average treatment effect 90% confidence intervalEntire Population 0.02 [0.0000, 0.0535]
Male Recruiters 0.05 [0.0000, 0.0904]Female Recruiters −0.01 [−0.0548, 0.0440]Hindu Recruiters 0.03 [−0.0038, 0.0673]
Non-Hindu Recruiters −0.05 [−0.1190, 0.0172]
Firms with MDO −0.01 [−0.0526, 0.0301]Firms without MDO 0.06 [0.0000, 0.1220]
Firms with FO −0.04 [−0.0851, 0.0267]Firms without FO 0.06 [0.0148, 0.1095]
1 MDO is Multiple Domestic Offices, FO Foreign Offices.2 Average treatment effect is E[y(1)− y(0)] where y(1) is callback for high-caste resumes
and y(0) is callback for low-caste applicants.3 Confidence intervals are constructed by using 200 bootstrap replications.
being low-caste. For the population, high-caste applicants have higher callback than do
low-caste applicants. The average treatment effects for the different sub populations of
recruiters and firms also give interesting results. The average treatment effect is positive
for male recruiters and for Hindu recruiters. It is 0.05 for male recruiters and 0.03 for
Hindu recruiters, higher than it is in the overall population. The average treatment ef-
fect is negative for female recruiters and for non-Hindu recruiters. It is −0.01 for female
recruiters and −0.05 for non-Hindu recruiters. For these groups, the average difference
in callback favors low-caste applicants over high-caste applicants. The confidence inter-
vals on the average treatment effects take into account the sampling variation. These
confidence intervals, although they contain zero, are still fairly informative, being skewed
positively for both male and Hindu recruiters. The average treatment effects across dif-
ferent firms are also given in the table. For firms without multiple domestic offices or
without foreign offices, the average treatment effects are positive and larger than for the
overall population, at 0.06. For firms without foreign offices the confidence interval also
does not include zero and is entirely positive. For firms with multiple domestic offices
and with foreign offices, the average treatment effect is negative, being −0.01 for firms
with multiple domestic offices and −0.04 for firms with a foreign office, indicating that
callback is higher for low-caste applicants than it is for high-caste applicants when they
26
are facing these firms.
IV. Discussion
The results from this audit study indicate that there are more firms which favor high-
caste applicants over low-caste applicants rather than the other way around. There
is considerable heterogeneity found in the callback gap by caste when information on
recruiter and firm characteristics is incorporated in the analysis.
A. Taste Based vs. Statistical Discrimination
How does the data collected during the audit study relate to the theoretical literature
on labor market discrimination? The study of discrimination within the labor economics
literature goes back to the early 1960s when Becker[7] first described such discrimination
as a result of prejudice or taste. The employer was modeled as willing to forego some
money income in order to avoid associating with people of a certain race in comparison
to others. Alternatively, employees or consumers might be willing to forego some money
income in order to avoid associating with people of a certain race in comparison to oth-
ers. The resulting disparity in outcomes which results from this prejudice is referred to
as employer, employee, or consumer discrimination. An unattractive feature of the early
taste based model of discrimination as discussed by Becker[7] and others was that it failed
to explain the persistence of discriminating firms in the long run, since such firms should
be making lower profits than would competitive non-discriminating firms. Later models
either introduced search frictions into the taste-based models or modeled discrimination
as an information problem.13 The latter class of models, referred to as models of sta-
tistical discrimination, assumes that firms have incomplete information about the actual
productivity of a worker when the hiring decision is being made so they use either racial
stereotypes14 or signals which might be more informative about some racial groups as
13See Phelps 1972[35] for an early example. In Foster and Vohra 1992[14] group disparities arise as aresult of co-ordination failure.
14Coate and Loury 1993[10] and Moro and Norman 2004[30] which extends the Coate and Loury[10]framework to endogenize the wage rate and carry out general equilibrium analysis.
27

compared to others.15 Groups of prospective workers which have identical productivity
ex-ante may turn out to have different productivity levels ex-post due to the informa-
tion problem and differing incentives for workers in different groups to invest in human
capital. It seems plausible to conclude that both types of discrimination– taste based
and statistical– may be present in the labor market although empirical researchers have
found it difficult to disentangle the two.
All the productivity correlates which are observable and which get used by the firm in
making the callback decision are contained in the resumes which are sent in response to
the job vacancy advertisements. I can therefore rule out as a cause of differential callback
any differences in observable productivity between high and low-caste applicants, since
all the resumes which were used had the same level of observable productivity. How-
ever, it is possible that the hiring firm infers more from the resumes than observable
productivity. Suppose for instance firms associate high-caste names with good primary
education and better English accents for jobs in customer service. In this case the differ-
ential callback could be due to differences in unobservable productivity which I cannot
observe in the study. This is an example of statistical discrimination. In other words,
differential callback observed in the study could arise not just as a result of prejudice of
hiring firms against low-caste applicants, but it may also arise as a result of differences in
unobservable productivity across the different groups of applicants. Therefore the audit
study method is unable to distinguish between taste-based discrimination and statistical
discrimination explicitly. However, the results that are observed from the study in this
paper make it likely that at least some of the callback gap is due to employer prejudice.
One would expect rational and informed recruiters to statistically discriminate against
low-caste applicants if they believed that the expected productivity of low-caste appli-
cants was less than the expected productivity of high-caste applicants. However, the
randomization in the audit study implies that expected productivity should not depend
on the background of the recruiter, thus the callback gap should not vary across recruiter
background. Therefore the variation in callback gap across recruiter background that I
15Aigner and Cain 1977[1], Lundberg and Startz 1983[25] and 1991[26].
28
find has to be coming, at least partly, from prejudice and not differences in expected pro-
ductivity (statistical discrimination). This reasoning assumes that recruiter background
is not related to the type of skills demanded by the job vacancy.16
Suppose X is the set of productivity correlates used by the recruiter in making the
callback decision and that X = {Xo, Xu}. Also assume that Xo are productivity at-
tributes unobservable to both the employer and the researcher and Xu are productivity
attributes which are observable to both the employer and the researcher. Assume further
that X is additively separable in Xo and Xu, then
E[X|Xo,High Caste] = Xo + E[Xu|Xo,High Caste]
and
E[X|Xo,Low Caste] = Xo + E[Xu|Xo,Low Caste]
since observable productivity is constant and known for all applicants by the nature
of the audit study design. Then it is also true that
E[X|Xo,High Caste]− E[X|Xo,Low Caste] =
E[Xu|Xo,High Caste]−E[Xu|Xo,Low Caste]
Assume for simplicity there are two groups of recruiters, R = {m, f}. Given the
presence of statistical discrimination, there is a population expectation of unobservable
productivity and all rational recruiters are aware of this expectation (or at least form
expectations the same way). Then
E[Xu|Xo,High Caste, R = m] = E[Xu|Xo,High Caste, R = f ]
and
16See Anwar and Fang (2004)[4] for development of statistical tests which test for whether troopers ofdifferent races are monolithic in their search behavior and whether they exhibit relative racial prejudice.One problem when testing for statistical discrimination in labor markets instead of mortgage lendingor racial profiling (as in Anwar and Fang (2004)[4]) is that the outcome of interest, actual workerproductivity, is not available. Therefore the tests from Anwar and Fang (2004)[4] cannot be applied inthis context.
29
E[Xu|Xo,Low Caste, R = m] = E[Xu|Xo,Low Caste, R = f ]
Given this assumption,
E[Xu|Xo,High Caste, R = m]− E[Xu|Xo,Low Caste, R = m] =
E[Xu|Xo,High Caste, R = f ]− E[Xu|Xo,Low Caste, R = f ]
or
E[X|Xo,High Caste, R = m]− E[X|Xo,Low Caste, R = m] =
E[X|Xo,High Caste, R = f ]− E[X|Xo,Low Caste, R = f ]
So if there is no prejudice the callback gap should be the same for both groups of
recruiters. This is not the case, implying there is some prejudice present. There are some
important caveats concerning the above argument; it assumes implicitly that recruiter
background is not related to the type of skills required by the job. For instance higher
callback gaps for male recruiters would be observed if male recruiters carry out more
recruiting in jobs for which unobserved components of productivity are more important.
However this is not true for the sample of jobs in my sample. The distribution of recruiter
background among the kinds of jobs is fairly similar: 63 percent of the male recruiters
and 62 percent of the female recruiters in the sample were recruiting for jobs in customer
services. This is in comparison to 64 percent of the job vacancies in customer services for
the entire sample of recruiters in the data set and 63 percent of jobs in customer services
for the sub-sample for which recruiter characteristics were available. As regards recruiter
religion, 63 percent of the Hindu recruiters were recruiting for jobs in customer services
while 61 percent of the non-Hindu recruiters were recruiting for such jobs.
The heterogeneity in the callback gaps across different kinds of firms also follows
naturally from taste-based theories of discrimination, although one cannot rule this out
as being the result of information asymmetries. According to taste-based theories of
discrimination, non-discriminating firms make higher profits than discriminating firms
since they do not incur the costs of hiring high-caste workers of low productivity. Since
they make higher profits they also grow faster than discriminating firms. Therefore
30
non-discriminating firms are larger than discriminating firms as a result of their non-
discriminatory practices.
B. Policy Implications
What are the implications of the present study on policy? The study described in this
paper can help inform somewhat policy analysis regarding affirmative action but it gives
no definitive evidence one way or the other. The question that this paper can help with is
whether large-scale discrimination exists in the private sector, since this would strengthen
the case for the introduction of affirmative action.
The main result of the audit carried out in Chennai was that, in the overall sample
of hiring firms, low-caste applicants had lower callback than did high-caste applicants,
but the differences in callback were not statistically significant. However the magnitude
of the difference in callback for applicants of different castes is non-trivial. If an average
applicant gets one job after interviewing at ten different places, then a high-caste applicant
will need to send her resume to 62 different job vacancies to get a job while a low-caste
applicant will need to send her resume for 74 different job vacancies to get a job. This
assumes that there is no discrimination at the interview stage of the hiring process, an
assumption which need not hold in the real world. It is financially costless for the low-
caste applicant to send an additional ten resumes using the job web site, but there are
costs associated with a longer wait time while new vacancies become available and these
costs are likely to be higher the fewer the alternatives to job web sites in searching for a
white collar job. While carrying out the study, ten months were required to find a little
more than five hundred vacancies in customer service and front office/administration for
entry level positions by distinctive firms. This suggests that to get one callback, the
low-caste applicant has to wait a little more than half a day compared to a high-caste
applicant, if both are applying only for entry level jobs in customer service and never apply
to the same firm twice. When applying for entry level jobs in front office/administration,
the low-caste applicant has to wait for five-and-a-half days more to get one callback
compared to a high-caste applicant, if both never apply to the same firm twice.
31
Another important result from the study was the heterogeneity in the callback gap
across recruiter and firm characteristics. The heterogeneity across recruiter characteristics
indicates the presence of prejudice, and heterogeneity across firm characteristics suggests
that although firms with a larger scale of operations seek out low-caste workers, this is
not the case for firms with a smaller scale of operations. Low-caste applicants still face a
significant disadvantage when applying for jobs at firms with a smaller scale of operations.
The presence of discrimination in hiring would lead low-caste workers to invest less
in their human capital skills than they otherwise would. A caste-based quota in hiring
would lead to a larger number of low-caste workers being hired and reduce the inequality
they face in hiring. This would also improve their incentives to make human capital
investments.17 Given the disparities in human capital between the different caste groups,
a caste-based quota is a relatively costless policy (for the government but not for the
society) which might lead to a more equitable outcome. It might also be justifiable
given that low-caste applicants face some disadvantage in the private sector. However,
at the same time it would be premature to unequivocally support caste-based quotas.
The collection of more and larger of such data sets would be an important prelude to
providing a context for the design of the best policy for the welfare of low-caste workers.
V. Conclusion
The resume-based audit study reveals that low-caste applicants receive lower callback
than high-caste applicants irrespective of job type (customer service or front office/admin)
or gender (female applicant or male applicant). Low-caste reduces callback more for
jobs in front office/administration than it does for jobs in customer services. Low-caste
also reduces callback more for female applicants than for male applicants. The effect
of low-caste for female applicants who applied for jobs in front office/administration is
significantly negative.
17It should be noted that the theoretical literature on discrimination provides us with ambiguousresults on the effects of affirmative action policy. In Coate and Loury (1993)[10] and Moro and Norman(2003)[29] affirmative action may lead to patronizing equilibria in which discriminated groups find iteasier to get jobs in high skill sectors and this leads them to invest less in their human capital ratherthan more.
32
Incorporation of recruiter and firm characteristics into the analysis reveals substantial
heterogeneities in callback gaps across these characteristics. I find that the effect of low-
caste on callback is negative for resumes sent to male recruiters and to Hindu recruiters
but that the effect of low-caste on callback is positive for resumes sent to female recruiters
and to non-Hindu recruiters. The effect of low-caste on callback is negative for resumes
sent to firms that have a smaller scale of operations (absence of multiple domestic offices
or any foreign offices) but the effect of low-caste on callback is positive for resumes sent to
firms that have a larger scale of operations (presence of multiple domestic offices or foreign
offices). The variation of the effect of low-caste on callback across the different recruiter
characteristics indicates that at least some of the discrimination observed in favor of the
high-caste applicants is taste based rather the result of information asymmetries. The
variation of the effect of low-caste on callback across the different firm characteristics is
important since it indicates that low-caste significantly disadvantages the applicant when
applying for jobs with firms who have a smaller scale of operations. This variation is
consistent with taste-based theories of discrimination and also with commitments made
by large firms to recruit more actively from amongst low-caste groups. The heterogeneities
in callback across different groups of recruiters and firms may also be seen by looking
at the average treatment effects across the different sub-populations of recruiters and
firms. The average treatment effects support the earlier analysis carried out by using
multivariate regressions.
Given the results from the audit study, is there a case to be made for the introduction
of caste-based affirmative action quotas in private sector jobs? I find that there is strong
evidence of discrimination among particular groups of recruiters and firms. A caste-based
quota would potentially force all recruiters and firms to hire more low-caste workers.
Therefore the results of this study provide some support for the introduction of hiring
quotas by caste in the private sector. However, more and larger studies need to be carried
out before more definite policy recommendations may be made.
Another important issue concerning the study is that of external validity: how far
can the results of the study be generalized to other labor market settings within India?
33
The study was carried out for white collar jobs in the city of Chennai. It is not clear
whether the patterns observed in Chennai are the same as would be found in other large
urban areas of India. The inter-caste dynamics vary in the different areas of the country,
although it would be fair to generalize the results from Chennai to other large urban
areas in the South of the country (such as, for instance, Bangalore and Hyderabad) in
which most of the new white collar jobs of the country are located. Also, the study was
carried out for entry-level jobs in specific white-collar professions. It is not clear whether
the same patterns would be observed in white-collar jobs that require higher skills (for
instance jobs in IT) or in the blue collar professions. For white-collar jobs that require
higher skills, caste may play an important role. Professional occupations are heavily
dominated by high-caste groups within India. Although the white-collar jobs in this
study requiring greater skills (such as for instance in IT, finance and human resources)
were dropped from the analysis due to high non-response, the few observations which
were obtained indicated even larger gaps in callback in favor of high-caste applicants.
As regards blue collar professions in India, it has been noted in the past that networks
play a very important role in these professions.18 Hiring is done in very different ways
within the blue-collar professions in comparison to the kind of hiring which is the subject
of the audit in this paper. It is possible that low-caste actually provides advantages to
applicants in certain blue collar professions. This would be the case, for instance, if a
particular low-caste group dominates a blue collar profession and has strong networks in
that profession.
The audit study as a tool to measure discrimination has gained more importance
recently. In particular, the use of resume-based audits is now recognized by economists
as an innovative technique to gather clean and reliable evidence of discrimination in
different labor market settings. It has proved to be useful in order to study more carefully
employer’s hiring decisions on which there exists little data. Variations on the resume-
based audit methods may be used to gather information on how employers make hiring
decisions when faced with applicants who vary across different dimensions. In the present
18Munshi and Rozensweig[32].
34

context of caste-based discrimination, it gives us important insights on actual decision
making of employers when they face high and low caste applicants.
References
[1] Aigner, Dennis J. and Glenn G. Cain. 1977. ‘Statistical Theories of Discrimination
in Labor Markets.’ Industrial and Labor Relations Review, 30: 175-187.
[2] Akerlof, George. 1976. ‘The Economics of Caste and the Rat Race and Other Woeful
Tales.’Quarterly Journal of Economics, 90: 599-617.
[3] Altonji, Joseph G. and Rebecca Blank. 1999. ‘Race and Gender in the Labor Market.’
in: O. Ashenfelter and D. Card eds. Handbook of Labor Economics, Vol 3, Elsevier
Science B.V.
[4] Anwar, Shamena and Hanming Fang. 2004. ‘An Alternative Test of Racial Profiling
in Motor Vehicle Searches: Theory and Evidence.’ American Economic Review, 96
(1): 127-151.
[5] Banarjee, A. and R. Somanathan. 2006. ‘The Political Economy of Public Goods:
Some Evidence from India.’ Working Paper.
[6] Banerjee, B. and J. B. Knight. 1985. ‘Caste in Indian urban labor market.’ Journal
of Development Economics, 17: 277-307
[7] Becker, Gary S. 1961. The Economics of Discrimination. Chicago, IL: The University
of Chicago Press, 1961.
[8] Bertrand, Marrianne and Sendhil Mullainathan. 2004. ‘Are Emily and Greg more
employable than Lakisha and Jamal? A Field Experiment on Labor Market Dis-
crimination.’
[9] Cain, Glen G. 1986. ‘The Economic Analysis of Labor Market Discrimination,’ in:
O. Ashenfelter and R. Layard eds. Handbook of Labor Economics, Vol 1 (North
Holland, Amsterdam) pp 693-785.
35
[10] Coate, Stephen and Glenn Loury. 1993. ‘Will Affirmative Action Policies eliminate
negative Stereotypes?’ American Economic Review, 83 (5): 1220-1240.
[11] Firth, M. 1981. ‘Racial Discrimination in the British Labor Market.’ Industrial and
Labor Relations Review, 34 (2): 265-272.
[12] Firth, M. 1982. ‘Sex Discrimination in Job Opportunities for Women.’ Sex Roles
8(8): 891-901.
[13] Fix, Michael and Raymond J. Struyck, eds. 1992. Clear and Convincing Evidence:
Measurement of Discrimination in America. Lanham, MD: Urban Institute Press.
[14] Foster, V. and R. Vohra. 1992. ‘An Economic Argument for Affirmative Action.’
Rationality and Society 4(2): 176-188.
[15] Freitas, Kripa. 2007. ‘The Indian Caste System as a Means of Contract Enforcement.’
Working Paper, Northwestern University.
[16] Goldin, Claudia and Cecilia Rouse. 2000. ‘Orchestrating Impartiality: the impact
of Blind Auditions on Female Musicians.’ The American Economic Review, 90(4):
715-741.
[17] Government of India, National Sample Survey Organization. ‘Employment and Un-
employment Situation among Social Groups in India, 2004-05’ Report No. 516.
[18] Government of India, National Sample Survey Organization. ‘Employment and Un-
employment Situation in Cities and Towns in India, 2004-05’ Report No. 520.
[19] Heckman, James J. 1998. ‘Detecting Discrimination.’ The Journal of Economic Per-
spectives 12(2): 101-116.
[20] Heckman, James J. and Seigelman, Peter. 1992. ‘The Urban Institute Audit Studies:
Their Methods and Findings.’ in Micheal Fix and Raymond J. Struyk, eds. Clear
and Convincing Evidence: Measurement of Discrimination in America. Lanham,
MD: Urban Institute Press.
36
[21] Hu, Luojia and Christopher Taber. 2007. ‘Displacement, Asymmetric Information
and Heterogenous Human Capital.’ Working Paper, Northwestern Unievrsity.
[22] Jowell, R. and P. Prescott-Clark. 1970. ‘Racial Discrimination and White Collar
Workers in Britain.’ Race 11: 397-417.
[23] Lambert, Richard D. 1963. Workers, Factories and Social Change in India. Princeton,
NJ: Princeton University Press.
[24] Lehman, E.L. 1986. Testing Statistical Hypotheses. New York, NY: Wiley.
[25] Lundberg, Shelley J. and Richard Startz. 1983. ‘Private Discrimination and Social
Intervention in Competitive Labor Markets.’ American Economic Review 73: 340-
347.
[26] Lundberg, Shelley J. and Richard Startz. 1991. ‘The Enforcement of Equal Oppor-
tunity Laws under Imperfect Enforcement: Affirmative Action and Alternatives.’
Quarterly Journal of Economics 106(1): 309-326.
[27] Lynch, Owen M. 1969. The politics of untouchability. social mobility and social
change in a city of India. New York, NY: Columbia University Press.
[28] McIntosh, N. and D. Smith. 1974. The Extent of Racial Discrimination’ Political and
Economic Planning Broadsheet, No.547 (London: Political and Economic Planning).
[29] Moro, Andrea and Peter Norman. 2003. ‘Affirmative Action in a Competitive Econ-
omy.’ Journal of Public Economics, 87:3-4: 567-594.
[30] Moro, Andrea and Peter Norman. 2004. ‘A General Equilibrium Model of Statistical
Discrimination’ Journal of Economic Theory, 114(1): 1-30.
[31] Morris, David. 1965. The emergence of an industrial labor force in India. A study
of the Bombay Cotton mills, 1854-1947. Berkeley/Los Angeles, CA: University of
California Press.
37
[32] Munshi, Kaivan and Mark Rozensweig ‘Traditional Institutions meet the Modern
World: Caste, Gender and Schooling Choice in a Globalizing Economy.’ American
Economic Review, 96(4): 1225-1252.
[33] Neumark, David. 1996. ‘Sex Discrimination in Restaurant Hiring: An Audit Study’
Quarterly Journal of Economics, 111(3): 915-942.
[34] Pande, Rohini. 2003. ‘Can Mandated Political Representation increase Policy In-
fluence for Disadvantaged Minorities? Theory and Evidence from India.’ BREAD
Working Paper No. 024.
[35] Phelps, E. 1972. ‘The Economic Theory of Racism and Sexism.’ American Economic
Review, 62: 659-661.
[36] Riach, P.A. and Rich, J. 1991. ‘Testing for Racial Discrimination in the Labor Mar-
ket.’ Cambridge Journal of Economics, 15: 239-259.
[37] Riach, P.A. and Rich, J. 1995. ‘An Investigation of Gender Discrimination in Labor
Hiring.’ Eastern Economic Journal, 21(3): 343-356.
[38] Somanathan, Rohini. 2006. ‘The Assumptions and the Arithmetic of Caste-Based
Reservations.’ Economic and Political Weekly, 2436-2438.
[39] Weichselbaumer, Doris. 2003. ‘Sexual Orientation Discrimination in Hiring.’ Labor
Economics, 10: 629-642.
38
Appendix 1: Symmetry Tests
In order to test symmetry between high and low-caste applicants two different tests were
used. These were the likelihood ratio test and the conditional sign test. The likelihood
ratio test uses the chi square statistic to test the null hypothesis of symmetry between
high and low-caste applicants. The null hypothesis being tested is that the probability
that a high-caste applicant is called back and a low-caste applicant is not is the same as
the probability that a low-caste applicant is called back and a high-caste applicant is not.
The alternative to the likelihood ratio test is the conditional sign test, which is an exact
test more suited to small samples. The test conditions on the event that just one of the
two applicants gets called back. In order to test the performance of the two symmetry
tests, a Monte Carlo exercise is undertaken in this appendix to check the size and power
of the two tests. The results of the exercise are given in the following paragraphs and
figures. It was found that the two tests give fairly similar results in samples the same
size as the one used in the paper.
In the first set of simulations the data-generation process is multinomial with the
probability of the different events being the following: Probability (high-caste Callback,
low-caste Callback)= f(x, y) = (0, 0) = 0.79, f(x, y) = (0, 1) = 0.07, f(x, y) = (1, 0) =
0.07, f(x, y) = (1, 1) = 0.07. The sample size is 523 and the sign test statistic and likeli-
hood ratio statistics estimated from 10,000 simulations. The results from the simulations
are given in the Figure below.
In the second set of simulations the data generation process is again multinomial but
with the probability of the different events being the following: Probability (high-caste
Callback, low-caste Callback) = f(x, y) = (0, 0) = 0.75, f(x, y) = (0, 1) = 0.05, f(x, y) =
(1, 0) = 0.10, f(x, y) = (1, 1) = 0.10. The sample size is 523 and the sign test statistic
and likelihood ratio statistics estimated from 10,000 simulations. The results from the
simulations are given in the Figure below.
39

Figure 5: Monte Carlo Simulation, f(0, 1) = f(1, 0) = 0.07
Figure 6: Monte Carlo Simulation f(0, 1) = 0.05, f(1, 0) = 0.10
40
Appendix 2: Fisher Exact Test
To test whether differences in callback gaps between high and low-caste workers are
significantly different across job types and gender pairs or across recruiters and firms,
Fisher’s Exact test is performed on the data. In general the test is used to determine the
significance of the association between two categorical variables. With large samples a
chi-square test can be performed to determine this significance level but for small sample
sizes (as the ones in this paper) the Fisher test is used since the chi-square approximation
is inappropriate.
Suppose the two variables are X and Y , with X taking on m different values and Y
taking on n different values. Let αij be the number of observations in which m = i and
n = j in an m× n matrix. Let the row and column sums be Ri and Cj and let N be the
total sum of the matrix. Then the conditional probability of getting the actual matrix
given Ri,∀i and Cj,∀j is given by
Conditional Probability = (R1!R2!...Rm!)(C1!C2!...Cn!)
N !∑
i,jαij !
which is a multivariate version of the hypergeometric distribution. In order to ob-
tain the p-value from the Fisher test all possible matrices consistent with the row and
column totals are constructed and their conditional probabilities estimated. Conditional
probabilities of all matrices which exhibit equal or greater independence than the original
matrix are then added together to get the p-value. Independence may be measured using
either the Pearson chi-square or differences in proportions. In the paper the p-values ob-
tained considered matrices as exhibiting equal or greater independence if the conditional
probability of obtaining them was less than or equal to the conditional probability of
getting the actual matrix.
41
Appendix 3: Secondary Data Sources
There are a number of secondary data sources used in the paper which outline the status
of low-caste applicants vis a vis high-caste applicants as well as firm level activity in the
region of Chennai. This appendix gives a brief background on these data sources, the
methods used in their collection, the actual data contained in these data sets and their
uses. In the absence of Census level data on Caste19 these data sets are an important
source of information regarding the status of the different caste groups in the country.
National Sample Survey
The National Sample Survey (NSS) is a nation wide, quinquennial survey on employment
and unemployment conducted by the National Sample Survey Organization (NSSO) of
the Ministry of Statistics and Program Implementation of the Government of India. The
data used in the paper is taken from publicly available reports20 using the most recent
and seventh survey. This is the 61st round of the National Sample Survey conducted
between July 2004 and June 2005.
The first quinquennial survey on employment and unemployment was carried out by
the NSSO between September 1972 and October 1973 (the 27th round). Since then six
more such surveys have been undertaken by the NSSO. The 61st round survey covers
the whole of Indian Union except Leh and Kargil districts of Jammu and Kashmir, the
interior villages in Nagaland and inaccessible villages in Andaman and Nicobar islands.
The entire survey period of twelve months was divided into four sub-rounds of three
months each with an equal number of sample villages/blocks allotted in each of the four
sub-rounds. The survey was conducted in the form of face to face interviews and the
sample chosen by stratified multistage sampling.
In the multistage sampling, the first stage units were the census villages for the rural
areas and the NSSO urban frame blocks for urban areas. The final stage units were
households for both urban and rural areas. Hamlet groups/sub-blocks formed the inter-
19Since 1941 the collection of individual data on caste was discontinued in the Census (except foraffiliation with the SC and ST categories).
20The reports are available online at
42
mediate stage whenever these were found in the sampled first stage units. Of a total of
12,788 first stage units selected (8128 villages and 4660 urban blocks) 12,601 first stage
units ended up being included in the survey. The final sample included 7,999 villages and
4,602 urban blocks covering 124,680 households and enumerating 602,833 individuals.
The survey includes detailed information on employment and caste category which, in
the publicly available aggregate form, provides a rich source of descriptive data.
National Election Study
The National Election Study (NES), 2004 is a post election survey in India conducted
by the Center for Studies in Developing Economies (CSDS). The study is comparable
to the National Election Studies conducted in the US and Britain. The single wave of
the post poll survey of 2004 was carried out in all twenty eight states of the Indian
Union as well as the three Union territories. The main objective of the survey was to
determine the behavior and opinions of Indian voters and to explain electoral outcomes.
The background information collected by the survey included self-reported data on caste
category and jati which has been used in the paper to examine the breakdown by caste
group for different occupations (see Figure 8).
The first such surveys were conducted by the CSDS during the 1970s. No survey
was then conducted till the mid 1990s. In 1996 three waves of surveys (pre election, mid
campaign and post poll) were conducted on a panel of respondents selected by multistage
stratified random sampling. The same panel of respondents was used in 1998 for two
waves of pre election and post poll surveys. In 1999 again the same panel formed the
sample of a post poll survey. The survey carried out in 2004 is the fourth general election
for which the survey has been conducted in a row. It has a substantially larger sample
of respondents than did the previous surveys and more state level variables.
The sample for the NES, 2004 survey was collected by using a four stage stratified
random sampling design. In first stage 420 of the 543 parliamentary constituencies were
sampled. In the second stage sampling of assembly contituencies within the parliamentary
constituencies was done to get a set of 932 assembly constituencies. In the third stage
43
sampling of polling station areas within the assembly constituencies was carried out by
using systematic random sampling to get a set of 2,380 polling station areas. Finally
respondents were drawn randomly from the electoral rolls of the selected polling station
areas which provided a target of 35,360 names. Of these face to face interviews were
conducted for 76.9 percent, to get a sample size of 27,189 respondents. The numbers
of variables on which data was collected were 160. In comparison to official data the
sample which was eventually used had a slight over representation of men, significant
over representation of rural areas, slight under representation of Muslims, and slight over
representation of SC.
44
Top Related