


Languages
Pages
Legal


1
Capital budgeting and Risk Analysis
2
3
Topics
Risk analysis: Sensitivity analysis
Scenario analysis
Simulation analysis
4
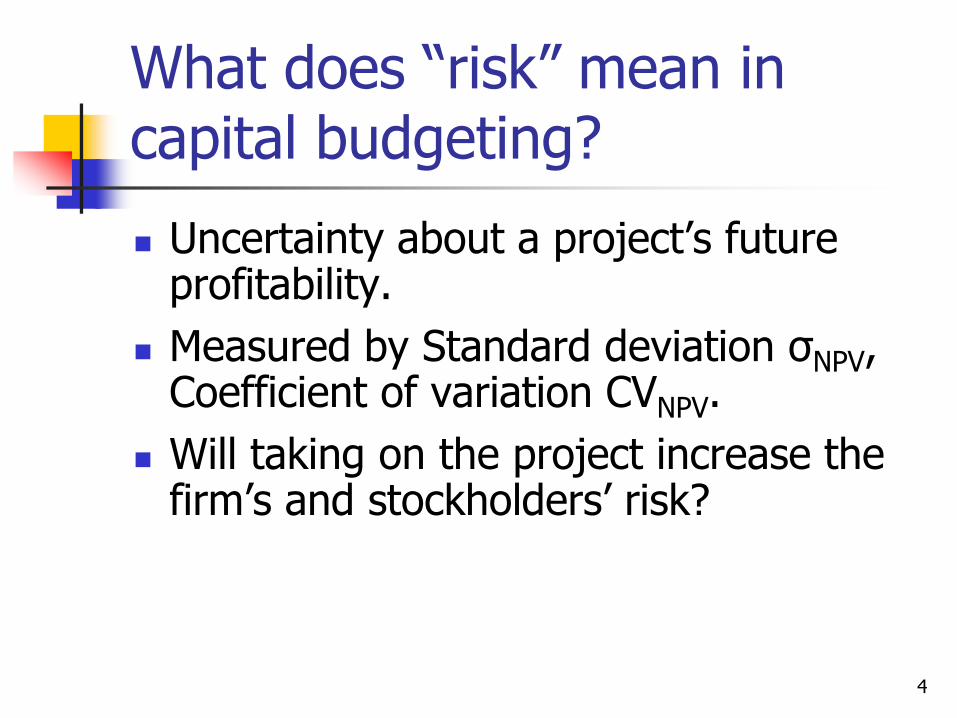
What does “risk” mean in capital budgeting?
Uncertainty about a project’s future profitability.
Measured by Standard deviation σNPV, Coefficient of variation CVNPV.
Will taking on the project increase the firm’s and stockholders’ risk?
5
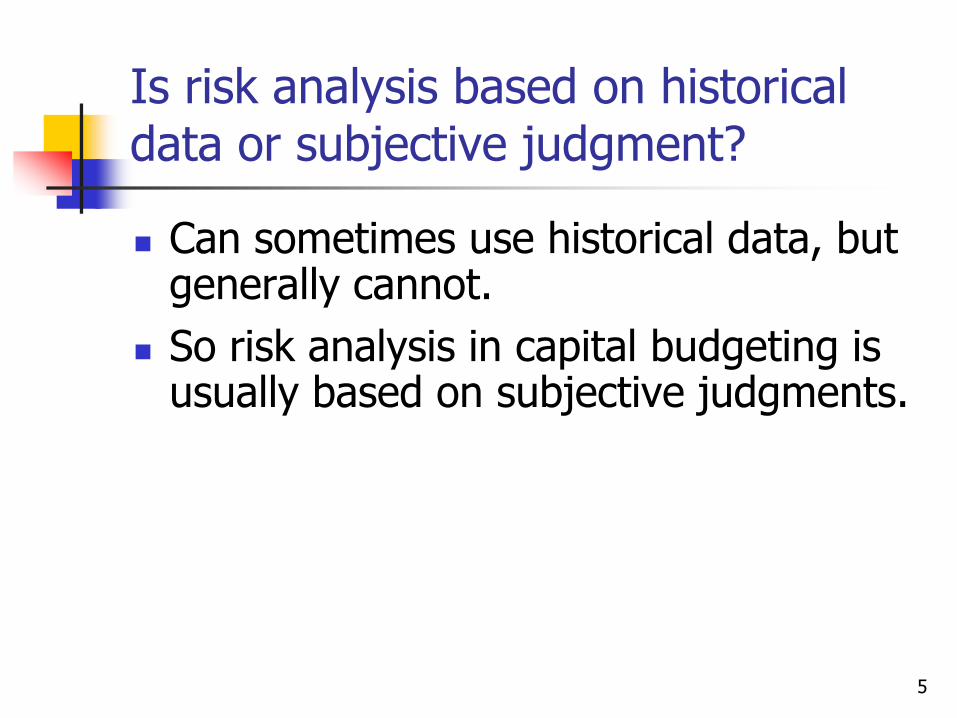
Is risk analysis based on historical data or subjective judgment?
Can sometimes use historical data, but generally cannot.
So risk analysis in capital budgeting is usually based on subjective judgments.

6
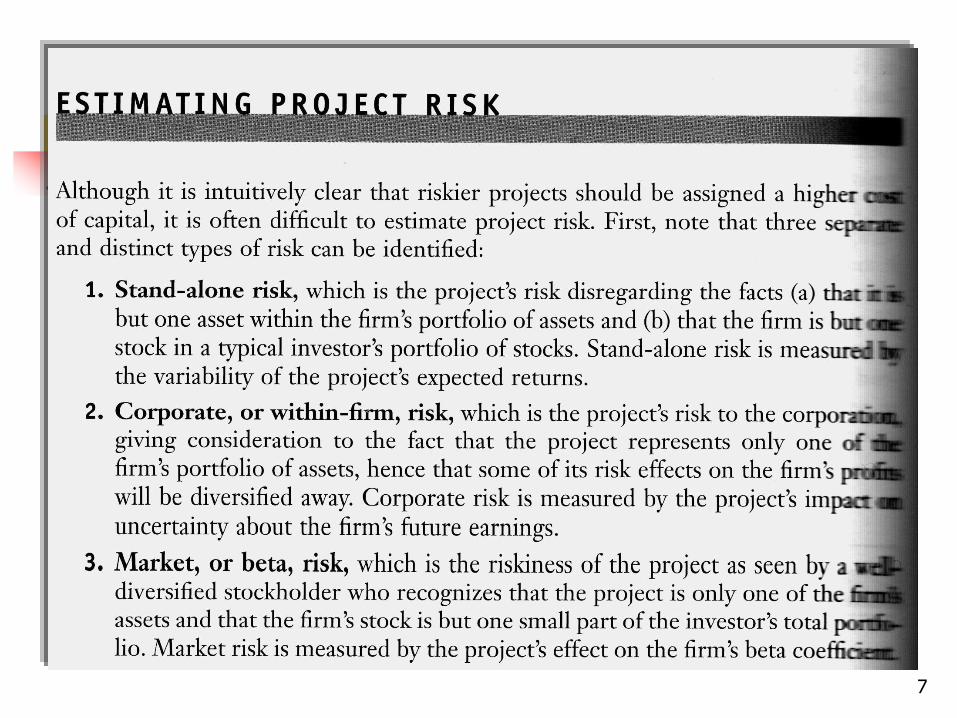
What three types of risk are relevant in capital budgeting?
Stand-alone risk
Corporate risk
Market (or beta) risk
7
8
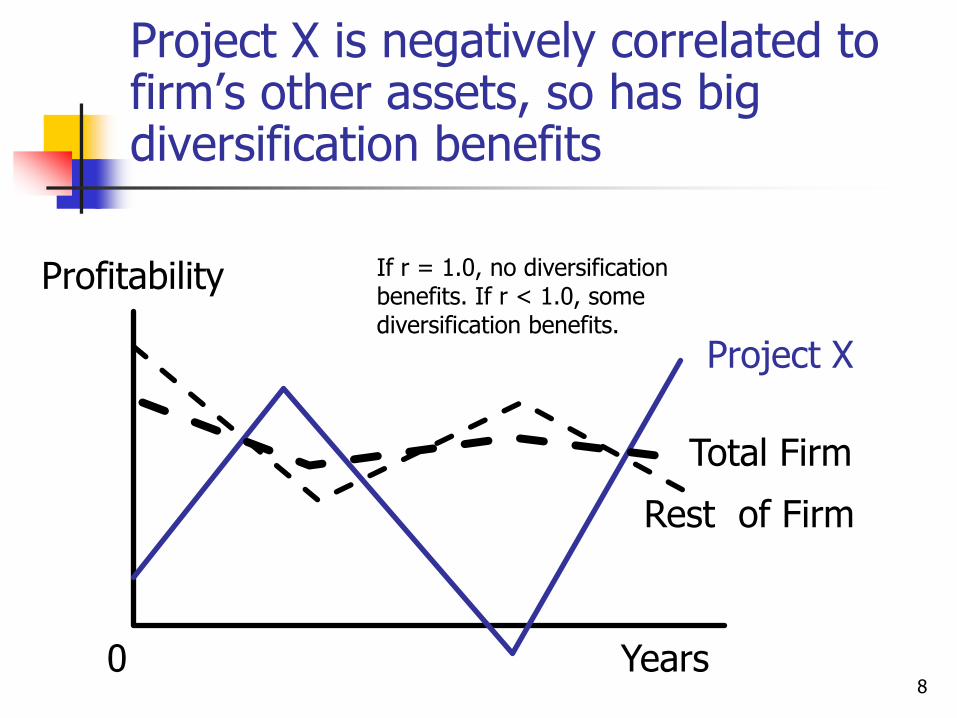
Profitability
0 Years
Project X
Total Firm
Rest of Firm
Project X is negatively correlated to firm’s other assets, so has big diversification benefits
If r = 1.0, no diversification benefits. If r < 1.0, some diversification benefits.

9
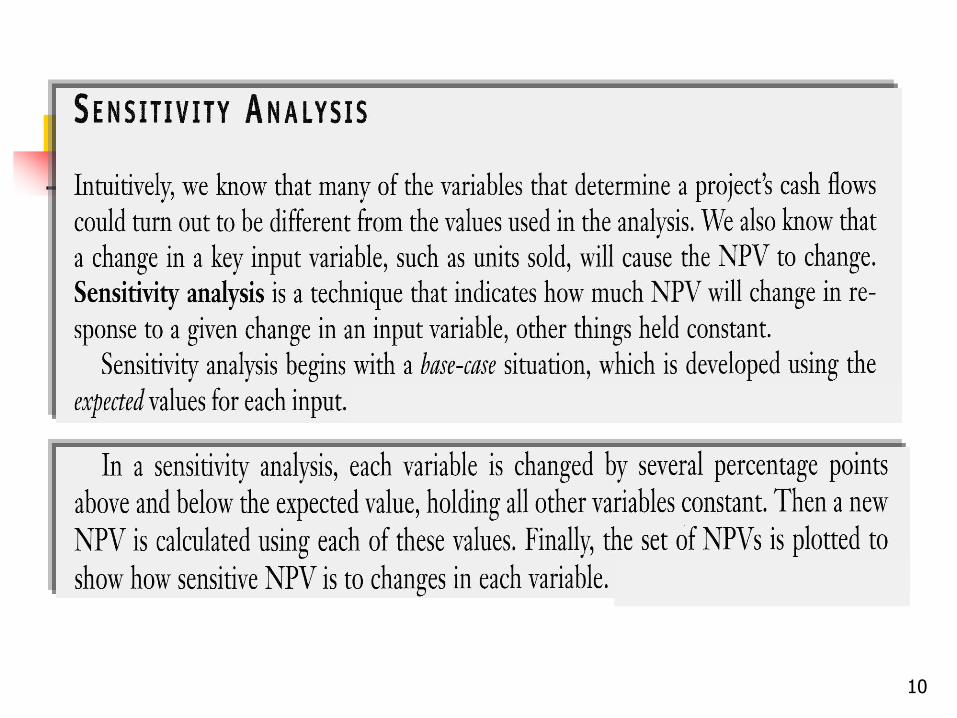
What is sensitivity analysis?
Shows how changes in a variable such as unit sales affect NPV or IRR.
Each variable is fixed except one. Change this one variable to see the effect on NPV or IRR.
Answers “what if” questions, e.g. “What if sales decline by 30%?”
10
11
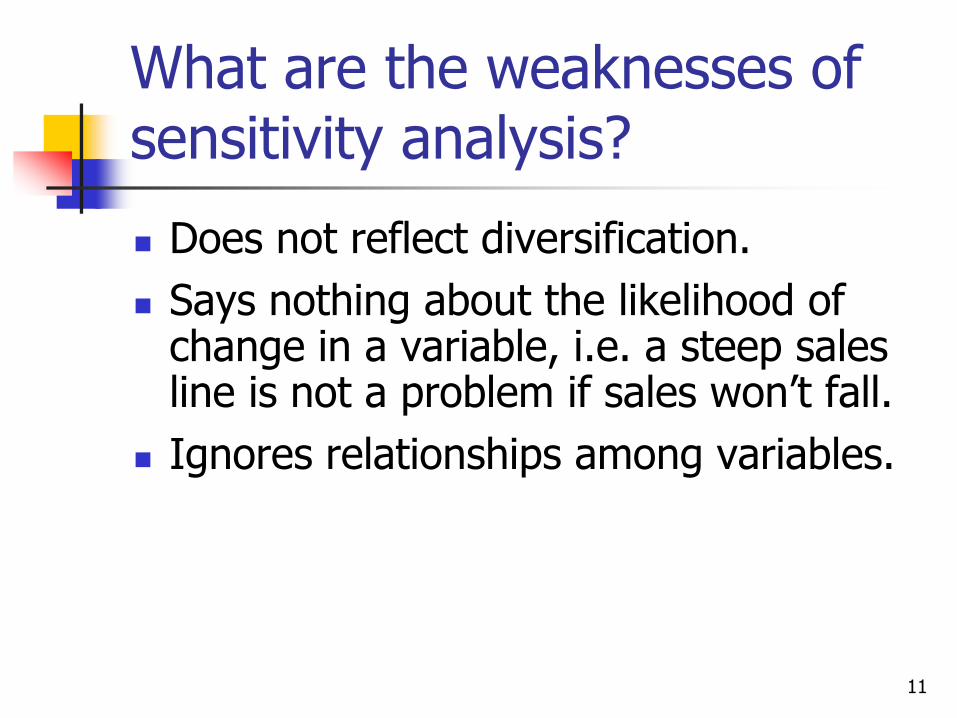
What are the weaknesses of sensitivity analysis?
Does not reflect diversification.
Says nothing about the likelihood of change in a variable, i.e. a steep sales line is not a problem if sales won’t fall.
Ignores relationships among variables.
12
13
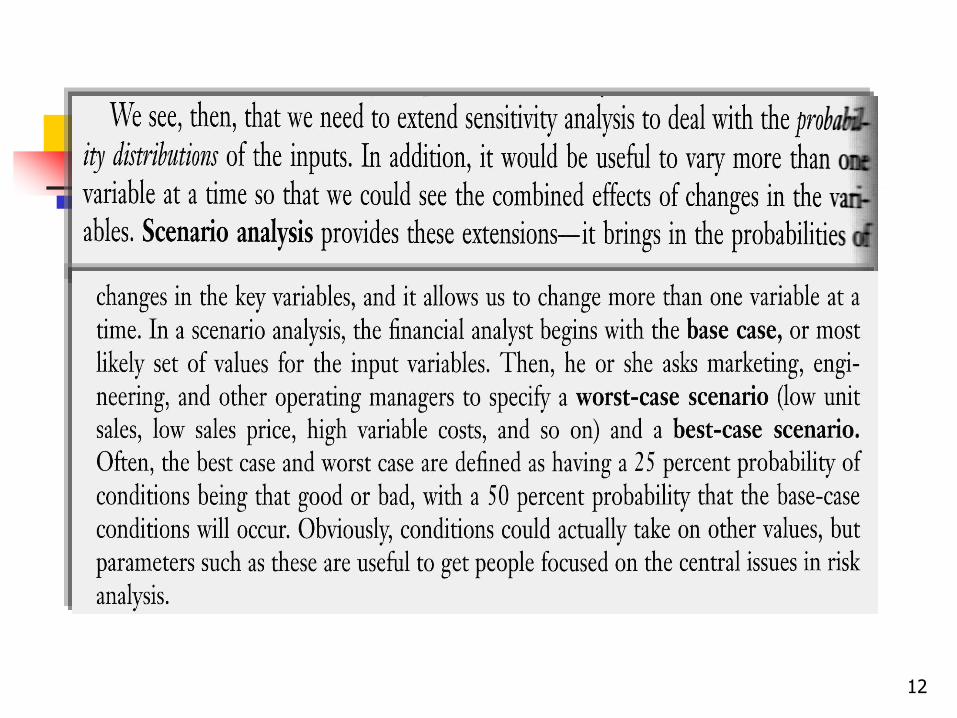
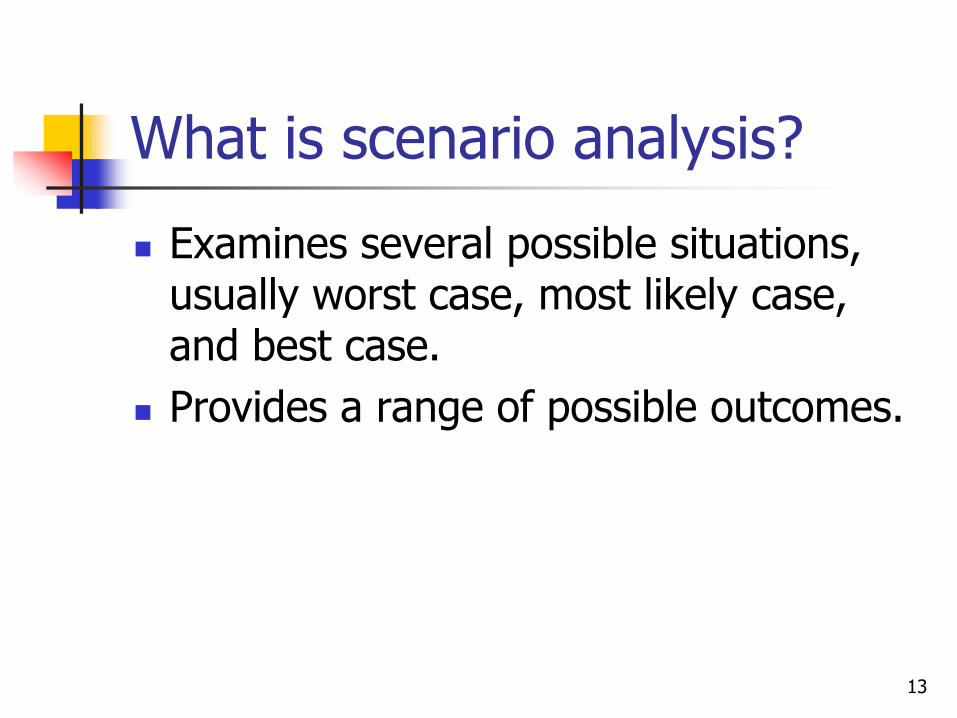
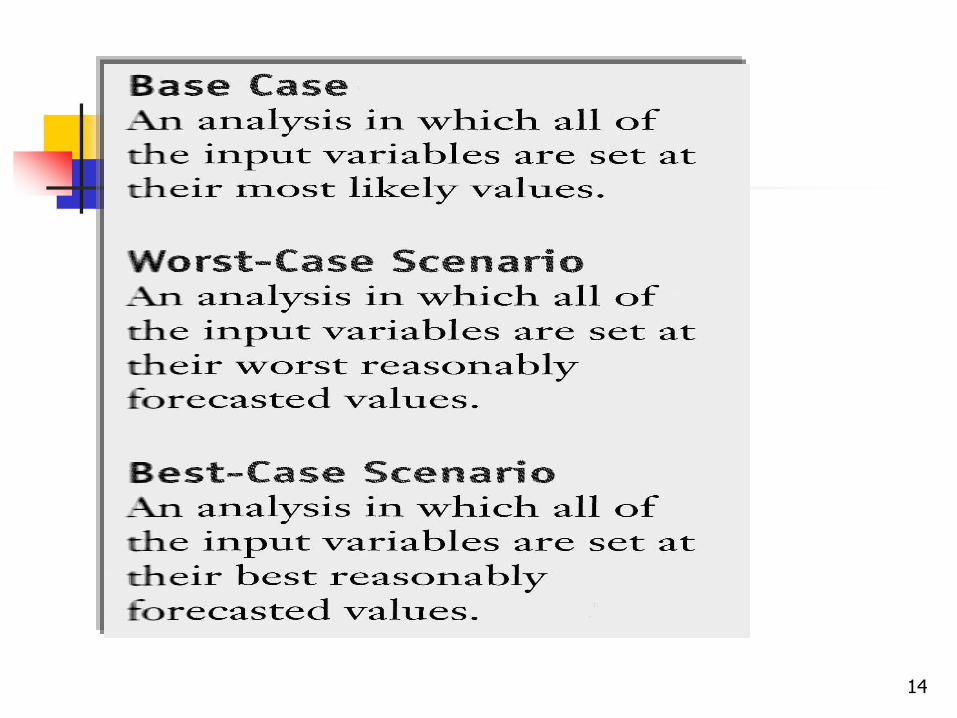
What is scenario analysis?
Examines several possible situations, usually worst case, most likely case, and best case.
Provides a range of possible outcomes.
14
15
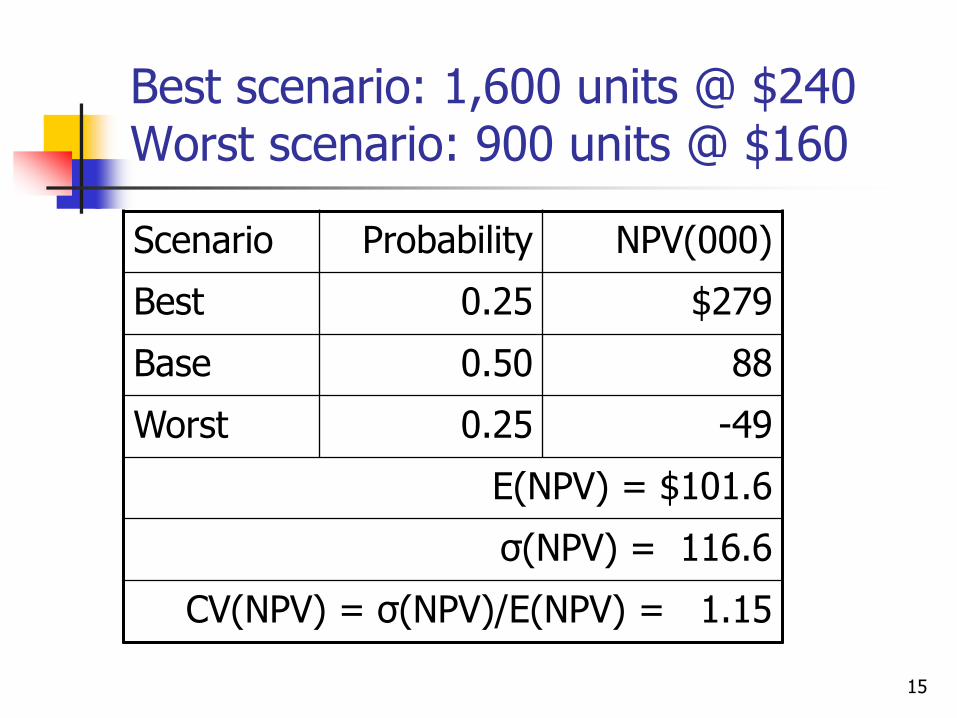
Best scenario: 1,600 units @ $240 Worst scenario: 900 units @ $160
Scenario Probability NPV(000)
Best 0.25 $279
Base 0.50 88
Worst 0.25 -49
E(NPV) = $101.6
σ(NPV) = 116.6
CV(NPV) = σ(NPV)/E(NPV) = 1.15
16
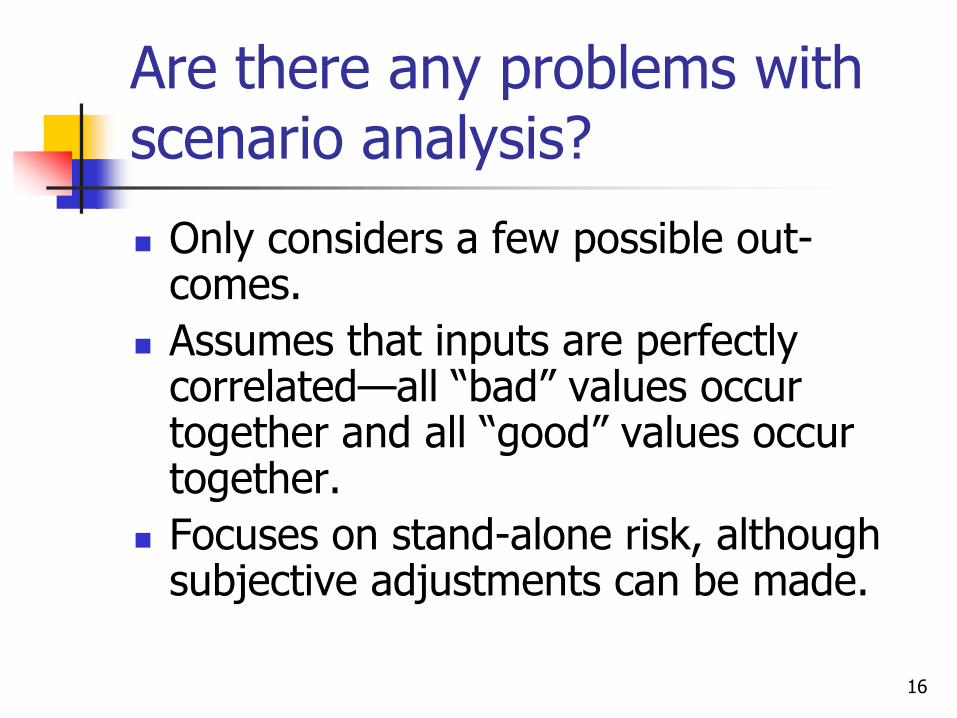
Are there any problems with scenario analysis?
Only considers a few possible out-comes.
Assumes that inputs are perfectly correlated—all “bad” values occur together and all “good” values occur together.
Focuses on stand-alone risk, although subjective adjustments can be made.
17
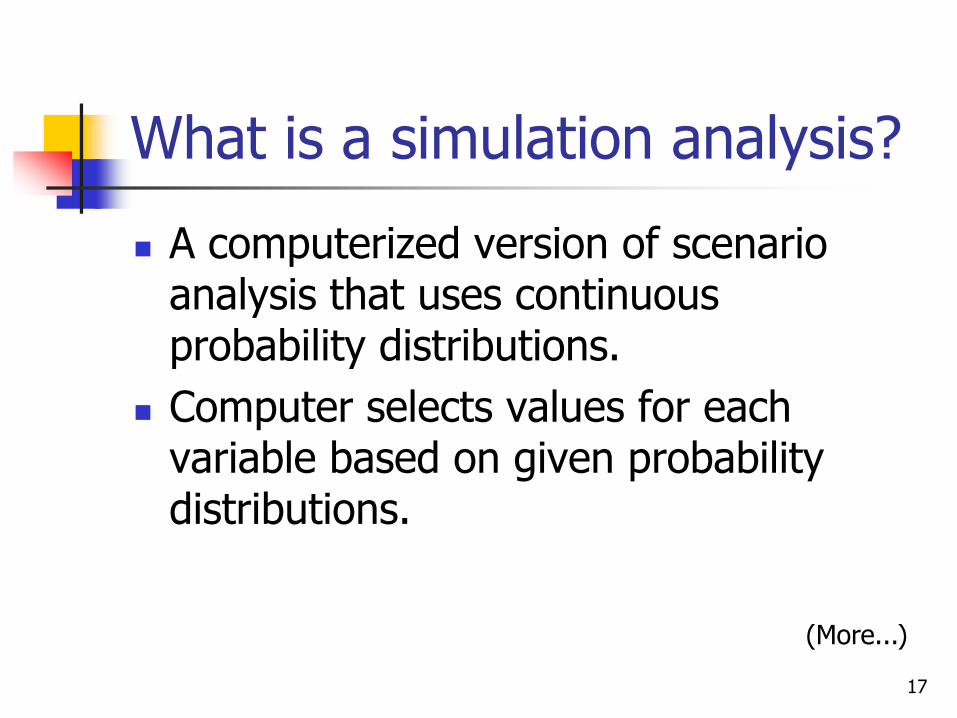
What is a simulation analysis?
A computerized version of scenario analysis that uses continuous probability distributions.
Computer selects values for each variable based on given probability distributions.
(More...)
18
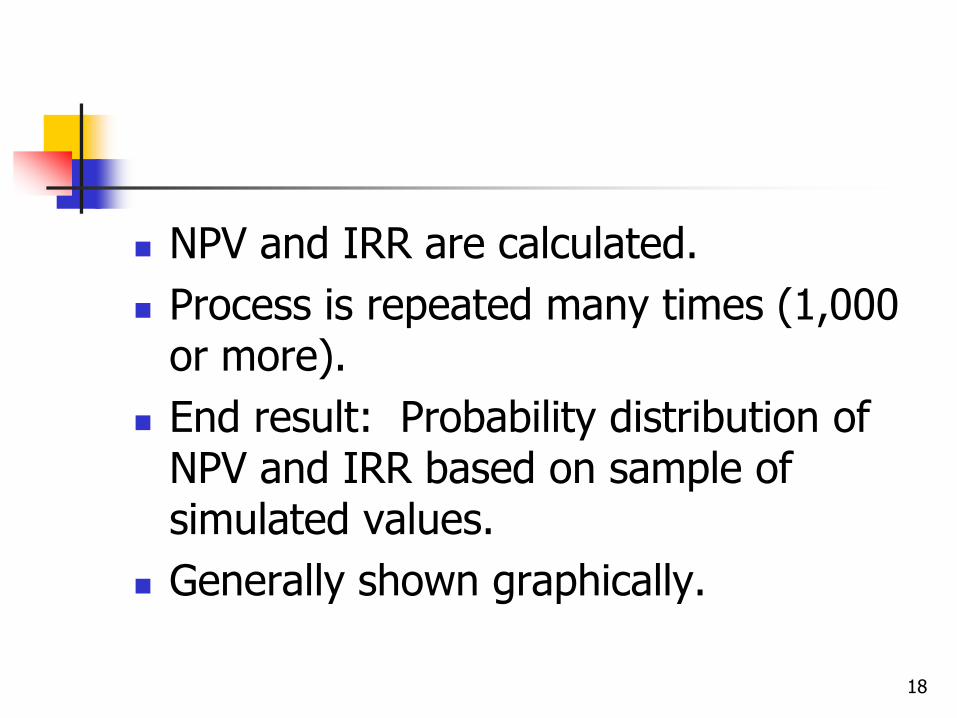
NPV and IRR are calculated.
Process is repeated many times (1,000 or more).
End result: Probability distribution of NPV and IRR based on sample of simulated values.
Generally shown graphically.
19
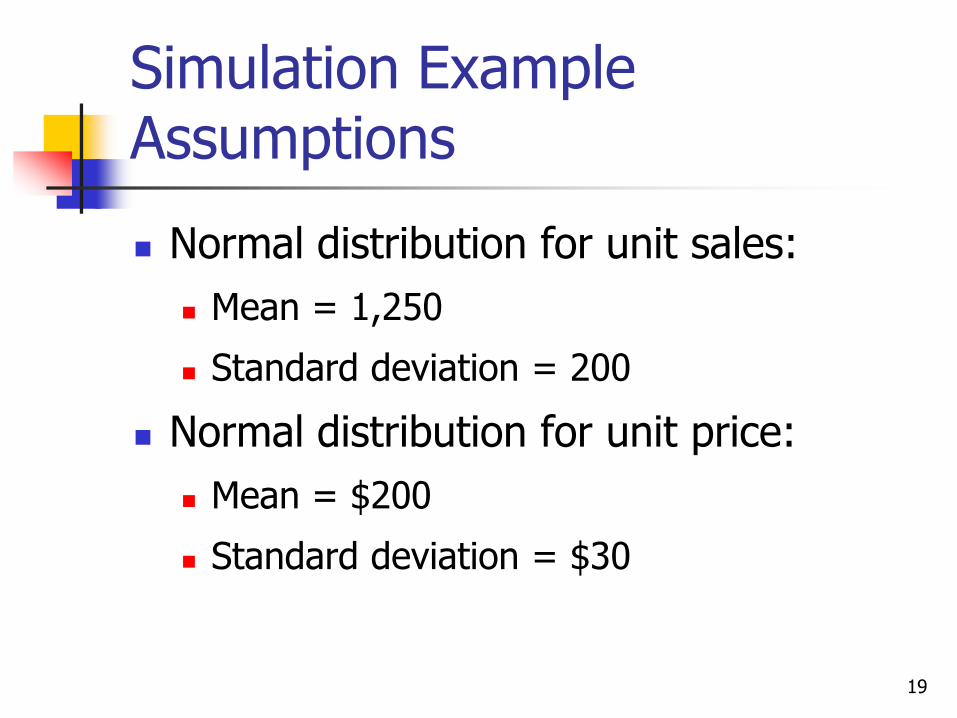
Simulation Example Assumptions
Normal distribution for unit sales:
Mean = 1,250
Standard deviation = 200
Normal distribution for unit price:
Mean = $200
Standard deviation = $30
20
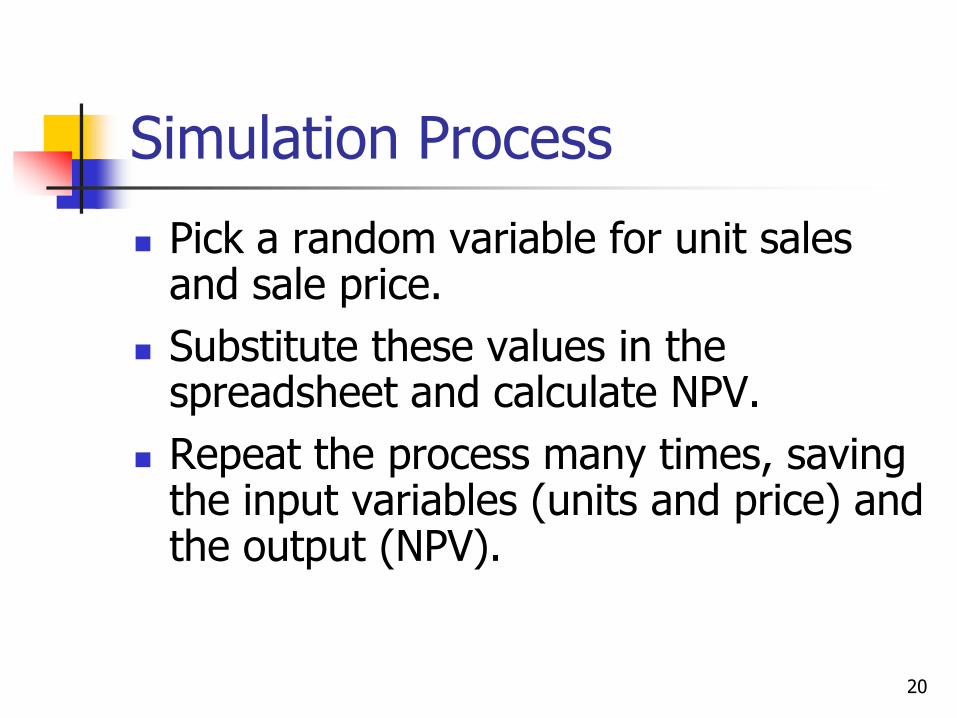
Simulation Process
Pick a random variable for unit sales and sale price.
Substitute these values in the spreadsheet and calculate NPV.
Repeat the process many times, saving the input variables (units and price) and the output (NPV).

21
Simulation Results (2,000 trials)
Units Price NPV
Mean 1,252 $200 $88,808
Std deviation 199 30 $82,519
Maximum 1,927 294 $475,145
Minimum 454 94 -$166,208
Median 685 $163 $84,551
Prob NPV > 0 86.9%
CV 0.93
22
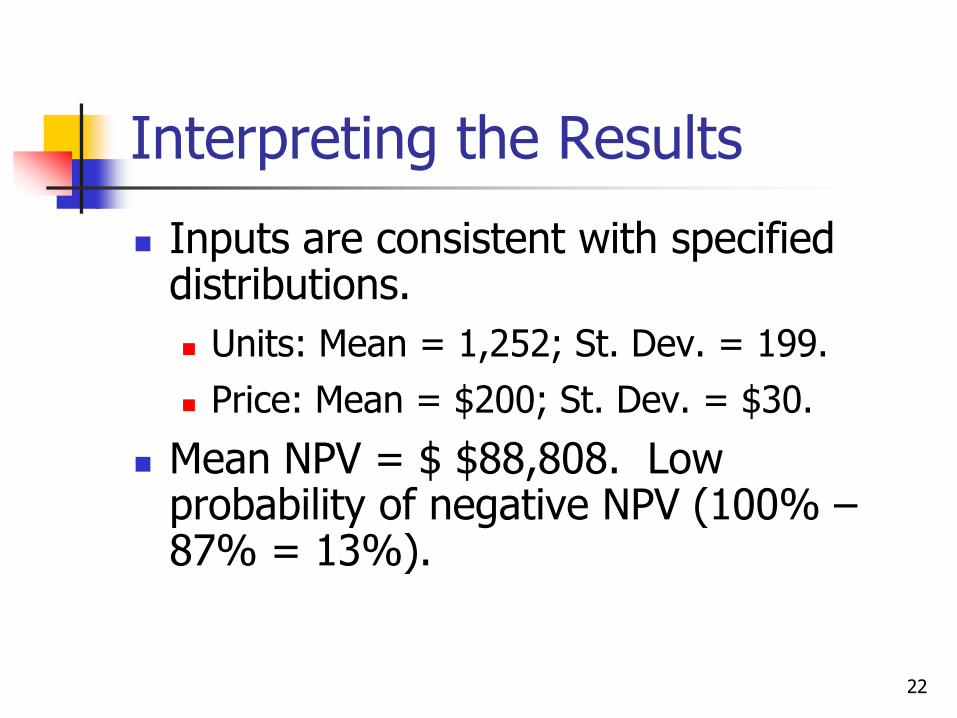
Interpreting the Results
Inputs are consistent with specified distributions.
Units: Mean = 1,252; St. Dev. = 199.
Price: Mean = $200; St. Dev. = $30.
Mean NPV = $ $88,808. Low probability of negative NPV (100% – 87% = 13%).
23
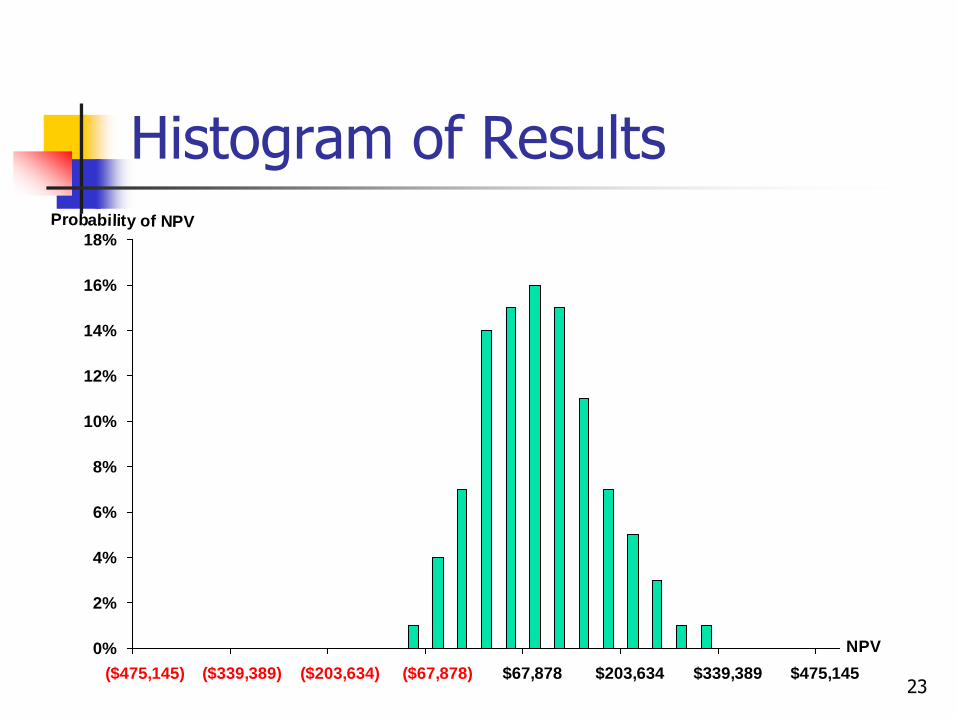
Histogram of Results
0%
2%
4%
6%
8%
10%
12%
14%
16%
18%
($475,145) ($339,389) ($203,634) ($67,878) $67,878 $203,634 $339,389 $475,145
NPV
Probability of NPV

24
What are the advantages of simulation analysis?
Reflects the probability distributions of each input.
Shows range of NPVs, the expected NPV, σNPV, and CVNPV.
Gives an intuitive graph of the risk situation.

25
What are the disadvantages of simulation?
Difficult to specify probability distributions and correlations.
If inputs are bad, output will be bad: “Garbage in, garbage out.”
(More...)
26
Sensitivity, scenario, and simulation analyses do not provide a decision rule. They do not indicate whether a project’s expected return is sufficient to compensate for its risk.
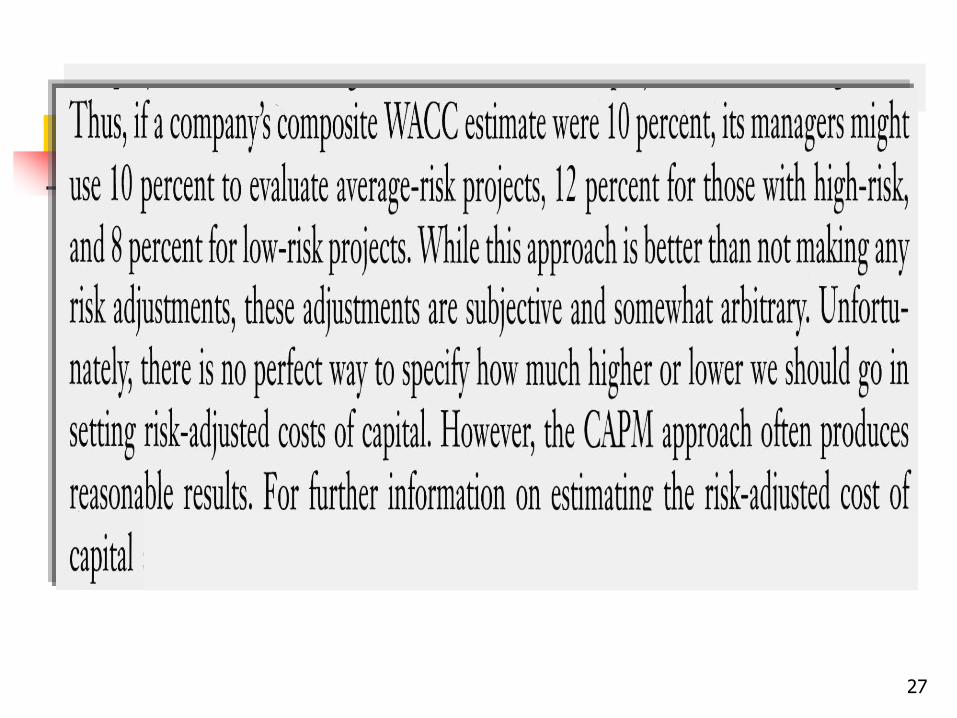
27
28
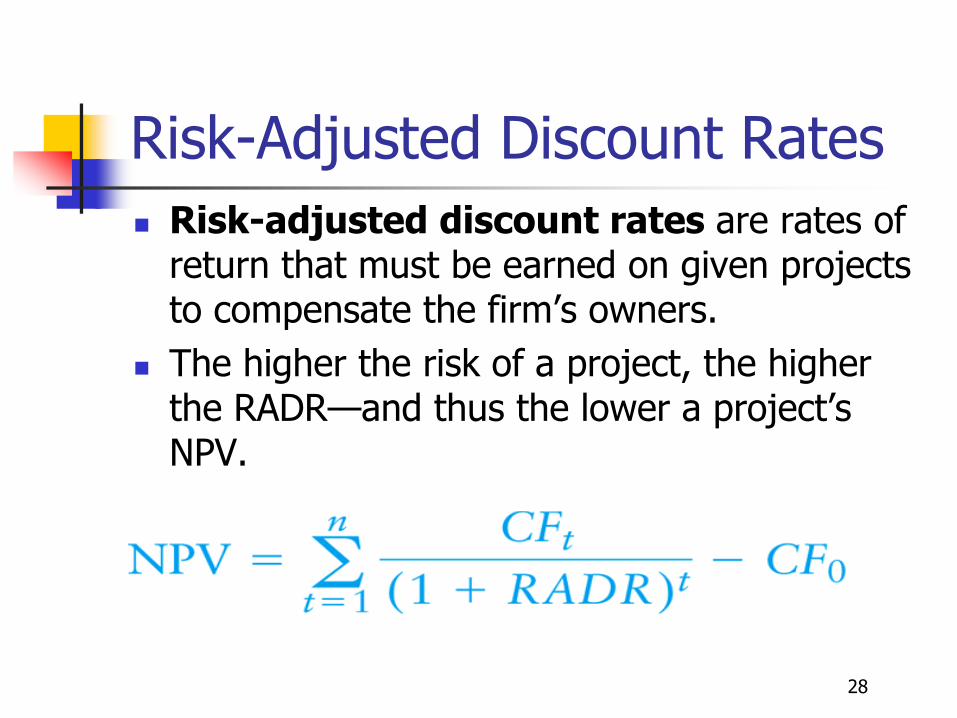
Risk-Adjusted Discount Rates
Risk-adjusted discount rates are rates of return that must be earned on given projects to compensate the firm’s owners.
The higher the risk of a project, the higher the RADR—and thus the lower a project’s NPV.
29
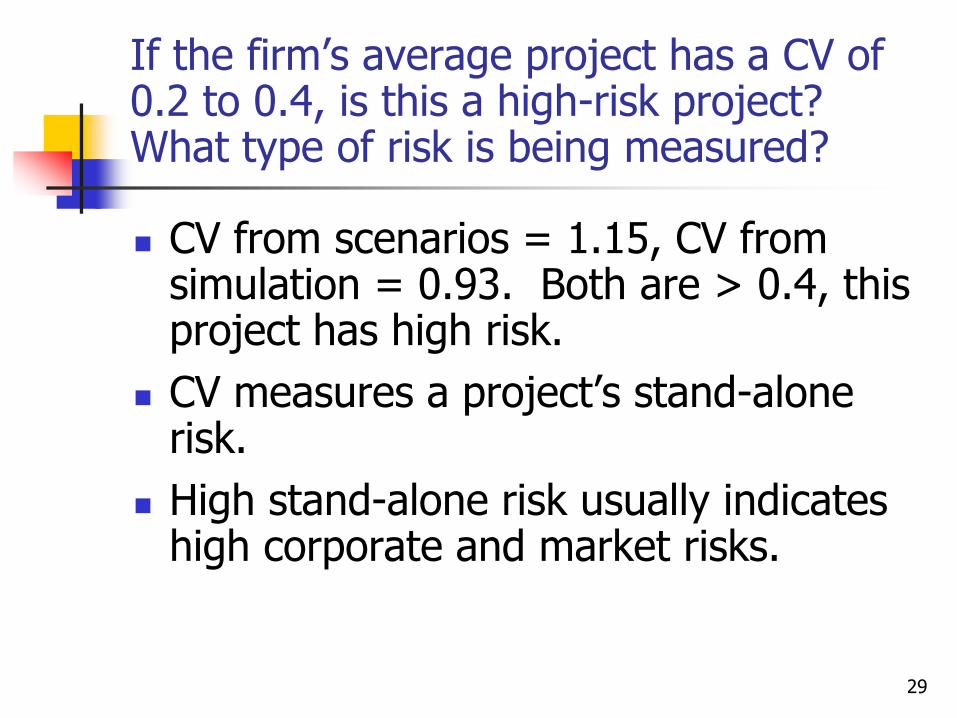
If the firm’s average project has a CV of 0.2 to 0.4, is this a high-risk project? What type of risk is being measured?
CV from scenarios = 1.15, CV from simulation = 0.93. Both are > 0.4, this project has high risk.
CV measures a project’s stand-alone risk.
High stand-alone risk usually indicates high corporate and market risks.
30
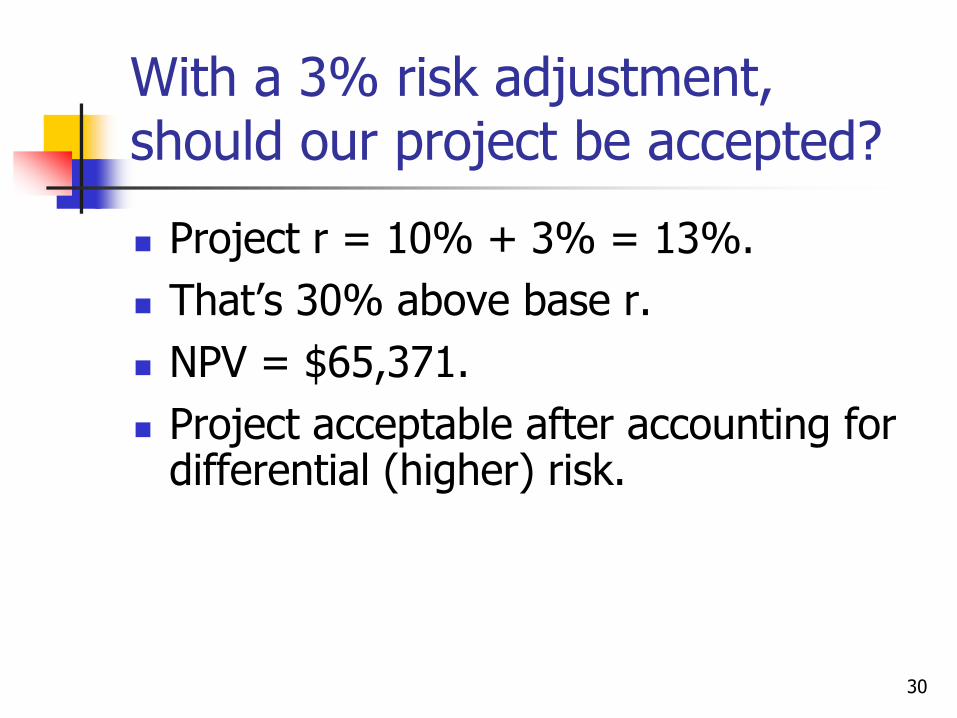
With a 3% risk adjustment, should our project be accepted?
Project r = 10% + 3% = 13%.
That’s 30% above base r.
NPV = $65,371.
Project acceptable after accounting for differential (higher) risk.
31
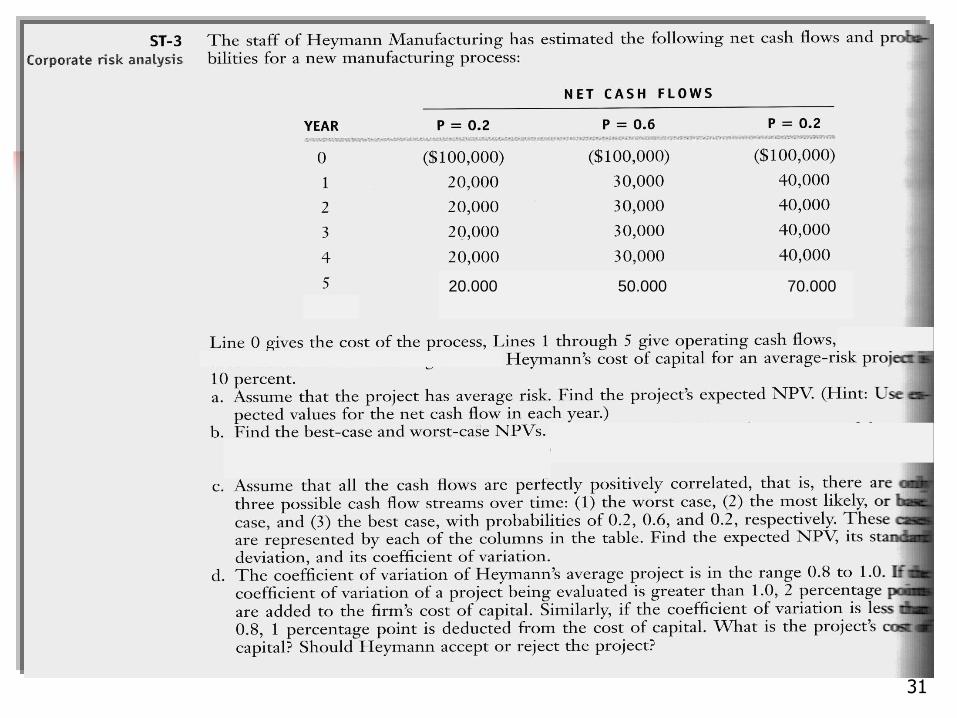
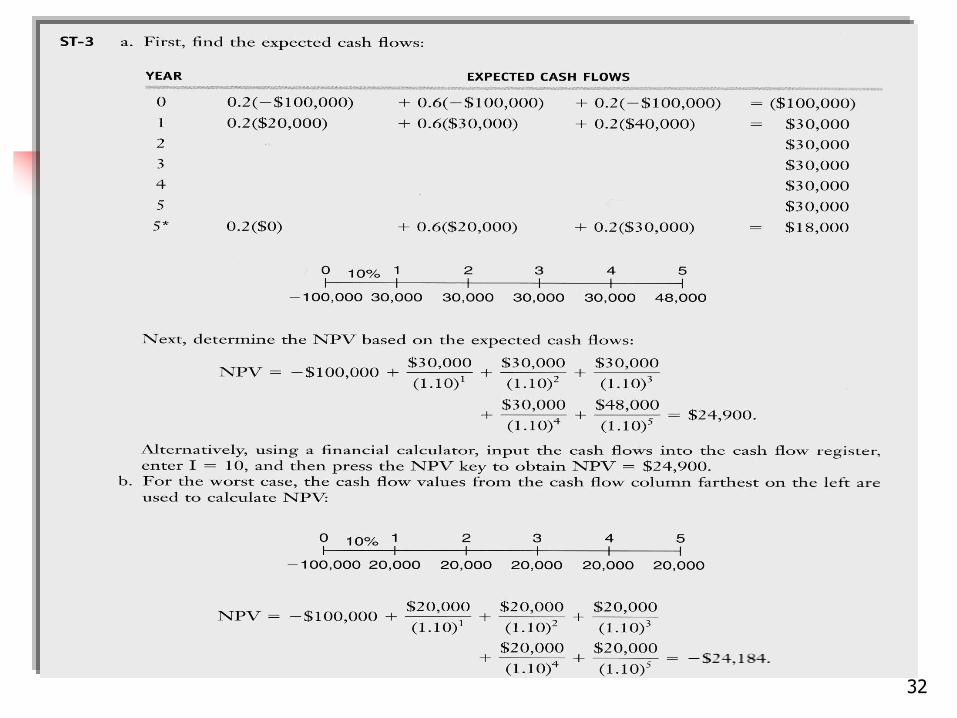
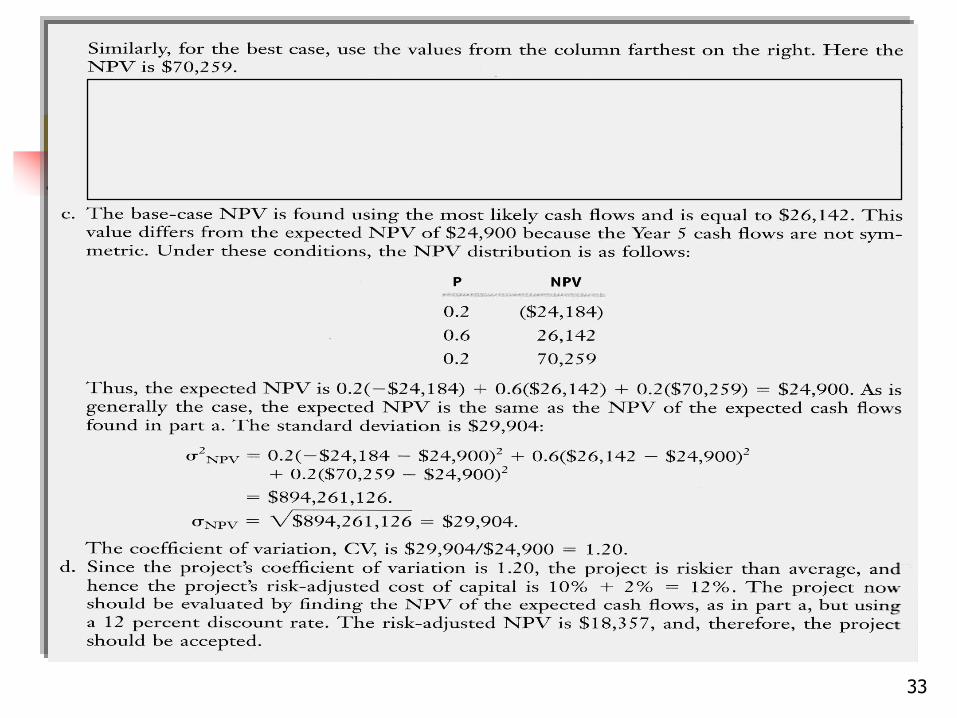
20.000 50.000 70.000
32
33
34

35
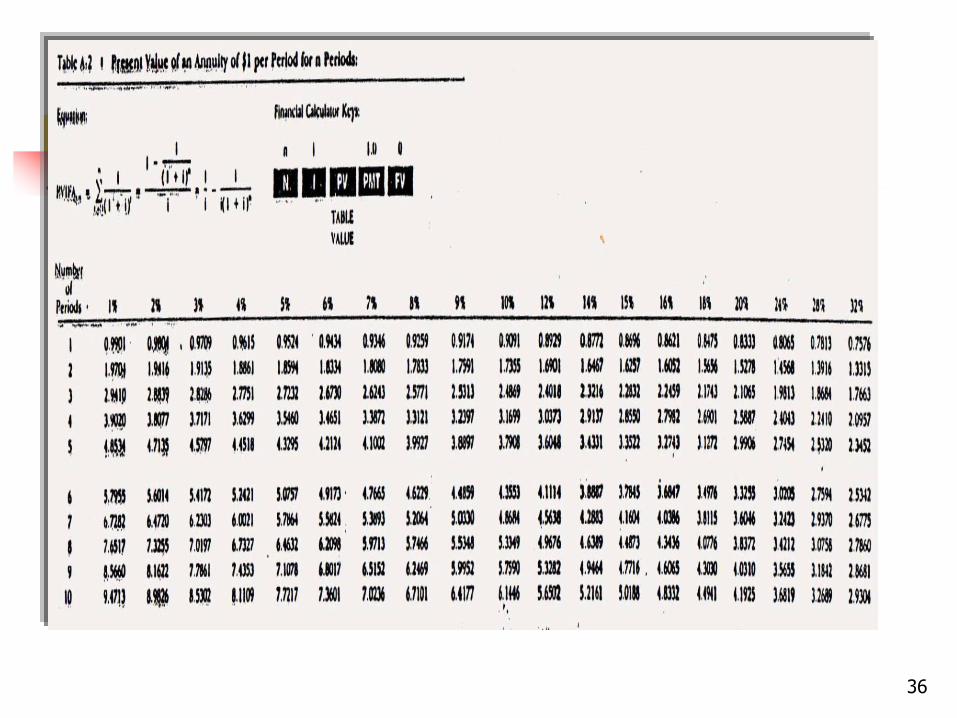
36
37
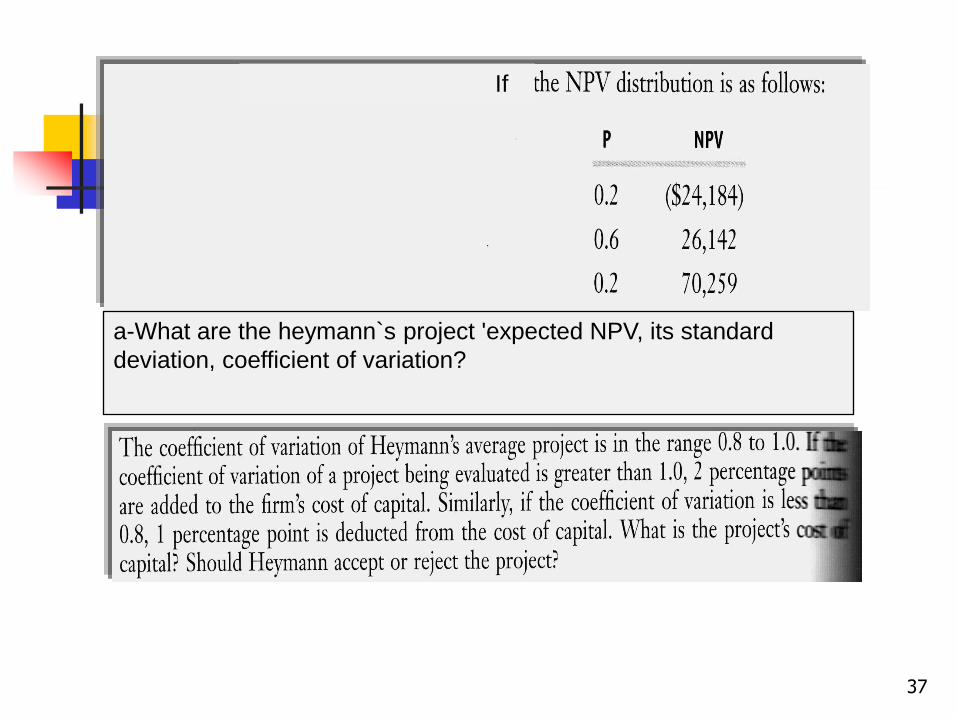
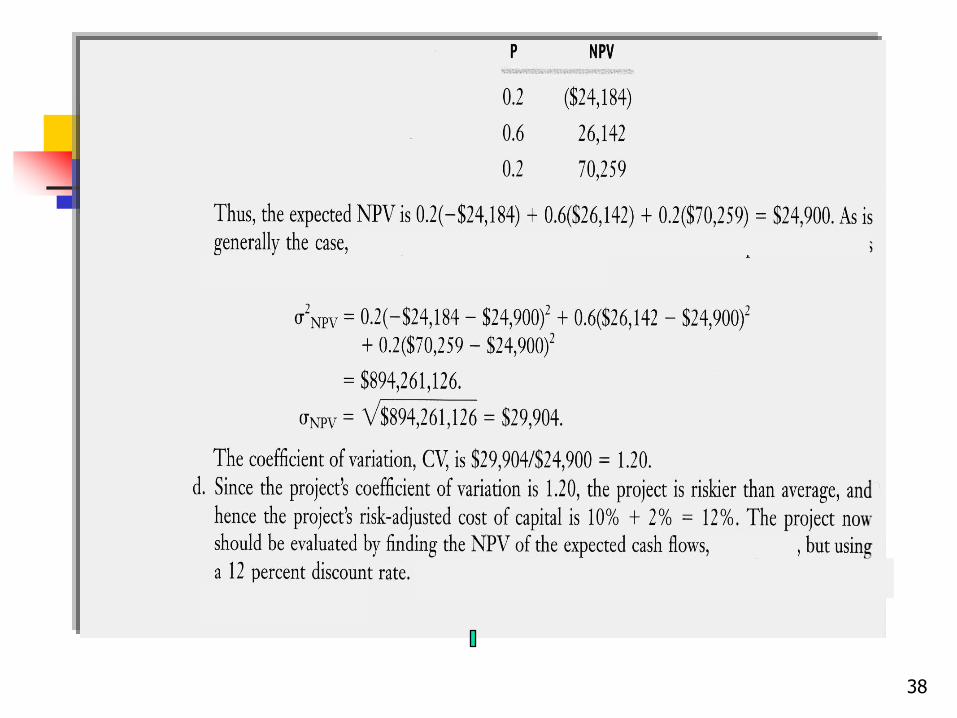
If
a-What are the heymann`s project 'expected NPV, its standard
deviation, coefficient of variation?
38
39
Top Related