


Languages
Pages
Legal


Capacity Forecast Report
Sean ChangMarket Analysis and Design
Suresh Pabbisetty CQF, ERP, CSQACredit
CWG/MCWG September 16, 2015ERCOT Public
2
Capacity Forecast Model - History
ERCOT Public
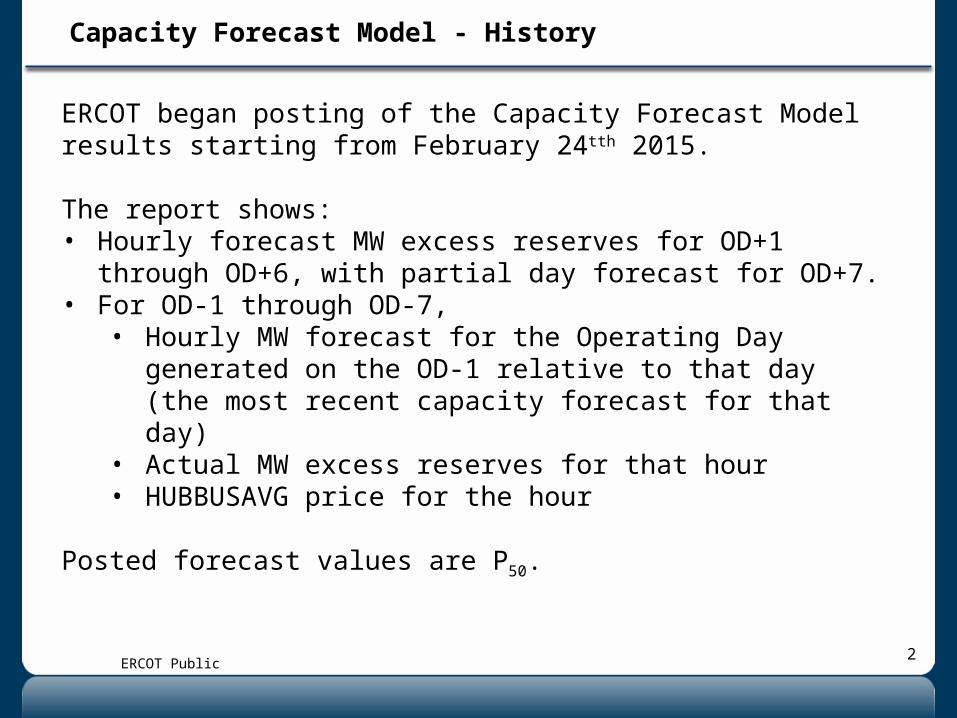
ERCOT began posting of the Capacity Forecast Model results starting from February 24tth 2015.
The report shows:• Hourly forecast MW excess reserves for OD+1 through OD+6,
with partial day forecast for OD+7.• For OD-1 through OD-7,
• Hourly MW forecast for the Operating Day generated on the OD-1 relative to that day (the most recent capacity forecast for that day)
• Actual MW excess reserves for that hour• HUBBUSAVG price for the hour
Posted forecast values are P50.

3
• The idea is that Reserve Forecast could help to identify potential scarcity events during the forward week.
• With the implementation of the Operating Reserve Demand Curve (ORDC), we expect an increased correlation between reserves and prices.
• Reserves forecast calculation:
Expected Reserves = + Non-Wind Resource HSL+ AWS Wind Forecast+ Load Resource RRS– Resource Outages– Load Forecast± Load Forecast Error
Capacity Forecast Model – Model recap
4
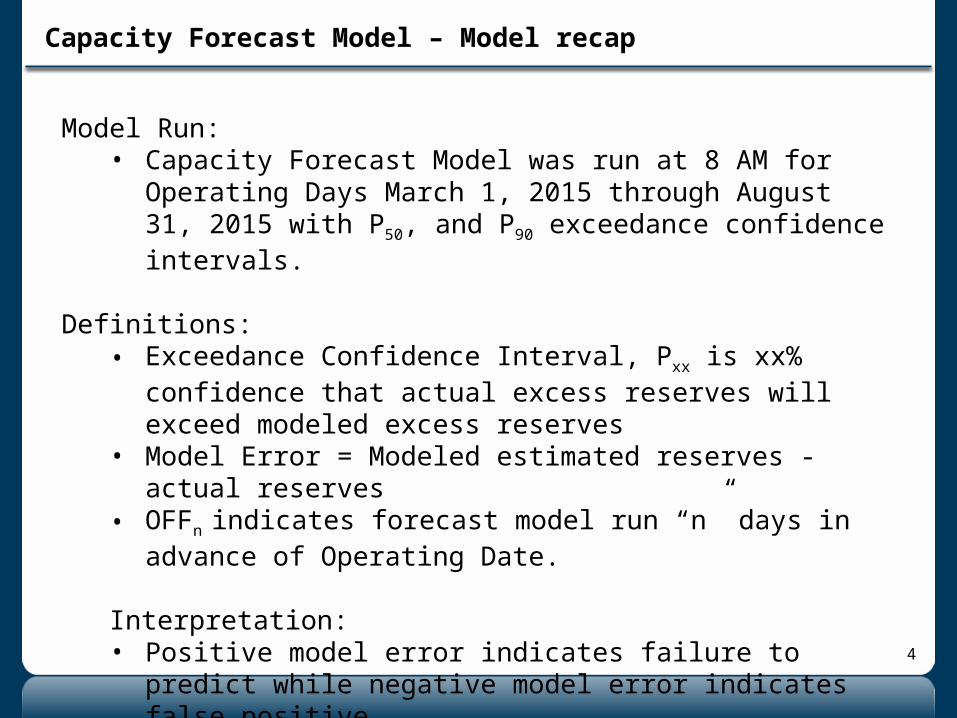
Model Run:• Capacity Forecast Model was run at 8 AM for Operating Days
March 1, 2015 through August 31, 2015 with P50, and P90 exceedance confidence intervals.
Definitions:• Exceedance Confidence Interval, Pxx is xx% confidence that
actual excess reserves will exceed modeled excess reserves• Model Error = Modeled estimated reserves - actual reserves• OFFn indicates forecast model run “n” days in advance of
Operating Date.
Interpretation:• Positive model error indicates failure to predict while negative
model error indicates false positive.
Capacity Forecast Model – Model recap

5
Correlation of
Capacity Forecast Reserves to Actual Reserves
ERCOT Public
6
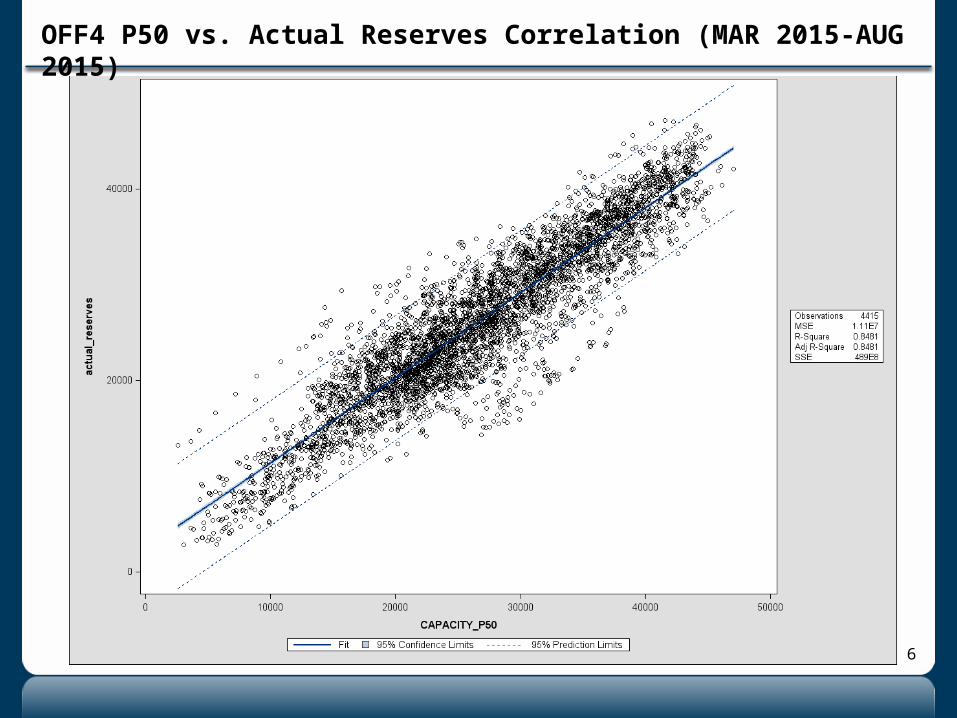
OFF4 P50 vs. Actual Reserves Correlation (MAR 2015-AUG 2015)

7
OFF1 P50 vs. Actual Reserves Correlation (MAR 2015-AUG 2015)
8
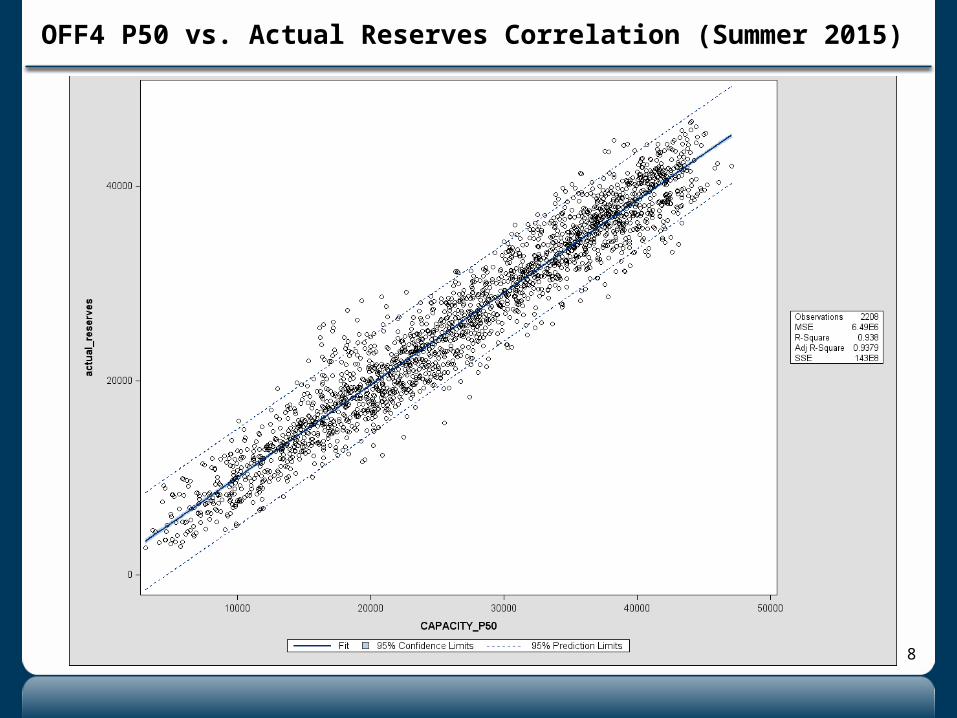
OFF4 P50 vs. Actual Reserves Correlation (Summer 2015)

9
OFF1 P50 vs. Actual Reserves Correlation (Summer 2015)
10
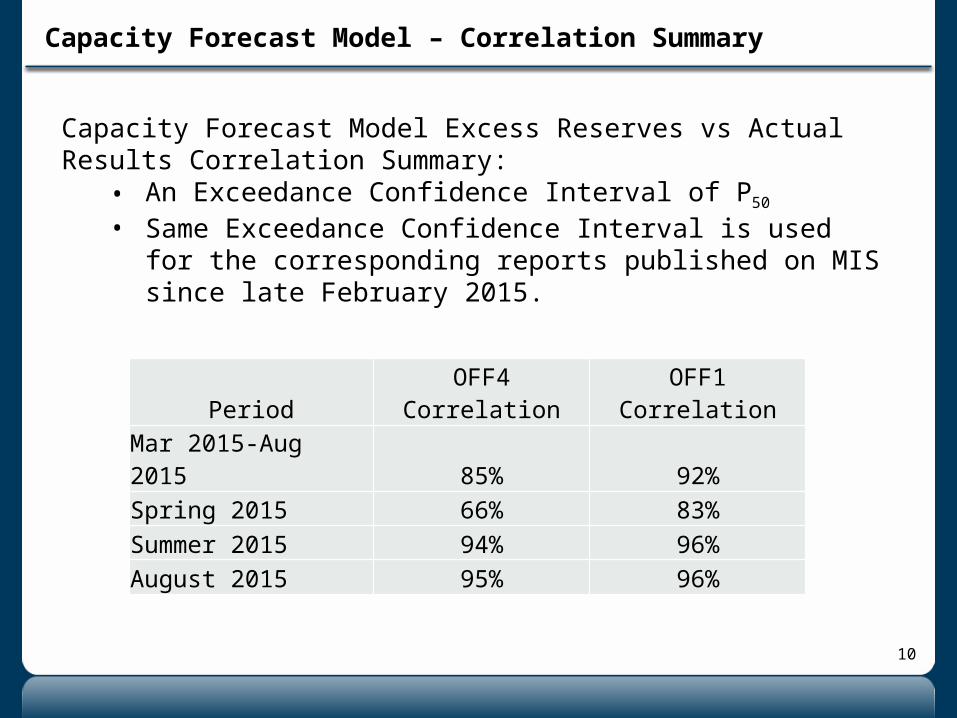
Capacity Forecast Model Excess Reserves vs Actual Results Correlation Summary:
• An Exceedance Confidence Interval of P50
• Same Exceedance Confidence Interval is used for the corresponding reports published on MIS since late February 2015.
Capacity Forecast Model – Correlation Summary
Period OFF4 Correlation OFF1 Correlation
Mar 2015-Aug 2015 85% 92%
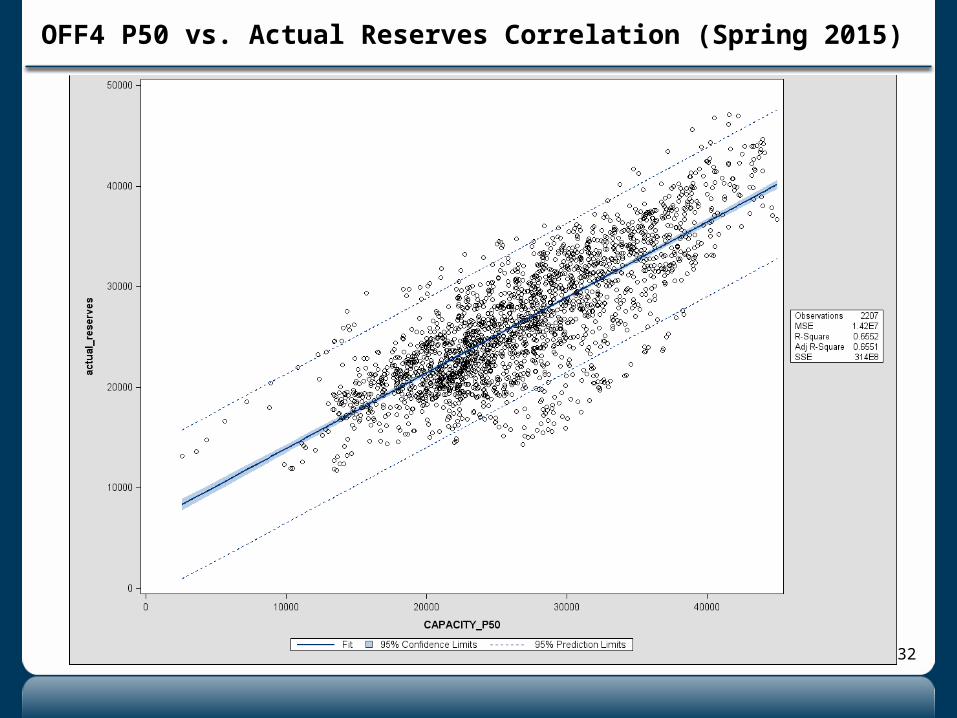
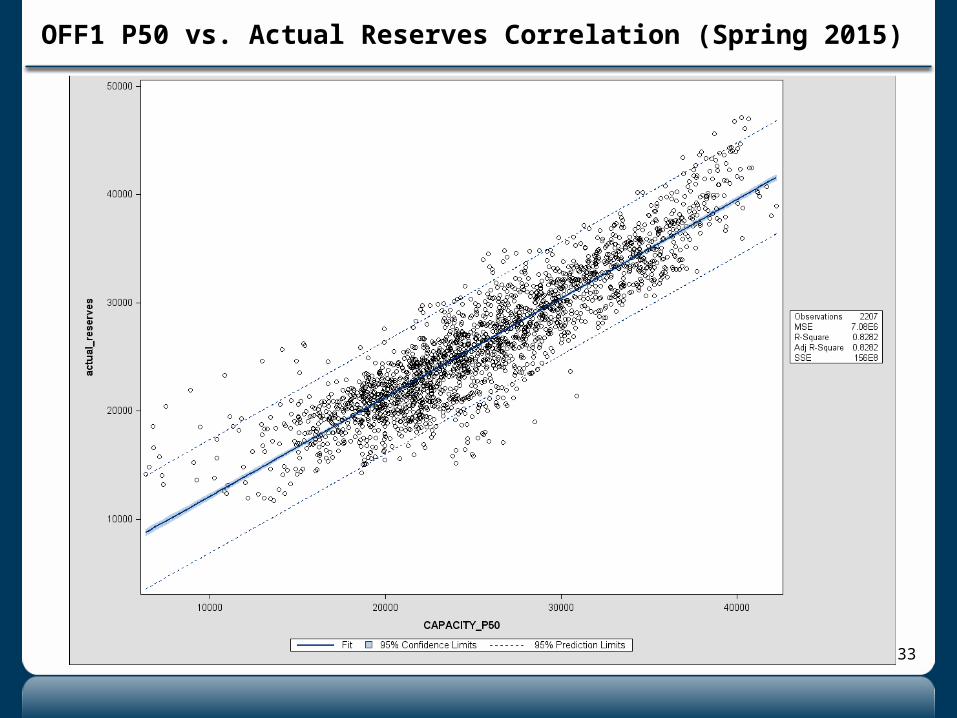
Spring 2015 66% 83%
Summer 2015 94% 96%
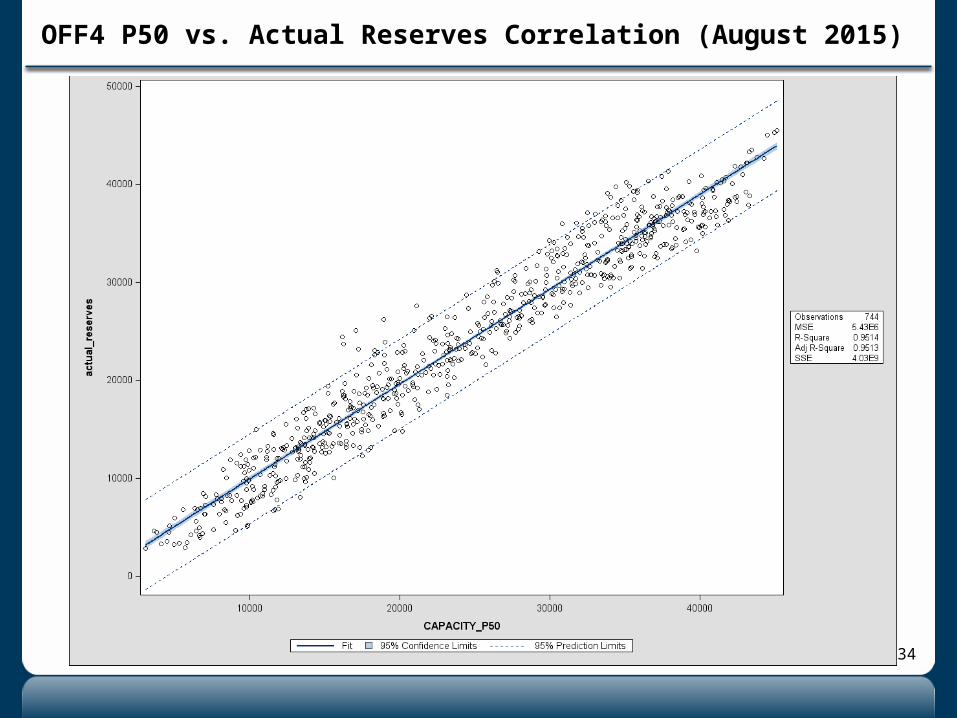
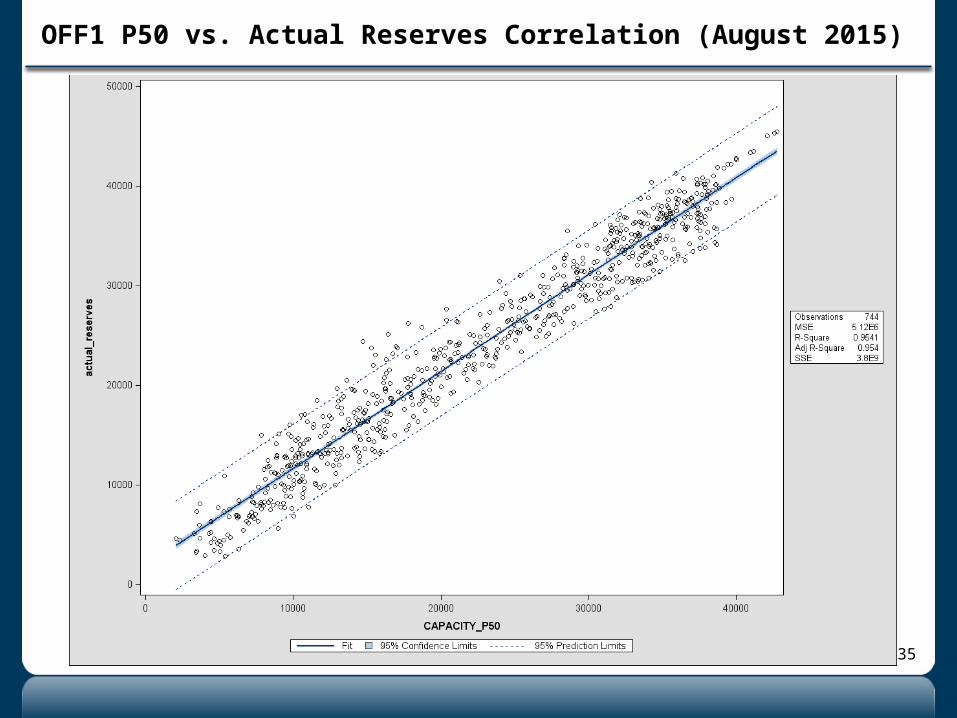
August 2015 95% 96%

11
Capacity Forecast Model Reserves Error Statistics
ERCOT Public

12
Error = Forecast Reserves – Actual Reserves
Error < 0 means• Model predicted to have reserves lower than what they
actually turned out to be• Type I Error or False Positive• Potential to ask for additional collateral but risk has not
materialized
Error > 0 means• Model predicted to have reserves higher than what they
actually turned out to be• Type II Error or False Negative• Potential failure to ask for additional collateral when risk has
materialized
Note: Various combinations of Exceedance Confidence Interval (P50 vs P90), offsets (OFF1 vs OFF4) and Excess Reserves Thresholds (ERT MW) could be adjusted to model for desired level of risk.
Capacity Forecast Model – Error
13
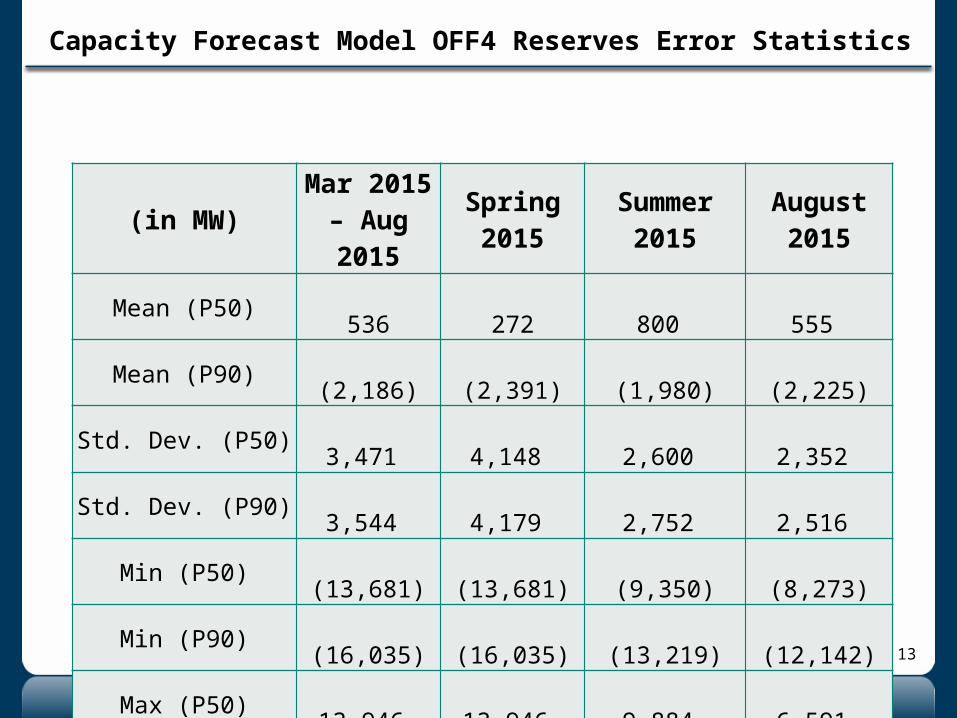
Capacity Forecast Model OFF4 Reserves Error Statistics
(in MW)Mar 2015 – Aug 2015
Spring 2015
Summer 2015
August 2015
Mean (P50) 536 272 800 555
Mean (P90) (2,186) (2,391) (1,980) (2,225)
Std. Dev. (P50) 3,471 4,148 2,600 2,352
Std. Dev. (P90) 3,544 4,179 2,752 2,516
Min (P50) (13,681) (13,681) (9,350) (8,273)
Min (P90) (16,035) (16,035) (13,219) (12,142)
Max (P50) 13,946 13,946 9,884 6,591
Max (P90) 10,846 10,846 7,524 4,090

14
Capacity Forecast Model OFF1 Reserves Error Statistics
(in MW)Mar 2015 – Aug 2015
Spring 2015
Summer 2015
August 2015
Mean (P50) (814) (746) (881) (1,307)
Mean (P90) (2,739) (2,528) (2,949) (3,376)
Std. Dev. (P50) 2,471 2,715 2,199 2,279
Std. Dev. (P90) 2,610 2,802 2,384 2,464
Min (P50) (13,054) (13,054) (9,727) (9,727)
Min (P90) (14,946) (14,946) (12,717) (12,717)
Max (P50) 9,613 9,613 6,455 4,534
Max (P90) 8,026 8,026 4,845 3,241
15
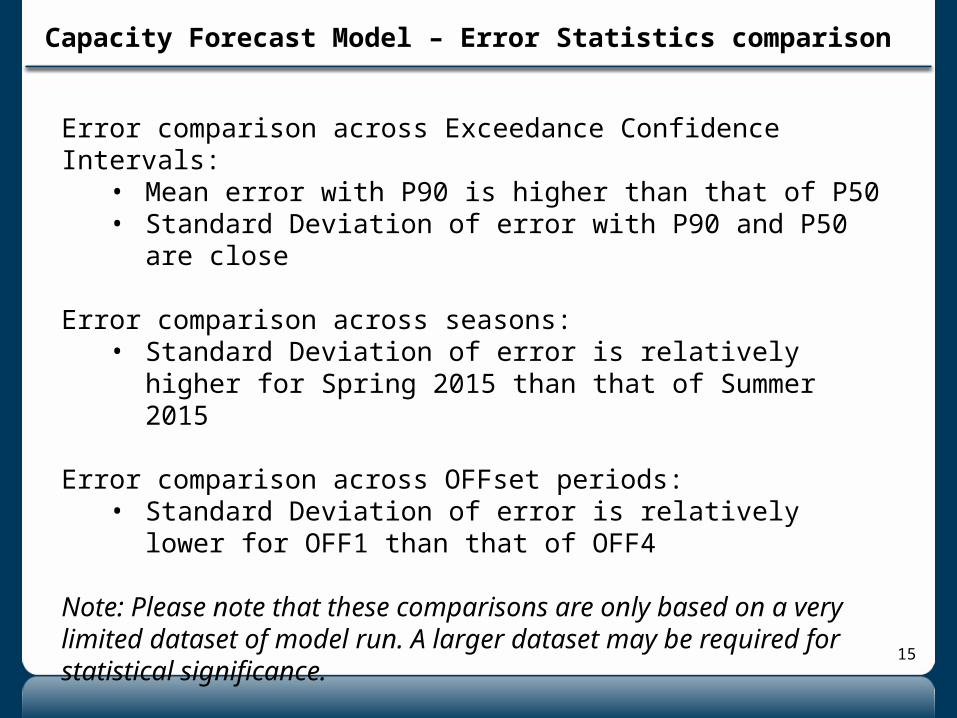
Error comparison across Exceedance Confidence Intervals:• Mean error with P90 is higher than that of P50• Standard Deviation of error with P90 and P50 are close
Error comparison across seasons:• Standard Deviation of error is relatively higher for Spring 2015
than that of Summer 2015
Error comparison across OFFset periods:• Standard Deviation of error is relatively lower for OFF1 than
that of OFF4
Note: Please note that these comparisons are only based on a very limited dataset of model run. A larger dataset may be required for statistical significance.
Capacity Forecast Model – Error Statistics comparison
16
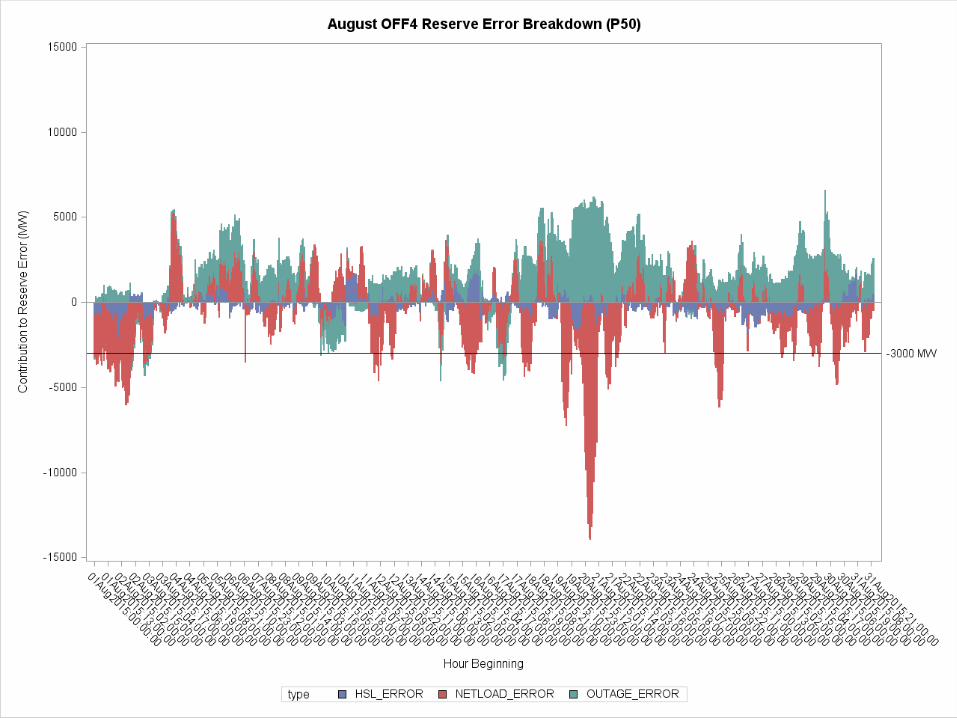
Capacity Forecast Model Reserves Error
Contributing Factors
ERCOT Public

17
Primary Factors contributing to Model Error:
Net Load Error:• Net of Load Forecasting Error and Wind Forecasting Error• Some negative correlation is observed between Load
Forecast Error and Wind Forecast
Outage Error:• Units recorded in Outage Scheduler as having outages are
actually online during the same period
HSL Error:• Telemetered HSL of units is different than the forecast HSL
Capacity Forecast Model – Error Contributing Factors
18

19

20
Capacity Forecast Model Reserves vs RTSPP Relation
ERCOT Public

21
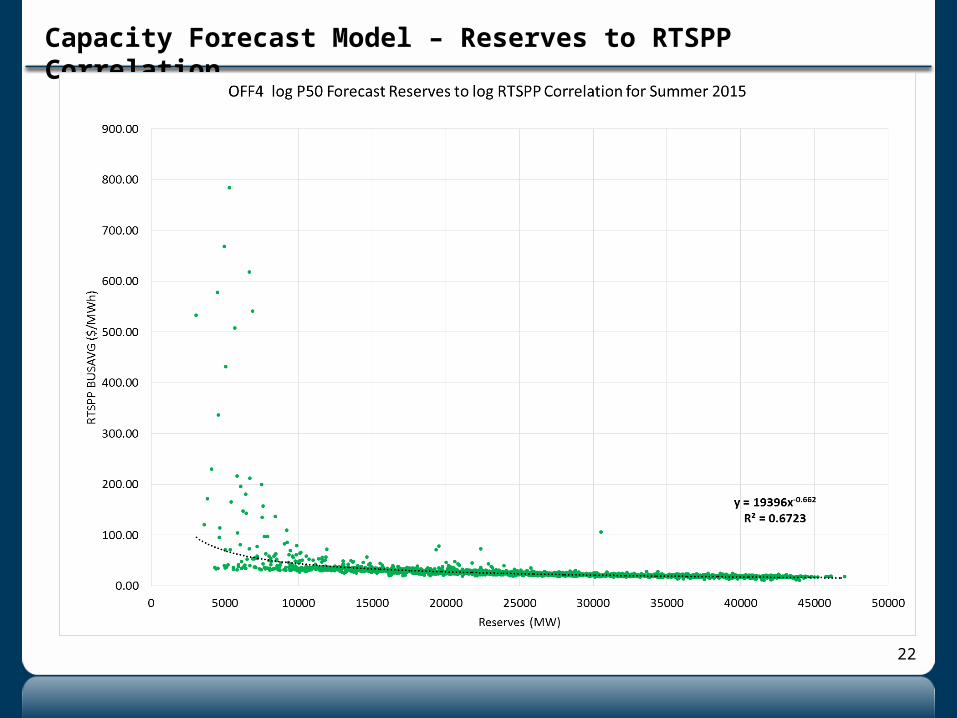
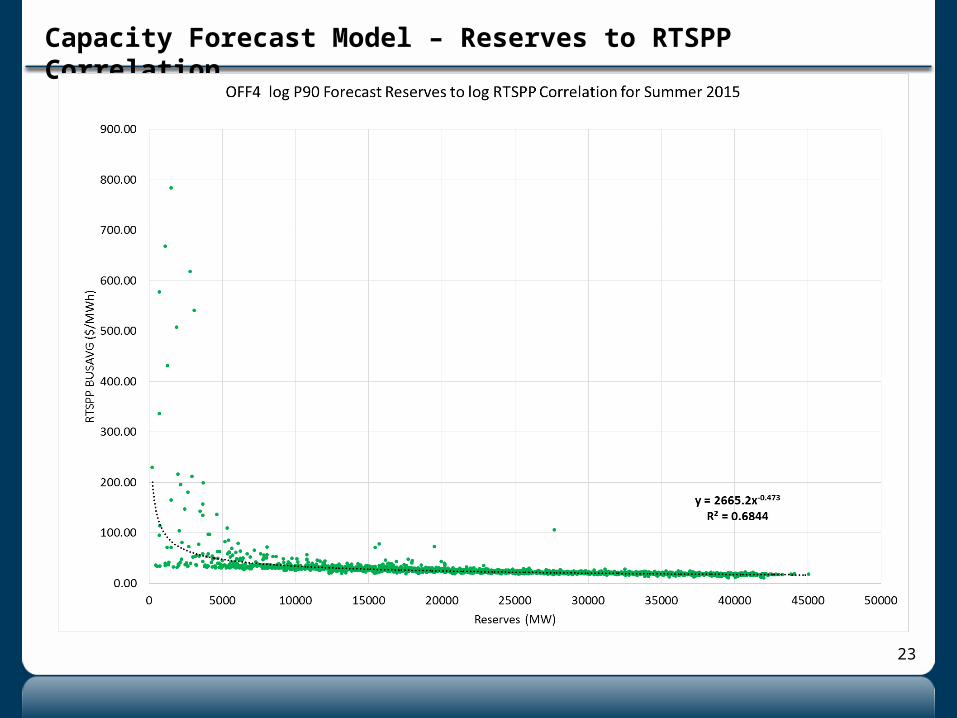
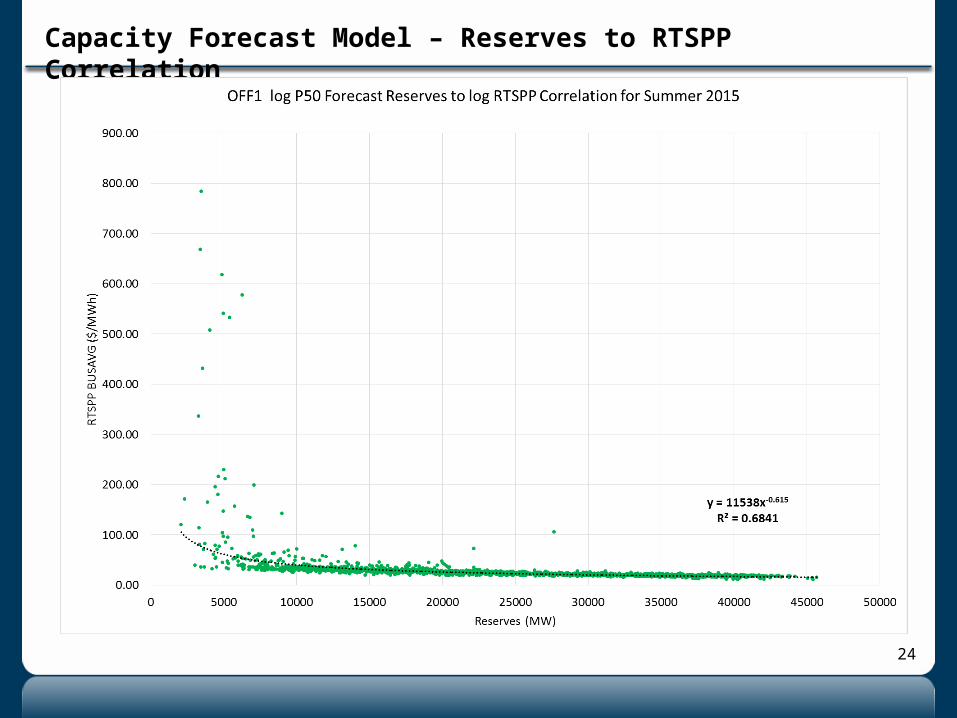
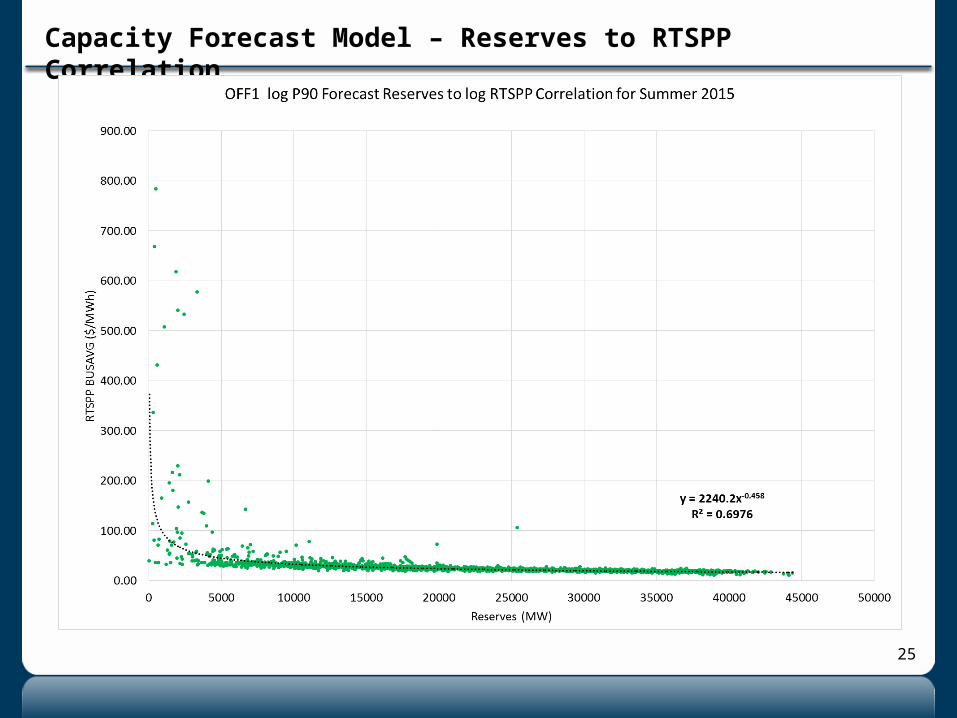
log Forecasted Reserves to log RTSPP Correlation:
Capacity Forecast Model – Reserves to RTSPP Correlation
Period OFF# Pxx R^2
Mar. 2015 - Aug. 2015
OFF1P50 44.2%
P90 44.4%
OFF4P50 38.0%
P90 38.7%
Spring 2015
OFF1P50 18.4%
P90 18.6%
OFF4P50 9.4%
P90 9.6%
Summer 2015
OFF1P50 68.4%
P90 69.8%
OFF4P50 67.2%
P90 68.4%
August 2015
OFF1P50 65.8%
P90 68.5%
OFF4P50 68.7%
P90 72.5%
22
Capacity Forecast Model – Reserves to RTSPP Correlation
23
Capacity Forecast Model – Reserves to RTSPP Correlation
24
Capacity Forecast Model – Reserves to RTSPP Correlation
25
Capacity Forecast Model – Reserves to RTSPP Correlation
26
Capacity Forecast Model
Results Summary
ERCOT Public
27
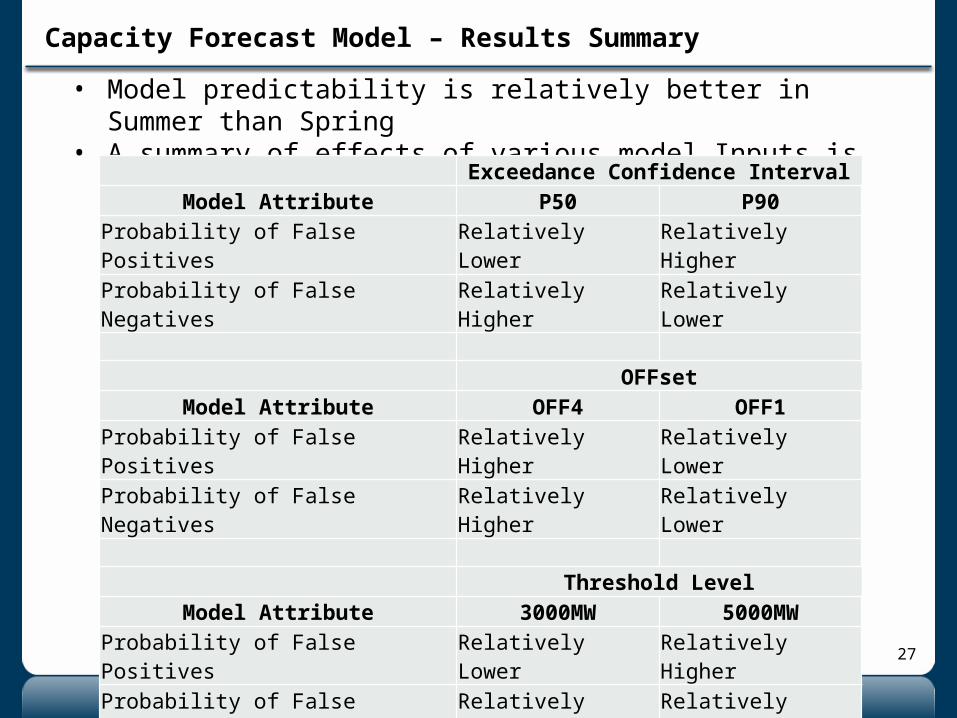
• Model predictability is relatively better in Summer than Spring• A summary of effects of various model Inputs is as follows;
Capacity Forecast Model – Results Summary
Exceedance Confidence IntervalModel Attribute P50 P90
Probability of False Positives Relatively Lower Relatively Higher
Probability of False Negatives Relatively Higher Relatively Lower
OFFsetModel Attribute OFF4 OFF1
Probability of False Positives Relatively Higher Relatively Lower
Probability of False Negatives Relatively Higher Relatively Lower
Threshold LevelModel Attribute 3000MW 5000MW
Probability of False Positives Relatively Lower Relatively Higher
Probability of False Negatives Relatively Higher Relatively Lower

28
• Correlation of Forecast Reserves to Actual Reserves is really strong in Summer and it is relatively weak in Spring
• Correlation of log Forecast Reserves to log HUBBUSAVG RTSPP is around 70%
• Capacity Forecast Model could be one of the potential options for reasonably predicting price risk
Capacity Forecast Model – Results Summary continued..
Note: Supplemental graphs/charts available in APPENDIX.

29
Questions

30
AppendixAdditional Graphs/Charts
31
Correlation of
Capacity Forecast Reserves to Actual Reserves
ERCOT Public
32
OFF4 P50 vs. Actual Reserves Correlation (Spring 2015)
33
OFF1 P50 vs. Actual Reserves Correlation (Spring 2015)
34
OFF4 P50 vs. Actual Reserves Correlation (August 2015)
35
OFF1 P50 vs. Actual Reserves Correlation (August 2015)
Top Related