


Languages
Pages
Legal


C. LINKS BETWEEN OSTEOPOROSIS AND CORONARY HEART DISEASE
1. Epidemiology of osteoporosis and coronary heart disease
a. Overview
Cardiovascular disease and osteoporosis are major causes of morbidity in
postmenopausal women and men. Both diseases were considered as unrelated
diseases concomitantly occurring to aging process. One of common features of
atherosclerotic plaques, calcification, have demonstrated similar regulatory mechanisms
observed in bone metabolism (Tanimura, 1983; Fitzpatrick, 1994; Bostrom, 1993).
Virchow R (1863) first described calcium deposits in the coronary arteries
(Virchow, 1863). Coronary calcification is present in the majority of patients with CAD,
and significantly related to in the significant coronary artery lesions (Agatston, 1990;
Raggi, 2001). There are a number of biochemical, molecular similarities between
osteoporosis and atherosclerosis. Hydroxyapatite, a component of calcium deposits in
atherosclerotic plaque is also found in bone mass (Anderson, 1983). Matrix vesicles in
bone have been found in atherosclerotic lesions (Tanimura, 1983), and calcified
plaques express several bone matrix related proteins involving in the bone
mineralization; matrix Gla protein (MGP), osteopontin, osteocalcin, and bone
morphogenetic protein type 2 (Bostrom, 1993 ; Giachelli, 1995 ; Severson, 1995 ; Bini,
1999 ). Phosphatases and calcium binding phospholipids in matrix vesicles are found in
both of two sites (Jono et al., 2000).
Several epidemiological studies have supported molecular studies that both low
bone mass and increased osteoporotic fracture risks are associated with atherosclerotic
calcification (Fujita, 1984;Ouchi, 1993; Byers 2001) or cardiovascular mortality
(Browner, 1993;Browner, 1991; von der Recke 1999). However, there were no
consistent results on relationship between cardiovascular mortality, cardiovascular
126
disease, or aortic/coronary calcification and osteoporosis. In some studies, investigators
have suggested the observed association merely as an aging related process (Frye
1992; Anderson, 1964; Barengolts 1998; Vogt, 1997), whereas others have supported a
causal relationship (Browner, 1993; von der Recke 1999; Barengolts, 1993).
Furthermore, only few studies performed on male population due to uncertain etiologic
mechanisms or low prevalence of male osteoporosis. Table 8 to Table 10 summarized
the epidemiological studies on the relationship between osteoporosis and
cardiovascular diseases.
b. Low bone mass, fracture and cardiovascular disease / mortality
The correlation studies between low bone mass and cardiovascular mortality
demonstrated increased risk of cardiovascular mortality in postmenopausal women. 1
standard deviation (SD) decrease of radius BMD was related to 19% increase in all
mortality meanwhile was related to 74 % increase in deaths caused by stroke during 2.8
years of follow-up. In this same population (Study of Osteoporotic Fracture; SOF), Kado
et al. (2000) also showed that bone loss on hip and heel were significantly correlated to
the risk of atherosclerosis, and CHD mortality. Each standard deviation (0.006
g/cm2/year) increase in calcaneal BMD loss was associated with a 1.3 times (95% CI,
1.1-1.4) increase in total mortality independent of age, baseline BMD, diabetes,
hypertension, incident fractures, smoking, physical activity, health status, weight loss,
and calcium use. In particular, hip BMD loss was associated with increased mortality
from coronary heart disease (relative hazard [RH] = 1.3 per SD; 95% CI, 1.0-1.8) and
pulmonary diseases (RH = 1.6 per SD; 95% CI, 1.1-2.5) (Kado et al., 2000)
.
These investigators found that bone loss is related to the prevalence of
hypertension. Similarly other study (von der Recke, 1999) demonstrated that prevalence
of vertebral compression was related to increased CHD death. In early
postmenopausal women, one SD decrease of bone mass content was significantly
related to increased risk of total mortality (RR=1.4), and cardiovascular mortality
127

(RR=2.3). Interestingly, a vertebral compression of women was associated with
increased risk of CVD death. Postmenopausal women with lower BMD at total hip,
lumbar spine showed a higher risk of carotid intimal thickness (Uyama, 1997), and
higher risk of stroke (OR=4.8) compared to highest quartile of BMD group.
However, there are a few inconsistent study results performed on men in regard
to low bone mass and cardiovascular disease. In a small sample of men, Laroche M et
al. (1994) presented that BMC in affected leg with ischaemic atherosclerotic disease
showed significantly lower mean BMC compared to other unaffected leg (p-value =
0.003). Recent case control study including 30 men (case) failed to support the
relationship between BMD at the femoral neck and stroke risk in men (Jorgensen,
2001). Meanwhile, women consistently showed significant association of the risk of
stroke in low BMD groups compared to high BMD group in this study population.
c. Bone mass, bone loss and CAD
A number of studies investigated the association of bone mass with coronary
artery disease (Uyama et al., 1997; Browner et al., 1993). Cross-sectional studies
showed that BMD in the total body, lumbar spinal, or proximal femurs was significantly
related to cardiovascular disease event, and sulclinical CAD measurement. A study of
postemenopausal Japanese women (mean age, 73 years) showed that low total BMD
was significantly correlated with greater carotid plaque thickness (r=0.55, p<0.01)
independent of age, total cholesterol (Uyama et a., 1997). Browner et al. (1993)
measured the relationship of distal radius and calcaneus BMD and incidence and death
from stroke in postmenopausal women. Mortality ratio of stroke was 30% (95%CI, 1.03-
1.65) increase in each 0.09 g/cm2 of calcaneus BMD. They showed this relationship
was not related to systolic blood pressure, alcohol, and presence of diabetes.
In recent large cohort studies in men, Johansson and colleagues demonstrated
an association between bone health and mortality in 850 men and 1074 women. BMD
128

was measured in the calcaneus, and analyzed in the relationship to all cause mortality.
They reported a 19% decrease in all cause mortality per 1 SD increase of BMD in men
(HR=0.81; 95%CI 0.71-0.91) adjusting for BMI, age, blood pressure, and lipid levels.
Study from UK reported that low bone density at the hip was a significant predictor of
cardiovascular mortality in 1002 elderly men (Trivedi et al., 2001). They followed up the
men at the average of 6.7 years to look at the relationship between BMD and mortality.
Unadjusted or adjusted BMD for age, BMD, smoking, serum cholesterol, systolic blood
pressure, previous CVD event showed similar significant that 30% reduction of CVD
mortality per 1SD increase of BMD. Low BMD at the hip was reported to be a significant
predictor for CVD and all cause mortality.
d. Relationship of bone metabolism to coronary or aortic calcification
Focused researches in coronary and aortic calcification might give more depth in
insight of causal relationship between bone metabolism and atherosclerosis. However,
most studies were performed on pre- or postmenopausal women. A significant negative
correlation of coronary calcification measured by electron beam computed tomography
(EBT) with bone density has been demonstrated in postmenopausal women, and in
eldely men (Frye, 1992; Barengolts, 1998; Kiel, 2000). Barengolts EI et al. (1998)
studied the estrogen deficiency and its association to osteoporosis and coronary
atherosclerosis in 45 postmenopausal women. They found that calcium score was
significantly higher in the osteoporosis group than other osteopenia or control groups.
Recently Framingham offspring study group reported that aortic calcification was
inversely correlated with BMD at the lumbar spine (p=0.04) with the Framingham
multivariable risk algorithm for cardiovascular disease in women (Kiel et al., 2001). With
lateral lumbar spin and hand radiographs during 25 years of follow-up, investigators
showed that significant association between annual percent change of metacarpal
relative cortical area (MCA) and changes in aortic calcification (p=0.05) in women.
However, the association between absolute changes of MCA and bone loss quartile in
men was not significant (Kiel et al., 2001).
129

Research groups from Netherlands investigated a population based longitudinal
study composed of 236 postmenopausal women. They also studied the cross-sectional
association, and found only significant inverse cross-sectional association between the
prevalent of aortic calcification and metacarpal bone density in the 720 postmenopausal
women (Hak, 2000). Others, conversely, demonstrated no statistical significant
relationship (Aoyagi, 2000; Vogt, 1997). Vogt, and her colleagues did not confirm
significant relationship between the presence of aortic calcification and BMD at the hip,
spine, calcaneus, proximal, and distal radius. They found that the presence of calcified
arterial plaques was related to low BMD (p<0.001). However the significance was not
found after adjustment for age.
In addition to epidemiologic evidences, recent molecular studies strongly support
that the calcification associated with atheroaclerosis is an active, highly organized
process similar to that of bone metabolism. There are a few of interesting hypotheses
for exploring the association between bone metabolism and calcified atherosclertic
arteries with inter-linking roles of several bone matrix proteins. The possible etiologic
mechanisms are estrogen deficiency and inflammation (Barengolts EI et al., 1998;
Fitzpatick LA et al., 1996), oxidation, and oxidized lipids (Parhami F et al., 1998),
aberrant calcium and vitamin D metabolism (Moon J et al., 1992; Watson KE et al.,
1997). Alternatively, osteoporosis and atherosclerosis may be related via mediated
genetic mutations or gene variants, such as Apolipoprotein (Apo) E variants.
130

Table 8. Summary of Epidemiological Studies of Osteoporosis (BMD, bone loss) and aortic/coronary calcification
Investigators Design Population Age Bone Endpoint Findings Comments Aoyagi, K et al. 2000 (abstract)
Cross-sectional
JA, women (524)
Distal, proximal radius, andcalcaneous
Aortic calcification (AC) presence (radiography)
NS, Related to age, SBP, physical activity
Vogt, M et al. 1997
Cross-sectional
CA, women(2051)
Mean ~ 65 years
Study of Osteoporotic Fracture
Hip, spine,calcaneous (DXA)
Aortic calcification (AC) (radiography)
NS at any sites. Presence ofcalcification related to age, smoking, SBP, coffe, central obesity, DM
Estrogen use was protective for AC.
Elisabeth Hak A, et al. 2000 (The Netherlands)
Longitudinal /cross-sectional
CA, 9 years follow- up in premenopausal (236), postmenopausal (720) women
Baseline 49 years, follow-up 9 years in 236 women, ~ 63 years in 720women
Metacarpal cortical area(MCA), relative cortical area (RCA)
Metacarpal of hands atbaseline andfollow-up (Radiogrammetry)
Aortic calcification (AC) in the abdominal aorta (Radiography) and baseline, and follow-up (paired comparison)
Longitudinal :Women wiaverage bone loss (RCA, MCA) were significantly related to progression of AC compared to non-progression AC groups (p<0.01)
th
Bone loss, and progression of aortic calcification during menopause
Barengolts, EI et al. 1998
Cross-sectional
CA, healthypostmenopausal women (45)
Mean ~ 66 years
Hip(total hip,femoral neck, Ward), Lumbar (L2-L4) (DXA)
Coronary calcification (EBT )
Correlation coefficient = -0.34 ( p<0.05) at the hip; Osteoporosis had higher calciumscore ( p< 0.025)
NS in serum cholesterol, calcium, phosphorus level
Frye MA et al. 1992
Cross sectional
CA, 200 women Vertebral fracture
Aortic calcification (AC)
AC was positively correlated withvertebral fracture, and negativelycorrelated to BMD at lumbar spine ( p< 0.05, respectively)
Adjusting for age, 25(OH) vitamin D had negative correlation to AC.
133

Table 9. Summary of Epidemiological Studies of Osteoporosis (BMD, bone loss) and cardiovascular disease
Investigators Design Population Age Bone Endpoint Findings Comments Uyama O et al. 1997 (Japan)
Cross-sectional
JN, postmenopausal women (30)
Mean~ 73 years
Total body BMD, lumbar spine (L2-L4) (DXA)
Carotid atherosclerosis (intimal thickness using carotid B-mode imaging)
Total BMD were correlated to high plaque score (r=0.549, p<0.01); low total BMD is significant predictor of plaques score
Age, and total cholesterol were related to carotid plaques score.
Jørgensen, L et al. 2001 (Norway)
Case-control (historical case)
CA, men (30) & women (33) to control (188)
Mean ~ 75 years
Proximal femurs, femoral neck (DXA) at 6 days after the onset of stroke
Stroke In women, the lowest quartile of BMD group had higher of Stroke (OR 4.8) and significant trend (p < 0.003)
Browner, WS et al. 1993
Longitudinal CA, 1.98 years follow-up in 4024 women (SOF)
Baseline 65 years
Distal radius,proximal radius, calcaneus (DPA)
Incidence and death fromstroke (n=83)
Hazard ratio(1.3 ) per 0.09 g/cm2 ofcalcaneus BMDdifference (95% 1.03-1.65); significant even after adjustment of SBP, alchol, Diabetes, and others
History of diabetes, Mini-mental state examination score (<=23), No of functional disabilities, current alcohol use were related to incident of stroke
Trivedi et al. 2001 UK, TheCambridge General Practice Health Study
Mean follow-up 6.7 years
Cohort CA, 1002 men
Aged 65-76 years
total hip, neck, trochanter, intertrochanter (DXA), quartile of total hip BMD
All cause death (n=155), and death fromcardiovascular disease (n=98)
Highest quartile of BMD group had higher mean BMI, cholesterol. 1SD increase in BMD related to 24%reduction in CVD mortality (RR;0.51 for highest vs lowest); adjusted HR (HR=0.72; 95% 0.56-0.93)
Low BMD at the hip was strong predictor of CVD and all cause mortality. Smoking, good general health, alcohol intake
134

Table 10. Summary of Epidemiological Studies of Osteoporosis (BMD, bone loss) and cardiovascular mortality
Authors Design Population Age Bone Endpoint Findings Comments Kado DM, et al. 2000
Cohort CA, 5.7 years of follow-up postmenopausal women (6046) (SOF)
Mean ~ 65 years
Changes ofcalcaneal BMD during 5.7years (SPA), and total hip BMD during 3.5 years (DXA) – quartile of bone loss
All causemortality (CHD, stroke, atherosclerosis, cancer, others)
Loss of hip BMD were related to all cause and CHD mortality (RH=1.3) Bone loss at the heel were associated with risk of atherosclerosis (RH=1.2), CHD (RH =1.3), and all cause mortality (RH= 1.1)
Significant correlation between age, hypertension, smoking, health status at both heel, and hip site except fracture with only hip. Physical activity, and calcium was protective at hip loss
Von der Recke P et al. 1999 (Denmark)
Cohort CA, 5216woman-years of follow-up in early postmenopausal ( 309), later postmenopausal women (754)
Mean ~ 50 years forearly; ~ 70 years forlater postmenopausal women
Bone mineral content (BMC) of Distalforearm (SPA);
Cardiovascular mortality based on ICD-9 code
Lateral spine, vertebral fracture (Radiography)
In earlypostmenopausal group, one SD decrease of BMC was associated with 43% increase in total mortality (RR=1.4)and 130% increase in cardiovascular mortality (RR=2.3);
Smoking related to all cause of death; SBP related to CVD death. A vertebral compression is related increase of CVD death
Johansson C et al. 1998 (Sweden)
Prospective, mean follow-up 7 years
CA, 850 men and 1074 women Three agegroups (70;75;79)
Mean ~74 years (men), 75 years(women)
BMD at the right calcaneus (DPA)
All causemortality
Sig. proportionalHazards for all cause mortality among BMD in men (RR=0.81) and women (RR=0.84) BMD is significant predictor of CHD, stroke
Smoking related to DM, CVD, stroke
135

2. Role of Mediator proteins in Bone Mineralization and Coronary Calcification
Molecular studies of vascular calcification have demonstrated the similar
underlying mechanisms as bone formation. Matrix vesicles (Kim 1976), bone
morphogenetic proteins (BMPs) (Bostrom et al., 1993), osteopontin (Giachelli et al.,
1993), osteocalcin (Shanahan et al., 1994), alpha2-HS-glycoprotein (Keeley and Sitarz,
1985), collagen type I are detected in vascular calcification lesions. In addition, cells
with potential for differentiating into osteoblastic like cells have been identified in
calcified arterial and vascular lesions (O’Brien et al., 1995; Giachelli et al. 1993). The
presences of these regulatory factors have been indicated that the vascular calcification
might be an actively regulated process not a passive mechanism.
Using mouse models, which do not express specific proteins involved in bone
metabolism, the role of these regulatory molecules in mineralization has been
determined. Genetically modified mice in deficient of matrix Gla protein (Luo et al.,
1997), or osteoprotegerin (Bucay et al.,1998) have developed significant amount of
vascular calcifications suggesting that these proteins might play some inhibitory role in
formation of vascular calcification. Osteocalcin null mice were shown to have an
increased bone density, which suggest inhibitory effect of osteocalcin on mineralization.
Other possible proteins including vitamin K-dependent bone protein, bone
morphogenetic protein-2a (Bostrom K et al., 1994), osteophytes (Reid et al., 1991), in
the relationship between calcification of atherosclerosis and osteoporosis had been
researched. Briefly non-collagenous bone proteins in vascular calcification lesions were
summarized in Table.
In this review, we will focus two potential inhibitors of vascular calcification (MGP,
and osteopontin). These two proteins are most extensively investigated in connection
between bone mineralization and vascular calcification.
136

a. Matrix gamma-carboxyglutamic acid protein (MGP)
1) Genomic organization, and protein function
MGP is a small matrix protein originally isolated from bone (Price and Williamson
1985). It contains gamma-carboxylated glutamates (GLA)-residues modified vitamin K-
dependent gamma-glutamy carboxylse (Furie and Furie, 1997). MGP gene is located in
human chromosome 12p, and it spans through 3.9 kb containing 4 exons (Cancela et
al., 1990). The MGP gene has a number of regulatory sequences especially binding
sties for retinoic acid and vitamin D receptors (Cancela et al. 1990) Vitamin D
upregulates MGP expression in the osteoblasts, and chondrocytes (Barone et al.,
1991), and retinoic acid down-regulates expression of MGP (Sheikh et al., 1993). MGP
transcription was also downregulated by transforming growth factor β in rat vascular
smooth muscle cells. On the other hand, MGP was up-regulated by cyclic AMP (cAMP)
dependent pathway (Farzaneh-Far et al., 2001). MGP has been detected in the heart,
lung, and kidney, but bone contains 40 to 500 fold higher MGP level than any other
tissues (Fraser and Price, 1988). MGP is an extracellular mineral binding protein
synthesized by vascular smooth muscle cells (VSMCs) and chondrocytes.
MGP has a high affinity for calcium ions, and hydroxyapatite crystals (Price et al.,
1985). MGP mRNA is present in calcified plaques (Shanahan et al., 1994), and in vitro
vascular calcifying cell cultures (Mori et al., 1998; Watson et al., 1994; Tintutt et al.,
1998; Proudfoot et al., 1998). In an early study by Urist et al (1984), MGP was related to
bone morphogenetic proteins (BMPs) during the osteoinduction and cell differentiation.
MGP binds to BMP-2, which is expressed in human atherosclerotic lesions (Bostrom et
al., 1993). Studies showed that BMP-2 had potential to initiate bone formation and
stimulate the osteoclast differentiation through IL-6.
137

2) Results of MGP knockout mouse
MGP-deficient mouse showed that chondrocyte-like cells produce cartilage
matrix progressing to the calcification (Luo et al., 1997). The MGP mRNA and protein
are found in macrophages and in vascular smooth muscle cells present in
atherosclerotic plaques. MGP is not merely transported via blood stream, but rather
MGP is produced locally in the plaques acting as a mineralization inhibitor. MGP knock
out mice showed aberrant vascular cell differentiation. The entire vascular media were
replaced by chondrocyte-like cells, which progressively produce calcified cartilage
matrix from the birth (Luo et al., 1997). These mice also exhibited inappropriate
calcification in proliferating chondrocytes and no differentiation into mature, hypertrophic
chondrocytes. Knock-out mice poorly developed long bones, and showed osteopenia.
Extensive calcification of the aorta results in death within 8 weeks after birth due to
rupture of the thoracic and abdominal aorta (Luo et al., 1997). Another model for MGP
and its’ related mechanism in vascular calcification was developed by Price et al (1998).
Warfarin is an anti-coagulant agent inhibiting vitamin K-dependent gamma-
carboxylation. Inhibition of gamma-glutamyl carboxylation results in production of under-
carboxylated MGP in extra-hepatic tissues such as the aortic vessel wall. Warfarin
treated rats developed focal calcification of major arteries and aortic valves, which might
be related to the results of inactive (undercarboxylated) MGP protein. Price et al. (2001)
demonstrated that MGP administration on warfarin or high dose of vitamin D treated
mice could inhibit the initiation of vascular calcifcation.
3) Relationship to mineralization and vascular calcification
Matrix Gla proteins are expressed by smooth muscle cells in normal arteries, but
at higher levels in atherosclerotic arteries. Shanahan and colleagues demonstrated that
the synthesis of MGP mRNA was upregulated in calcified atherosclerotic plaques. MGP
was expressed by human medial vascular smooth muscle cells (Shanahan et al., 1994).
Spronk et al. (2001) showed the occurrence of MGP protein at low levels in healthy
human arterial wall. They also demonstrated that substantial accumulation of MGP at
138
sites of vascular calcification in consistency with previous studies. Up-regulated
expression of MGP or less susceptible MGP in calcified plaque was associated with
coronary calcification not like bone mineralization. In addition, several researches
suggest that MGP is related to an adaptive response to prevent calcification (Shinke et
al., 1999; Yagami et al., 1999). MGP may affect calcification through effects on cell
differentiation (Yagami et al., 1999). MGP in chodrocyte mineralization was dependent
on cell-stage affecting mineralization in hypertrophic chondrocytes during bone
mineralization, but not in proliferative ones. Moreover, over-expressive MGP delayed
chondrocyte maturation and blocked endochondral ossification. MGP expression is
inversely correlated with bovine vascular muscle cell calcification (Mori, et al., 1994).
However, MGP expression is increased rather than decreased in calcified
atherosclerotic lesions (Shanahan et al., 1994) and in human medial calcification. In
vitro studies, increased MGP levels is also detected in cultured calcifying cells
(Proudfoot et al., 1998).
There are still lack of evidences how MGP performs its calcification inhibitory
action. However, a few hypotheses were recently postulated (Bostrom et al, 2000;
Spronk et al., 2001). Bostrom proposed that MGP may act as complexes to bone
morphogenetic proteins (BMPs). BMP binding with insoluble MGP have significantly
reduced activity. In vitro studies, MGP forms a complex with BMP-2 and it significantly
modulates BMP activity in cell culture (Wallin et al., 2000; Bostrom et al., 2001). In
addition, undercarboxylation of MGP may play a role in binding to BMP during vitamin K
deficiency. BMP-2 is expressed in both normal and calcified vessels ( Gla residues have
a high affinity for hydroxyapatite, and are found in lipid rich areas of plaque.
Decarboxylation of Gla residues reduces the affinity of MGP for binding precipitated
calcium. Atherosclerotic arteries have only 30% the γ-glutamate carboxylase activity of
normal arteries, resulting in greater Gla binding in atherosclerotic lesions
(Deboervanderberg et al., 1986; Engelse et al., 2001). Undercarboxylated MGP has low
affinity for BMP than has carboxylated MGP (Spronk et al., 2001). Thus, rendering un-
bound BMP may lead to cascade of induction of osteoblast-like differentiation (Wallin et
al., 2001).
139

b. Osteopontin
1) Genomic organization, and protein function
Osteopontin is an extracellular matrix phosphorylated glycoprotein of bone, and it
mediated the cell attachment to matrix. Osteopontin contains RGD (Arg-Gly-Asn) amino
acid residue that enables to bind calcium and cell attachment. It has been known as
mineralization inhibitor in vitro. The gene of osteopontin is located on chromosome
4q21, and spans 8.2 kb consisting of 7 exons, multiple alleles. The transcription
product of gene is approximately 60 to 75 kDa, and its polyaspartyl stretches without
disulfide bonds. It glycosylates and phosphorylated with RGD residue locates near N-
terminal. Functions of osteopontin are: 1) binds Ca2+, 2) facilitates bone resorption by
binding of osteoclasts to hydroxyapatites, 3) inhibits mineralization, 4) may regulate
proliferation, 5) inhibits nitric oxide synthase, 6) may regulate resistance to viral
infection, 7) may regulate tissue repair, 8) may play a role in osteoblastic maturation.
Osteopontin is synthesized in osteoblasts, or osteoprogenitors. (ref) Osteopontin is also
expressed by macrophages in the intima of human artery. Smooth muscle cell-derived
foam cells express osteopontin mRNA. The predominant cell type in areas of
calcification is macrophage-derived foam cell, and their expression of osteopontin is
greater than smooth muscle cells.
The functional role of osteopontin in vessel wall calcification is still unclear. Shioi
and colleagues (1995) have found osteopontin mRNA in calcified bovine vascular
muscle cell cultures. In calcified human vasulcar smooth muscle cells, only low levels of
osteopontin mRNA not osteopontin protein was detected (Proudfoot et al., 1998).
Osteopontin mRNA expression is related to the severity of atherosclerosis (Hirota, et al
1993). Giachellie and colleagues showed that levels of osteopontin and its mRNA were
low in normal rat aorta and carotid arteries, but rose after injury (1993). Osteopontin
was present in developing osteoblast-like vascular calcifying cells with stimulating
factors such as TGF β1 or cAMP (Watson et al., 1994; Tintutt et al., 1998). Osteopontin
140

is found in foci of arteries with atherosclerosis, and concentrated at the margins of
plaques (Fitzpatrick, 1994). Substances related to inflammation, such as fibroblast
growth factor, transforming growth factor-β, and angiotensin II caused elevated levels of
osteopontin in arteries.
2) Results of osteopontin knockout mouse
The role of osteopontin in vivo has been demonstrated in genetically altered
mouse models. Knockout mice showed decreased expression of osteopontin on bone
resulting in slightly reduced calcium crystal size, and slightly increased mineral content.
In an in Vitro study, Wada et al. (1999) found that osteopontin inhibits bovine vascular
calcification, suggesting that osteopontin at sites of heterotopic calcification may
represent an adaptation to limit calcification. In addition, high levels of osteopontin
mRNA were expressed in macrophages related with human atherosclerotic plaques
only but not in normal vessel walls (Shanahan et al., 1994). Proudfoot (1998) reported
that macrophage derived osteopontin bind to macrophage and smooth muscle cells to
preformed hydroxyapatite, and it serve as a glue.
3) Relationship to vascular calcification
Osteopontin in vessel wall calcification is still unclear. Jono and colleagues
(2000) and others suggested that the inhibitory effect of osteopontin based on the
extent of phosphorylation. The capability of osteopontin to inhibit calcification depended
on post-translational phosphorlyational modifications in human smooth muscle cell
cultures. The phosphorylated osteopontin inhibited the calcification of human smooth
muscle cell culture as effectively as native osteopontin.
Proposed comparative roles of bone related proteins in atherogenesis are summarized
in Table 11.
141

Table 11. Proposed comparative roles of bone related protein - in vivo/in vitro studies in bone metabolism and atherogenesis
Protein /mRNA (abbreviations)
Bone metabolism Atherogensis (calcification) Reference
Osteocalcin (OC) regulate activity of osteoclasts and their precursor cells, and the turning point between bone formation and resorption by increased levels regulate mineral maturation during bone formation expressed by differentiated osteoblast
Gla residues capable of binding hydroxyapatite higher levels of osteocalcin or elevated expression of osteocalcin in calcified aortas Enter the calcified plaque through blood circulation
Fleet, 1994 Shanahan, 1997 Levy, 1993
Osteoprotegerin (OPG) Osteoclastogenesis inhibition factor
Possible inhibitor of calcification, prevention of onset of calcification
Bucay, 1998 Min, 2000
Osteopontin (OPN) Increase bone resorption by binding osteoclasts to hydroxyapatite correlate to the appearance of mineral anchor OC to bone (support cell attachment) - bind Ca2+ with high affinity - highly expressed by osteoclast,
Inhibitor of hydroxyapatitenucleation in vitro
Wada, 1999
Inhibiting the binding of adhesion molecule binding cell to apatite / crystal growth Promoting macrophage adhesion
Giachelli, 1998
Matrix Gla protein (MGP) - Find in cartilage metabolism - Inhibit the mineralization (endochondral calcification)
Inhibitor of calcification Bind hydroxyapatite with Gla residue Warfarin related inhibition of Gla formation leading to calcification
Luo, 1997 Price, 1998 Shanahan, 1998
Collagen type I Most abundant protein in bone matrix Nucleate hydroxyapatite deposition with other proteins
Act as a nucleator Rekhter, 1993 Watson, 1998
Bone sialoprotein (BSP) Bind to Ca2+ with high affinity Initiate mineralization
Act as a nucleator Hunter, 1993 Gorski, 1998
Osteonectin (ON) Bone mineralization Bind to growth factor
High affinity for apatite and collagen (inhibitor)
Srivata, 1997
alpha2-HS-glycoprotein (AHSG)
Noncollagenous protein, -influence recruitmen of osteoclastic precursors - modulate bone resorption
Systemic serum inhibitor of calcification - Bind to hydroxyapatite
Keeley, 1985 Colclasure, 1988
Bone morphogenicprotein(BMP-2)
Promotors of chondrogenesis and bone formation
Osteogenic differentiation factor in vascular lesions
Bostrom,, 1993
142

3. Hypothesized etiologic mechanisms between two diseases
a. Estrogen and inflammation: Link between osteoporosis and coronary calcification
1) Introduction
The pathogenesis of atherosclerosis involves inflammatory processes that render
plaques vulnerable to thrombosis (Ross 1995). Gender difference in morbidity and
mortality of CVD has been hypothesized by estrogen protection theory. Even though the
association between endogeous estrogen and cardiovascular risk has not yet been
completely established, many cohort studies of estrogen therapy have demonstrated a
potential benefit of estrogen on cardiovascular disease (Phillips et al., 1997; Barrett-
Connor and Goodman-Gruen, 1995). Pre-menopausal women seem to be protected
against CVD. Thus, estrogen deficiency has been regarded as a common denominator
to both of coronary artery disease (CAD) and osteoporosis in postmenopausal women
(Fitzpatrick 1996). We will review the relationship between estrogen and its’ effects on
cardiovascular disease, specifically on inflammation markers (C-reactive protein), and
vascular calcification among related literatures. As reviewed in previous section,
investigations on the role of estrogen on male skeleton and bone loss accelerated the
understanding of male osteoporosis. Therefore, we will expand the estrogen theory to
link osteoporosis and cardiovascular disease in men.
2) Estrogen on atherosclerosis – Protective effects on lipids
Estrogen seems to be protective for vascular system, but there still needs to be
explored in detail (Table 12). Incidence of coronary atherosclerosis in premenopausal
women is half that observed in age-matched men. Contrastingly postmenopausal
women showed sharply increased incidence of cardiovascular disease after estrogen
withdrawal. Most cross-sectional studies including one large randomized clinical trials
143
indicated that estrogens are associated with lower risk of cardiovascular disease in
women (Espeland et al., 1998; Stampfer et al., 1991; Psat et al., 1993). Potential
benefits of estrogen include protection of LDL from oxidation (Sak et al. 1994),
potentiation of fibrinolysis (Koh et al., 1997), and improvement in endothelium-
dependent vasodilator function due to increased nitric oxide (Gilligan et al., 1994;
Lieberman et al., 1994; Guetta et al., 1997).
Animal studies about estrogen revealed that estrogens have anti-oxidant role in
oxidation of LDL-c. Minimally modified (oxidized) LDL (MM-LDL) into cell cultures
produce the monocyte colony stimulating factor (M-CSF), and monocyte
chemoattractant protein 1 (MCP-1), which is a potent inducer for osteoclastic
differentiation. MM-LDL also induces the expression of genes related to inflammation.
The some of the characteristics of modified LDL are following; 1) regulate the
expression of genes for macrophage colony stimulating factor (M-CSF) and monocyte
chemotactic protein, 2) injure the endothelium, 3) form cholesteryl ester rich
environment by the uptake of macrophages, 4) induce the expression of inflammatory
cytokines, e.g. interleukin-1, or interleukin-6. Oxidative modification of LDL cholesterol
plays a key role in atherogenesis.
Oxidized LDL acts as a chemo-attractant for T lymphocytes and monocytes. It
also facilitates the transport of macrophages within the subendothelium, enhances LDL
uptake by the macrophages, and promotes the formation of foam cells. Additionally,
oxidized LDL is directly cytotoxic to subendothelial and smooth muscle cells. As a
result of the oxidation of LDL, atherosclerotic lesions contain increased oxidative
products of artery wall cell. Formation of matrix with derived smooth muscle cells,
collagen and oxidized LDL can lead to the inflammation and fibroproliferative response
(Ross et al., 1999).
144

Table 12. Effects of Hormone Replacement Therapy/estrogen on cardiovascular risk factors, and
ahterosclerosis (Modified from Mosca L. Estrogen and ahterosclerosis. J Investig Med 1998;46:381-386)
Effects Estrogen actions
Lipoprotein LDL cholesterol
HDL cholesterol
HDL2 cholesterol
Apolipoprotein A-1
Lp (a) lipoprotein
⇓
↑
↑
↑
↓
Vascular Flow mediated vasodilation
Nitric oxide release from endothelial cells
Release of endothelium-derived constricting factor
Production of prostacyclin
Potassium conductance
Angiotensin II-induce vasoconstriction
↑
↑
↓
↑
↑
↓
Inflammation C-reactive protein (CRP) Fibrinogen
Alpha-1 acid glycoprotein
Albumin
Inflammatory cell adhesion molecules (ICAM)
↑?
↓
↓
↓
↑
Fribrinolysis Plasminogen activator inbitor-1 (PAI-1)
Plasmin-antiplasmin complex (PAP)
D-dimer
Tissue-type plasminogen activator (tPA)
↓
↑
↑
Procoagulation Factor VIIc
Fragment 1-2 ↑
↑
Other Plasma viscosity
Insulin sensitivity
Homocysteine level
Vascular smooth muscle cell proliferation /migration
↓
↑
↓
↓
In epidemiological studies, the effect of estrogen principally studied in relation to
serum lipid concentration. The effects of exogenous estrogen on lipid metabolism are
mainly associated with the hepatic expression of apoprotein genes such as
145

apolipoproteins A, B, D, and E. (Mendelsonhn and Karas, 1994). However, recent large,
randomized, controlled trial to examine the use of estrogen for secondary prevention of
CVD reported no beneficial effect (Hulley et al., 1998).
From animal, and clinical studies, effects of estrogen (E2, 17β-estradiol) on
cardiovascular systems are summarized as follows: increase HDLc, decrease LDLc,
prevent oxidative modification, decrease in expression of adhesion molecule from
vascular endothelial cell, decrease chemokines (MCP-1) involved in monocyte migration
into the subendothelial space, promote vasodilation mediated by NO, and alter
atherosclerotic vessel reactivity. TNF/IL-1 produced by activated macrophages in the
arterial intima down-regulate anticoaulant properties of endothelium (e.g. heparan
sulfate proteoglycans, thrombomodulin), and up-regulate procoagulant activity. These
cytokines may also promote intimal hyperplasia by inducing expression of platelet-
derived growth factor and by down-regulating expression of the constitutive nitric oxide
synthase in endothelial cells. E2 (17 beta estradiol) has antioxidant activity inhibiting
low-density lipoprotein oxidation in vivo and in vitro. Sacks et al (1994) measured the
oxidative modification of LDL-c after administrated of E2 through infusion (n=18) or
trandermal patches (n=12) in postmenopausal women. There were no significant
changes in lipid profiles, but the lag of LDL peroxidation was significantly delayed. This
study and others suggest that estrogen replacement therapy may less alter the lipid
profiles.
Few studies were conducted on the effects of estrogen against/for male
cardiovascular systems. Studies on estrogen resistant man, and aromatase deficient
men demonstrated the influence of estrogen on lipids, and cardiovascular system by
nature’s experiments (Sudhir et al.(a), 1997; Carani et al.,1997; Morishima et al., 1995;
Smith et al., 1994). In an estrogen resistant man, the serum levels of apolipoprotein A-I,
lipoprotein(a), VLDL-c, HDL-c, LDL-c and total cholesterol were low while serum level of
triglyceride was normal (Sudhir et al., 1997). Bagatell and Asscheman reported that low
HDL-c of this man might be explained by testosterone, which is known as the important
determinant of gender differences in serum HDL-c (Bagatell et al., 1994; Asscheman et
146

al.,1994). On the other hand, estrogen treatment on aromatase deficient men resulted in
an increase of HDL-c, and a decrease of triglycerides, LDL-c, and total cholesterols
(Carani et al., 1997). Therefore, studies will be still needed to differ the differences of
these two models (ERα deficient subject vs. aromatase deficient subject) these finding
suggest that an important role of estrogens on lipid profiles also in men. (Sudhir et al.
(a), 1997; Carani et al., 1997).
Exogenous estrogen is associated with: 1) reduced the levels of atherogenic
lipoproteins (higher HDL-c, and lower LDL-c), 2) markers of inflammation, 3) fibrinolysis
inhibition important in the pathogenesis of atherosclerosis, 4) inhibition of intimal cell
proliferation, 5) changes of vascular activity, and 6) inhibition of LDL oxidation.
3) Estrogen receptor mediated protection
Genomic influence of estrogen is mediated through estrogen receptors
expressed in various cells. Estrogen receptors have been identified in the human aorta,
internal carotid, and coronary arteries in women and men (Karas et al., 1994; Losordo
et al., 1994). They are also located on macrophages, smooth muscle cells, and
endothelial cells (Venkov et al., 1996). However, it is not still unclear whether estrogen
influences the potential function on arterial wall through estrogen receptors. To explain
inconsistent results of estrogen effect on cardiovascular system, the role and
expression levels of estrogen receptor in vascular cells were reported.
Neointima formation due to vascular injury is related to stenosis (DiMario et al.,
1995). However, there are inconsistent results for inhibitory effect of estrogen. Animal
models did not support that estrogen inhibit neointima formation. Estrogen only
influenced a transient decrease in arterial cell proliferation, but did not change
neointimal area. Moreover, estrogen treatment with a high fat diet resulted in
progression of atherosclerosis and did not alter the acute injury response in
atherosclerotic lesion (Geary et al., 1998; Adams et al., 1990). This repressed activity of
147

estrogen might be resulted from reduced number of estrogen receptor in atherosclerotic
vessels. Estrogen receptor α has been identified in coronary arteries, and cardiac
myocytes (Grohe et al., 1997; Lorsodo et al., 1994). Lorsodo and colleagues reported
that estrogen receptors have role of coronary athero-protection. They demonstrated that
estrogen receptor were detected more frequently in the coronary arteries of
premenopausal women who do not have atherosclerosis that those who have
atherosclerosis.
4) Estrogen and inflammation markers
Estrogen exerted antioxidant effect of estrogen through the inhibition of cytokine-
mediated E-selectin and VCAM-1 gene activation (Mauri et al 1993). In addition, Caulin-
Galser et al. reported that estrogen influence with estrogen receptor in vitro model. It
impact on inhibition of IL-1 mediated endothelial cell adhesion molecules (CAM)
transcription. Interaction between ligand-activated steroid hormone receptor (ER) and
genomic sequences (ERE: estrogen response element) showed negative effect on IL-1
mediated IL-6 gene activation, and positive regulatory effects on IL-1 mediated
endothelial E-selection induction. CAM expression (E-selectin, ICAM-1, VCAM-1) are
influenced by 5 prime-regulatory regions for estrogen (Table 13)
Four major inflammation-sensitive factors, C-reactive protein, von Wilebrand
factor (vWF), coagulation factor VIIIc, and soluble E-selectin have been related to future
risk of coronary heart disease in healthy men (Ridker et al., 1997), in postmenopausal
women (Hwang et al., 1997; Cushman et al., 1999), in elderly or in higher risk group
(smoker) (Kuller et al., 1996). Several data have been shown that inflammation
increased the risk of first myocardial infarction, stroke and venous thrombosis, and anti-
inflammatory therapy decreased the adverse events (Table 14).
148

Table 13. Cytokine, hormones, and growth factors, its relation to estrogen on bone
Cytokines/growth factors Estrogen Estrogen withdrawal
Stimulators of bone resorption
Interleukins – 1 (IL-1)
IL-6
IL-8
IL-11
Tumor necrosis factor (TNFs)
-TNF α
-receptor activator of NFκB ligand
(RANKL/OPGL/ODF)
-RANK
Epidermal growth factor (EGF)
Platelet-derived growth factor (PDGF)
Fibroblast growth factors (FGFs)
Macrophage-colony stimulating factor
(M-CSF)
Granulocyte/macrophage-colony stimulating
factor (GM-CSF)
Modulate( or ↓ ) production of
IL-1
IL-1 ⇒ ↓ IL-6 & ↑ of IL-6
soluble receptor (IL-6R)
Modulate( or ↓ ) production of
TNFα
↑ IL-1 synthesis & ↓ IL-
1 receptor antagonist
(IL-1ra)
↑? production of PDGF
↑? production of FGF
↑ production of M-CSF
↑ production
Inhibitors of bone resorption
Interferon-γ (IFN-γ )
Interleukin-4 (IL-4)
Osteoprotegerin (OPG/OCIF)
↑ mRNA, and protein of OPG
149
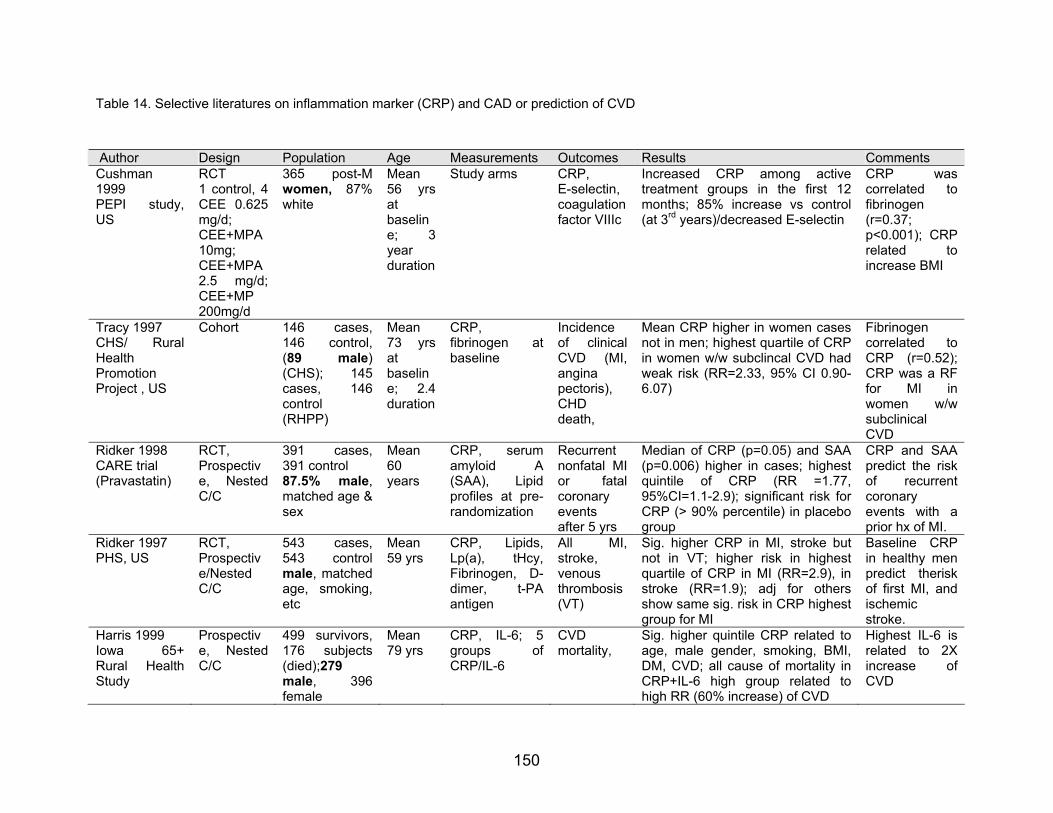
Table 14. Selective literatures on inflammation marker (CRP) and CAD or prediction of CVD
Author Design Population Age Measurements Outcomes Results Comments Cushman 1999 PEPI study, US
RCT 1 control, 4 CEE 0.625 mg/d; CEE+MPA 10mg; CEE+MPA 2.5 mg/d; CEE+MP 200mg/d
365 post-Mwomen, 87% white
Mean 56 yrs at baseline; 3 year duration
Study arms CRP, E-selectin, coagulation factor VIIIc
Increased CRP among active treatment groups in the first 12 months; 85% increase vs control (at 3rd years)/decreased E-selectin
CRP was correlated to fibrinogen (r=0.37; p<0.001); CRP related to increase BMI
Tracy 1997 CHS/ Rural Health Promotion Project , US
Cohort 146 cases,146 control, (89 male) (CHS); 145cases, 146control (RHPP)
Mean 73 yrs at baseline; 2.4 duration
CRP, fibrinogen at baseline
Incidence of clinical CVD (MI, angina pectoris), CHD death,
Mean CRP higher in women cases not in men; highest quartile of CRP in women w/w subclincal CVD had weak risk (RR=2.33, 95% CI 0.90-6.07)
Fibrinogen correlated to CRP (r=0.52); CRP was a RF for MI in women w/w subclinical CVD
Ridker 1998 CARE trial (Pravastatin)
RCT, Prospective, Nested C/C
391 cases,391 control
Mean 60 years 87.5% male,
matched age & sex
CRP, serum amyloid A(SAA), Lipid profiles at pre-randomization
Recurrent nonfatal MI or fatalcoronary events after 5 yrs
Median of CRP (p=0.05) and SAA (p=0.006) higher in cases; highest quintile of CRP (RR =1.77, 95%CI=1.1-2.9); significant risk for CRP (> 90% percentile) in placebo group
CRP and SAA predict the risk of recurrent coronary events with a prior hx of MI.
Ridker 1997 PHS, US
RCT, Prospective/Nested C/C
543 cases,543 controlmale, matched age, smoking, etc
Mean 59 yrs
CRP, Lipids, Lp(a), tHcy,Fibrinogen, D-dimer, t-PAantigen
All MI,stroke, venous thrombosis (VT)
Sig. higher CRP in MI, stroke but not in VT; higher risk in highest quartile of CRP in MI (RR=2.9), in stroke (RR=1.9); adj for others show same sig. risk in CRP highest group for MI
Baseline CRP in healthy men predict therisk of first MI, and ischemic stroke.
Harris 1999 Iowa 65+Rural Health Study
Prospective, Nested C/C
499 survivors, 176 subjects (died);279 male, 396 female
Mean 79 yrs
CRP, IL-6; 5 groups ofCRP/IL-6
CVD mortality,
Sig. higher quintile CRP related to age, male gender, smoking, BMI, DM, CVD; all cause of mortality in CRP+IL-6 high group related to high RR (60% increase) of CVD
Highest IL-6 is related to 2X increase of CVD
150

Cushman et al. (1999) studied the effect of HRT on inflammation sensitive proteins and
inflammation markers in the Postemenopausal Estrogen/Pregestin Interventions (PEPI)
study. Study on one control and 4 study regimens revealed that exogenous estrogen
increased the concentration of CRP and decreased the serum levels of E-selection.
However, estrogen did not affect on any levels of coagulation factor VIIIc or vWF(von
Wilebrand factor). Estrogen studies have showed the inhibition of platelet aggregation,
diminished lipoprotein-induced smooth muscle cell proliferation, inhibition of myointimal
proliferation related to vascular injury, decreased foam cell formation. (Caulin-Glaser et
al. J Clin Invest, 1996) Acute administration of estrogen improves of potentiated
endothelium-dependent vasodilation in postmenopausal women. Estrogen-mediated
alteration in the expression of certain adhesion molecules has been reported in
endothelial cells.
In Cardiovascular Health Study, postmenopausal women using unopposed
estrogen showed higher levels of CRP, and lower level of albumin, fibrinogen, and
alpha-1 acid glycoprotein. One of fibrinolysis factor, plasminogen activator inhibitor-1
was lower in estrogen users (Cushman et al. 1999).
5) Estrogen and vascular calcification
Estrogen has been related to influence coronary calcification through vascular
smooth muscle cells, matrix proteins, and lipid metabolism. A study to examine
estrogen and mineralized plaques reported the presences of hydroxyapatite and
osteopontin in calcified lesions. More interestingly, β-estradiol inhibited the proliferation
the coronary smooth muscle cells and the production of osteopontin by female animals.
Yet, exogenous estradiol had no effect on proliferation obtained by male animals
(Fitzpatrick, 1996). Thus, they concluded the gender specific effect of β estradiol. In
animal models, estrogen related to inhibit of vascular smooth muscle cells. Estrogen
influences the production of matrix proteins such as osteopontin, and mineralization in
bone. It may affect the coronary calcification by acting on matrix proteins and lipid
151

metabolism in vascular smooth muscle cells. In vitro model, estrogen inhibits coronary
VSMC proliferation in a porcine model and it inhibit non-collagenous protein production
in arterial plaques.
Estrogen receptors (ER) have been detected in vascular smooth muscle cells,
osteoblasts or osteoblast-like cells. Functional estrogen receptors act through gene
expression mechanism to influence calcifying vascular cells. The levels of ER
expression on human vascular smooth muscle cells were inversely correlated with the
incidence of atherosclerosis in vitro studies (Losordo et al., 1994; Karas et al., 1994).
Estrogen had an inhibitory role on osteopontin expression in vascular smooth muscle
cell. Estrogen also exerted on ER on bone, or coronary artery endothelial cells [Kim-
Schulze et al., 1996] to proliferation, migration, and adhesion.
However, molecular studies suggested that estrogen might promote vascular
calcification in contrast to epidemiological studies. Estrogen receptor immunoreactivity
was detected in the cytoplasm and perinuclear region of cultured bovine calcifying cells
indicating the proliferation of cells (Ducy et al., 1997). Furthermore, Bellica et al.(1997)
found that incubation of calcifying cells with 17β estradiol increased calcified nodule
formation, deposition of calcium mineral, and expression of both alkaline phosphatase
and osteocalcin in a dose-dependent way.
Coronary calcification scores were less prevalent and lower in estrogen
replacement therapy women compared to without treated women. In postmenopausal
women, a number of studies examined the prevalence of coronary calcification and it’s
relationship to estrogen/hormone replacement therapy (McLaughlin et al., 1997;
Shemesh et al., 1997). Estrogen treated women demonstrated less prevalence of
calcification compared to non-treated women. For instance, Shemesh et al. investigated
the association between the use of hormone replacement therapy and coronary calcium
in postmenopausal women using double helical computed tomography (CT). Lower
incidence of coronary calcium in hormone replacement use (14.6%) compared with non-
152

user (43.2%, p-value <0.01) was persisted after adjustment of smoking, history of
hypertension, diabetes. Table 14 and Table 15 summarized
6) Exogenous estrogen, C-reactive protein and CAD, vascular calcification
Increased plasma levels of fibrinogen and C-reactive protein (CRP), as well as
leukocytosis, are now established as risk factors for the thromboembolic complications
of vascular disease. Chronic inflammation or infection associated with an acute-phase
response--notably, periodontal disease and smoking-induced lung damage--are likewise
known to increase cardiovascular risk. A common etiologic factor in these conditions
may be interleukin-6 (IL-6), acting on hepatocytes to induce acute-phase reactants that
increase blood viscosity and promote thrombus formation. CRP is related to plasma
interleukin-6 (IL-6), proinflammatory cytokines (McCarty, 1999).
Physicians Health study demonstrated the benefit of aspirin to be less in those
with lower CRP levels. In the Air Force/Texas Coronary Atherosclerosis Prevention
Study -- a primary-prevention study using lovastatin -- the event rates were very low in
subjects with low total cholesterol:HDL ratio and low hs-CRP levels, such that the
numbers required to treat to prevent an event were much higher in this group (ie,
therapy was of relatively less benefit) than in patients with higher levels of either risk
factor. Recent study by Ridker et al. (1999) showed the interaction between hormone
replacement therapy and CRP in 493 healthy postmenopausal women. Adjusted for
history of hypertension, hyperlipidemia, obesity, diabetes, and smoking, HRT users
demonstrated significant raised serum level of CRP (Table 15)
Cardiovascular protection by estrogen has been suggested that estrogen may
inhibit calcification. However, the biological similarity of calcifying atheroscleotic lesions
to normal bone also suggests that estrogen might enhance calcification in arteries like
to bone instead of inhibition of calcification. Bayard and others demonstrated that
estrogen receptors have been detected in mixed cultures of vascular smooth muscle
153

Table 15. Hormone Replacement Therapy (HRT), C-reactive Protein and coronary calcification
Author Design Population Age Measurements Results Comments Redberg 2000 FLASH study, US
Cross-sectional 172 post-Mwomen w/o CAD Calcium score: 0-10 (93); 11-50 (27); >50 (52)
Mean 64.5 years
HRT uses CRP, lipid profiles, smoking, calcium score (EBT)
No positive relationship between CRP and calcium groups. None vs Minimal calcium groups (OR=2.9) vs high (OR=5.0)
CRP (hs) correlated to ICAM-1, IL-6
Ridker 1999 WHS study, US Vs PHS
RCT (Cross-sectional) (comparison to 291 men in PHS)
493 post-M women w/o CAD
Mean 51 years
HRT uses, CRP, smoking, alcohol,medical history
Positive relation between CRP and HRT uses in all women or nonsmoker, obesity
Men did not show significant relationship
Kuller 1999 HWS study, US
Cohort Compare pre-M CAD risk factors to post-M (8th years) endpoint
169 post-M women
Mean 59 years
Lipid profiles,smoking (pre-M),HRT uses, calcium score (EBT) (post-M )
No relationship between HRT use and coronary (p=0.18) or aortic calcification (p=0.09)
LDL (+), HDL2 (-), smoking (+), high SBP related to CAC: ApoE4 (+) related to LDL
Shemesh 1997, Israel
Matched hospital case-control
78 post-M women hormone user, 39 post-M non hormone user w/o CAD history
Mean 57 years
HRT uses, FSH E2, blood sugar,cholesterol, calcium score (double helix CT)
HRT use for the presence of coronary calcium (OR = 0.2; 95%CI 0.06-0.63)
First year of menopause, no duration of HRT use
Cushman 1999, CHS study, US
Cohort, Nested case-control
230 post-M women taking unopposed estrogen, 60 estrogen+progestin; 196 control
Mean 73 years
HRT uses, CRP, fibrinogen, D-dimer , lipids, otherinflammation markers, medicalhistory
Estrogen user have higher CRP(p<0.001), lower PAI-1 (p<0.001) vs control(p<0.001); CRP higher in unopposed E in three BMI tertiles vs control
Higher level of factor VIIc level in estrogen (alone) user group
Newman 2000 CHS, US
Cohort Sub-analysis ( 106 out of 133 subjects) of CRP and calciumscore
60 women, 46men w/o any CAD, or subclinical CAD
Mean 78 years
CRP, calcium score (EBT), subclinical CVD measurements (e.g. ankle-aremindex )
No significant difference of CRP across quartiles of coronary calcification
Hypertension, and smoking were related to coronary calcium
Hunt 2001 PACC project, US
Nested case-control :CAC presence
94 control, 94 control men w/o CAD symptoms
40 to 45 years
CRP, smoking,calcium score (EBT)
No significant difference of CRP in men w/w calcium, and w/o calcium; total cholesterol, LDL sig. Diff
BMI, smoking, fibrinogen were diff. in highest quartile of CRP
154

cells like osteoblast like cells, osteoblasts, or osteoclasts (Bayard et al., 1995; Karas et
al, 1994; Orimo et al., 1993). Estrogen receptors on calcifying vascular cells are
functional, and the observed effects more likely are mediated through genomic
response (gene expression) rather than non-genomic response (direct membrane
signaling). Estrogen-inflammation hypothesis provide possible metabolic linkages
between vascular calcification and osteoporosis in women.
7) Estrogen and sexual dimorphism of cardiovascular disease
Similarly, protective effects of estrogen in male cardiovascular system are
observed in many animal studies. Oparil (1997) demonstrated that estrogen dependent
protection to vascular injury in the rat model. After balloon injury, estradiol treatment
significantly attenuated neointima formation in both genders of godadectomized rats,
and the protection by estradiol was completely blocked by estrogen receptor antagonist.
A few of investigations on the mechanism whether estrogen influences
cardiovascular functions in men were conducted (Blumentahl et al., 1996; Sudhir et al.,
1997; Bagatell et al., 1994). Physiological levels of estrogen have been reported to
influence plasma levels of HLD-c in men (Bagatell et al., 1994). Aromatase deficient
male had very low estrogen levels related to low HDL-c (Morishima et al., 1995). Men
with truncated estrogen receptor due to a mutation showed low HDL-c (Smith et al.,
1994). Studies on same individual with estrogen receptor mutation demonstrated
interesting results; 1) impaired flow-mediated endothelium-dependent vasodilation
(Sudhir et al., 1997), 2) abnormal glucose tolerance (Smith et al., 1994), 3) moderately
high EBT measured calcium scores of 48 compared with normal controls (ages 30-39
years; calcium score 5±2), 4) relatively low LDL-c cholesterols (Sudhir et al., 1997)
155

b. Genetics of osteoporosis and coronary heart disease
Osteoporosis and cardiovascular disease are polygenic and multifactorial
diseases. Their etiology is complex involving interactions of several environmental
influences and genetic components (Schork et al., 1997; Adams et al., 1999).
Understanding of the genes and allelic variations influencing the complex traits, and
multiple gene-gene interactions will enhance the effort to the prevention, diagnosis, and
treatment of diseases. The identification of morbid genes and single nucleotide
polymorphisms (SNPs) (International SNP Map Working Group, 2001) will provide the
disease etiology and novel treatments to prevent bone loss or atherosclerosis. In
addition, the genetics approaches in combination with behavioral and environmental
factors will lead to the development of specific prevention based on individual genotype.
The completion of human genome project will be accelerating these approaches
(International Human Genome Consortium, 2001; Komajda and Charron, 2001). For
instance, to advance the knowledge of genomic research related to heart, lung, and
blood and sleep health and disorders, the National Heart, Lung, and Blood Institute
(NHLBI) initiated the integrated research consortium called the Programs for Genomic
Applications (PGAs, homepage: http://www.nhlbi.nih.gov/resources/pga/index.htm). In
field of osteoporosis research, the Skeletal Gene Database (SGD) by the National
Institute of Aging was launched to aim at understanding the functional genome of bone
and other skeletal tissues (http://sgd.nia.nih.gov/index.htm).
This following section will review the basic genetic research concepts in
determining genetic factors and the progress in identifying genetic risks among
population in lieu of osteoporosis.
1) Heritability of complex traits
Many evidences supporting genetic effects on bone density were yielded from
the study of female osteoporotic patients and first-degree relatives (Danielson et al.,
156
1999; Seeman et al., 1989). Danielson et al. reported that significant correlation
coefficients at the hip femoral neck and calcaneus between mothers (n=207, mean age
71.7 years) and daughter (n= 270, mean age 48.5 years). Further, more mothers with
low bone mass and/or osteoporotic fracture was significantly associated with lower BMD
of premenopausal daughters. Similar to family studies on female population, there are
also numerous evidences to support that a positive family history of fracture is an
important prediction of osteoporosis and fracture in men.
Early in 1970s, Smith et al. reported that bone density of distal forearm was
strongly correlated within male twins, and it decreased with aging. This study suggested
that strong genetic effect on peak bone mass (1970). In continuing of study on same
twin cohorts during 16 years follow-up, the authors did not confirm the significant
heritability for bone loss after adjustment for smoking, alcohol, exercise, and calcium
intake (Slemenda et al., 1992). Study of osteoporotic patients and relatives has
demonstrated strong heritability for bone density in male (Evans et al., 1988; Cohen-
Solal et al., 1998). Evans et al. (1988) demonstrated that volumetric bone density of the
spine was 2 standard deviations lower in relatives (siblings and children) of osteoporotic
fracture patients than in controls without family history of osteoporosis. In a study done
by Cohen-Solal et al., the mean BMD at both the lumbar spine and femoral neck was
significantly lower in patients (n=38, age range 26-64 years), and their mixed relatives
(siblings, n=41; children, n=32) compared to controls. Regardless of having risk factors
for osteoporosis, the relatives of patient showed higher prevalence of low bone mass
than normal individuals (risk ratio, 3.2; 95%CI, 2.0-5.2%) These study results were
further evaluated in large longitudinal population-based cohort studies (Soroko et al.,
1994; Diaz et al., 1997; Keen et al., 1997). Elderly men with a parental history of hip
fracture showed 30% increase of vertebral fracture risk (95%Ci, 1.0-1.7) compared to
men without family history (Diaz et al., 1997). Twin and pedigree studies of osteoporosis
have demonstrated that several genetic factors attribute to the individual variances in
bone mineral density by approximately 85 % (Gueguen, 1995; Nordstrom and
Lorentzon, 1999).
157

Twin or adoption studies have been well applied to measure the familial
occurrence of coronary heart disease attributable to genetic factors. For instance,
established Swedish and Danish twin registries have shown that strong genetic
influence on the cardiovascular mortality in men by comparing concordance between
monozygotic and dizygotic twins (de faire et al., 1975). Marenberg and coworkers
(1994) also showed that the relative hazard of CVD premature mortality (death before
age 55 years) for monozygotic twins was 8.1 (95%CI 2.7-24.5), and for dizygotic twins
3.8 (95%CI 1.4-10.5).
A study of familial hypercholesterolemia is also one of example in the filed of
CVD. Individuals with heterozygous LDL receptor mutations had significantly increased
risk of developing coronary artery disease. The probability of having a myocardial
infarction among heterozygous men was reported as 75% before the age of 60
compared to 15% for the general population (Milewicz and Seidman, 2000)
i) Linkage Analysis
There are a number of approaches to study the genetic information of complex,
and polygenic traits: linkage analysis, candidate gene analysis and quantitative trait
locus (QTL) analysis. Basics of genetic approaches are linkage analysis looking at the
inheritance of a disease through quantitative trait in highly related populations (twins, or
sib-pairs) with series of polymorphic genetic markers. These types of studies can be
performed on a genome-wide scan or with specific candidate genes or regions in genes.
Recent studies on linkage and sib-pairs analysis have defined multiple additional
quantitative trait loci (QTL) that may regulate bone mass, but again results are
conflicting and the responsible genes remain to be defined (Stewart and Ralston, 2000).
In part this could be due to the fact that linkage analysis is ideal for seeking loci that are
necessary, even if not sufficient, for disease expression, but may be much less powerful
for finding loci that are neither necessary nor sufficient for disease expression, the so-
158

called susceptibility loci. Moreover, there is still uncertainty about the statistical
thresholds to be used to establish linkage when testing multiple loci. Quantitative trait
locus (QTL) analysis performs a more advanced research for genes at different
chromosomal locus without any specific assumptions of candidate genes or regions.
The result of QTL analysis may define sites or locus on chromosomes whose alleles
influence a polygenic (quantitative) trait. Therefore, the overall genetics influence on a
trait results from congregate actions of many genes, which contribute only a small
fraction to the trait variation (Klein 1999). Recent advanced human genome researches
make QTL analysis more feasible by identification of genetic variations with marker
locus at chromosomes. QTL analysis needs a large number of related subjects though
to be following Mendelian inheritance of segregation for genes that linked to a trait.
Candidate genes in QTL mapping are identified by linkage analysis and cloned based
on chromosomal position (Botstein, 1980). According to Koller and colleagues,
chromosome 1q21-23 (LOD score, 3.86), and chromosome 6p11-12 (LOD score, 2.13)
were associated with lumbar spinal BMD using extended sibling pair analysis.
Chromosome 5q33-35 (LOD score, 2.13) was related to femoral neck BMD. The
limitation of QTL studies are: to fail to detect genes with small variations in a trait, to
require a large number of families with subjects possessing the disease of specific
interest, to need to clear the heterogeneity created by different environmental
exposures or ethnic backgrounds into samples (Schork 1997; Schork and Xu 1996;
Schork, 1996; Kruglyak and Lander 1995).
Recent publications showed interesting results that three different bone-related
phenotypes—osteoporosis pseudoglioma-syndrome (OPPG) (Gong et al., 1996; Gong
et al., 2001), familial high bone mass (HBM) (Johnson et al., 1997), and autosomal
recessive osteopetrosis (Heaney et al., 1998) have linked to the same locus on
chromosome 11q12–13. These studies have suggested that this region plays an
important role in regulating skeletal homeostasis and bone accrual. The same QTL
polymorphic markers (LOD=3.5, D11S1313, D11S987) have also been shown to
correlate with femoral BMD variation in the normal female sibling population (Koller et
al., 1998). Johnson and colleagues identified a single extended pedigree (one female
159

proband and 22 members) with autosomal dominant inheritance of very high spinal
bone mass. Genome wide linkage analysis revealed the gene for high bone density
trait (mean spinal Z-score 5.54) on chromosome 11 (11q12-13) among affected
individuals (n=12) and unaffected subjects. Researchers later presented LDL receptor-
related protein 5 (LRP5) as an affected gene (Johnson et al., 2001). On the other hand,
researchers on osteoporosis pseudoglioma-syndrome (OPPG), autosomal recessive
trait of juvenile osteoporosis, also presented that mutations in same gene (LRP5)
affected the bone accrual (peak bone mass) and eye complications (Gong et al., 2001).
This contrast evidences between high bone mass (Gain-of-Function) and OPPG (Loss-
of-Function) will raises controversial explanations. For instance, the both traits are
caused by different allelic variation of same gene, and it might be related to result in
different response in signaling pathways (e.g. redundant role of LRP6 for LRP5) (Gong
et al., 2001).
ii) Candidate gene studies
Candidate gene studies seek for an association between a specific
polymorphism within a candidate gene and traits. If the genetic variant is more prevalent
in individuals with the specific traits that those without trait, researchers may infer that
either there is a causal association between the candidate genes and the trait or the
candidate gene is merely in linkage disequilibirum with a true disease gene near the
similar locus (Klein et al., 1999). Advantages of these studies are following: simple, no
need to require families, and only need to look for evidence of allele sharing in cases
(affected) and control (unaffected) within population (Klein 1999).
However, false positive results may occur due to population stratification, to population
admixture, or to inappropriate selection of sample (selection bias) in recruitment of
cases and controls. Another disadvantage of association studies is the difficulty in
controlling gene-gene or gene-environment interactions, which may mask the
relationship of specific polymorphisms to multiple traits. A positive association between
specific polymorphism and a phenotype (traits) does not necessarily indicate that the
160

polymorphism results in disease phenotype. The positive association may arise for two
other reasons: 1) the allele does not cause trait but in the linkage disequilibrium with the
actual gene, 2) the population admixture cause the association (Lander and Schork
1994; Risch and Merikangas 1996; Gennari, 2001). Therefore, it is important that
positive associations from association studies need to be confirmed in large
populations, and also need to be evaluated in terms of biological significance. Family
based association study method, namely transmission disequilibrium test (TDT), has
been used to control for confounding factors in association studies with increased
statistical power.
There are many population based case-control studies performed on numerous
genes and their genetic effects on bone mass and osteoporosis. Even though there are
more than 20 candidate genes were studied in various population, the significant
association between candidate genes and osteoporotic risks are not consistent.
Moreover, most of studies had been performed in female population. Some promising
candidate genes based on association studies of male population are: 1) collagen type I
alpha 1 gene (COLIA1), 2) insulin growth factor I gene (IGF-1), 3) aromatase (CYP19),
4) estrogen receptor α (ERα), and 5) androgen receptor (AR). In genetic study of
cardiovascular disease, many genetic polymorphisms over 130 candidate genes have
been investigated in epidemiological studies (Tang and Tracy 2001).
Several genetic markers influencing bone mass have been studied in relation to
coronary calcification as well. There are a few of candidate genes, which might be
directly or indirectly related to the both coronary calcification and bone mineralization.
Potential candidate genes for the regulation of bone mass are genes for coding
cytokines, growth factors, matrix components, and hormonal receptor for sex steroid
(Table 16)
161

Table 16. Selected candidate genes for cardiovascular disease and osteoporosis
Candidate gene Abbreviatio
n
Map position
(OMIM number)
Common
Variants
CVD-related trait OP-related trait
Apolipoprotein E APOE 19q13.2
(107741) ε2/ε3/ε4 Hyperlipoproteinemia, early
atherosclerosis, MI (Wilson, 1996;
Srisvasan, 2000)
BMD
(Salamone, 2000)
Nitric oxide Synthase
(Endothelial)
NOS3 7q35-36
(163729)
Glu298Asp
Higher NO levels, CVD
(Soma, 1999)
BMD
(MacPherson, 1998)
Estrogen
receptor α
ESRA 6q25.1
(133430)
[TA]n Severity of CAD, Aortic calcification
(Kunnus ,2000)
BMD, Fracture
(Langdahl 2000)
Haptoglobin HP 16q22.1
(140100)
-61 A/C
(Hp1/Hp2)
Atherosclerosis, lipid, inflammatory
cytokine (Braeckman, 1999)
Osteoporosis
(Pescarmona, 2001)
Interleukin 6 IL6 7q21
(147620)
-174 A/C
Aortic aneurysm, carotid artery
atherosclerosis
(Jones, 2001; Rauramaa, 2000)
BMD
(Lorentzon, 2000;
Murray, 1997)
Methleneterahydrofolat
e Reductase
MTHFR 1p36.3
(236250)
677C/T Deep vein thrombosis
(Meisel, 2001)
BMD
(Miyao, 2000)
Peroxisome
proliferator-activated
receptor γ
PPARG 3p25
(601487)
161C/T (exon6) Reduced CAD risk
(Wang, 1999)
BMD
(Ogawa, 1999)
Transforming growth
factor-β1
TGFβ1 19q13.1-13.3
(190180)
-509C/T (intron4)
29T/C Elevated TGFβ1,
(Yokota, 2000)
MI (Cambien, 1996)
BMD, fracture
(Yamada, 2001)
--------
BMD, bone mineral density; MI, myocardial infarction; CAD, coronary artery disease; CVD, cardiovascular disease
162

c. Osteoprotegerin (OPG) Gene
1) Genomic organization and protein function
Osteoprotegerin (OPG) or Osteoclast Inhibiting Factor (OCIF) is a recently
cloned soluble glycoprotein of the tumor necrosis factor receptor family (TNF) (Morinaga
et al., 1998). By binding to osteoclast differentiation factor (ODF or OPGL/RANKL),
osteoprotegerin can prevent osteoclast differentiation, and inhibit osteolytic processes
(Simonet et al., 1997; Yasuda et al., 1998; Tan et al., 1997).
The human osteoprotegerin gene is a single copy gene with 5 exons that spans
29 KB of the human chromosome 8q23-24 (Tan 1997, Yamaguchi 1998). The OPG
gene encoded a 44kDa protein, and post-translationally modified to a 55-kDa protein
through glycosylation (Simonet et al., 1997; Lacey et al., 1998). Modified OPG forms
disulfide-linked homodimer through N-terminal glycosylation. However, the properties of
monomer and homodimer are known to be similar (Tomoyasu et al., 1998). OPG lacks
of inner or transmembrane core, and is secreted only as a soluble protein. OPG mRNA
is detected in several tissues and not only restricted to bone. Various cells produce
OPG, including stromal/osteoblastic cells and vascular smooth muscle cell (Simonet et
al., 1997). OPG is a potent regulator of bone mass since both pathological and
physiological bone resorption can be blocked by administration of recombinant OPG to
normal mice. Bekker (2001) showed that the expression of OPG depends on age and
sufficient estrogen supply in postmenopausal women. Age related decreases in the
expression of OPG were observed in cultured human bone marrow suggesting a
mechanism to explain the increased capacity of osteoblast cells to support
osteoclastogenesis (Makhluf et al., 2000). OPG is expressed in vascular smooth muscle
cells. In-vitro analyses demonstrated osteoprotegerin production by arterial smooth-
muscle cells (Hofbauer, 2001) and endothelial cells (Malyankar, 2000).
163

2) Animal studies of osteoprotegerin in relation to osteoporosis and cardiovascular
disease
Transgenic mice overexpressing OPG developed osteopetrosis with narrowing of
bone marrow and resulting in splenomegaly. Histological analyses reveal systemic
increases in mineralized trabecular bone with a reduced number of osteoclasts
(Simonet et al., 1997). OPG knockout mice develop severe osteoporosis (Bucay 1998,
Mizuno 1998) with destruction of femoral growth plate, trabecular and cortical bone
porosity, thinning of parietal bones, multiple spontaneous fractures, and increased
postnatal mortality. Mice that are heterozygous for the null mutation of the OPG gene
have osteoporosis of intermediate severity, indicating that adequate OPG expression is
an essential requirement for normal bone mass in mice. Administration of OPG to
ovariectomized rats decreases osteoclastic activity and restores bone mass to normal
levels (Simonet 1997).
On the other hand, OPG-deficient mice showed that the arterial calcification as
well as defective bone metabolism is related to OPG. The phenotype of OPG knock out
mouse showed early onset osteoporosis with multiple fractures, and had hypocalcaemia
as well as arterial calcification and aneurysms in the large arteries (Bucay, 1998).
Moreover, an interesting study in OPG transgenic mouse (-OPG) showed the
intravenous injections of recombinant OPG prevented the vascular calcification and
osteoporosis (Min, 2000). The mice models suggested that OPG deficiency is important
for the clinical development of vascular calcification and osteoporosis (Min, 2000). In the
calcified lesions, OPGL and RANK transcripts are detected with little or no expression in
uncalcified arterial regions. The cell containing calcified foci in the arteries were similar
to mature osteoclasts. The administration of OPG did not reverse effect of the formation
of arterial calcification but it might prevent the calcification. Experimental mouse (OPG -
/-) expressing ApoE-OPG transgene did not show any calcification in major arteries.
These transgenic mice exhibit severe osteopetrosis (Simonet et al., 1997) (Table 17)
164

Table 17. Mouse genetic model for osteoporosis and atherosclerosis (vascular calcification)
Gene (OMIM
number)
Mice BMD/osteoporosis
trait
Vascular
Calcification/Atherosclerosis
Ref
Osteoprotegerin
(602643)
OPG Knockout
OPG
overexpression
Osteoporosis
Osteopetrosis
Vascular calcification Mizuno
(1998)
Simonet
(1997)
Matrix Gla protein MGP knockout -- Arterial, valve, and cartilage
calcification
Luo (1997)
Price (2001)
Osteocalcin
(112260)
Osteocalcin KO High BMD Normal blood vessels Ducy (1996)
Osteopontin Osteopontin KO High bone volume Enhanced valve implant
calcification
Giachelli
(2001)
Liaw (1998)
Osteonectin Osteonectin KO Reduced bone
density of
trabecular bone,
Osteopenia
No arterial calcification Delaney
(2000)
3) Regulatory factors on osteoprotegerin
In vitro studies showed that OPG levels were increased by various resorptive
hormones and cytokines. OPG protects against bone loss caused by parathyroid
hormone, parathyroid hormone related peptide (PTHrp), 1α, 25(OH)2 VitD3, interleukin-1
(IL-1), IL-6, IL-11 and prostagladins (Table 18), which are involved in bone diseases
associated with increased osteoclast activity, for example, postmenopausal
osteoporosis (Ref), localized bone loss in rheumatoid arthritis, hypercalcemia in
hyperparathyroidism, sarcoid, and metastasized cancer.
Estrogen effects on bone cell are to stimulate the osteoblast production of
multiple cytokines including IL-1α, IL-6, and prostaglandin (PGE2), which control
osteoclast formation and function. Estrogen acts directly on both osteoblast and
165

osteoclast through high affinity receptors. Estrogen withdrawal following menopause
and ovariectomy increases the formation and activation of osteoclast. Also estrogen
deficiency is associated with increase of the proresorptive cytokines and decrease of
antiresorptive cytokines. Estrogen stimulates the expression of OPG from mature
osteoblast. Estrogen has been found to increase OPG mRNA levels and protein
expression in human osteoblastic lineage cells (Hofbauer et al., 1999). Estrogen also
suppressed the maturation of osteoclastic cells with RANKL by c-Jun repression
(Shaved, 2000). Exogenous OPG treatment has shown to inhibit the osteoclastic
resorption and to prevent ovariectomy-induced bone loss (Simonet, 1997). Makhluf and
colleagues (2000) demonstrated that OPG gene expression on bone marrow stromal
cells declined with age and was partly reversed by estrogen administration.
In epidemiologic studies, serum levels of OPG were higher in individuals with the
highest bone turnover rate and with severe osteoporosis (Yano et al, 1999).
Interestingly, the levels were higher in women than in men in one study (Arrighi et al.,
1998). A positively correlation between serum OPG levels and the serum 17β-estradiol
concentrations was reported by same investigators (Arrighi et al., 2000). A cohort of 252
men aged 19-85 years showed similar positive correlation of OPG levels to the levels of
testosterone (free androgen index: FAI) and estradiol status (Szulc et al. 2001). It is
possible that differentiation from osteoblast precursor and osteoclast precursor into
mature cell may be tightly associated, and occurred simultaneously. Impaired osteoblast
formation lead to impaired osteoclast formation. From in vitro, ex vivo studies, ratio of
OPG-L to OPG production ratio by osteoblast may be major factor for osteoclast
formation.
Glucocorticoids inhibit intestinal calcium absorption, and induce hypogonadism,
and increase PTH. It also is related to decrease bone formation, and increase bone
resorption. Glucocorticoid increases bone resportion through increased OPG-L/OPG
ratio of osteoblast. It results in increased production of tumor necrosis alpha (Hofbauer,
1999b).
166

Table 18. Regulation of OPG by calcitropic hormones, cytokines and immunosuppressants
Regulatory factors Effect on OPG Reference
1,25-(OH)2D3
IL-1α and IL-1β
TNF-α and TNF-β
Bone Morphogenetic Protein 2
17β-Estradiol
Ca 2+
Parathyroid Hormone
Glucocorticoids
Basic fibrobast growth factor (FGF)
Immunosuppressants (Cyclosporine A)
↑
↑
↑
↑
↑
↑
↓
↓
↓
↓
Hofbauer 1998
Hofbauer 1998
Hofbauer 1998
Hofbauer 1998
Hofbauer 1999
Takeyama 2000
Lee 1999
Vidal 1998
Nakagawa 1999
Hofbauer 2001
4) Epidemiological studies of OPG
There are limited data available based on human. Age-dependent increased
levels of OPG have been reported (Yano, 1999; Arrighi, 1998; Arrighi, 2000; Browner,
2001;Szulc, 2001). In a Japanese study with 56 men and 186 postmenopausal women,
serum OPG concentration were positively related to age in both men and women (Yano,
1999). Szulc et al. also reported that serum levels of OPG in men were positively
correlated with age in 252 men between 19 –85 years old (r=0.41;p=0.0001) while
greater variability was observed in over 45 years of age. A positive correlation of OPG
serum levels with serum 17β-estradiol was reported in postmenopausal women (Arrighi
et al, 2000). In a study of 252 men (MINOS study, age range 19-85 years), there was a
positive correlation of serum OPG levels with the testosterone (free testosterone index,
r=0.20; p<0.002) and estradiol (free estradiol index, r=0.15;p<0.03) after adjustment for
age and weight (Szulc et al, 2001).
OPG levels were enhanced in persons with a higher bone turnover and severe
osteoporosis (Yano, 1999) and women showed higher OPG serum levels than in men
167

(Arrighi, 1998). However, the relationship of OPG serum levels and markers of bone
metabolism are inconsistent. Recent publication by Bekker et al showed the first attempt
that OPG might be useful therapeutic agents of postmenopausal women (2001).
Women treated with OPG injection for the period of six weeks showed 1) rapid
decrease bone resorption markers (urinary N-telopeptide, 14%), 2) slow decrease of
bone formation marker (bone alkaline phosphatase). Authors concluded that OPG
treatment acted mainly on osteoclasts to delay bone resorption. OPG levels were also
negatively related to urinary total DPD (r=-0.20; p<0.01) in men (Szulc, 2001). In
contrast, Yano and colleagues reported positive correlations of serum OPG levels with
the levels of DPD (1999).
OPG might play a role in the development of calcification leading to
atherosclerosis, and strokes in postmenopausal osteoporotic women. Further evidence
on OPG as a vascular regulator was from one large epidemiological study. Browner et
al (2001) studied the relationship between serum OPG levels with diabetes,
cardiovascular mortality, and BMD in 490 elderly women over 65 year-old. OPG levels
were associated with increased risk of all cause mortality (OR=1.4, 95% CO, 1.2-1.8),
and cardiovascular mortality (OR=1.4; 95% CI, 1.1-1.8) and diabetes. However, OPG
levels are not associated with bone density at any sites (e.g. total hip, r =-0.03; spine, r
=0.01). Serum OPG also was not related to the risk of fractures of all types but only in
post-hoc analyses there was significant relationship between subsequent hip fractures
(OR=1.3, 95%CI 1.0-1.7). Contrast to this result, there has been reported of negative
correlation of OPG levels and bone density (femoral neck, lumbar spine) in
postmenopausal women (Arrighi et al., 2000). There was a lack of association of OPG
and BMD at the total hip, spine, and whole body in men as well (Szulc, 2001).
5) Osteoprotegerin (OPG) polymorphisms and bone density, or cardiovascular disease
Twelve polymorphisms of osteoprogeterin gene are reported currently (Langdahl
et al., 2002). Table 19 summarized association studies related to OPG polymorphism.
Of them, two single nucleotide polymorphisms (T-950C, and G-1181C) are mostly
168

studied in studies. Most of them studied in cross-sectional studies and have shown
inconsistent result (Brandstrom et al., 1999, 2000; Langdahl et al., 2000; Lorenzon et
al., 2000). The study of 157 Swedish men aged 45 to 79 years firstly presented the
association of T/C transition polymorphisms of OPG and bone density. A T/C transition
(T-950C) situated in 129 base pairs upstream the TATA-box of the human
osteoprotegerin gene was detected by sequence analysis, and identified using HincII
endonuclease. No functional properties of T/C substitutions have been reported.
Frequency of C allele was 18.2%, and that of T allele was 81.8%. Three different
genotypes of OPG are associated with the bone mass at hip, and total body. In this
cohort, the TT genotypes had the lowest BMD whereas the CC genotype had the
highest BMD, measured at spine, neck, ward-triangle, trochanter and total body. In
contrast, OPG promoter polymorphisms at T/C transition sites are not significantly
related to bone mass in 1044 postmenopausal Swedish women aged over 75 years
(Brandstrom 2000). Even though there was no significant relationship with OPG HincII
(T/C transition sites) and bone density, Chung and colleagues (2000) found OPG
polymorphisms contributes to different urine calcium excretion 133 Korean
postmenopausal women average age of 53 years.
Another study performed by Langdahl (2000) demonstrated the association of
four possible polymorphisms with bone mass in 322 fracture patients and 364 normal
participants at the lumbar spine and femoral neck. For instance, G allele is common in
fracture patients at the A163-G promoter sites. Also, G allele at the exon 1 is
significantly present in fracture patients and subjects with C alleles had higher lumbar
spine. A single nucleotide polymorphism at exon1 (G-1181C) has been reported. G/C
substitution causes amino acid changes from lysine to asparagines, but their functional
status are not yet determined (Langdahl et al., 2000). The allele distribution (G allele)
was significantly different among fracture patients (73.9%) compared to 64.6% among
controls. CC genotype showed higher lumbar spinal BMD (0.90±0.17 g/cm2) compared
with GG genotype (0.86±0.18 g/cm2 , p<0.02). In 99 healthy adolescent girls (mean age,
16.9±1.2 year), G/C allelic variants were also significantly related to lumbar spine.
169

However, they found that GG genotype showed higher spine BMD (1.27±0.11 g/cm2)
than GC subjects (1.20± 0.12 g/cm2 ).
There are inconsistent and preliminary results from a number of cross sectional
studies. However, there is one study reporting a relationship between allelic variant (T-
950C and G-1181C) and BMD in men (Brandstrom et al., 1999). In addition, animal
studies strongly suggest that osteoprotegerin play an inhibitory role in vascular
calcification. Brandstrom et al. (2002) recently reported the relationship between T-
950C polymorphism and vascular morphology and function. Among fifty-nine healthy
European subjects, participants having CC genotype showed a significantly higher
intima-media thickness (IMT) of the common carotid artery (p-value: 0.0435) compared
to those with TC genotypes or TT genotypes.
170

Table 19. Epidemiological studies examining the association between OPG polymorphisms and bone density
Ethnicity Age (years)
Gender N Skeletal Site SNPs Alleles (%) BMD difference Reference
Caucasian European (Case-control)
NA NA OP:322 control:364 control
Lumbar spine Femoral neck
G1181-C T950-C
-- --
G allele common among Fx patients, higher LSBMD with C allele (p<0.02) 0.864±0.17 (CC) Vs. 0.803±0.15 Sig.
Langdahl, 2000
Caucasian European (Cross sectional)
50-85 (mean 63 yrs)
Postmenopausal Women
206 Total body,total hip, femoral neck, lumbar spine
T950-C -- No difference of BMD, bone turnover
Roger, 2000
Caucasian Eupropean (Cross sectional)
Aged 75 yrs
Postmenopausal women
1044 Femoral neck T950-C -- No difference of BMD Brandstrom, 2000
Asian (Cross sectional)
Mean 53.4±5.1 yrs
Postmenopausal women
133 Lumbar spine,hip
T-950C TT: 67.6%TC:16.5% CC:15.8
No difference of BMD, bone turnover CC highest Ca excretion ratio
Chung, 2000
Caucasian European (Cross sectional)
Mean 16.9±1.2 yrs
Adolescent girls 99 Total body, femoral neck, lumbar spine
G1181-C GG:24%GC:48% CC:27%
GG > GC in LS BMD (p=0.04); Independent predictor (β=0.26, p<0.05)
Lorentzon, 2000
Caucasian European (Cross sectional)
45-79 years
men 157 spine, neck,ward-triangle, trochanter and total body
T-950 T: 81.8%C: 18.2%
CC has higher BMD than TT
Brandstrom, 1999
171

4. Paradox between osteoporosis and cardiovascular disease: Obesity
Fat metabolism is related to both artherosclerosis and bone metabolism. Obesity
has been related to higher BMD but higher prevalence of CAD. Obese women have a
higher risk of CAD but a lower risk of osteoporosis. Body weight is mostly determined by
fat mass and muscle mass, which are related to bone density (Visser et al., 1998;
Zmuda et al., 1999; Edelstein 1993). Obesity, in general, has been hypothesized to
influence bone mass through increased mechanical loading on bone, enhanced peak
bone mass attainment, and increased peripheral aromatization of androgens to
estrogen in adipocytes. However, central obesity (waist to hip ratio or waist girth alone)
is a marker for visceral adiposity, and correlates with insulin resistance, dyslipidemia,
diabetes, and CHD in men and women (Prentice 2001). Smoking, alcohol consumption,
and stress are known to be risk factors for central obesity in men and women. Genetic
inheritance is also one of strong factors for central obesity (Samaras et al., 1999). For
instance, the low testosterone levels in men cause central obesity whereas high
testosterone levels in pre-&postmenopausal women cause it. Cross-sectional studies
demonstrated that low endogenous testosterone is associated with visceral adiposity in
men, and treatment with low doses of testosterone reduces upper body obesity in men
(Barrett-Connor, 1995; Marin et al., 1992).
A possible hypothesis for paradoxical effect of obesity (increased bone mass and
cardiovascular disease) may be explained by leptin. Leptin is mainly produced by white
adipocytes, and has primary effect on the hypothalamus (Tartaglia, 1997). Serum leptin
levels are directly related to fat mass and are increased in obesity (Considine et al.,
1996). Recent studies reported that leptin may increase or decrease bone density. Also,
high levels of leptin were related to higher levels of vascular calcification. Aging and
high fat diets are related to increased levels of both leptin and vascular calcification
(Baumgartner et al., 1999; Ahren et al., 1997). A report by Ducy and colleagues (1999)
showed that leptin is a potent inhibitor of bone formation mediated though central
nervous systems. However, leptin may be involved not only in central nervous system,
but also in various tissue and cells. Leptin receptors are expressed in multitude of
172
tissues (Fei et al., 1997). Leptin regulates the differentiation of osteoprogenitor cells
(Thomas et al., 1999), suppress adipocyte differentiation (Thomas et al., 1999). On the
other hand, Burguera et al. recently reported that administration of leptin to estrogen
deficient rats was effective to reduce travescular bone loss (2001). They also
demonstrated that leptin significantly stimulated mRNA of OPG, and OPG protein
expression while it decreases RANKL mRNA levels. Thus these evidences suggest that
leptin enhances osteoblastic differentiation, and decreases osteoclastogenesis
mediated through OPG/RANKL pathway. In addition, Ogueh et al., showed that
negative correlation between leptin and cross-linked carboxyl-terminal telopeptide of
type I collagen (bone resorption marker)(1999). Study of anorexia nervosa patients
supported that decline of leptin may play an important etiologic role in loss, and
impaired bone mass accrual (Karlsson et al., 2000)
Leptin regulates the reaction related to lipid accumulation (Shimabukuro et al.,
1997) and leptin induced oxidative stresses was related to the differentiation of
calcifying cells (Bouloumie et al., 1999). Farhami et al. (2001) showed that leptin
significantly stimulates alkaline phosphatase activity, and calcification in calcifying
vascular cells. Furthermore, leptin receptors were detected in calcifying vascular cells
indicating mechanism of leptin and leptin receptor. In mouse artery wall, leptin receptors
were also present (Farhami et al., 200). Therefore, Farhami et al., hypothesize that the
leptin may play an important role in vascular calcification.
There are still a lot of missing information between leptin, bone formation and
calcification. However, the mechanisms between leptin, leptin receptor, and their target
tissues may connect the paradoxical concept, which obesity is beneficial to protect
osteoporosis, but detrimental in cardiovascular disease (more specifically) in vascular
calcification.
173

III. SPECIFIC AIMS
The proposed study examined whether measures of bone strength including bone
mineral density (MD), bone loss, quantitative ultrasound (QUS) parameters, and
biochemical markers of bone turnover are related to the extent of coronary calcification.
In addition, we evaluated two potential etiologic mechanisms underlying the association
between BMD and coronary calcification.
Specific Aims 1: To determine the relationship between measures of bone strength and the prevalence
of coronary calcification, we examined following hypotheses:
a. Men with lower BMD will have higher coronary calcium score in coronary
arteries.
b. Men with higher rates of bone loss are associated the higher coronary
calcification.
c. Men with lower ultrasound parameters (BUA and SOS) will be associated with
higher coronary calcium score.
d. Men with higher bone turnover markers (osteocalcin, N-telopeptides) will be
associated with the greater extent of coronary calcification.
Specific Aims 2: To explore potential mechanisms underlying relationship between BMD and coronary
calcification, sex steroid hormones, marker of inflammatory response (C-reactive
protein) and osteoprotegerin gene polymorphisms were tested. Specifically, we
hypothesized following hypotheses:
a. Men with lower estrogen level and higher CRP will have lower BMD, and
higher coronary calcification.
b. Men with C/C genotype at a T/C transition at position –950 in the promoter
regions have higher bone mass, lower bone loss and lower coronary
calcification.
174

c. Men with C/C genotype at Lysine(G)/Asparagine(C) substitution at position
1181 in exon 1 will have higher BMD, lower bone loss, and lower coronary
calcification score.
175

IV. METHODS
A. Study of Osteoporotic Risk in Men (STORM) 1. Overview of Current Study (STORM-EBT study)
The study of ‘Bone mineral density (BMD), bone loss and coronary calcification in
older men (STORM-EBT)’ was conducted as an ancillary to the Study of Osteoporotic
Risk in Men (STORM) of the Graduate School of Public Health, University of Pittsburgh.
The study examined the cross sectional measurement of coronary calcification and its’
relationship of longitudinal measurements of bone mass, bone loss, and bone turnover
markers. The extent of coronary calcification was measured in 144 men (aged 58 – 84
years). In addition, the questionnaire regarding detailed participants’ history of coronary
heart disease, and family history of coronary heart disease was addressed on the
participants. The University of Pittsburgh Biomedical Sciences Institutional Review
Board (IRB) and the Radiation Safety Committee approved the protocol for the present
study. Written informed consent form was obtained prior to participating the study.
Recruitment began in May 2000 and was completed in January 2001.
2. Overview of the Study of Osteoporotic Risk in Men (STORM): Baseline Clinic Exam (1991-1992) and Follow-up Clinic Exam (1997-1999)
A total of 541 men were recruited from February 1991 to 1992. Subjects were
recruited from two sources. First, former participants in the Pittsburgh cohort of the
Multiple Risk Factor Intervention Study (MRFIT) invited to participate the study. Briefly,
MRFIT was a randomized clinical trial to determine the efficacy of risk reduction on
coronary heart disease morbidity and mortality. At the entry of study (1973-1976), men
aged 35 to 57 years were at high risk of coronary heart disease because of the
176

presence of heart disease risk factors (smoking, elevated serum cholesterol level, and
diastolic blood pressure) (Smith, 1978). The rationale for recruiting MRFIT participants
for STORM study was that extensive historical data was available (annual examination
data until 1982). 108 former MRFIT participants agreed to participate in STORM study.
Secondly, a total of 433 STORM men were recruited from a population-based 1985
voter registration tapes for the Monongahela Valley (30miles southeast of Pittsburgh,
PA). Men who had a bilateral hip replacement or were unable to walk without assistance
were ineligible. 433 men responded among a total of 15,000 recruitment letter receivers,
and agreed to participate in the study. A total of 541 men in combination of 108 MRFIT
participants and 433 community dwelling volunteers were completed the STORM
baseline clinic examination between February 1991 and February 1992 (Glynn et al.,
1995).
All 541 men were invited to participate in a follow-up clinic examination in 1997.
To minimize non-response to the follow-up visit, the detailed introductory letters
describing the goals of the follow-up visit, the tests to be performed and other
information was sent to former STORM participants. Men who did not respond to
postcard were contacted by phone. Participants who were willing to participate were
scheduled. With every attempt to locate the participants, the vital status and willingness
to participate of all 541 men were collected. 327 men out of original cohort of 541
participants completed the clinic exam between October 1997 and January 1999. 74
men who were unable to attend the clinic visit finished an abbreviated questionnaire to
update information on basic demographics and selected medical conditions. 90 men
were deceased and nine had moved out of state. 41 men refused to participate both
questionnaire and clinic examination. Nine men moved out of state so that they could
not participate in the follow-up examination.
Bone mineral density of the proximal femur and its’ sub regions were measured
using dual energy X-ray absorptiometry at baseline and follow-up clinic examination.
Calcaneal quantitative ultrasound parameters (broadband ultrasound attenuation: BUA
& speed of sound: SOS) were measured. Questionnaire information was also collected
177

at baseline and follow-up visit. Plasma and serum samples were obtained and stored at
follow-up visit.
The University of Pittsburgh Human Investigation Review Board (IRB) and
Radiation Safety Committee approved the protocol for the baseline and follow-up
examinations. Written consent forms were obtained from each subject at each clinic
examination prior to participation in the visit.
3. Sample Recruitment for the Current Study (STORM-EBT study)
For the present study, subjects were included based on their interest on study,
and met certain inclusion criteria in the study. We sent an introductory letter describing
the aims of the current study, a electron beam computed tomography (EBT) test and
clinic questionnaire, and potential benefits of study to 327 STORM participants who
completed both baseline examination (1991-1992) and follow-up clinic visit (1997-1999).
We enclosed a postage paid postcard for participants to indicate their willingness to
participate in EBT measurement and the best time to call to schedule a clinic
appointment. Men who did not return the postcard were directly contacted by telephone.
The individual was then invited to schedule an EBT clinic examination. Men who
underwent a coronary bypass surgery or were overweight more than 300 lbs were
excluded to avoid the artifact on EBT measurement.
To increase participation rate, we offered flexible scheduling hours and door-to-
door transportation. Nine men were deceased after the follow-up clinic exam. The most
common reason not to attend the EBT measurement was that they didn’t want to come
to Pittsburgh due to poor health (n=15), and long traveling time (n= 91) even though we
offered them door-to-door transportation. Forty men were not able to attend the visit by
exclusion criteria. Thus, 144 (44.0%) of the invited participants completed both short
questionnaire regarding the history of heart disease, and family history and EBT
measurement. The recruitment status of the present study was presented in Figure 5.
178

Men who completed the EBT measurement received $25 and a copy of result of EBT
scanning. A written consent form was obtained from each participant at the clinic visit
(Appendix A).
Ineligible: n=40Not interested: n=109
Deceased/Terminated: n=10Unable to contact: n=24
Sample in the analysisn=138
OPG T-950C SNP analysis: n=134OPG G-1181C SNP analysis: n=133
Excluded SubjectsIncomplete BMD data: n=2Non-Caucasian men: n=3
Androgen antagonist user: n=1
EBT -Visit n= 144
2000-2001
Follow-up visitn = 327
1997-1999
Questionnaire only: n=74Deceased : n=90Out of State: n=9Terminated: n=41
STORM Baselinen=541
1991-1992
Figure 6. Recruitment scheme and status of participants in the STORM-EBT examination.
B. DATA COLLECTION
Extensive questionnaires were sent to participants prior to their clinic exams at
follow-up and EBT measurement, and reviewed with participants by trained
179
interviewers. Questionnaires and clinic examination forms for EBT visit can be found in
Appendix B & C. Collected variable listed during the baseline, follow-up, and EBT
exams were summarized in Table 20.
1. Clinic Examination Measurement
a. Bone Mineral Density Measurement
Bone mass such as bone mineral content (g), cross-sectional area (cm2), and
density (g/cm2), was measured at baseline, and second clinic visits. The total hip, and
its sub regions (femoral neck, trochanter, and inter-trochanter) were measured using
dual energy X-ray absorptiometry (DXA) with standardized protocol for participant
positioning and data analysis. All hip measurements were performed on subjects’ right
side of hip except in men who had suffered from a fracture, or severe injury on right
limb. Both Hologic Model QDR-1000 densitometer (Hologic, Inc; Waltham, MA) and
Model QDR-2000 were used at the baseline clinic visit. From a cross-calibration study
performed on 10 participants, BMD measurements between two densitometers on the
femoral neck were highly correlated (r = 0.98). On second clinic visits, all participants
were measured with QDR 2000 densitometer. Rate of change in BMD was calculated
from baseline and second visits DXA measurements, and expressed as an annualized
percentage (% per year). The University of California, San Francisco Prevention
Sciences Group (UCSF) performed the DXA quality assurance (QA) and quality control
(QC) procedures.
b. Quantitative Ultrasound Measurements
Quantitative ultrasound (QUS) measures qualitative properties of bone that are independent of bone
mass such as the velocity and attenuation of sound transmission
180

Table 20. Summary of Variables in the Study of Osteoporotic Risk in Men (STORM)
Variable
Baseline Visit (1991-1992) n=541
Follow-up Visit (1997-1999) n=327
EBT visit (2000) n=144
Questionnaire Weight (Kg) X X Height (cm) X X BMI (kg/m2) X X Smoking history X X X Alcohol intake X X X Physical activity X X Dietary Calcium X X Clinic measurement Hip Bone density (g/cm2) X X Calcaneal ultrasound X Coronary calcium X Blood pressure X X Medical History Fracture X X X Osteoporosis X X X Hypertension X X Diabetes X X Hyperlipidemia X X Coronary heart disease X X X (Detailed Hx) Hypogonadism X X Infection X Surgical procedure for CVD X Family history Fracture X X Osteoporosis X X Heart disease X Medication inventory Lipid lowering drugs X X Thiazide diuretics X X Biological specimens Bone turnover markers (Osteocalcin, NTX) X Sex steroid hormones (Total and Bio E2 Total and Bio T, SHBG) X Lipid (HDL-c, Total Chol, LDL-c, Trig ) X Cytokines (CRP) X Gene: OPG variants (T-950C, G-1181C SNPs)
181
through bone. QUS measurements were performed on a Hologic Sahara (Hologic,
Bedford, MA, USA). The Sahara Clinical Bone Sonometer consists of two transducers,
which one transducer acts as a transmitter and the other as a receiver. The transducers
are coupled acoustically to the heel based on coupling gel. Both broadband ultrasound
attenuation (BUA, dB/MHz) and speed of sound (SOS, m/s) were measured at a fixed
region of interest in the midcalcaneus. BUA and SOS are combined and reported as an
estimated heel BMD with T-score using the following equation:
Estimated heel BMD (g/cm2) =0.002592*(BUA+SOS)-3.687 (Cummings et al., 1995).
Estimated heel BMD is not an actual calcaneal BMD, but the combination of BUA and
SOS. However, we did not report estimated heel BMD in the present study.
c. Coronary calcification Measurement
The EBT scan was performed using Imatron C-150 scanner (Imatron Inc.; S. San
Francisco, CA) at the University of Pittsburgh Preventive Heart Care Center. The 30 to
40 contiguous, 3-mm-thick transverse images were obtained during maximal
breathholding position. Scans were taken during the same phase of the cardiac cycle.
After careful skin preparation, the technologist placed electrode patches on the chest
and an optimum EKG tracing is obtained. The first picture is in order of calibrating the
scanner to the chest size of the participant. The second picture takes images of the
entire heart, taking a cross-sectional image every 3mm. The pictures are taken during
the diastolic phase of the cardiac cycle, one image during each heartbeat. Coronary
artery calcium score was generated using a Base Value Region of Interest computer
program. This program extracts all pixels above 130 Houndsfield units (HU) within an
operator-defined region of interest in each 3mm thick image of the coronary arteries.
The calcium score calculation follows: 1= 130-199 Houndsfield units (HU), 2 = 200-299
HU, 3=300-399 HU, and 4= over 400 HU (Agatson et al. 1990). The individual calcium
scores were summed for a total coronary calcium score. Any score greater than zero
can be considered as calcification in that interest region. Participants were exposed to a
moderate amount of radiation (0.407 rem). The EBT scans were reevaluated if
182
necessary. Intra-observer variability (r) was obtained by reanalysis of 10 participant EBT
scans and was r=0.9998.
d. Body weight and height
Body weight was recorded to the nearest 0.1 kg at baseline and second clinic
visit without shoes or any heavy clothing. (Balanced beam Scale). Body weight change
was calculated from body weight measured at the baseline and follow-up clinic visits.
Height was measured to the nearest 0.1 centimeters without shoes using wall mounted
Harpenden stadiometer (Holtain, Dyfed, UK) at the baseline and follow-up clinic exams.
Body mass index was calculated: body weight divided by height (Kg/m2).
2. Laboratory Methods
a. Sex steroid hormones measurement
Blood samples were obtained at the follow-up clinic exam between 8 am and 10
am after an overnight fast and stored at -70° until analysis. Samples were sent directly
to the analytical laboratory (Endocrine Science, Calabasas Hills, CA, USA) without
thawing. Total testosterone and estradiol was measured by radioimmunoassay after
extraction and purification by column chromatography. Bioavailable testosterone and
bioavailable estradiol were measured by separation of the sex hormone binding globulin
(SHBG) bound steroid from albumin bound and free steroid with ammonium sulfate
(Mayes et al., 1968). SHBG was precipitated by the addition of ammonium sulfate and
the samples were centrifuged. The bioavailable steroid concentration was then derived
from the product of the total serum steroid and the percent non-SHBG bound steroid
determined from the separation procedure.
b. Biochemical bone turnover markers
183

Serum osteocalcin concentrations were assayed by a radioimmunoassay (RIA)
using highly specific rabbit antibody raised against bovine osteocalcin (Esoterix,
Calabasas Hills, CA, USA). The lower limit of detection for osteocalcin is 0.5 ng/ml
when the usual 25µl serum aliquot is used. Intra- and inter-assay coefficients of
variation (CV) for osteocalcin are 4.3% and 10.0%, respectively. Urinary excretion of
type I collagen cross-linked N-telopeptides (NTx) were measured in an enzyme-linked
immnosorbent assay using a specific monoclonal antibody against the N-telopeptide
intermolecular cross-linking domain of type I collagen of bone labeled with horseradish
peroxidase enzyme (Osteomark, Ostex International, Inc, Seattle, WA). The urinary
creatinine levels were determined by a standard calibration method. NTx levels were
corrected for urinary creatinine excretion and expressed as nanomoles bone collagen
equivalents per liter (nM BCE) per millimole creatinine per liter (mM creatinine). The
sensitivity limit is 20 nmol/L BCE. Intra-and inter-assay coefficients of variation for NTx
are 2.9% and 5.6%, respectively.
c. Lipid measurement
Serum Levels of total cholesterol, HDL-C, HDL subfractions (HDL2, HDL3), and
triglycerides were measured in the lipid laboratory of the Graduate School of Public
Health, which had been certified by the Centers for Disease Control and Prevention,
Atlanta, Ga. LDL-C was estimated with the Friedewald equation (LDL-C = TC - HDL-C -
TG/2.2 (in mmol/L)) (Friedewald et al., 1972)
d. C-reactive protein measurement
Serum concentration of C-reactive protein was measured in the research
laboratory of the University of Vermont, Department of Pathology. C-reactive protein
levels were measuring using an enzyme-linked immunosorbent assay (ELISA)
developed in Laboratory for Clinical Biochemistry Research, University of Vermont
(Elizabeth et al., 1997). It is a colorimetric competitive immunoassay that uses purified
protein and polyclonal anti-CRP antibodies (Calbiochem-Novabiochem, La Jolla, CA).
184
The inter-assay coefficient of variation was 5.14%. Values are expressed as nanogram
per milideciliter.
3. Genetic analysis
a. DNA extraction
Blood sample obtained at the follow-up exam in the morning (between 8 am and
10 am) after an overnight fast. EDTA anti-coagulated whole blood (approx. 20ml) was
collected into sterile vacutainer tubes (purple top) by venipuncture, and immediately
centrifuged at 2,000 rpm for 20 minutes. Plasma and buffy coats were transferred to
cryotubes. High molecular weight genomic DNA was isolated from peripheral
lymphocytes harvested from the EDTA anti-coagulated whole blood using the salting
out method (Miller et al., 1988)
b. Osteoprotegerin Genotyping
The T/C transition located at position –950 in the promoter regions of OPG gene
was amplified by polymerase chain reaction (PCR) using the following primers (forward:
5’- CTT GTT CCT CAG CCC GGT GG-3’; reverse: 5’ – GGA GGG AGC GAG TGG
AGC CT-3’) in total volume of 50 ul buffer containing 0.1 microgram of genomic DNA,
10mM Tris-HCL (pH 8.0), 50mM KCl, 1.5mM MgCl2, 1% Triton X-100, 1 unit of Taq
DNA polymerase, and 200 uM each of the four deoxyribonucleotides (dNTP). PCR was
performed in initial 5-minute denaturation at 96°C following 35 cycles of denaturation at
95°C for 30 sec, annealing at 56°C for 30 sec, and extension at 72°C for 30 sec. (DNA
Engine Tetrad; MJ Research, Inc). The 15 ul of amplified product was digested with five
units of restriction endonuclease HincII (New England Biolabs Inc.) at 37°C during the
overnight. Digested products were separated on 2 % agarose gel containing thidium
bromide. The restriction fragments were visualized by ultraviolet illumination. Fragment
sizes were compared to a 1 kb ladder on the same gel. Absence of restriction site was
shown as “T”, and the presence of restriction site was shown as “C”.
185

The G/C polymorphism at position 1181 in exon 1 of OPG gene was genotyped
using HEFPTM (high efficiency fluorescence polarization) for SNP Genotyping method
(LJL BioSystems) that is modified method of Chen et al. (1999). HEFP based assay is
three step-SNP genotyping method, and the detailed principles can be found at LJL
BioSystem “SNP genotyping principle” (http://www.ljlbio.com/genomics/principle/). The
region including G-1181C of OPG gene was amplified by PCR using the following
primers (forward: 5’ – CGG GAC GCT ATA TAT AAC GTG – 3’, reverse: 5’-GGA
GGG AGC GAG TGG AGC C – 3’) in total volume of 10 ul buffer containing 0.1
microgram of genomic DNA, 10mM Tris-HCL (pH 8.0), 50mM KCl, 1.5mM MgCl2, 1%
Triton X-100, 1 unit of Taq DNA polymerase, and 200 uM each of the four
deoxyribonucleotides (dNTP). PCR steps was in initial 5 minute denaturation at 95°C
following 30 cycles of denaturation at 95°C for 45 sec, annealing at 56°C for 45 sec, and
extension at 72°C for 45 sec (DNA Engine Tetrad; MJ Research, Inc). Second step of
PCR is ‘the primer and dNTP degradation’ using 10X Shrimp Alkaline phosphatase
(SAP) buffer, 2 unit of alkaline phosphatase, and 0.1 unit of exonuclease I. Amplified
PCR product (final volume 20ul) was placed at 37°C for 90 min, and inactivate the
enzyme by heating the samples at 95°C for 15 min. Final step is ‘terminator base
addition’ using 10X ThermoSequenase buffer, 25 uM of two fluorescent dye-labeled
ddNTP (R110-ddC and TAMRA-ddG), 0.8 units of ThermoSequenase, and 10 uM of
internal detection primer (forward: 5’- CGG GGACCA CAA TGA ACA A -3’). 10ul of
reaction cocktail was added to previous 20 ul volume solution. PCR steps were 94°C
for 1 min following 35 cycles at 94°C for 10 sec, and at 46°C for 30 sec, and extension
at 74°C for 4 min. Then, the fluorescence polarization level (mP levels) of 30 ul of final
solution was measured using ‘Analyst’ software (LJL BioSystems). The mP value of the
two possible bases (C/G) incorporated was reported on a scatter plot with AlleleCaller™
software. Ambiguous genotypes were retyped. Sixteen random samples for T-950C, G-
1181C sites were genotyped again to monitor quality control.
186

4. Questionnaire information
Questionnaire at EBT measurement visit were delivered prior to clinic visit, and
reviewed at the clinic visit. To evaluate cardiovascular history, modified Rose
questionnaire was used (Rose, 1962).
a. Medical History
The medical history was obtained including a history of fractures since age 50,
osteoporosis, hypertension, heart attack, stroke, chronic obstructive pulmonary disease,
hypogonadism, diabetes, osteoarthritis, cancer, and rheumatoid arthritis at the baseline,
follow up, or EBT examination. A history of hypertension was defined as self-reported
hypertension or measured blood pressure greater than 160 mmHg for systolic blood
pressure, and greater than 95 mmHg for diastolic blood pressure. History of diabetes
was determined from self-reported diabetes or use of glucose lowering drug. History of
angina pectoris, congestive heart failure, rheumatic heart disease, heart murmur, leg
pains were obtained during the EBT clinic visit. Surgical procedure for cardiovascular
disease e.g. angioplasty, cartid endarterectomy, pacemaker implant, replacement of a
heart valve were ascertained during the EBT examination. Self perceived overall health
status from follow-up visit would be used (excellent/good vs. fair/poor/very poor).
Subclinical cardiovascular disease was only defined as the presence of Rose
questionnaire intermittent claudication positive, or Rose questionnaire angina positive.
Rose questionnaire (Rose, 1982) included the questions for angina, and pain of
possible heart attack (severe pain across the front of chest lasting half an hour or more).
The definition of Rose positive angina was determined as following algorithm: Pain
starts with exertion, causing the participant to stop or slow down. If the participant stops
or slows down, pain goes away within 10 minutes, and is located over the sternum or in
both left chest and arm. If the person fails to complete all questions but having pain,
the person is categorized as “exertional chest pain” without angina. Positive
questionnaire for intermittent claudication was defined as to complete the questions:
187

when pain occurred in either leg on walking, the pain did not begin when standing still or
sitting, the pain occurred in the calf (or calves), pain occurred either when the patient
walked uphill or hurried or hen walking at an ordinary pace on the level ground, the pain
did not disappear while walking, the pain caused to stop or slow down when the pain
occurred an the pain subsided within 10 minutes after the participant stopped walking.
b. Family Medical History
Family history of fracture, and osteoporosis were obtained at baseline and follow-
up examination. Family history (paternal, maternal and siblings) of coronary heart
disease among participants was collected at the baseline and EBT examination. A
premature cardiovascular family history (i.e. CVD before age 50) was also obtained. A
family history of osteoporosis was defined as either a maternal and paternal history of
fracture after age 50 or the presence of kyphosis.
c. Medication Use
Several prescription and over-the-counter medications were ascertained during
the baseline, follow-up, and EBT clinic examination. Participants were also asked to
bring their prescription and non-prescription medication to the clinic visit for verification.
Several medications that are known to affect calcium metabolism, BMD, lipid
metabolism were ascertained including thiazide diuretics, calcium and vitamin D
supplements, glucocorticoids, hypertensive medication, or lipid lowering drugs (HMG
CoA reductase inhibitor).
d. Smoking History
Current smoking (yes/no) and past use of cigarette was asked
(Never/past/current) at the baseline, follow-up and EBT clinic visit. Pack years for
smokers were estimated on following calculation: Pack-years = smoking duration *
188

number of cigarettes (1 pack = 20 cigarette). Men who smoked fewer than 100
cigarettes in their lifetime were considered never smokers.
e. Alcohol consumption
Current use of alcohol was ascertained at the baseline and follow-up clinic visit.
Alcohol intake among current drinker was measured as the number of drinks per week
in the past 30 days.
f. Dietary and supplemental calcium and vitamin D
Recent dietary calcium intake was estimated using standardized food models to
estimate portion size at the baseline examination (Glynn et al., 1995). Supplemental
calcium use recorded (Yes/no). During the follow-up examination, dietary intake of
calcium intake (past 12 months) was assessed using a checklist-interview method
(Block semi-quantitative food frequency questionnaire) developed from the NHANESII
survey (Block et al., 1986). The frequency and dose of calcium supplement use was
recorded. Total dietary intake was combined based on the calcium amount from dietary
intake and supplement calcium intake. Supplemental vitamin D was determined as yes
or no at the baseline examination. However, dietary intake of vitamin D and
supplemental use of vitamin D were assessed at the follow-up examination using same
method of calcium intake.
g. Physical activity
A modified version of the Paffenbarger questionnaire was used to assess current
leisure-time physical activity (Paffenbarger et al., 1978). The frequency and duration of
participation in physical activities during the past 12 months were recorded. A summary
estimated of total energy expenditure (kcal/day) was calculated (Paffenbarger et al.,
1978).
189

C. Data Analysis
1. Data Management
The study protocol was developed during the initial phase of the study and
modified during the study period. Coding schemes, and the glossary of important terms
were matched with previous clinic guidelines for standardizing the procedures. The
study forms were forwarded to Epidemiology Data Center (EDC), Graduate School of
Public Health. Computerized study forms were generated using software (POP) at the
EDC and entered. The quality control procedures including range checks, double entry
verification was performed and error reports were reviewed and explained. Entered,
verified and edited data were transferred to ASCII file to generated SAS system files.
Baseline and follow-up BMD data were obtained as electronic format (SAS transport
file) from UCSF to the University of Pittsburgh mainframe computer system. Standard
file transfer protocol was used. Baseline, follow-up and current visit data files were
merged with a unique five-digit subject identifier.
2. Statistical Analysis
a. General overview
We analyzed only Caucasian subjects in the STORM. We excluded two of the
144 men who completed the EBT examination because they did not participate a BMD
measurement either at baseline or follow-up examination. We excluded non-Caucasian
men n=3) because of their small sample size and significantly higher BMD than
Caucasian men. Three non-Caucasian men had higher BMD (1.06 ± 0.10 g/cm2) of the
total hip than mean values (0.96 ± 0.13 g/cm2) of Caucasian men. We further excluded
one man who was taking medications that influenced sex steroid hormones (anti-
androgen). Therefore, a total of 138 men were included in statistical analyses.
190

Descriptive statistics was computed and checked for normal distribution for
continuous data. Centrality (e.g. mean, medians) and dispersion (standard deviation,
ranges) was generated, and graphical displays including histograms, box plots were
produced. Frequency distributions were examined for categorical variables using chi-
square test for trend. All continuous variables and the residuals from linear regression
analysis were examined for normality by using graphical displays (i.e. normality plot),
skewness, kurtosis, and the Sapiro-Wilk test (W-statistics). Variables including lipid
levels, C-reactive protein, total coronary artery calcification (CAC) score were not
normally distributed so that they were transformed (e.g. log or power of 0.25
transformation). The normal distribution assumption for transformed variables was re-
assessed again by graphical displays (i.e. normality plot and normal quintile plot) and
Sapiro-Wilk test. Especially, transformed coronary calcification score was checked for
non-normality near two tails using a normal quintile plot.
Osteoprotegerin gene T/C transition polymorphism at –950 in the promoter
region and G/C substitution polymorphism at position 1181 in exon 1 were estimated by
gene-counting methods, and tested for Hardy-Weinberg equilibriums by a chi-square
goodness of fit statistic (p > 0.05). The strength of linkage disequilibrium between two
loci was assessed by using EH software for population genetic data analysis (http://
http://linkage.rockefeller.edu/ott/eh.htm) and following algorithms ((Devlin and Risch,
1995; Terwilliger and Ott, 1994; Hartl, 1999). Lewontin’s coefficients D’ was estimated
as D = xij-pipj, where xij is the frequency of haplotype A1B1, resulted from EH program,
and p1 and p2 are the frequencies of alleles A1(e.g. T allele) and B1 (e.g. G allele ) at loci
A (T-950C) and B (G-1181C), respectively. A standardized LD coefficients, r, is given by
D/(p1p2q1q2)1/2, where q1 (e.g. C allele) and q2 (e.g. C allele) are the frequencies of the
other alleles at loci A and B, respectively. D’ is given by D/D max, where D max =
min[p1p2,q1q2] when D < 0, and D max = min[q1p2, p1q2] when D> 0.
Intra-rater variability (r) in the evaluation of the electron-beam CT was calculated
based on ten EBT scanning results for each EBT technologists. We examined the
potential bias due to non-participation in our study sample by comparing selected
baseline and follow-up characteristics of subjects who did and did not participate the
191

EBT examination using T-test (or the non-parametric Wilcoxon Two sample test for
skewed variables) and Chi-square statistics (or, Fisher’s exact test), respectively.
As previous described in literatures, several factors associated with bone density
or coronary calcification including age, BMI, weight changes, measures of blood
pressure, smoking, alcohol consumption, presence of diabetes and hypertension, total
and LDL-c cholesterol, physical activity, were examined to determine a significance in
relationship to bone loss or coronary artery calcification (CAC) score. Simple correlation
coefficients analysis (Pearson, or Spearman Rank correlation for skewed variables) was
employed to assess the significance levels. If a variable was significantly correlated with
annualized rate of change in BMD of the total hip and its subregion, or CAC score in
univariate model at P < 0.10, it was employed in forward stepwise regression model. A
total and partial contribution of multivariates (R2) was determined to explain the
variability of dependent variables.
b. Statistical Analysis for Primary Aims
Hypothesis # 1-a, b, c, & d: Men with lower BMD and higher bone loss will have
higher coronary calcium score in coronary arteries. Likewise, we hypothesized
that men with higher bone turnover marker (osteocalcin, N-telopeptide), and
lower heel ultrasound measurement would be associated with greater extent of
coronary calcium.
To examine the correlation between independent variables and dependent
variable (i.e. CAC score) visually, scatter plots and moving average plots were
produced. Unadjusted BMD of the total hip and sub-region (femur neck, trochanter, and
intertrochanter), bone loss, bone turnover marker, and heel ultrasound parameters
(BUA and SOS) in the sample was analyzed in relationship with the transformed
coronary calcium score using correlation coefficient analysis (Pearson or Spearman
correlation) at p < 0.05. Changes in bone mineral density were calculated as follows:
192

Annual percent changes = [(Second clinic visit BMD measurement – Baseline BMD
measurement) / (Baseline BMD)* Year] * 100
c. Statistical Analysis for secondary specific aims
Because we failed to prove specific aims 1, we were not able to examine the
underlying etiologic factors (specific aims 2) to explain the possible correlation between
measures of bone strength and CAC. Therefore, we examined an independent
relationship of sex steroid hormones and inflammatory response marker (CRP), and
OPG gene polymorphisms to BMD or to coronary calcification, respectively.
Hypothesis # 2-a: With serum sex steroid hormones (estrogen), C-reactive
protein, BMD, and coronary calcification, we specifically hypothesized that men
with lower estrogen level and higher CRP will have lower BMD, and higher
coronary calcification.
Correlation coefficients analyses (Pearson or Spearman Rank) were used to test
for significant relationship between sex steroid hormones, CRP, BMD, and bone loss.
Partial correlation coefficients analyses were used to adjust for age and body weight for
any significant relationship between sex steroid hormones, CRP and bone. Same
strategies were applied to test a significant relationship between sex steroid hormones
and CAC score.
Hypothesis # 2-b & c. With genetic polymorphisms of osteoprotegerin locus,
BMD, and coronary calcification, we hypothesized that men with C/C genotype of
T-950C polymorphism and G-1181C polymorphisms of OPG gene will have higher
BMD, lower bone loss, and lower coronary calcification score.
Genotypes were designated as T/T, T/C, and C/C in T-950C polymorphism and
G/G, G/C, and C/C of G-1181C polymorphism. First, we determined whether
characteristics of participants differed by OPG genotypes to identify covariates to
193
include in subsequent multivariate analyses. One-way analysis of variance (ANOVA) or
non-parametric Kruskal-Wallis test was used to test the equality of means or median
across OPG genotypes. To test for significant differences in categorical variables, chi-
square statistics or Fisher’s exact test were used across OPG genotypes. Analysis of
covariance (ANCOVA) was used to adjust the dependent variables (BMD, bone loss) for
significant covariates (e.g. thiazide diuretics) that differed across genotypes at the
significance level of 0.10. To examine the significant differences in transformed CAC
scores across OPG genotypes, we used one-way analysis of variance or analysis of
covariance adjusting for age only.
d. Statistical Power
Sample size was estimated to determine the number of subjects for our primary
aims and secondary aims using PASS statistical software (Version 6.0; NCSS,
Kaysville, UT). Sample size was calculated to determine to detect a significant
relationship using correlation analysis, and multiple regression analysis.
To examine the adequate power in a multiple regression analysis in total sample, we
calculated sample size requirement for regression method. Sample size calculation is
presented assuming addition of five potential covariates, including age, BMI, smoking,
triglycerides, and diabetes (or possible variables) into one independent variable (BMD,
or estradiol etc). Even for small improvement of model (R2=0.2) with incorporation of
covariates, approximately 150 subjects were necessary to estimate regression
coefficients most likely covariates of the BMD- coronary calcification at the level of
α=0.05 (Table 21).
To estimate the minimal detectable difference for secondary hypothesis, the
means and standard deviations from STORM cohort at follow-up visit was used. At the
significance level of 0.05, we have 80% power to detect minimum 0.5 standard
deviations or greater difference in bone density between allelic variations (T vs C at T-
950C polymorphism) (Table 22)
194

Table 21. Multiple Regression Power Analysis
Variables Number R-Squared
Tested 1 0.05000 (BMD, or estradiol, etc)
Controlled 5 0.20000 (age, BMI, smoking, triglycerides, and diabetes)
Power N Alpha Lambda DF2 Beta
0.18144 50 0.01000 3.00000 43 0.81856
0.39502 50 0.05000 3.00000 43 0.60498
0.45856 100 0.01000 6.33333 93 0.54144
0.70215 100 0.05000 6.33333 93 0.29785
0.69047 150 0.01000 9.66667 143 0.30953
0.87039 150 0.05000 9.66667 143 0.12961 0.84102 200 0.01000 13.00000 193 0.15898
0.94819 200 0.05000 13.00000 193 0.05181
Table 22. Minimal detectable difference in hip BMD between OPG T and C allele
Numeric Results for Two-Sample T-Test
Null Hypothesis: BMD of T allele =BMD of C allele Alternative Hypothesis: Mean1<Mean2
The sigmas were assumed to be known and equal. The N's were allowed to be unequal.
Power N1 N2 Alpha Beta Mean1 Mean2 Sigma1 Sigma2
0.80202 123 60 0.01000 0.19798 0.96 1.03 0.14 0.14
0.80041 123 31 0.05000 0.19959 0.96 1.03 0.14 0.14
0.81014 123 22 0.10000 0.18986 0.96 1.03 0.14 0.14
195
Top Related