


Languages
Pages
Legal

CONCEPTUAL FRAMEWORK OF VALUATION
The term 'valuation' implies the task of estimating the worth/value of an asset, a security or a
business. The price an investor or a firm (buyer) is willing to pay to purchase a specific asset/
security would be related to this value. Obviously, two different buyers may not have the
same valuation for an asset/business as their perception regarding its worth/value may vary;
one may perceive the asset/business to be of higher worth (for whatever reason) and hence
may be willing to pay a higher price than the other. A seller would consider the negotiated
selling price of the asset/business to be greater than the value of the asset/business he is
selling.
Evidently, there are unavoidable subjective considerations involved in the task and process of
valuation. Inter-se, the task of business valuation is more awesome than that of an asset or an
individual security. In the case of business valuation, the valuation is required not only of
tangible assets (such as plant and machinery, land and buildings, office equipments, and so
on) but also of intangible assets (like, goodwill, brands, patents, trademark and so on) as well
as human resources that run/manage the business. Likewise, there is an imperative need to
take into consideration recorded liabilities as well as unrecorded/contingent liabilities so that
the buyer is aware of the total sums payable, subsequent to the purchase of business. Thus,
the valuation process is affected by, subjective considerations. In order to reduce the element
of subjectivity, to a marked extent, and help the finance manager to carry out a more credible
valuation exercise in an objective manner, the following concepts of value are explained in
this Section: (i) book value, (ii) market value, (iii) intrinsic value, (iv) liquidation value, (v)
replacement value, (vi) salvage value, (vii) value of goodwill and (viii) fair value.
Book Value
The book value of an asset refers to the amount at which an asset is shown in the balance
sheet of a firm. Generally, the sum is equal to the initial acquisition cost of an asset less
accumulated depreciation. Accordingly, this mode of valuation of assets is as per the going
concern principle of accounting. In other words, book value of an asset shown in balance
does not reflect its current sale value.

Book value of a business refers to total book value of all valuable assets (excluding fictitious
assets, such as accumulated losses and deferred revenue expenditures, like advertisement,
preliminary expenses, cost of issue of securities not written off) less all external liabilities
(including preference share capital). It is also referred to as net worth.
Market Value
In contrast to book value, market value refers to the price at which an asset can be sold in the
market. The market value can be applied with respect to tangible assets only; intangible assets
(in isolation), more often than not, do not have any sale value. Market value of a business
refers to the aggregate market value (as per stock market quotation) of all equity shares
"outstanding. The market value is relevant to listed companies only.
Intrinsic/Economic Value
The intrinsic value of an asset is equal to the present value of incremental future cash inflows
likely to accrue due to the acquisition of the asset, discounted at the appropriate required rate
of return (applicable to the specific asset intended to be purchased). It represents the
maximum price the buyer would be willing to pay for such an asset. The principle of
valuation based on the dis-counted cash flow approach (economic value) is used in capital
budgeting decisions.
In the case of business intended to be purchased, its valuation is equivalent to the present
value of incremental future cash inflows after taxes, likely to. accrue to the acquiring firm,
discounted at the relevant risk adjusted discount rate, as applicable to the acquired business.
The economic value indicates the maximum price at which the business can be acquired.
Liquidation Value
As the name suggests, liquidation value represents the price at which each individual asset
can be sold if business operations are discontinued in the wake of liquidation of the firm. In
operational terms, the liquidation value of a business is equal to the sum of (i) realisable
value of assets and (ii) cash and bank balances minus the payments required to discharge all

external liabilities. In general, among all measures of value, the liquidation value of an
asset/or business is likely to be the least.
Replacement Value
The replacement value is the cost of acquiring a new asset of equal utility and usefulness. It is
normally useful in valuing tangible assets such as office equipment and furniture and fixtures,
which do not contribute towards the revenue of the business firm.
Salvage Value
Salvage value represents realisable/scrap value on the disposal of assets after the expiry of
their economic useful life. It may be employed to value assets such as plant and machinery.
Salvage value should be considered net of removal costs.
Value of Goodwill
The valuation of goodwill is conceptually the most difficult. A business firm can be said to
have 'real' goodwill in case it earns a rate of return (ROR) on invested funds higher than the
ROR earned by similar firms (with the same level of risk). In operational terms, goodwill
results when the firm earns excess ('super') profits. Defined in this way, the value of goodwill
is equivalent to the present value of super profits (likely to accrue, say for 'n' number of years
in future), the discount rate being the required rate of return applicable to such business firms.
The value of goodwill in terms of the present value of super profits method can serve as a
useful benchmark in terms of the amount of .goodwill the firm would be willing to pay for
the acquired business. In the case of mergers and acquisition decisions, the value of goodwill
paid is equal to the net difference between the purchase price paid for the acquired business
and the value of assets acquired net of liabilities the acquiring firm has undertaken to pay for.
Fair Value
The concept of 'fair' value draws heavily on the value concepts discussed above, in particular,
book value, intrinsic value and market value. The fair value is hybrid in nature and often is
the average of these three values. In India, the concept of fair value has evolved from case
laws (and hence is more statutory in nature) and is applicable to certain specific transactions,
like payment to minority shareholders.
It may be noted that most of the concepts related to value are 'stock' based in that they are
guided by the worth of assets at a point of time and not the likely contribution they can make
towards earnings/cash flows of the business in the future. Ideally, business valuation should
be related to the cash flow generating ability of acquired business. The intrinsic value reflects
the firm's capacity to generate cash flows over the long-run and, hence, seems to be more
aptly suited for business valuation.
In fact, in general, business firms are not acquired with the intent to sell their assets in the
post-acquisition period. They are to be deployed primarily for generating more earnings.
However, from the conservative point of view, it will be useful to know the realisable value,
market value, liquidation value and other values, if the acquiring firm has to resort to
liquidation. In brief, the finance manager will find it useful to know business valuation from
different perspectives. For instance, the book value may be very relevant form accounting/tax
purposes; the market value may be useful in determining share exchange ratio and liquidation
value may provide an insight into the maximum loss, if the business is to be wound up.
APPROACHES/METHODS OF VALUATION
The various approaches to valuation of business with focus on equity share valuation are
examined in this Section. These approaches should not be considered as competing
alternatives to the dividend valuation model. Instead, they should be viewed as providing a
range of values, catering to varied needs, depending on the circumstances. The major
approaches, namely, the (i) asset based approach to valuation, (ii) earnings based approach to
valuation, (iii) market value based approach to valuation and (iv) the fair value method to
valuation are described below.
Asset-Based Approach to Valuation
Asset-based approach focuses on determining the value of net assets from the perspective of
equity share valuation. What should the basis of assets valuation be, is the central issue of this
approach. It should be determined whether the assets should be valued at book, market,
replacement or liquidation value. More often than not, they are (and should be) valued at
book value that is, original acquisition cost minus accumulated depreciation, as assets are
normally acquired with the intent to be used in business and not for resale. Thus, the
valuation of assets is based on the going concern concept. Some other value measure may be
used depending on circumstances of the case. For instance, if the plant and machinery has
outlived its economic useful life (earlier than its initial estimated period), and is not in use for
production, it will be in order to value the machinery at liquidation value.
Apart from tangible assets, intangible assets, such as goodwill, patents, trademark, brands,
know how, and so on, also need to be valued satisfactorily. It may be useful to adopt the super
profit method to value some of these assets.
To arrive at the net assets value, total external liabilities (including preference share capital)
payable are deducted from total assets (excluding fictitious assets). The company's net assets
are computed as per Equation
Net assets = Total assets - Total external liabilities
The value of net assets is also known as net worth or equity/ordinary shareholders’ funds.
Assuming the figure of net assets to be positive, it implies the value available to equity
shareholders after the payment of all external liabilities. Net assets per share can be obtained,
dividing net assets by the number of equity shares issued and outstanding. Thus,
Net assets per share = Net assets/Number of equity shares issued and outstanding
The value of net assets is contingent upon the measure of value adopted for the purpose of
valuation of assets and liabilities. In the case of book value, assets and liabilities are taken at
their balance sheet values. In the market value measure, assets shown in the balance sheet are
revalued at the current market prices. For the purpose of valuing assets, and liabilities, it will
be useful for a finance manager/valuer to accord special attention to the following points:
(i) While valuing tangible assets, such as plant and machinery, he should consider aspects
related to technological obsolescence and capital improvements made in the recent years.
Depreciation adjustment may also be needed in case the company is following unsound
depreciation policy in this regard.
(ii) Is the valuation of goodwill satisfactory, given the amount of profits, capital employed
and average rate of return available on such businesses?
(iii) With respect to current assets, are additional provisions required for "unrealisability"
of debtors? Likewise, are adjustments required for "unsaleable" stores and stock?
(iv) With respect to liabilities, there is a need for careful examination of 'contingent
liabilities', in particular when there is mention of them in the auditor's report, with a view to
assess what portion of such liabilities may fructify. Similarly, adjustments may be required on
account of guarantees invoked, income tax, sales tax and other tax liabilities that may arise.
The net assets valuation based on book value is in tune with the going concern
principle of. accounting. In contrast, liquidation value measure is guided by the realisable
value available on the winding up/liquidation of a corporate firm.
Liquidation value is the final net asset value (if any) per share available to the equity
shareholder. The value is given as per Equation.
Net assets per share = (Liquidation value of assets - Liquidation expenses - Total external
liabilities)/Number of equity shares issued and outstanding.
In the case of liquidation, assets are likely to be sold through an auction. In general, they are
likely to realise much less than their market values. This apart, sale proceeds from assets are
further dependent on whether the company has been forced to go into liquidation or has
voluntarily liquidated. In the case of the 'former' type of liquidation, the realisable value is
likely to be still lower.
The net asset value (NAV) per share will be the lowest under the liquidation value measure
(Example).
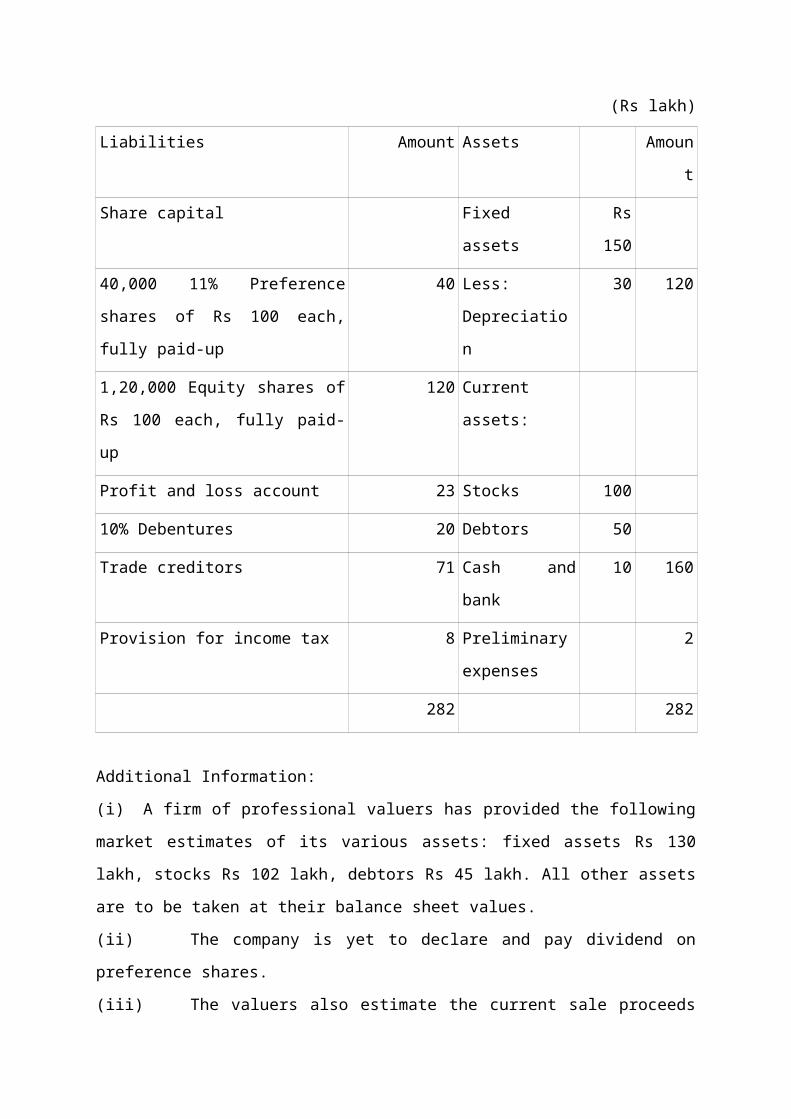
(Example Following is the balance sheet of Hypothetical Company Limited as on March
31, current year:

(Rs lakh)
Liabilities Amount Assets Amount
Share capital Fixed assets Rs 150
40,000 11% Preference shares of Rs
100 each, fully paid-up
40 Less:
Depreciation
30 120
1,20,000 Equity shares of Rs 100
each, fully paid-up
120 Current assets:
Profit and loss account 23 Stocks 100
10% Debentures 20 Debtors 50
Trade creditors 71 Cash and bank 10 160
Provision for income tax 8 Preliminary
expenses
2
282 282
Additional Information:
(i) A firm of professional valuers has provided the following market estimates of its
various assets: fixed assets Rs 130 lakh, stocks Rs 102 lakh, debtors Rs 45 lakh. All other
assets are to be taken at their balance sheet values.
(ii) The company is yet to declare and pay dividend on preference shares.
(iii) The valuers also estimate the current sale proceeds of the firm's assets, in the event of
its liquidation: fixed assets Rs 105 lakh, stock Rs 90 lakh, debtors Rs 40 lakh. Besides, the
firm is to incur Rs 15 lakh as liquidation costs.
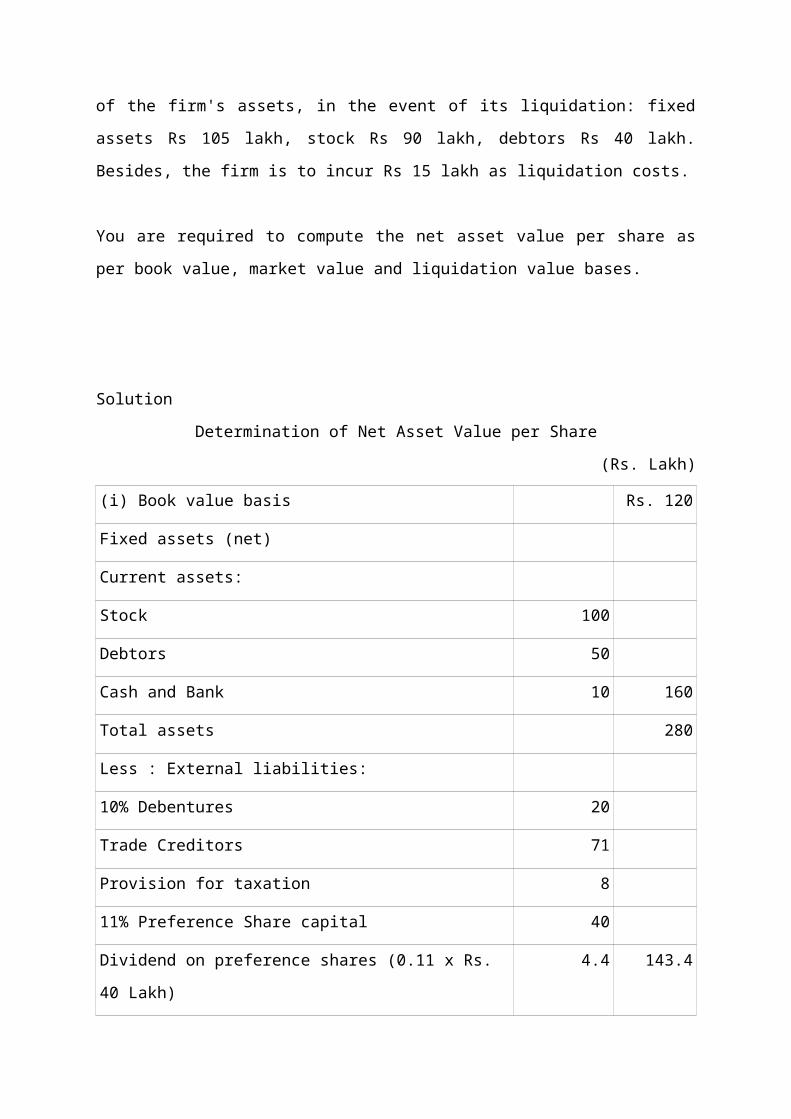
You are required to compute the net asset value per share as per book value, market value and
liquidation value bases.
Solution
Determination of Net Asset Value per Share
(Rs. Lakh)

(i) Book value basis Rs. 120
Fixed assets (net)
Current assets:
Stock 100
Debtors 50
Cash and Bank 10 160
Total assets 280
Less : External liabilities:
10% Debentures 20
Trade Creditors 71
Provision for taxation 8
11% Preference Share capital 40
Dividend on preference shares (0.11 x Rs. 40 Lakh) 4.4 143.4
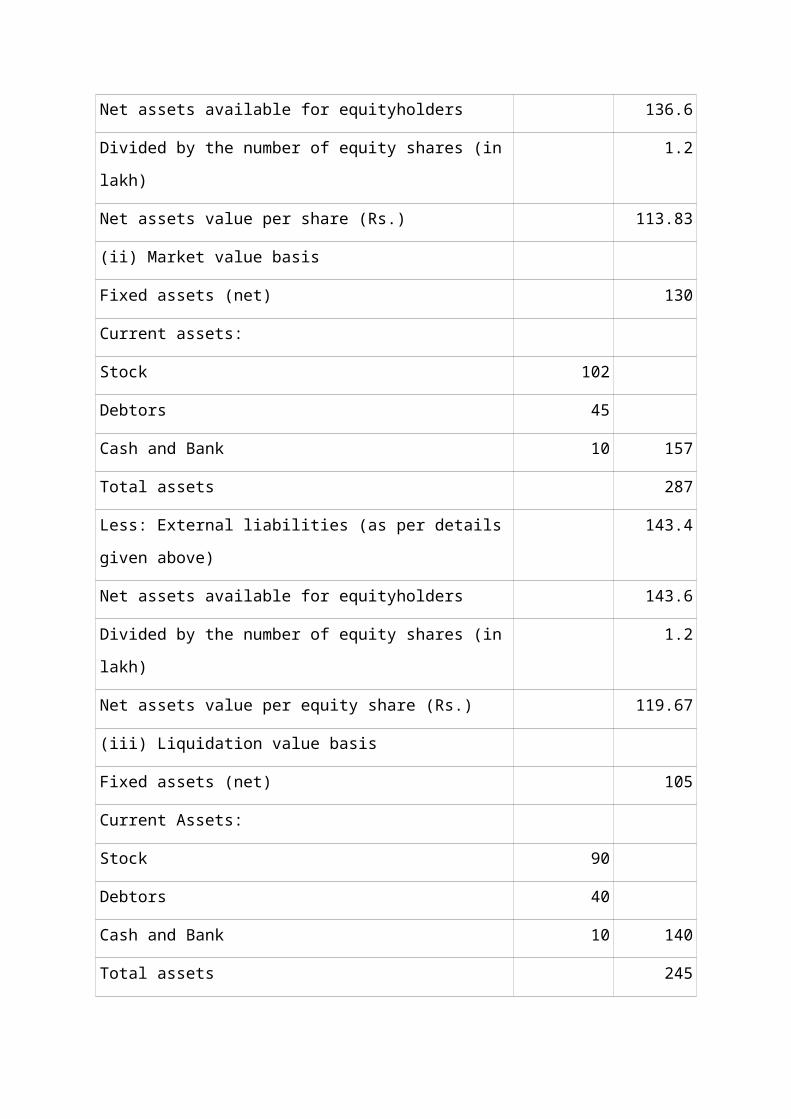
Net assets available for equityholders 136.6
Divided by the number of equity shares (in lakh) 1.2
Net assets value per share (Rs.) 113.83
(ii) Market value basis
Fixed assets (net) 130
Current assets:
Stock 102
Debtors 45
Cash and Bank 10 157
Total assets 287
Less: External liabilities (as per details given above) 143.4
Net assets available for equityholders 143.6
Divided by the number of equity shares (in lakh) 1.2
Net assets value per equity share (Rs.) 119.67
(iii) Liquidation value basis
Fixed assets (net) 105
Current Assets:
Stock 90
Debtors 40
Cash and Bank 10 140
Total assets 245
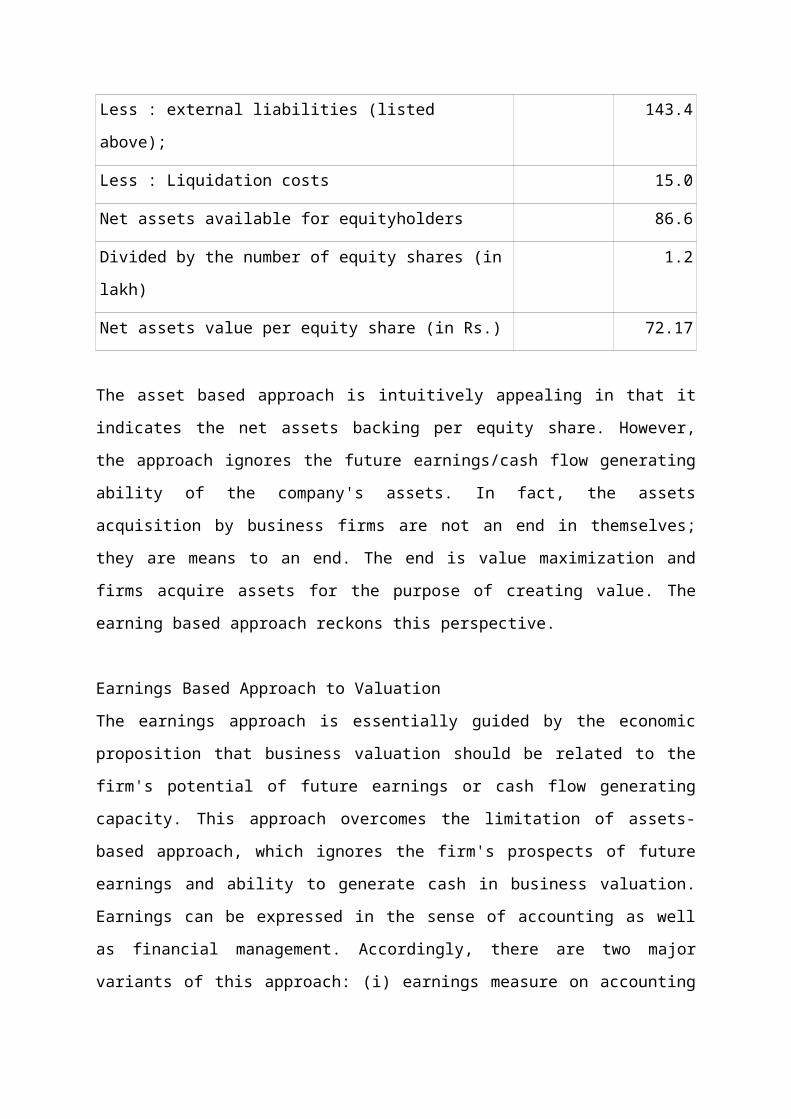
Less : external liabilities (listed above); 143.4
Less : Liquidation costs 15.0
Net assets available for equityholders 86.6
Divided by the number of equity shares (in lakh) 1.2
Net assets value per equity share (in Rs.) 72.17
The asset based approach is intuitively appealing in that it indicates the net assets backing per
equity share. However, the approach ignores the future earnings/cash flow generating ability
of the company's assets. In fact, the assets acquisition by business firms are not an end in
themselves; they are means to an end. The end is value maximization and firms acquire assets
for the purpose of creating value. The earning based approach reckons this perspective.
Earnings Based Approach to Valuation
The earnings approach is essentially guided by the economic proposition that business
valuation should be related to the firm's potential of future earnings or cash flow generating
capacity. This approach overcomes the limitation of assets-based approach, which ignores the
firm's prospects of future earnings and ability to generate cash in business valuation. Earnings
can be expressed in the sense of accounting as well as financial management. Accordingly,
there are two major variants of this approach: (i) earnings measure on accounting basis and
(ii) earnings measure on cash flow (financial management) basis.
Earnings Measure Based on Accounting—Capitalisation Method As per this method, the
earnings approach of business valuation is based on two major parameters, that is, the
earnings of the firm and the capatilisation rate applicable to such earnings (given the level of
risk) in the market. Earnings, in the context of this method, are the normal expected annual
profits. Normally to smoothen out the fluctuations in earnings, the average of past earnings
(say, of the last three to five years) is computed.
Apart from averaging, there is an explicit need for making adjustments, to the profits of the
past years, in extraordinary items (which are not likely to occur in the future), with a view to
arriving at credible future maintainable profits. The notable examples of extraordinary/non-
recurring items - include profits from the sale of land, losses due to sale of plant and
machinery, abnormal loss due to major fire, theft or natural calamities, substantial
expenditure incurred on the voluntury retirement scheme (not to be repeated) and abnormal
results due to strikes and lock-outs of major competing firm(s). Obviously, their non-
exclusion will cause distortion in determining sustainable future earnings.
Above all, it will be useful to understand the profile of the business, focussing on identifying
the major growth and income drivers. Are such drivers likely to continue in future years? If
not, projected profits need to be discounted. Finally, additional income expected in the
coming years— say, due to launch of a new product—should also be considered. In brief, the
valuer should try to familiarise himself or herself with all major factors/events that had
affected the profits of the business in the past year(s) and are likely to affect them in the
future years too.
Determination of appropriate capitalisation rate is another major requirement of this
approach. Capitalisation rate, normally expressed in percentages, refers to the investment
sum, that an investor is willing to make to earn a specified income. For instance, 12.5 per
cent capitalisation rate implies that an investor is prepared to invest Rs 100 to earn an income
of Rs 12.5 or an acquiring firm is prepared to invest Rs 100 to buy the expected profits of Rs
12.5 of another business.
Given the risk return framework of financial decision making, businesses that exhibit (or are
exposed to) higher business and financial risks obviously warrant a higher capitalisation
factor. Conversely, businesses carrying a low degree of risk are subject to lower capitalisation
factor. There are a host of factors that affect the risk complexion including fluctuation in
sales/earnings, degree of operating leverage, degree of financial leverage, nature of
competition, availability of substitute products and their prices, pace of change in technology
and the level of governmental regulations. Thus, there are a number of internal and external
factors associated with a business that can influence the risk and, hence, the capitalisation
factor.
The determination of the capitalisation factor is not an easy task in practice. A few guidelines/
principles may, however, be helpful to the valuer in its quantification. First, the capitalisation
factor for a business firm should be higher than that of a government security (normally
considered riskless). Secondly, the capitalisation factor should match/hover around the one
that is used for other firms operating in similar type of businesses. In case the valuer wants to
apply different capitalisation rate, there should be weighty and convincing reasons to do so.
For instance, firms having the potential and prospects of achieving abnormal growth rates
(for reasons that are firm specific), vis-a-vis other firms in the industry, managed by a well
known management team (having a good track record), may have low capitalisation factor
and vice versa.
Having determined the two major inputs, Equation, can be used to compute the value of
business ,VB, (from the perspective of share owners).
VB = Future maintainable profits / Relevant capitalisation factor
Example. In the current year, a firm has reported a profit of Rs 65 lakh, after paying taxes @
35 per cent. On close examination, the analyst ascertains that the current year's income
includes: (i) extraordinary income of Rs 10 lakh and (ii) extraordinary loss of Rs 3 lakh.
Apart from existing operations, which arc-normal in nature and are likely to continue in the
future, the company expects to launch a new product in the coming year.
Revenue and cost estimates in respect of the new product are as follows: (Rs lakh)
Sales 60
Material Cost 15
Labour Cost (additional) 10
Allocated fixed costs 5
Additional fixed costs 8
From the given information, compute the value of the business, given that capitalisation rate
applicable to such business in the market is 15 per cent.
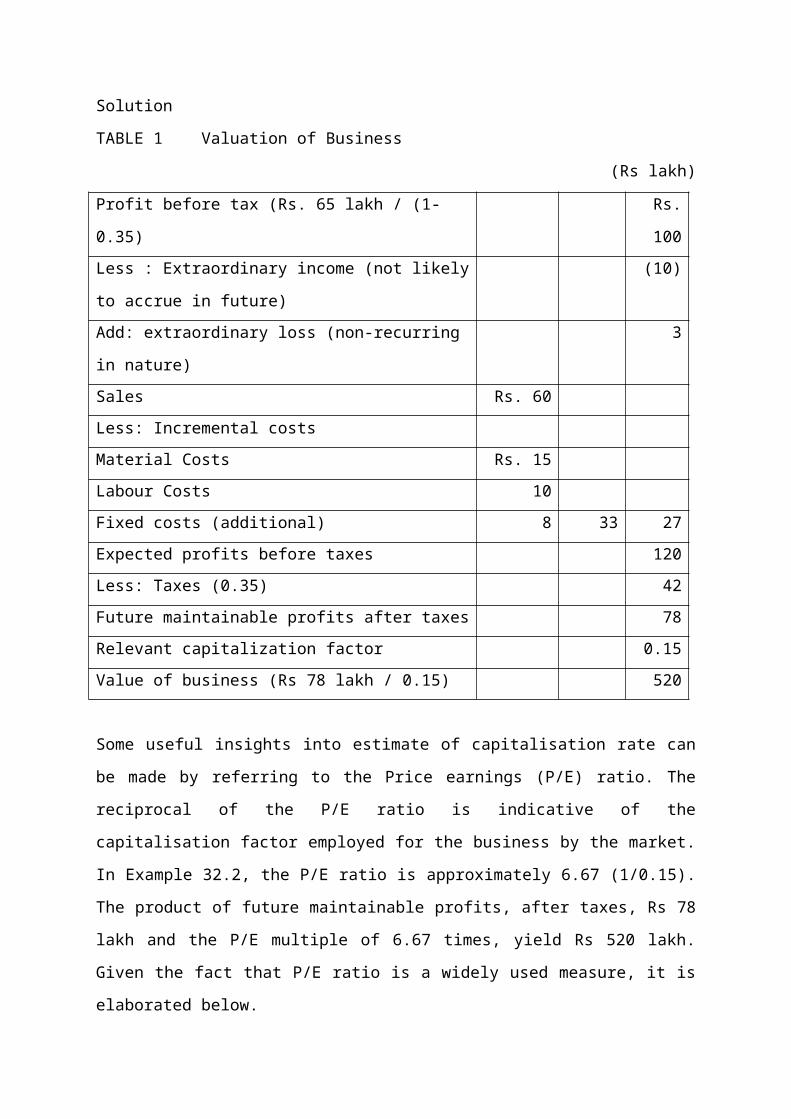
Solution
TABLE 1 Valuation of Business
(Rs lakh)
Profit before tax (Rs. 65 lakh / (1-0.35) Rs. 100
Less : Extraordinary income (not likely to accrue in
future)
(10)
Add: extraordinary loss (non-recurring in nature) 3
Sales Rs. 60
Less: Incremental costs
Material Costs Rs. 15
Labour Costs 10
Fixed costs (additional) 8 33 27
Expected profits before taxes 120
Less: Taxes (0.35) 42
Future maintainable profits after taxes 78
Relevant capitalization factor 0.15
Value of business (Rs 78 lakh / 0.15) 520
Some useful insights into estimate of capitalisation rate can be made by referring to the Price
earnings (P/E) ratio. The reciprocal of the P/E ratio is indicative of the capitalisation factor
employed for the business by the market. In Example 32.2, the P/E ratio is approximately
6.67 (1/0.15). The product of future maintainable profits, after taxes, Rs 78 lakh and the P/E
multiple of 6.67 times, yield Rs 520 lakh. Given the fact that P/E ratio is a widely used
measure, it is elaborated below.
Price Earnings (P/E) Ratio The P/E ratio (also known as the P/E multiple) is the method most
widely used by finance managers, investment analysts and equity shareholders to arrive at the
market price of an equity share. The application of this method primarily requires the
determination of earnings per equity share (EPS). The EPS is computed as per Equation.
EPS = Net earnings available to equity shareholders during the period
Number of equity shares outstanding during the period.
The net earnings/profits are after deducting taxes, preference dividend, and after adjusting for
exceptional and extraordinary items (related to both incomes and expenses/losses) and
minority interest. Likewise, appropriate adjustments should be made for new equity issues or
buybacks of equity shares made during the period to determine the number of equity shares.
The EPS is to be multiplied by the P/E ratio to arrive at the market price of equity share
(MPS).
MPS = EPS x P/E ratio ($2.6)
A high P/E multiple is suggested when the investors are confident about the company's future
performance/prospects and have high expectations of future returns; high P/E ratios reflect
optimism. On the contrary, a low P/E multiple is suggested for shares of firms in which
investors have low confidence as well as expectations of low returns in future years; low P/E
ratios reflect pessimism.
The P/E ratio may be derived given the MPS and EPS.
P/E ratio = MPS/EPS
The future maintainable earnings/projected future earnings should also be used to determine
UPS. It makes economic sense in that investors have access to future earnings only. There is a
financial and economic justification to compute forward or projected P/E ratios with
reference to projected future earnings, apart from historic P/E ratios. This is all the more true
of present businesses-that operate in a highly turbulent business environment. Witness in this
context, the following: "In a dynamic business world, a firm's past earnings record may not
be an appropriate guide to its future earnings. For example, past earnings may have been
exceptional due to a period of rapid growth. This may not be sustainable in the future.
The P/E ratios should, however, be used with caution as the published P/E multiples are
normally based on the published financial statements of corporate enterprises. Obviously,
earnings are not adjusted for extraordinary items and, therefore, to that extent, may be
distorted. Besides, all financial fundamentals are often ignored in published data. Finally,
they reflect market sentiments, moods and perceptions. For instance, if investors are upbeat
about retail stocks, the P/E ratios of these stocks will be higher to reflect this optimism. This
can be viewed as a weakness as well, in particular when markets make systematic errors in
valuing entire sector. Assuming retail stocks have been overvalued, this error has to be built
into die valuation also.

In spite of these limitations attributed to the P/E ratio, it is the most widely used measure of
valuation.- The major plausible reasons are: (i) It is intuitively appealing in that it relates
price to earnings, (ii) It is simple to compute and is conveniently available in terms of
published data. (iii) It can be a proxy for a number of other characteristics of the. firm,
including risk and growth.
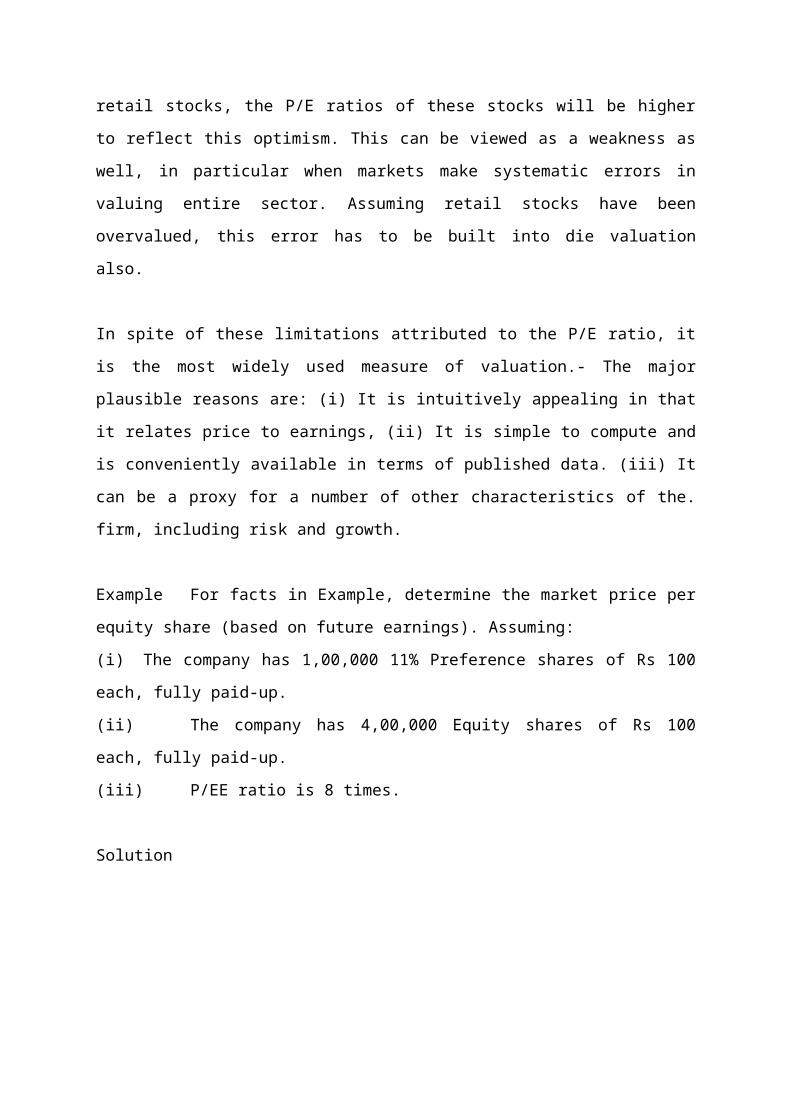
Example For facts in Example, determine the market price per equity share (based on
future earnings). Assuming:
(i) The company has 1,00,000 11% Preference shares of Rs 100 each, fully paid-up.
(ii) The company has 4,00,000 Equity shares of Rs 100 each, fully paid-up.
(iii) P/EE ratio is 8 times.
Solution

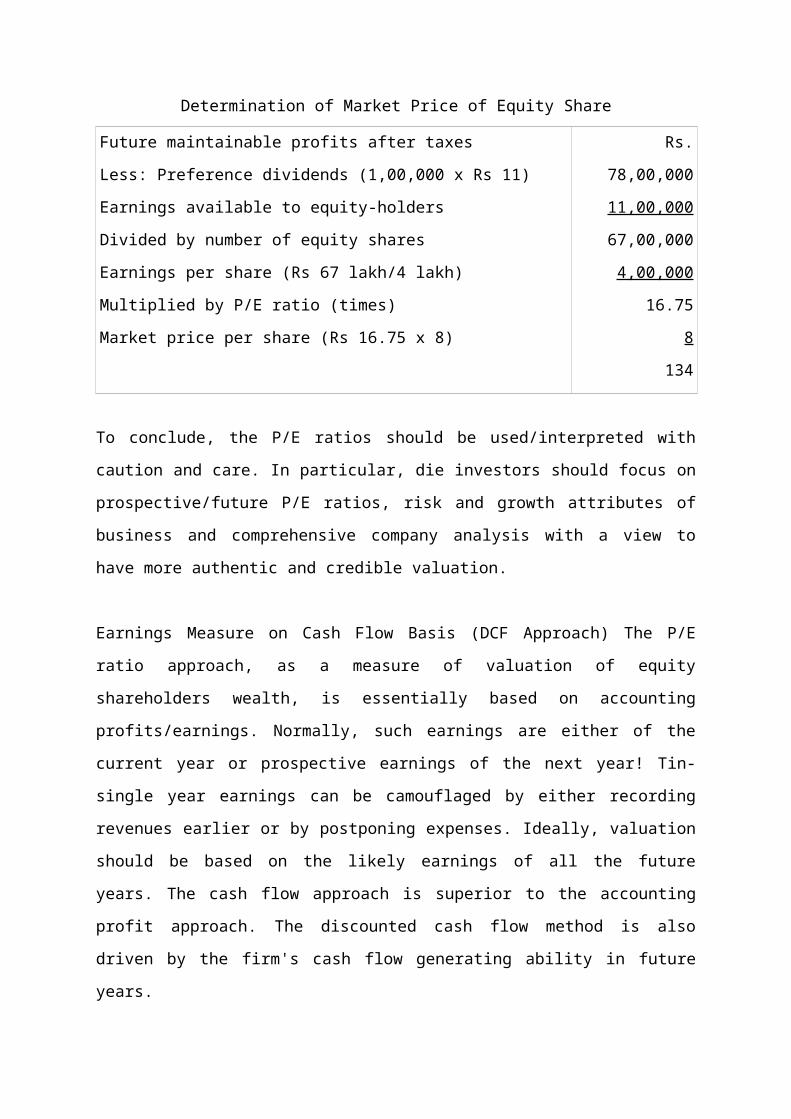
Determination of Market Price of Equity Share
Future maintainable profits after taxes
Less: Preference dividends (1,00,000 x Rs 11)
Earnings available to equity-holders
Divided by number of equity shares
Earnings per share (Rs 67 lakh/4 lakh)
Multiplied by P/E ratio (times)
Market price per share (Rs 16.75 x 8)
Rs. 78,00,000
11,00,000
67,00,000
4,00,000
16.75
8
134
To conclude, the P/E ratios should be used/interpreted with caution and care. In particular, die
investors should focus on prospective/future P/E ratios, risk and growth attributes of business
and comprehensive company analysis with a view to have more authentic and credible
valuation.
Earnings Measure on Cash Flow Basis (DCF Approach) The P/E ratio approach, as a measure
of valuation of equity shareholders wealth, is essentially based on accounting
profits/earnings. Normally, such earnings are either of the current year or prospective
earnings of the next year! Tin-single year earnings can be camouflaged by either recording
revenues earlier or by postponing expenses. Ideally, valuation should be based on the likely
earnings of all the future years. The cash flow approach is superior to the accounting profit
approach. The discounted cash flow method is also driven by the firm's cash flow generating
ability in future years.
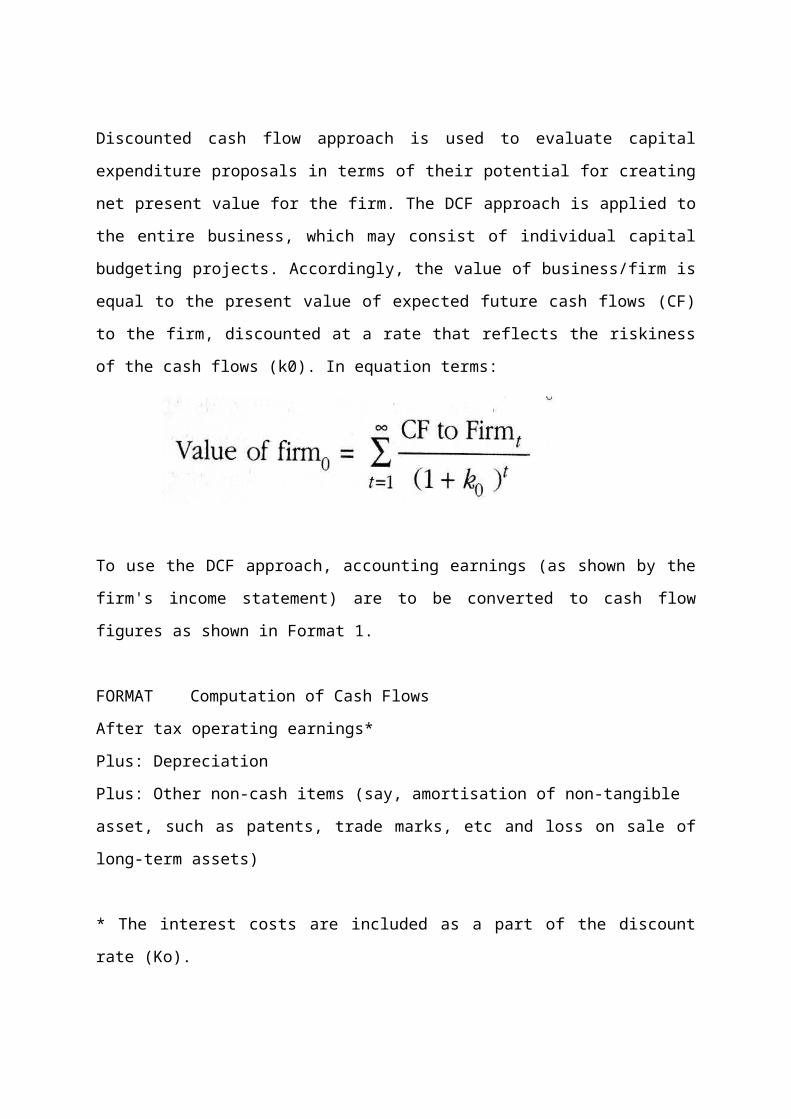
Discounted cash flow approach is used to evaluate capital expenditure proposals in terms of
their potential for creating net present value for the firm. The DCF approach is applied to the
entire business, which may consist of individual capital budgeting projects. Accordingly, the
value of business/firm is equal to the present value of expected future cash flows (CF) to the
firm, discounted at a rate that reflects the riskiness of the cash flows (k0). In equation terms:

To use the DCF approach, accounting earnings (as shown by the firm's income statement) are
to be converted to cash flow figures as shown in Format 1.
FORMAT Computation of Cash Flows
After tax operating earnings*
Plus: Depreciation
Plus: Other non-cash items (say, amortisation of non-tangible
asset, such as patents, trade marks, etc and loss on sale of long-term assets)
* The interest costs are included as a part of the discount rate (Ko).
However, analysts/valuers prefer to discount expected future free cashflows (FCFF) to
operating cash flows (as per Format) for the purpose of firm valuation. The reason is that
firms, in general, are required to make investments in long-term assets as well as in working
capital to generate/earn future cash flows; hence, the need for adjusting operating cash flows
to free cash flows.
Format shows computation of operating free cash flows (OFCF) for the purpose of valuation
of a business.
FORMAT 1 Determination of Operating Free Cash Flows (OFCFF)
After tax operating earnings*
Plus: Depreciation, amortisation and other non-cash items
Less: Investments in long-term assets
Less: Investments in operating net working capital**
Operating free cash flows (OFCFF)
*Exclusive of income from (i) marketable securities and non-operating investments and (ii)
extraordinary incomes or losses.
**Addition is to be made in the event of decrease of net working capital.
The free cash flow (FCFF) is the legitimate cash flow for the purpose of business valuation in
that it reflects the cash flows generated by a company's operations for all the providers (debt
and equity) of its 'capital'6. The FCFF is a more comprehensive term as it includes cash flows

due to after tax non-operating income as well as adjustments for non-operating assets. Format
3 exhibits the procedure of determining FCFF.
FORMAT 2 Determination of Free Cash Flows (FCFF)
Operating free cash flows (as per Format 2)
Plus: After tax non-operating income/cash flows
Plus: Decrease (minus increase) in non-operating
Assets, say marketable securities
Free cash flows to Firm (FCFF)
*Non-operating income (1 - tax rate)
Since the FCFFs are available to all the capital providers of a corporate enterprise, the
discount rate to be applied to such cash flows should be indicative of the opportunity cost of
the funds made available by them, weighted by their relative contribution to the total capital
of a corporate enterprise. The opportunity cost is equivalent to the rate of return the investors
expect to earn on other investments of equivalent risk. The cost to the firm equals the
investors' cost less any tax benefits received by the company itself (say, tax advantage on the
payment of interest) plus any tax payments required to be made (say, dividend payment tax).
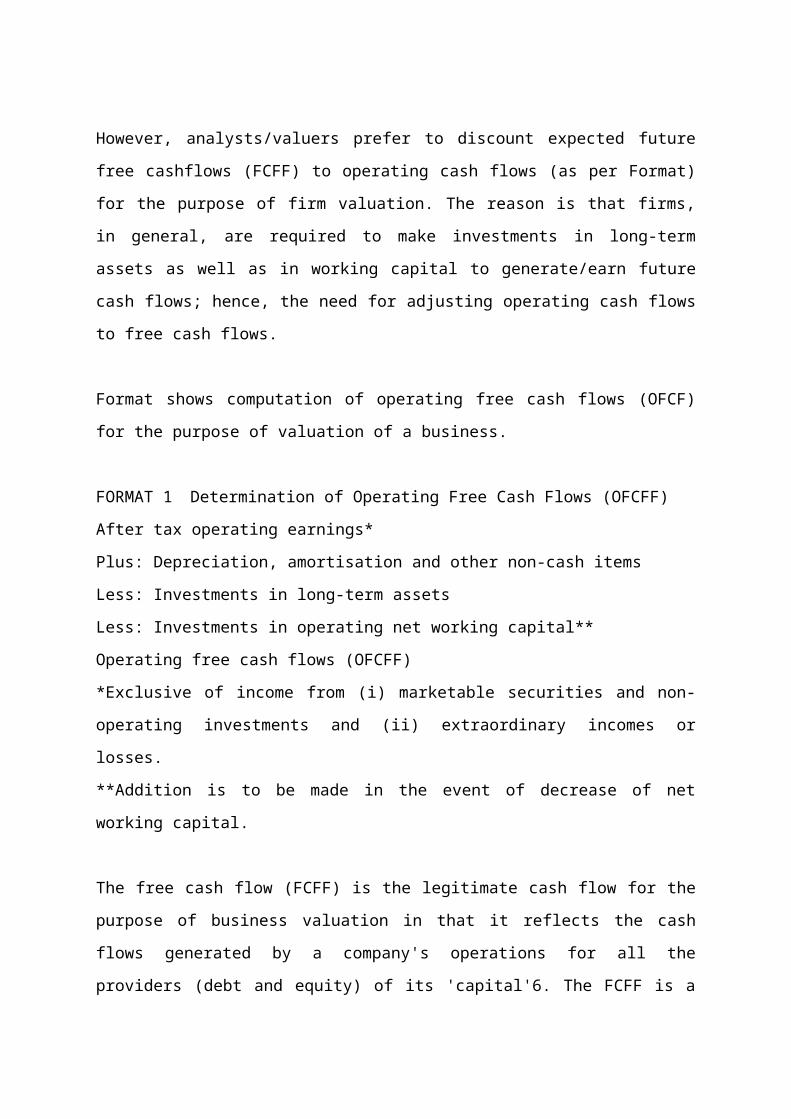
The value of the firm is given by Equation
Thus, the value of a firm is the present value of FCFF through infinity. The equity valuation
can be deduced by subtracting the total external liabilities (debtholders and preference
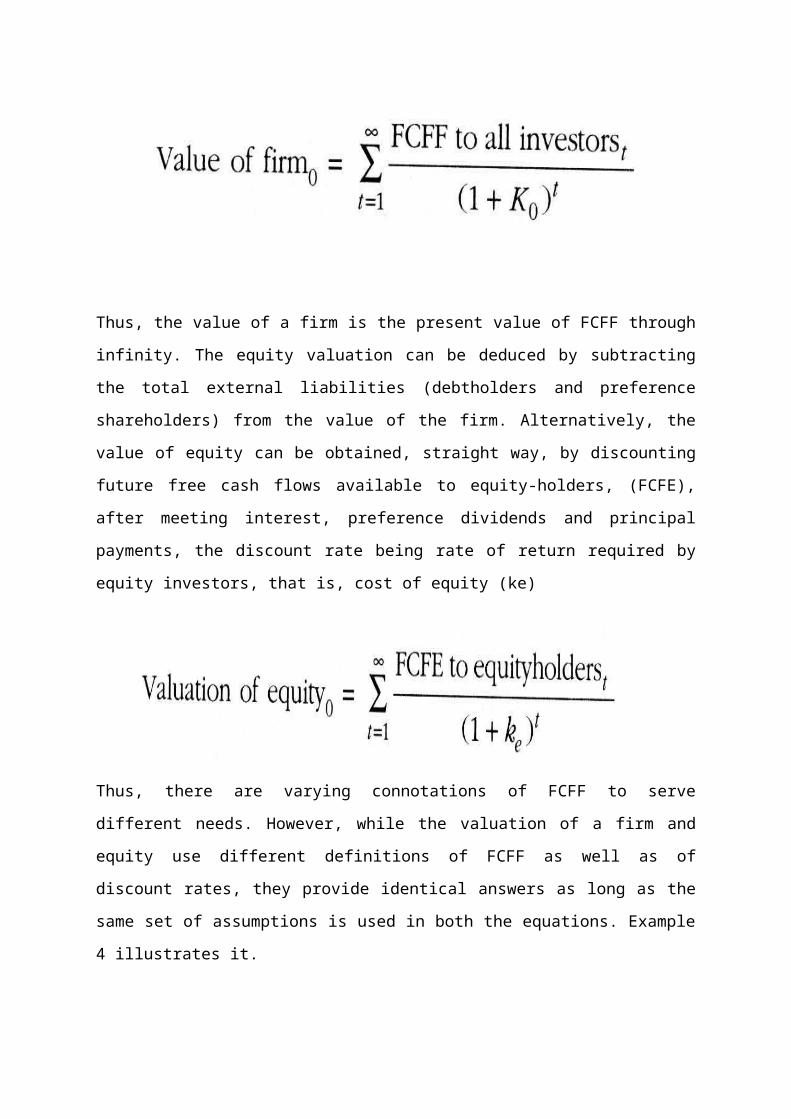
shareholders) from the value of the firm. Alternatively, the value of equity can be obtained,
straight way, by discounting future free cash flows available to equity-holders, (FCFE), after
meeting interest, preference dividends and principal payments, the discount rate being rate of
return required by equity investors, that is, cost of equity (ke)
Thus, there are varying connotations of FCFF to serve different needs. However, while the
valuation of a firm and equity use different definitions of FCFF as well as of discount rates,
they provide identical answers as long as the same set of assumptions is used in both the
equations. Example 4 illustrates it.
Example 4 Suppose a firm has employed a total capital of Rs 1,000 lakh (provided equally by
10 per cent debt and 5 lakh equity shares of Rs 100 each), its cost of equity is 14 per cent and
it is subject to corporate tax rate of 40 per cent. The projected free cash flows to all investors
of the firm for 5 years are given in the table:
(Rs. Lakh)
Year-end 1 Rs. 300
2 200
3 500
4 150
5 600
Compute (i) valuation of firm and (ii) valuation from the perspective of equityholders.
Assume 10 percent debt is rapayable at the year-end 5 and interest is paid at each year-end.
Solution
(i) Computation of Overall Cost of Capital
Source of capital After tax cost (%) Weights Total cost (%)
Equity 14 0.5 7
Debt 6* 0.5 3
Weighted average cost of capital (ko) 10
*10% (1-0.4 tax rate) = 6 percent
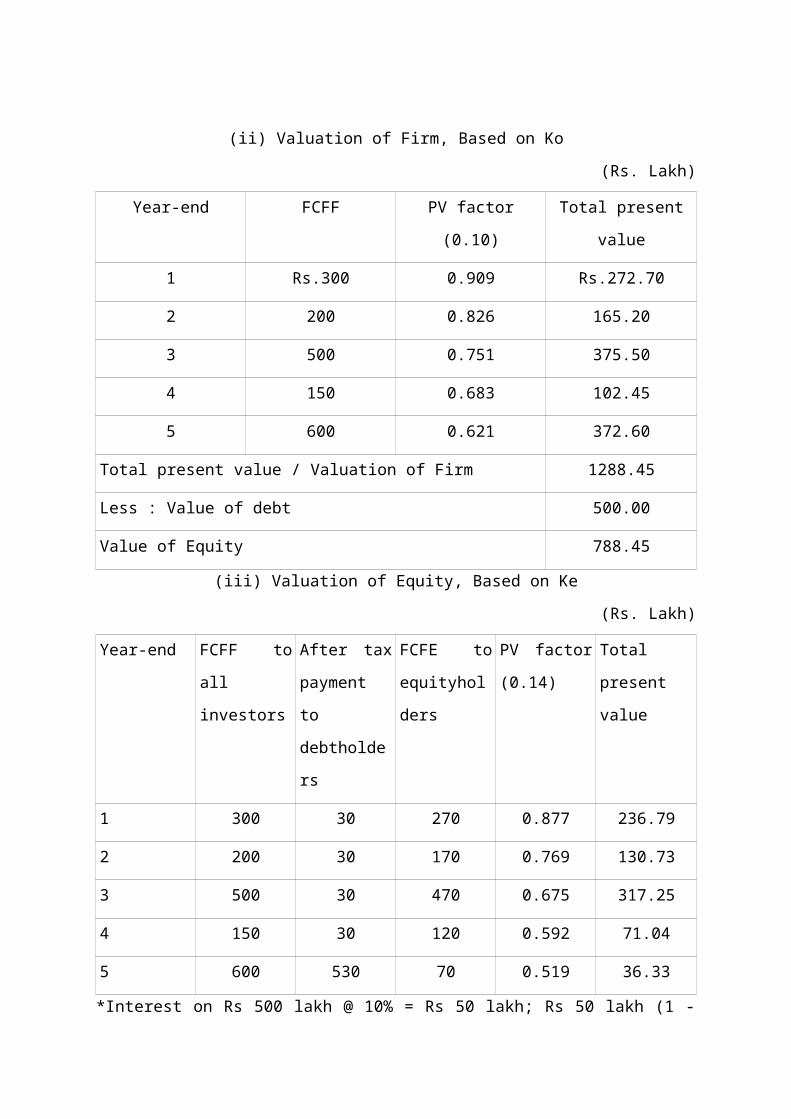
(ii) Valuation of Firm, Based on Ko
(Rs. Lakh)
Year-end FCFF PV factor (0.10) Total present value
1 Rs.300 0.909 Rs.272.70
2 200 0.826 165.20
3 500 0.751 375.50
4 150 0.683 102.45
5 600 0.621 372.60
Total present value / Valuation of Firm 1288.45
Less : Value of debt 500.00
Value of Equity 788.45
(iii) Valuation of Equity, Based on Ke
(Rs. Lakh)
Year-end FCFF to all
investors
After tax
payment to
debtholders
FCFE to
equityholders
PV factor
(0.14)
Total present
value
1 300 30 270 0.877 236.79
2 200 30 170 0.769 130.73
3 500 30 470 0.675 317.25
4 150 30 120 0.592 71.04
5 600 530 70 0.519 36.33
*Interest on Rs 500 lakh @ 10% = Rs 50 lakh; Rs 50 lakh (1 - 0.4) = Rs 30 lakh
**Inclusive of debt repayment of Rs 500 lakh at year-end 5.
Thus, the valuation of equity by both the methods is virtually the same (Rs 788.45 lakh and
Rs 792.14 lakh). The minor difference of Rs 3.69 lakh can be attributed primarily to
rounding-off the present value figures.
Total present value of the projected free cash flows to equityholder can be used to compute
free cash flows per equity share FCFE as per Equation 11.
FCFE per equity share = PV of FCFE to equityholders
Number of equity shares outstanding
In Example 4, FCFE per equity share is =
Rs 792.14 lakh = Rs 158.428
5 lakh
In Example 4, for the sake of simplicity, we have assumed the life of the corporate firm as 5
years. In practice, firms have perpetual long-term existence/indefinite life. Evidently, the
indefinite life of business/corporate firms, in general, is an additional aspect to be reckoned in
a firm's valuation. Ideally, one approach is to forecast future FCFF for a very long period of
time, say 30-40 years and ignore all subsequent year's FCFF. The reason is the discounted
value of such FCFF in such distant years will be insignificant. However, there are genuine
difficulties in explicitly forecasting decades of performance. In fact, it is virtually impossible
to make reasonably accurate forecasts of profits/cash flows beyond a certain period (say 7—
10 years) in most of the businesses.
To overcome the problem Copeland et al suggest that the exercise related to valuation of
business can be segregated into two periods, during and after an explicit forecast period. The
value of a business/firm is:
Present value of cash flows during explicit forecast period + Present value of cash flows after
explicit forecast period. (12)
What constitutes an ideal explicit forecast period? This question is not easy to answer. The
following guidelines may be relevant and useful in selecting such a period. Whereas in
cyclical businesses, the period can correspond to one full business cycle, in other businesses,
the period can match with the number of years during which they are likely to perform well.
In operational terms, the period should not be very short, say 2—3 years, and given the
current turbulent dynamic business world, the period, in general, should not be very long
also, say 10-15 years.
The explicit forecast period is die period in which the firm grows at a rapid pace; it is said to
be at saturation point at the end of the explicit forecast period, so far as growth rate is
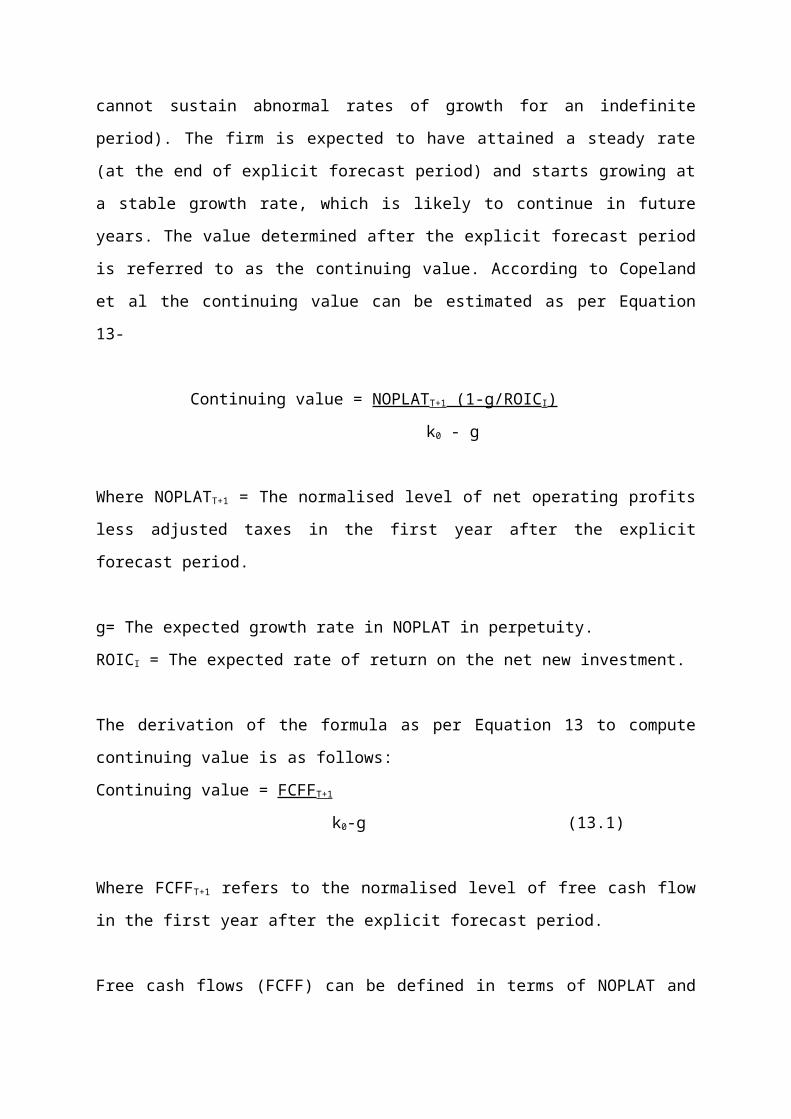
concerned (the economic premise is that firms, in general cannot sustain abnormal rates of
growth for an indefinite period). The firm is expected to have attained a steady rate (at the
end of explicit forecast period) and starts growing at a stable growth rate, which is likely to
continue in future years. The value determined after the explicit forecast period is referred to
as the continuing value. According to Copeland et al the continuing value can be estimated as
per Equation 13-
Continuing value = NOPLATT+1 (1-g/ROICI)
k0 - g
Where NOPLATT+1 = The normalised level of net operating profits less adjusted taxes in the
first year after the explicit forecast period.
g= The expected growth rate in NOPLAT in perpetuity.
ROICI = The expected rate of return on the net new investment.
The derivation of the formula as per Equation 13 to compute continuing value is as follows:
Continuing value = FCFFT+1
k0-g (13.1)
Where FCFFT+1 refers to the normalised level of free cash flow in the first year after the
explicit forecast period.
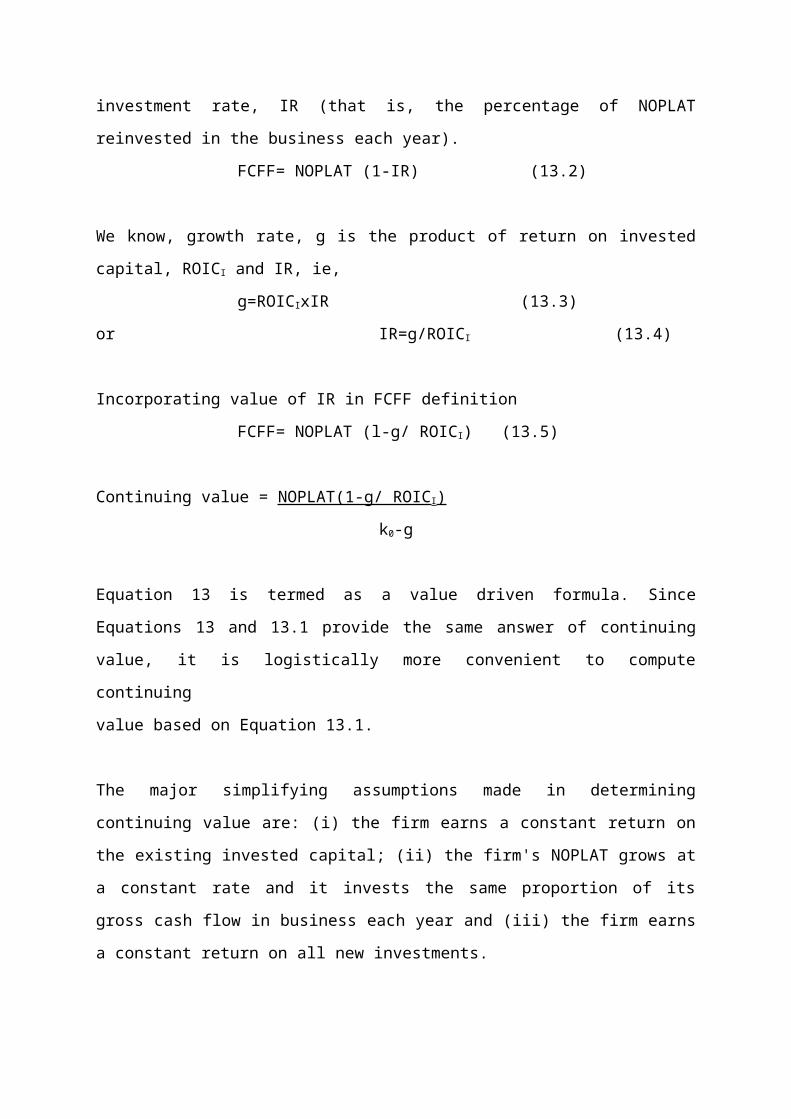
Free cash flows (FCFF) can be defined in terms of NOPLAT and investment rate, IR (that is,
the percentage of NOPLAT reinvested in the business each year).
FCFF= NOPLAT (1-IR) (13.2)
We know, growth rate, g is the product of return on invested capital, ROICI and IR, ie,
g=ROICIxIR (13.3)
or IR=g/ROICI (13.4)
Incorporating value of IR in FCFF definition
FCFF= NOPLAT (l-g/ ROICI) (13.5)
Continuing value = NOPLAT(1-g/ ROICI)
k0-g
Equation 13 is termed as a value driven formula. Since Equations 13 and 13.1 provide the
same answer of continuing value, it is logistically more convenient to compute continuing
value based on Equation 13.1.
The major simplifying assumptions made in determining continuing value are: (i) the firm
earns a constant return on the existing invested capital; (ii) the firm's NOPLAT grows at a
constant rate and it invests the same proportion of its gross cash flow in business each year
and (iii) the firm earns a constant return on all new investments.
All the items in equation 13 are self explanatory, except the term adjusted taxes. Adjusted
taxes is the increase in the estimated tax liability due to the exclusion of the tax shield
provided by interest charges. This is illustrated in Example 5.
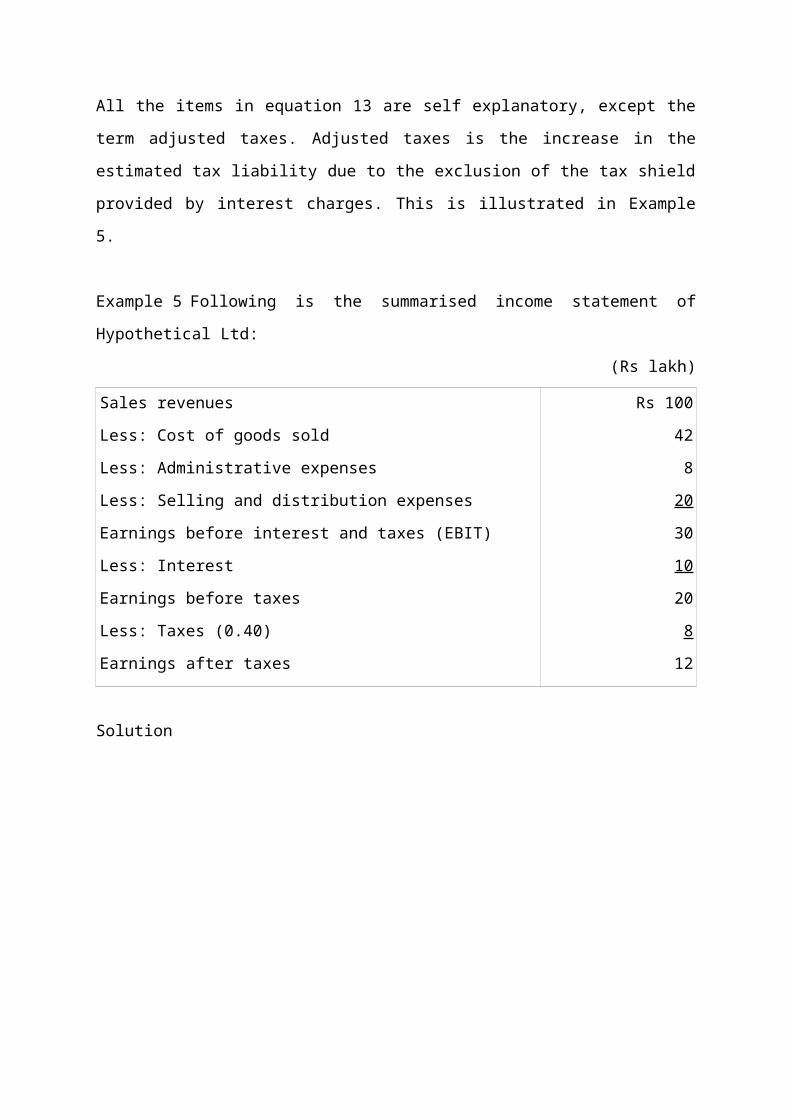
Example 5 Following is the summarised income statement of Hypothetical Ltd:
(Rs lakh)
Sales revenues
Less: Cost of goods sold
Less: Administrative expenses
Less: Selling and distribution expenses
Earnings before interest and taxes (EBIT)
Less: Interest
Earnings before taxes
Less: Taxes (0.40)
Earnings after taxes
Rs 100
42
8
20
30
10
20
8
12
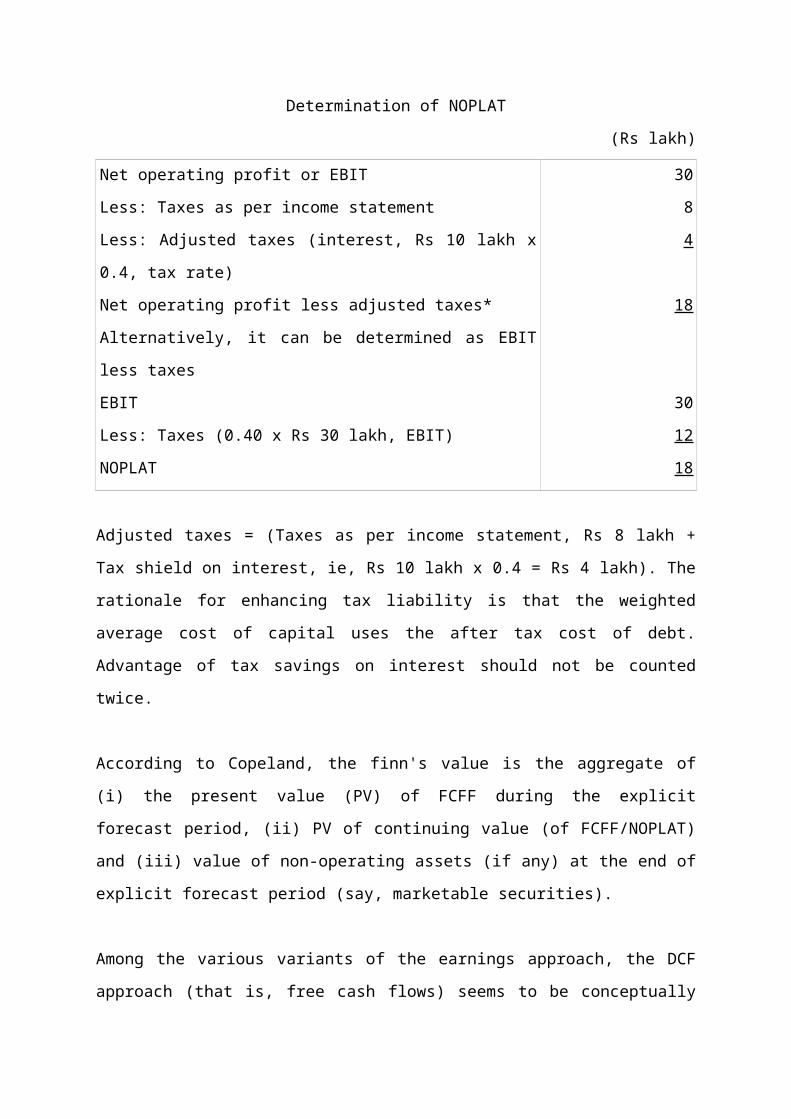
Solution
Determination of NOPLAT
(Rs lakh)
Net operating profit or EBIT
Less: Taxes as per income statement
Less: Adjusted taxes (interest, Rs 10 lakh x 0.4, tax rate)
Net operating profit less adjusted taxes*
Alternatively, it can be determined as EBIT less taxes
EBIT
Less: Taxes (0.40 x Rs 30 lakh, EBIT)
NOPLAT
30
8
4
18
30
12
18
Adjusted taxes = (Taxes as per income statement, Rs 8 lakh + Tax shield on interest, ie, Rs 10
lakh x 0.4 = Rs 4 lakh). The rationale for enhancing tax liability is that the weighted average
cost of capital uses the after tax cost of debt. Advantage of tax savings on interest should not
be counted twice.
According to Copeland, the finn's value is the aggregate of (i) the present value (PV) of FCFF
during the explicit forecast period, (ii) PV of continuing value (of FCFF/NOPLAT) and (iii)
value of non-operating assets (if any) at the end of explicit forecast period (say, marketable
securities).
Among the various variants of the earnings approach, the DCF approach (that is, free cash
flows) seems to be conceptually superior for business valuation as well as equity valuation..
The computation of FCFF and continuing value is illustrated in Example 6.
Example 6 Sagar Industries deals in production and sales of consumer durables. Its
expected sales revenues for the next 8 years (in Rs million) are given in the table:
Years Sales Revenue

1 Rs. 80
2 100
3 150
4 220
5 300
6 260
7 230
8 200
Its condensed balance sheet as on March 31, current year is as follows:
(Rs million)
Liabilities Amount Assets Amount
Equity Funds 120 Current Assets 30
12% Debt 80 Long-Term Assets (net) 170
200 200
Additional information:
(i) Its variable expenses will amount to 40 per cent of sales revenue. Fixed cash operating
costs are estimated to be Rs 16 million per year for the first 4 years and at Rs 20 million for
years 5 - 8. In addition, an extensive advertisement campaign will be launched, requiring
annual outlays as follows:
(ii) Long-term assets are subject to 15 per cent rate of depreciation on diminishing
balance method,
(iii) The company has' planned the following capital expenditure (assumed to have been
incurred in the beginning of each year) for the next 8 years,
(iv) Working capital in terms of investment in current assets are estimated at 20 per cent of
sales revenue,
(v) It is expected to have non-operating assets in terms of investments in marketable
securities in the initial year. The expected after tax non-operating cash flow in year 1 = Rs 0.5
million.
(vi) Given the tax benefits available to Sagar, the effective tax rate estimated is 30 per
cent.
(vii) The corporate equity capital is estimated at 16 per cent.
(viii) The free cash flow of the firm are expected to grow at 5 per cent per annum, after 8
years. Determine the discounted cash flow (DCF) value of the (i) firm and (ii) equity.
(Rs million)
1 Rs. 5
2-3 15
4-6 30
7-8 10
(Rs million)
Year 1 Rs. 5
2 8
3 20
4 25
5 35
6 25
7 15
8 10
Solution
(i) Determination of Weighted Average Cost of Capital
Source of Funds Cost (%) Weights Total (%)
Equity 16 0.6* 9.60
12% Debt 8.4 0.4** 3.36
12.96 = 13
(Rs 120 million/Rs 200 million); *.* (Rs 80 million/Rs,200 million)

(ii) Determination of Depreciation (Years 1 - 8)
(Rs million)
Year Long-term assets at beginning of year
Additions during the year
Total at the year-end
Depreciation @15%
1 Rs. 170.00 Rs 5 Rs. 175.00 Rs. 26.25
2 148.74 8 156.75 23.51
3 133.24 20 153.24 22.99
4 130.25 25 155.25 23.29
5 131.96 35 166.96 25.04
6 141.92 25 166.92 25.04
7 141.88 15 156.88 23.53
8 133.35 10 143.35 21.50
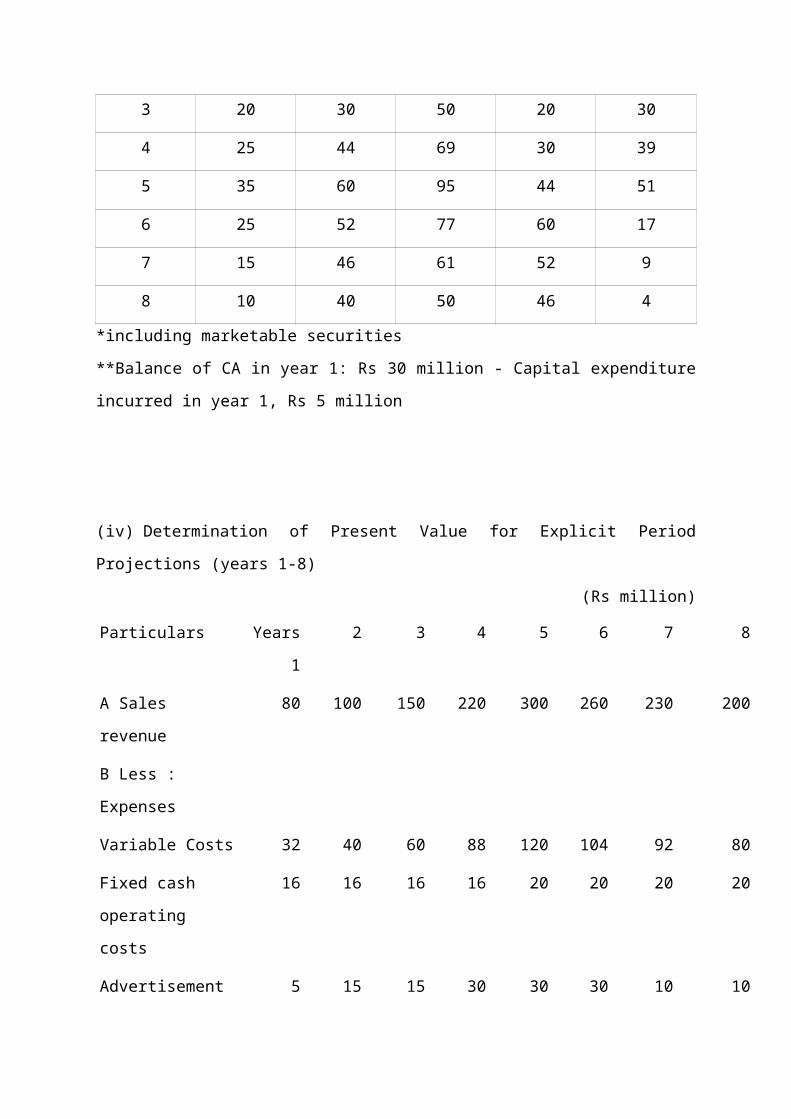
(iii) Determination of Investment [Capital Expenditure + Current Assets, (CA)] Required,
Years 1-8
(Rs million)
Year Investment required Existing
investments in
CA
Additional
investments
requiredCapital
expenditure
CA (Sales x
0.2)
Total
1 Rs 5 Rs. 16 Rs. 21 30* Nil
2 8 20 28 25** 3
3 20 30 50 20 30
4 25 44 69 30 39
5 35 60 95 44 51
6 25 52 77 60 17
7 15 46 61 52 9
8 10 40 50 46 4
*including marketable securities
**Balance of CA in year 1: Rs 30 million - Capital expenditure incurred in year 1, Rs 5
million
(iv) Determination of Present Value for Explicit Period Projections (years 1-8)
(Rs million)
Particulars Years
1
2 3 4 5 6 7 8
A Sales revenue 80 100 150 220 300 260 230 200
B Less : Expenses
Variable Costs 32 40 60 88 120 104 92 80
Fixed cash operating
costs
16 16 16 16 20 20 20 20
Advertisement 5 15 15 30 30 30 10 10
Depreciation 26.25 23.51 22.99 23.29 25.04 25.04 23.53 21.50
C EBIT (A-B) 0.75 5.49 36.01 62.71 104.96 80.96 84.47 68.50
D Less: Taxes (0.30) 0.22 1.65 10.80 18.81 31.49 24.29 25.34 20.55
E NOPAT 0.53 3.84 25.21 43.90 73.47 56.67 59.13 47.95
F Non-operating
income
0.50 - - - - - - -
G Gross cash flow
(E+F+Depreciation) 27.28 27.35 48.20 67.19 98.51 81.71 82.66 69.45
H Less:Investment in
Capital expenditure
- 3 30 39 51 17 9 4
plus current assets)
I Free cash flow (G-
H)
27.28 24.35 18.20 28.19 47.51 64.71 73.66 65.45
J PV Factor (0.13) 0.885 0.783 0.693 0.613 0.543 0.480 0.425 0.376
K Total PV(IxJ) 24.14 19.07 12.61 17.28 25.80 31.06 31.31 24.61
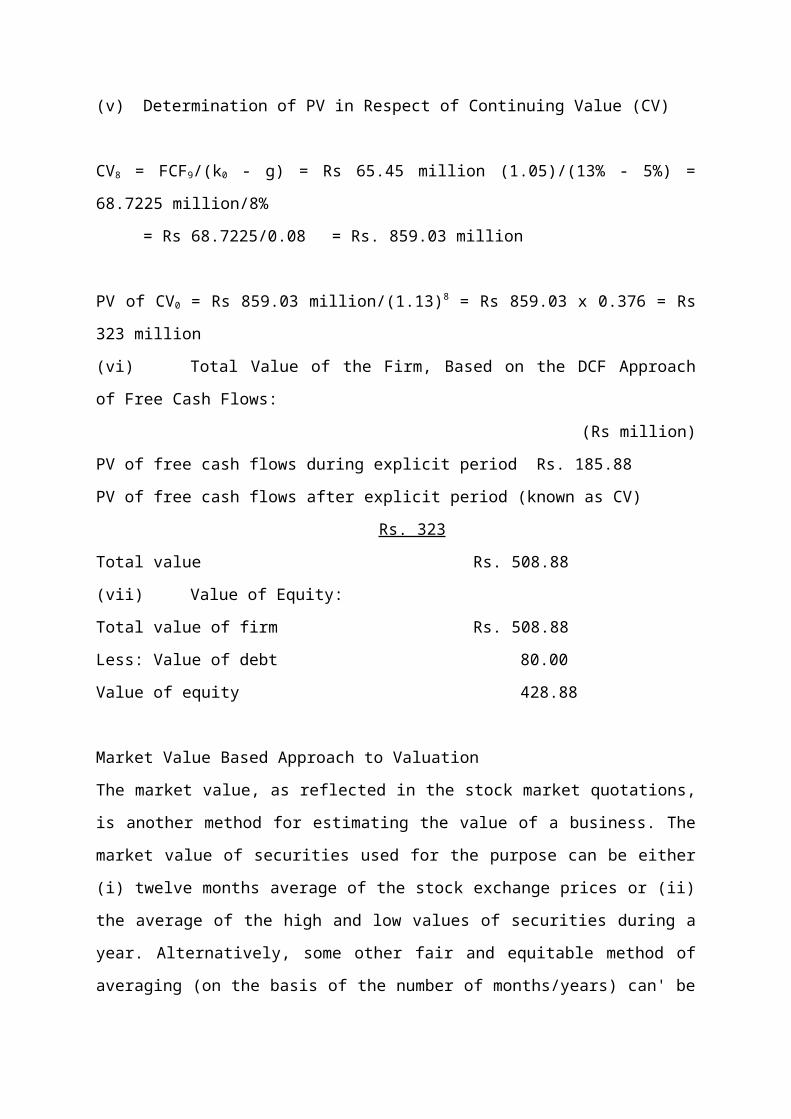
(v) Determination of PV in Respect of Continuing Value (CV)
CV8 = FCF9/(k0 - g) = Rs 65.45 million (1.05)/(13% - 5%) = 68.7225 million/8%
= Rs 68.7225/0.08 = Rs. 859.03 million
PV of CV0 = Rs 859.03 million/(1.13)8 = Rs 859.03 x 0.376 = Rs 323 million
(vi) Total Value of the Firm, Based on the DCF Approach of Free Cash Flows:
(Rs million)
PV of free cash flows during explicit period Rs. 185.88
PV of free cash flows after explicit period (known as CV)
Rs. 323
Total value Rs. 508.88
(vii) Value of Equity:
Total value of firm Rs. 508.88
Less: Value of debt 80.00
Value of equity 428.88
Market Value Based Approach to Valuation
The market value, as reflected in the stock market quotations, is another method for
estimating the value of a business. The market value of securities used for the purpose can be
either (i) twelve months average of the stock exchange prices or (ii) the average of the high
and low values of securities during a year. Alternatively, some other fair and equitable
method of averaging (on the basis of the number of months/years) can' be worked out, The
justification of market value as an approximation of the true worth of a firm is derived from
the fact that market quotations by and huge indicate the consensus of investors as to the firm's
earning potentials and the corresponding risk. The market value approach is one of the most
widely-used in determining value, in particular of large listed firms.
The major problem with this method is that the market value of a firm is influenced not only
by financial fundamentals but also by speculative factors. As a result, this value can change
abruptly due to speculative influences, market sentiments and personal expectations. Market
makers as well as other 'willing buyers or sellers' (interested in purchases or sales) can at
times significantly influence these prices. Another limitation of this approach is that this
approach cannot be applied if the shares are unlisted or are not actively traded.
Apart from the limited applicability of this method only to listed corporate enterprises, whose
shares/securities are actively traded, the valuation of a business is not in tune with the going
concern concept. Nevertheless, it may be/is of immense usefulness in deciding swap ratios of
shares in merger decisions. In fact, the market prices of the two companies can be the
objective of the decision. Alternatively, a certain percentage of premium, above the market
price may be offered as an inducement to the shareholders of the acquired company to
convince them to agree to sell their shares or to make them agree to the merger decisions.
Fair Value Method
The fair value method is not an independent method of share valuation like those discussed
above. This method uses the average/weightage average or one or more of the above
methods. Since this method uses the average concept, its virtue is that it helps in smoothening
out wide variations in estimated valuations as per different methods. In other words, this
approach provides, in a way, the 'balanced' figure of valuation.
In general, this method has limited application for business valuation. For instance, this
method of valuation of shares had been used till the early 1990's, by the erstwhile Controller
of Capital Issues (CCI) in India, for fixing the price of new equity issues. In case the equity
shares were to be issued at a premium, the amount of premium was based as the CCI
guidelines.
To sum up, no one method is appropriate for all circumstances/situations/requirements.
Therefore, it is important to recognise that the different methods are based on different
assumptions and depending on the circumstances, some methods may be more appropriate
than others. For instance, where there is paucity of information about profits, say (i) in the
case of new companies whose accounts do not serve as a guide to future profits, (ii) in the
case of companies operating at a loss with no prospects of earning profits in the near future
and (in) in the case of companies having unreliable statistics of profits owing to factors such
as disruption of business, the net asset method of valuation seems would be more appropriate.
In normal situations, the DCF (based on free cash flows) method would be suitable. In the
event of wide variations in the valuations as per these two methods, the fair value method
may be, used. In fact, it is useful for the finance manager/investor/valuer/analyst to know a
range of values from various perspectives.
OTHER APPROACHES TO VALUE MEASUREMENT
In recent years, a number of new approaches/techniques/methods to measure value (with
focus on shareholders) have been developed and practised. The two major approaches are
market value added (MVA) and economic value added (EVA). They are explanied in this
Section.
Market Value Added Approach (MVA)
The MVA approach measures the change in the market value of the firm's equity vis-a-vis
equity investment (consisting of equity share capital and retained profits). Accordingly,
MVA = Market value of firm's equity - Equity capital investment/funds
(14)
Though the concept of MVA is normally used in the context of equity investment (and, hence,
is of greater relevance for equity shareholders), it can also be adapted (like other previous
approaches) to measure value from the perspective of providers of all invested funds (i.e.,
including preference share capital and debt).
MVA = [Total market value of firm's securities - (Equity shareholders funds
+ Preference share capital + Debentures)] (15)
The MVA approach cannot be used for all types of firms. It is applicable to only firms whose
market prices are available. In that sense, the method has limited application. Besides, the
value provided by this approach may exhibit wide fluctuations, depending on the state of the
capital market/stock market in the country.
Example 7 Suppose, Supreme Industries has an equity market capitalisation of Rs 3,400
crore. in current year. Assume further that its equity share capital is Rs 2;000 crore and its
retained earnings are Rs 600 crore. Determine the MVA and interpret it.
Solution
MVA = (Rs 3,400 core - Rs 2,600 crore) = Rs 800 crore.
The value of Rs 800 crore implies that the management of Supreme Industries has created
wealth/value to the extent of Rs 800 crore for its equity shareholders. Well managed
companies (engaged in sunrise businesses),"having good growth prospects, and perceived so
by the investors, have positive MVA. Investors may be willing to pay more than the net
worth. In contrast, companies relatively less known or engaged in businesses that do not hold
future growth; potentials may have negative MVA.
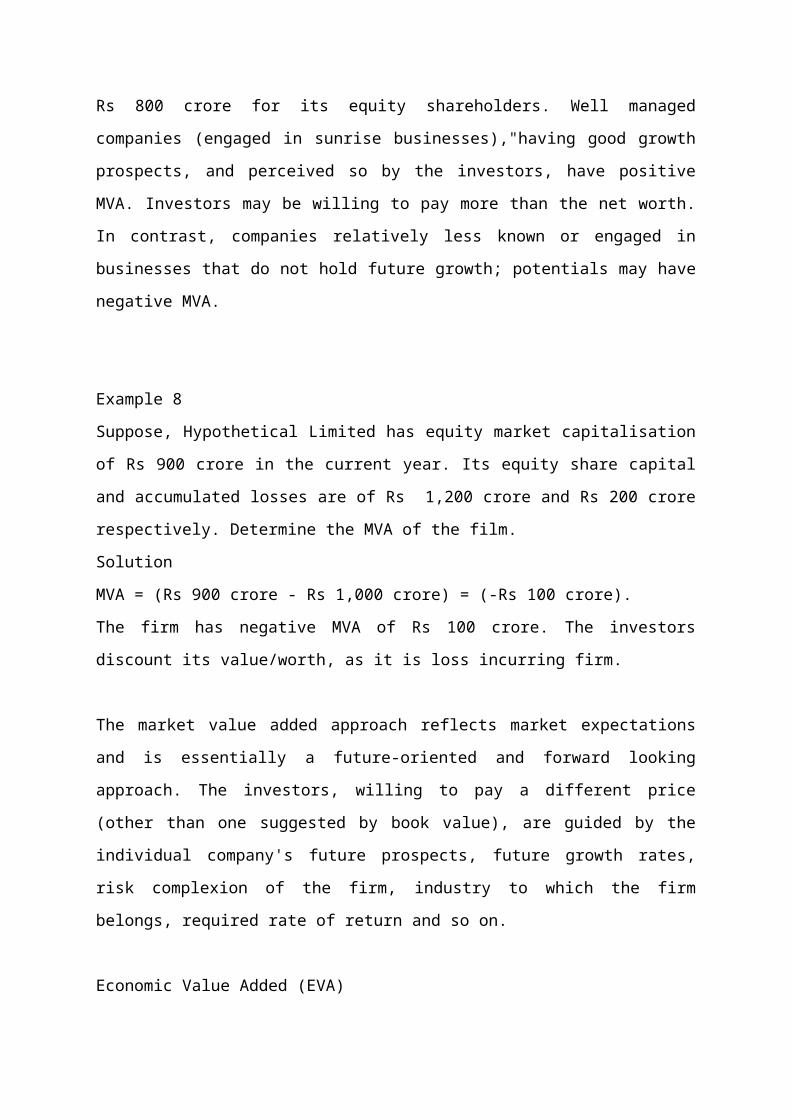
Example 8
Suppose, Hypothetical Limited has equity market capitalisation of Rs 900 crore in the current
year. Its equity share capital and accumulated losses are of Rs 1,200 crore and Rs 200 crore
respectively. Determine the MVA of the film.
Solution
MVA = (Rs 900 crore - Rs 1,000 crore) = (-Rs 100 crore).
The firm has negative MVA of Rs 100 crore. The investors discount its value/worth, as it is
loss incurring firm.
The market value added approach reflects market expectations and is essentially a future-
oriented and forward looking approach. The investors, willing to pay a different price (other
than one suggested by book value), are guided by the individual company's future prospects,
future growth rates, risk complexion of the firm, industry to which the firm belongs, required
rate of return and so on.
Economic Value Added (EVA)
The EVA method is based on the past performance of the corporate enterprise. The
underlying economic principle in this method is to determine whether the firm is earning a
higher rate of return on the entire invested funds than the cost of such funds (measured in
terms of the weighted average cost of capital, WACC). If the answer is positive, the firm's
management is adding to the shareholders value by earning extra for them. On the contrary, if
the WACG is higher than the corporate earning rate, the firm's operations have eroded the
existing wealth of its equity shareholders. In operational terms, the method attempts to
measure economic value added (or destroyed) for equity shareholders, by the firm's
operations, in a given year.
Since WACC takes care of the financial costs of all sources of providers of invested funds in
a corporate enterprise, it is imperative that operating profits after taxes (and not net profits
after taxes) should be considered to measure EVA. The accounting profits after taxes, as
reported by the income statement, need adjustments for interest costs. The profits should be
the net operating profits after taxes and the cost of funds will be product of the total capital
supplied (including retained earnings) and WACC.
EVA .= [Net Operating profits after taxes - (Total capital x WACC)]
(16)
The computation of EVA is illustrated in Example 9
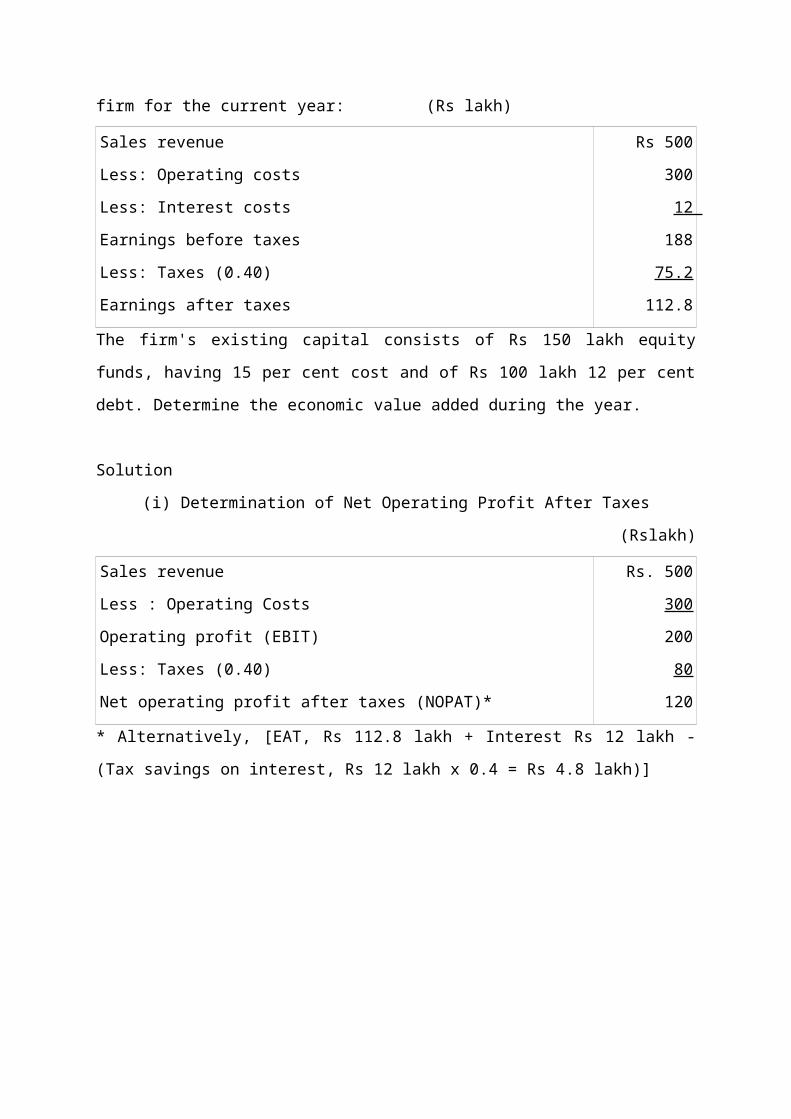
Example 9 Following is the condensed income statement of a firm for the current year:
(Rs lakh)
Sales revenue
Less: Operating costs
Less: Interest costs
Earnings before taxes
Less: Taxes (0.40)
Earnings after taxes
Rs 500
300
12
188
75.2
112.8
The firm's existing capital consists of Rs 150 lakh equity funds, having 15 per cent cost and
of Rs 100 lakh 12 per cent debt. Determine the economic value added during the year.
Solution
(i) Determination of Net Operating Profit After Taxes
(Rslakh)
Sales revenue Rs. 500
Less : Operating Costs
Operating profit (EBIT)
Less: Taxes (0.40)
Net operating profit after taxes (NOPAT)*
300
200
80
120
* Alternatively, [EAT, Rs 112.8 lakh + Interest Rs 12 lakh - (Tax savings on interest, Rs 12
lakh x 0.4 = Rs 4.8 lakh)]

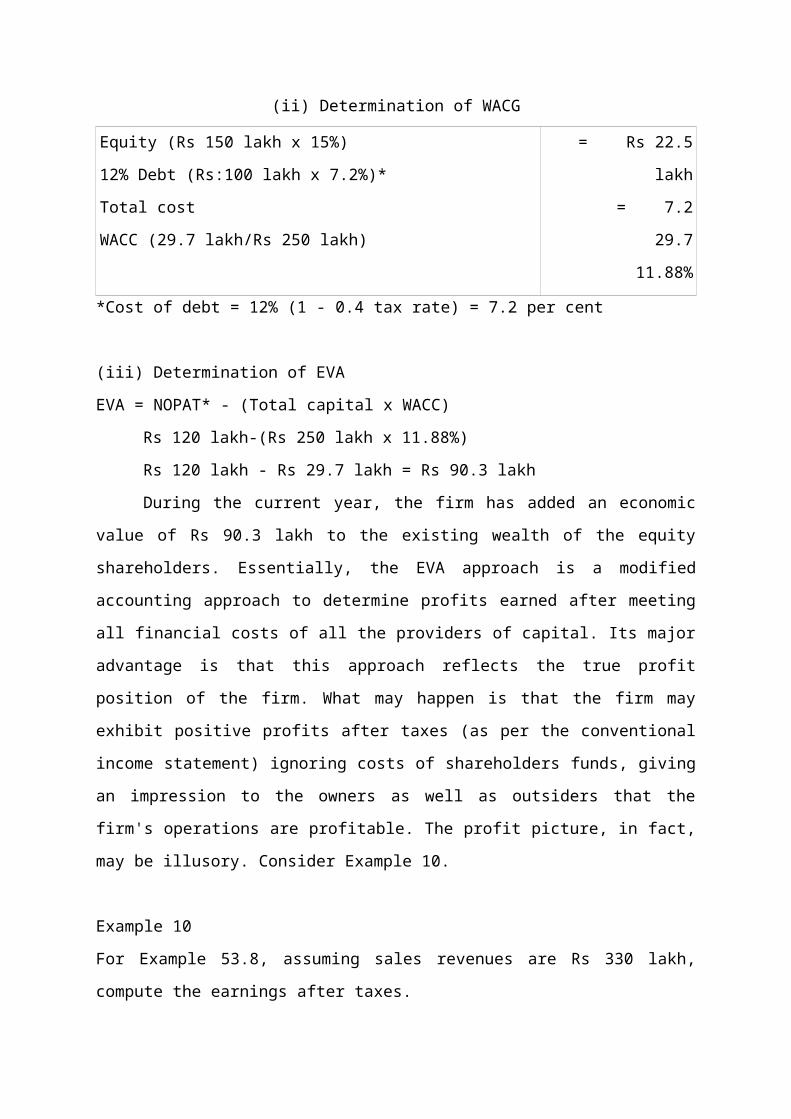
(ii) Determination of WACG
Equity (Rs 150 lakh x 15%)
12% Debt (Rs:100 lakh x 7.2%)*
Total cost
WACC (29.7 lakh/Rs 250 lakh)
= Rs 22.5 lakh
= 7.2
29.7
11.88%
*Cost of debt = 12% (1 - 0.4 tax rate) = 7.2 per cent
(iii) Determination of EVA
EVA = NOPAT* - (Total capital x WACC)
Rs 120 lakh-(Rs 250 lakh x 11.88%)
Rs 120 lakh - Rs 29.7 lakh = Rs 90.3 lakh
During the current year, the firm has added an economic value of Rs 90.3 lakh to the
existing wealth of the equity shareholders. Essentially, the EVA approach is a modified
accounting approach to determine profits earned after meeting all financial costs of all the
providers of capital. Its major advantage is that this approach reflects the true profit position
of the firm. What may happen is that the firm may exhibit positive profits after taxes (as per
the conventional income statement) ignoring costs of shareholders funds, giving an
impression to the owners as well as outsiders that the firm's operations are profitable. The
profit picture, in fact, may be illusory. Consider Example 10.
Example 10
For Example 53.8, assuming sales revenues are Rs 330 lakh, compute the earnings after
taxes.
Solution
Income Statement (Conventional)
(Rs lakh)
Sales revenue
Less: Operating costs
Less: Interest costs
Earnings before taxes
Less: Taxes (0.40)
Earnings after taxes
Rs 330
300
12
18
7.2
10.8

The firm has registered profits of Rs 10.8 lakh during the current year on the equity funds of
Rs 150 lakh, which has financial costs of Rs 22.5 lakh. Therefore, the firm has, suffered a
loss, (of Rsll.7 lakh) as the opportunity costs of equity funds invested by equity holders is
more than what has been earned by the firm for them. This point is brought to the fore by the
EVA approach. It is for this reason that the EVA approach is getting more attention. It is
superior to the conventional approach of determining profits.
Determination of EVA
(Rs. lakh)
(a) Sales revenue
Less : Operating Costs
Operating Profits
Less : taxes (0.4)
Net operating profits after taxes
(b) EVA = Rs. 18 Lakh – (Rs. 29.7 lakh, already computed above) =
-Rs. 11.7 lakh
Rs. 330
300
30
12
18
Example 10 demonstrates that there may be a substantial difference between profits
determined as per accounting approach and the EVA approach. Profits shown ass per the EVA
approach are conceptually realistic than shown by traditional accounting approach. In no way,
the firm can be said to have earned profits without meeting financial costs of all sources of
finance. The EVA approach is in tune with the basic financial tenet of cost-benefit analysis;
financial benefits have to be more than financial costs to have true profits.
Though the MVA and EVA are two different approaches, the MVA of the firm (in a technical
sense) can be conceived in terms of the present value of all the EVA profits that the firm is
expected to generate in the future.

Solved Problems
The following particulars are available in respect of a corporate:
(i) Capital employed, Rs 500 million.
(ii) Operating profits, after taxes, for last three years are: Rs 80 million, Rs 100 million,
Rs 90 million; current year's operating profit, after taxes, is Rs 105 million.
(iii) Riskless rate of return, 10 per cent.
(iv) Risk premium relevant to the-business of corporate firm, 5 per cent.
You are required to compute the value of goodwill, based on the present value of. the
super profits method. Super profits are to be computed on the basis of the average profits of 4
years. It is expected that the firm is likely to earn super profits for the next 5 years only.
Solution
Determination of goodwill, using super profit method
(Rs million)
Average profits (Rs 80 million + Rs 100 million + Rs 90 million + Rs
105 million = Rs 375 million)/ 4 years
Rs. 93.75
Less: Normal profits (Rs 500 million x 0.15) 75.00
Super profits 18.75
Multiplied by the PV of .annuity for 5 years at 15 percent (x) 3.352
PV of super profits/Value of goodwill 62.85

2. The following is the balance sheet of a corporate firm as on March 31, current year.
(Rs lakh)
Liabilities Amount Assets Amount
Share capital (of Rs 100 each fully paid-up)
Reserves and surplus
Sundry creditors and other liabilities
Rs. 100
40
30
Land and buildings
Plant and machinery
Marketable securities
Stock
Debtors
Cash and bank balances
Rs. 40
80
10
20
15
5
170 170
Profit before tax for current year-end amount to Rs 64 lakh, including Rs 4 lakh as
extraordinary income. Besides, the firm has earned interest income of Rs 1 lakh in the current
year from investments in marketable securities. It is not usual for the firm to have excess cash
and invest in marketable securities. However, an additional amount of Rs 5 lakh per annum,
in terms of advertisement and other expenses, will be required to be spent for the smooth
running of the business in the years to come.
Market values of land and buildings, and plant and machinery are estimated at Rs 90 lakh and
Rs 100 lakh respectively. In order to match the revalued figures of these fixed assets,
additional depreciation of Rs 6 lakh is required to be taken into consideration. Effective
corporate tax rate may be taken at 30 per cent. The capitalisation rate applicable to businesses
of such risks is 15 per cent.
From the above information, compute the value of business, value of equity and price per
equity/share, based on the capitalisation method.
Solution
Valuation of business, value of equity and price per equity share (capitalisation method)
(Rs lakh)
Profit before tax
Less; Extraordinary income
Less: Interest on marketable securities (not likely to accrue in future)
64
4
1
Less: Additional expected recurring expenses
Less: Additional depreciation
Expected earnings before taxes
Less: Taxes (0.30)
Future maintainable profits after taxes
Divided by relevant capitalisation factor
Value of business (Rs 33.60 lakh/0.15)
Value of equity (Rs 224 lakh - Rs 30 lakh external liabilities)
Price per equity share (Rs 194 lakh/ 1 lakh)
5
6
48
14.40
33.60
0.15
224.00
194.00
194
3 Assume every thing to be the same as contained in P.32.2: Determine the expected
market price of the share, given the P/E multiple of (0 8 times and (ii) 5 times, and interpret
the result.
Solution
Determination of market price per share (P/E basis)
(Rs lakh)
Future maintainable profits after taxes (computed in P.2)
Divided by the number of equity shares issued and outstanding
Earnings per equity share, EPS, (Rs 33.60 lakh/1 lakh)
Multiplied by P/E ratio
(i) Market price per share (Rs 33.60 x 8 times)
Multiplied by P/E ratio
(ii) Market price per share (Rs 33.60 x 5 times)
Rs 33.60
1.00
33.60
8
268.8
5
168
Interpretation

(i) The P/E ratio of 8 times suggests that investors are confident about the company's
future prospects; they have high expectations of future returns. It is for this reasons that they
are prepared to pay a higher market price per equity share than warranted by the
capitalisation method (ie, Rs 194 per share), (ii) In contrast, the P/E multiple of 5 times
suggests that investors are less optimistic about die company's future performance. They have
low confidence as well as expectations of low returns in future years and therefore1 are
willing to pay a lower price vis-a-vis the capitalised price.
P.4 For facts contained in P.2, determine the value of business as per the net assets method.
Assets are to be valued at market value for this purpose. Value of goodwill is also to be
considered to value assets. Its value is to be reckoned as an equivalent to the present value of
super profits, which are likely to accrue for 4 years. For the purpose of determining super
profits, normal profits are to be computed with reference to the year-end value of net
assets/capital employed (excluding goodwill). Also compute the market value of equity share
as per this approach.
Solution
Determination of valuation of business and net asset value per share as per the net assets
method (assets are valued at market price)
(Rs lakh)
Land and buildingsPlant and machineryGoodwillMarketable securitiesStockDebtorsCash and bank, balancesTotal, assetsLess: External liabilities Net assets available for equity to shareholders Divided by the number of equity shares issued and outstanding Net assets value per share (Rs 216 lakh/1 lakh)
Rs 90100
61020155
24630
216
1
216
Valuation of goodwill
Future, maintable profits after taxes
Less: Normal profit (15% of capital employed, i.e., 0.15 x Rs 210 lakh*)
Super profits
Rs 33.60
31.50
Multiplied by PV factor at 15% for annuity of 4 years
Value of goodwill (Rs 2.10 lakh x 2.855)
2.10
2.855
6.0
*(Market value of assets, excluding goodwill, Rs 240 lakh - External liabilities, Rs 30 lakh).
Assume everything to be the same as given in P2. Determine the fair price of an equity share.
The fair price of an equity share is to be taken as an average of prices estimated according to
the capitalisation method and the net assets method.

Solution
Determination of a fair price of an equity share (fair value method)
Price per equity share (capitalisation method)
Net assets value per equity share (net assets method)
Fair value per equity share (Rs 194 + Rs 216)/2
Rs. 194
216
205
P.6 Determine the continuing value of the firm from the following information:
(Rs million)
Cash flow frorn business operations at the end of explicit forecast period (Year 6) Investment required in capital expenditure and current assets during year 6 Expected annual growth rate in free cash flows to the firm, after forecast period (%) Weighted average cost of capital (WACC) (%)Cost of equity capital (%)
Rs. 56
12
8
12
15
Solution
Determination of PV with respect to continuing value (CV)
CV6 = FCFF7 = Rs. 44 million * (1.08) = Rs. 47.52 million
WACC-g 12%-8% 4%
CV6 = Rs 1,188 million
CV0 = Rs 1,188 million x Present value factor at 12% for 6 years
CV0 = Rs 1,188 million x 0.507
= Rs 602.316 million
*(Gross cash flows Rs 56 million - Investment required in capital expenditures and current
assets Rs 12 million = Rs 44 million);
P.7 Hypothetical Limited is growing at an above average rate. It foresees a growth rate of 20
per cent per annum in free cash flows to equityholders in the next 4 years. It is likely to fall to
12 per cent in the next two years. After that, the growth rate is expected to stabilise at 5 per
cent per annum. The amount of free cash flow (FCFE) per equity share at the beginning of
current year is Rs 10. Find out the maximum price at which an investor, follower of the free
cash approach, will be prepared to buy the company's shares as on date, assuming an equity
capitalisation rate of 14 per cent.
Solution Maximum price of the equity share will be the sum of (i) PV of FCFE during 1 - 6
years and 00 PV of expected market price at the end of year 6, based on a constant growth
rate of 5 per cent.

(i) Present value of FCFE (years 1 - 6)
Year FCFE per share PV factor (0.14) Total PV
1 Rs. 10 (1+0.20)1 = Rs. 12 0.877 Rs. 10.52
2 10 (1+0.20)2 = 14.40 0.769 11.07
3 10 (1+0.20)3 = 17.28 0.675 11.66
4 10 (1+0.20)4 = 20.74 0.592 12.28
5 20.74 (1+0.12) = 23.23 0.519 12.06
6 23.23 (1+0.12) = 26.02 0.456 11.86
Total PV of FCFE 69.45
Market price of share at year-end 6
= FCFE7 = Rs. 26.02 (1.05)
ke-g 14% - 5%
P6 = Rs. 27.321 = Rs. 303.57
14% - 5%
(ii) PV of Rs. 303.57 = Rs. 303.57 x 0.456
= Rs. 138.43
Maximum price of share
= Rs 69.45 + Rs 138.43 = Rs 207.88
P.8 The Chemicals and Fertilizer Limited is a growing company. Its free cash flows for equity
holders (FCFE) have been growing at a rate of 25 per cent in recent years. This abnormal
growth rate is expected to continue for another 5 years; then these FCFE are likely to grow at
the normal rate of 8 per cent. The required rate of return on these shares, by the investing
community, is 15 per cent; the firm's weighted average cost of capital is 12 per cent. The
amount of FCFE per share at the beginning of the current year is Rs 30. Determine the
maximum price an investor should be willing to pay now it = 0), based on free cash flow
approach. The issue price of share is Rs 500.

Solution
(i) Present value of FCFE (years 1-5)
Year FCFE per share PV Factor (0.15) Total PV
1 Rs 30 (1+0.25)1 = Rs. 37.50 Rs. 0.870 Rs. 32.62
2 30 (1+0.25)2 = Rs. 46.86 0.756 35.43
3 30 (1+0.25)3 = 58.59 0.658 38.55
4 30 (1+0.25)4 = 73.23 0.572 41.89
5 30 (1+0.25)5= 91.56 0.497 45.51
Total PV of FCFE 194.00
Market price of share at year-end 5
= FCFE6 = Rs. 91.56 (1.08) = Rs. 1,412.64
ke-g 15% - 8%
PV at t = 0 = Rs 1,412.64 x 0.497 = Rs 702:08
Investor will be prepared to pay the maximum price at t = 0 = Rs 194 + Rs 702.08 = Rs
896.08
P.9 The most recent accounts of a corporate firm engaged in manufacturing business are
summarized below:.
(Rs million)
Income statement for the current year ended March 31 Amount
Sales revenue
EBIT
Less: Interest on loan
Earnings before taxes
Less: Corporate taxes (0.35)
Earnings after taxes
Rs 93.5
18.0
1.8
16.2
5.67
10.53
Balance sheet as at March 31, current year
(Rs million)
Liabilities Amount Assets Amount
Equity share capital (1 lakh
shares of Rs 100 each)
Reserves and surplus
10% Loan
Creditors and other liabilities
10.0
32.5
18.0
18.0
Freehold land and buildings
(net)
Plant and machinery (net)
Current assets:
Stock
Debtors
Bank and cash balance
20.0
29.5
10.0
15.0
4.0
78.5 78.5

Additional Information:
CO The finance manager of the firm has estimated the future free cash flows of the company
as follows:
Year
1
Rs.
22
2 23
3 24.5
4 26.0
5 30.0
6 32.0
Free cash flows in subsequent years, after year 6, are estimated to grow at 4 per cent. The
company's weighted average cost of capital is 12 per cent.
(ii) The current resale value of the following assets has been assessed by the professional
valuer as follows:
Freehold land and buildings Rs 60 million
Plant and machinery 20
Stock 11
The current resale values of the remaining assets are as per their book values.
(iii) A similar sized company (which is listed on Bombay Stock Exchange) and is engaged
in the same business has a P/E ratio of 7 times.
You are required to compute the value of the firm as well as value of an equity share on the
basis of the following methods: (i) Net assets method (book value and market value), (ii)
Price-earnings ratio method and (iii) Free cash flows to the firm.
Solution
Determination of value of firm and value of equity share (using various methods)
(Rs million)
(i) (a) Net asset method—book value basis:
Freehold land and buildings
Plant and machinery
Stock
Debtors
Rs. 20.0
29.5
10.0
15.0
Bank and cash balances
Total assets
Less: External liabilities
10°/o Loan
Creditors and other liabilities
Net assets available to equityholders
Divided by number of equity shares outstanding (lakh)
Net assets backing per share (Rs 42.5 million/ 1 lakh) (Rs)
(b) Market value basis:
Freehold land and buildings
Plant and machinery
Stock
Debtors
Bank and cash balances
Total assets
Less: External liabilities
Net assets at market value
Net assets backing per share (Rs 74 million/1 lakh shares)
(ii) Price-earnings ratio approach
Earnings after taxes (assumed to be normal and expected to be maintained
in future years; no adjustment is made as there are no extraordinary items)
Earnings per share (Rs 10.53 million/1 lakh shares)
Multiplied by P/E multiple
Market price of equity share (Rs 105.30 x 7 times)
4.0
78.5
36.0
42.5
1
425
60
20
11
15
4
110
36
74
740
10.53
105.30
7
737.10
(iii) Free cash flow basis:
(a) PV of FCFE during explicit forecast period:
(Rs in million)
Year FCFF PV Factor (0.12) Total PV
1 Rs. 22 0.893 Rs. 19.646
2 23 0.797 18.331
3 24.5 0.712 17.444
4 26.0 0.636 16.536
5 30.0 0.567 17.010
6 32.0 0.507 16.225
Total present value 105.191
(b) PV of FCFF subsequent to explicit forecast period
CV6 = Rs. 32 (1.04) = Rs. 33.28 = Rs. 416
0.12 – 0.04 0.08
PV0 = Rs 416, continuing value x PV factor at 12% for 6 years
= Rs 416 x 0.507 = Rs 210.912
(c) Total PV of FCFF (Rs 105.191 + Rs 210.912)
= 316.103 million 316.103
Less: External liabilities 36.000 36.00
FCFE available to equityholders 280.103 280.103
MPS (Rs 280.103 million/
1 lakh shares) = Rs 2801.03 280.10
P.10 Assume everything to be the same as given in P.32.9, determine the economic value
added during the current year. Assume the long-term funds shown in the balance sheet as the
total capital employed in the business.

Solution
Determination of economic value added (EVA)
(Rs. In million)
Net operating profits before taxes
Less: Corporate taxes (0.35).
Net operating profits after taxes
Less: Cost of capital employed (Rs 60.5 million" x 0.12 WACC)
Economic value added.
Rs 18
6.3*
11.7
7.26
4.44
Alternatively, corporate taxes can be conceived as sum of (i) taxes as per income statement
(Rs 5.67 million plus (ii) tax savings on interest (Rs 1.8 million x 0.35 = 0.63 million) = Rs
6.3 million "Equity share capital Rs 10 million + Reserves and surplus Rs 32.50 million +
10% loan Rs 18 million- Rs 60.5 million.
P.11 Assume every thing to be the same as given in P9. Assume further that the equity shares
of this company are currently quoted in the market at Rs 500 per share. Determine the
amount of market value added (MVA).
Solution
Determination of market value added
A. Market value per equity share
B. Multiplied by number of equity shares outstanding (lakh)
C. Total market value (A x B) (Rs million)
D. Equity funds (Rs 10 million equity share capital plus Rs 32.5 million
reserves and surplus)
E. Market value added (Rs 50 million - Rs 42.5 million)
Rs. 500
1
50
42.5
7.5
Top Related