


Languages
Pages
Legal


BUS TRANSPORT SECTOR IN THE PHILIPPINES
PRESENTATION NOTE
1. INTRODUCTION
The Philippines is a country of over 92 billion people concentrated in highly dense urban
agglomerations like Metro Manila. Given low motorization (9 cars per 1,000 people) bus
transport plays an important role in the economy by providing an affordable mode of
transportation. Competition policies in the bus transport sector—in the form of transparent rules
for entry and exit, fare setting, and regulatory mechanisms that promote competition—can
potentially have positive impacts by providing bus operators with a competitive environment and
the public with affordable and efficient bus service.
Public transportation in the Philippines is fraught with problems such as inadequate road
infrastructure and congestion in the urban areas. The welfare impacts of competition reforms
must thus be viewed within the context of other factors affecting the optimal number of buses
such as road networks, level of economic activity, and the availability and quantity of alternative
modes of transportation.
In this study, we will (1) examine the institutional and regulatory framework governing the bus
transport sector; (2) identify major policy reforms that have impact on competition in the sector;
(3) analyze the impact of the said reforms on the welfare of consumers and producers; and (4)
identify further priority reforms that are needed to improve competition and efficiency in the
sector.

Table 1. Selected Statistics, Philippines
Philippines
Population 92,337,852
Land Area (square kilometer) 343,448
Population Density (people/sq km) 269
Poverty Incidence (2009) 20.90%
Per Capita GDP (2011; current US$) 2,370
Passenger cars (2010; per 1,000 people) 9
2. STUDY AREA
In selecting the focus of the study, we considered the following: (1) demographic indicators such
as population density and poverty incidence; (2) economic activity; and (3) observational
accounts of experts and stakeholders in the sector.
2.1 Inter-City Routes
Metro Manila is an agglomeration of 16 cities (Caloocan, Las Pinas, Makati, Malabon,
Mandaluyong, Manila, Marikina, Muntinlupa, Navotas, Pasay, Pasig, Paranaque, Quezon City,
San Juan, Taguig, Valenzuela) and one municipality (Pateros). It is the center of the country’s
economic activities and hence, the most dense area in the country. For the inter-city routes, we
focus on two routes in Metro Manila. We selected the routes to maximize the study’s coverage
in terms of length of route, number of passengers and operators, and population density along
the route. Route information are from DOTC (2012) and demographic data are shown in Table
2. The selected routes are listed in Table 3.
Table 2.
Land Area (sq km)
Population (2010)
Density (person/sq
km)
Poverty Incidence
(2012)
Philippines 343,448.32 92,337,852 269 27.9
National Capital Region 619.54 11,855,975 19,137 5.4
City of Manila 24.98 1,652,171 66,140

Calookan City 55.80 1,489,040 26,685 Las Pinas City 32.69 552,573 16,903 Makati City 21.57 529,039 24,527 Malabon 15.71 353,337 22,491 Mandaluyong City 9.29 328,699 35,382 Marikina City 21.52 424,150 19,710 Muntinlupa City 39.75 459,941 11,571 Navotas 8.94 249,131 27,867 Parañaque City 46.57 588,126 12,629 Pasay City 13.97 669,773 47,944 Pasig City 48.46 392,869 8,107 Pateros 10.40 64,147 6,168 Quezon City 171.71 2,761,720 16,084 San Juan 5.95 121,430 20,408 Taguig 45.21 644,473 14,255 Valenzuela City 47.02 575,356 12,236
Cordillera Administrative Region
19,422.0 1,616,867 83 28.7
Baguio Citya/ 57.51 318,676 5,541 6.0
Region IV-A 16,873.3 12,609,803 747 14.3
Lucena Cityb/ 80.21 246,392 3,072 29.2
a/ Poverty incidence is at the provincial level (Benguet) b/ Poverty incidence is at the provincial level (Quezon) Sources: National Statistics Office (NSO), National Statistical Coordination Board (NSCB)
Table 3. Intra-city route (Metro Manila route)
Route Name Route ID Round Trip
Distance (km)a
Characteristics Alternate modes of transportation
Alabang-SM Fairview via Lagro Commonwealth
MM45167210 87.416 Busiest, has the highest number of operators, one of the longest routes and passes through EDSA and major residential and commercial areas
Entire Route: Car
Portions: MRT (along the EDSA leg), jeepneys and AUVs (along Commonwealth)
Baclaran-Novaliches via EDSA Mindanao Avenue
MM521671EC 64.56 One of the busiest routes and has the highest average number of passengers in the DOTC (2012) survey
Entire Route: Car
Portions: AUVs, jeepneys
aSource: DOTC (2012) Development of a Mega Manila Public Transportation Planning Support System, Final
Report

2.2 Intra-City Routes
For the first intra-city routes we selected the route from Manila to Baguio City, which passes
through major agricultural zones and terminates close to an export processing zone north of
Manila. According to sector experts, this route also has among the most efficiently-run bus
services.
We also selected the route from Manila to Lucena City, which lies south of Metro Manila in the
largest but poorest province in the Southern Tagalog region. 1 The intra-city routes are listed in
Table 4.
Table 4. Inter-city route (provincial route)
Route Name Round Trip Distance (km)
Characteristics Alternate modes of transportation
Buendia, Pasay to Lucena City, Quezon
254.276 Busy inter-city route that reaches the capital of one of the largest provinces in the Southern Tagalog region.
Entire route: car, PNR
Portions: AUV, jeepneys
Cubao, Quezon City to Baguio City, Benguet
495.678 Busy inter-city route and has one of the most developed bus transportation based on quality of service.
Entire route: car
Portions: AUV, jeepneys
3. Policy Reforms
The project defines competition reforms as an aggregate of the following components:
Enabling government policies designed to facilitate a level playing field (i.e. removing
barriers to entry/exit; preventing abuse of market power; monitoring for and holding
accountable collusive behaviour) in a sector
Well-designed regulatory framework, adequate resourced regulatory institutions &
1 Logistical concerns limit us to cities that are located in Luzon.

effective actions for promoting fair competition in a sector
Well defined competition legislations and effective enforcement mechanisms.
3.1 Regulatory Agencies
Bus transportation in the Philippines is governed by the Department of Transportation and
Communication (DOTC) through its line agencies, the Land Transportation Franchising and
Regulatory Board (LTFRB) and the Land Transportation Office (LTO). The LTFRB regulates
entry and exit of bus operators and sets/regulates bus fares; the LTO helps implement the said
regulations through its registration and inspection functions. The market operates under a
highly complicated regime where regulation and enforcement is shared by several agencies
including the Metro Manila Development Authority (MMDA), the Philippine National Police
(PNP) and the relevant Local Government. Also indirectly involved through planning and
development of road infrastructure are the Department of Public Works and Highways (DPWH)
and National Economic Development Authority (NEDA).
3.2 Public transportation in the Philippines
Several modes of mass transportation operate in Metro Manila. Rail transport currently includes
three lines: Light Rail Transit 1, Light Rail Transit 2 and EDSA-Mass Transit (MRT-3). Road-
based mass transport consists of public utility buses (PUBs), public utility jeepneys (PUJs),
Asian Utility Vehicles (AUVs or Filcabs/FX), and Tricycle (TC) or pedicabs. Buses routes are
along the main thoroughfares such as Epifanio Delos Santos Avenue (EDSA), while Jeepneys
operate along secondary roads. While buses have designated stops, jeepneys stop at any point
to pick up or drop off passengers.
AUVs (named after the type of vehicle used by the service) have fixed routes of no more than
15 kilometers and have less capacity (7 to 11 persons) than buses and jeepneys. Tricycle and
pedicabs are bicycles with sidecars that seat one to three people and ply short distances in

residential areas and arterial roads. Appendices 1 to 4 show the route networks for rail, bus,
jeepney, and AUVs. It is not unusual for a commuter to combine two or more types of
transportation (e.g. tricycle, jeep and bus or MRT and jeep) to travel from home to work.
Franchise for operation of buses, jeepneys and AUVs are regulated by the LTFRB while those
for tricycles and pedicabs are under the LGUs.
Figure 1 shows the distribution of person trip mode along Commonwealth Avenue (along Route
MM45167210) based on data from Mega Manila Public Transportation Planning Support
System. The majority of public transport needs along this corridor is provided by buses.
Figure 1. Person trip mode shares along Commonwealth Avenue
PUJ = public utility jeeps; AUV = Asian utility vehicles; PUB= public utility buses; MC/TC= motorcycles/tricycles
3.3 Bus Transport Policy Reforms in the Philippines
26% 23%
30%
25%
5%
8%
35% 41%
4% 3%
0%
10%
20%
30%
40%
50%
60%
70%
80%
90%
100%
North-Bound South-Bound
Cars PUJ AUV PUB MC/TC
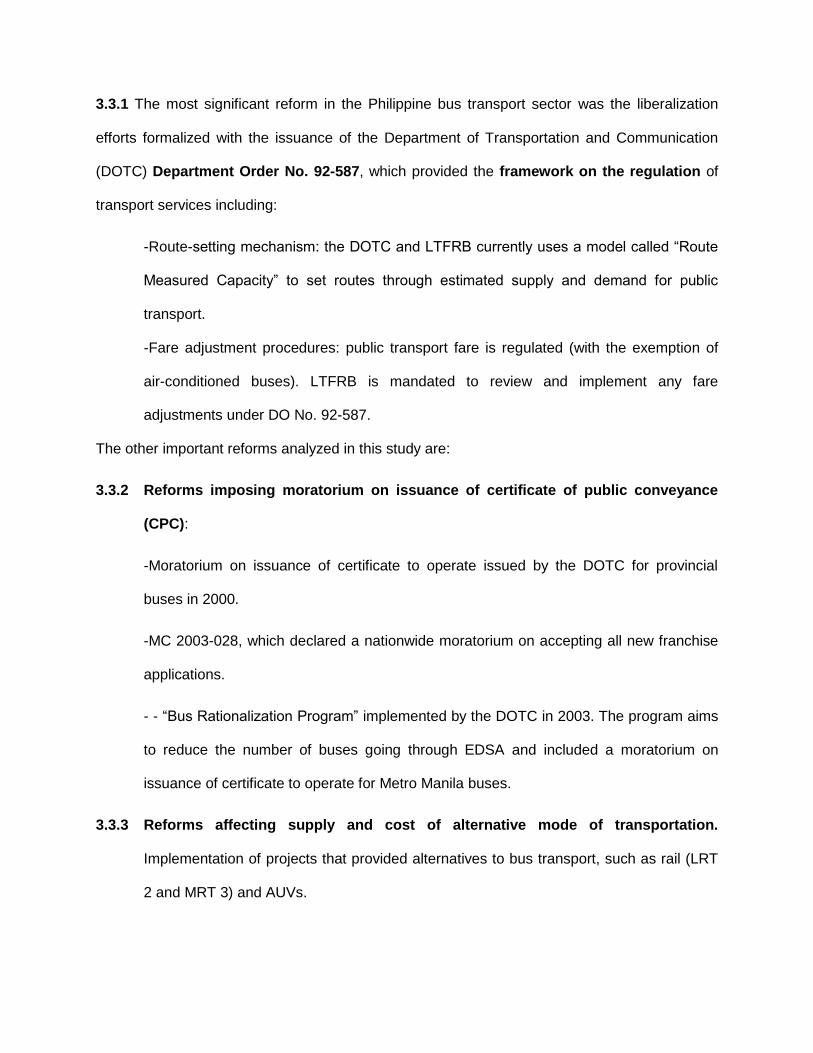
3.3.1 The most significant reform in the Philippine bus transport sector was the liberalization
efforts formalized with the issuance of the Department of Transportation and Communication
(DOTC) Department Order No. 92-587, which provided the framework on the regulation of
transport services including:
-Route-setting mechanism: the DOTC and LTFRB currently uses a model called “Route
Measured Capacity” to set routes through estimated supply and demand for public
transport.
-Fare adjustment procedures: public transport fare is regulated (with the exemption of
air-conditioned buses). LTFRB is mandated to review and implement any fare
adjustments under DO No. 92-587.
The other important reforms analyzed in this study are:
3.3.2 Reforms imposing moratorium on issuance of certificate of public conveyance
(CPC):
-Moratorium on issuance of certificate to operate issued by the DOTC for provincial
buses in 2000.
-MC 2003-028, which declared a nationwide moratorium on accepting all new franchise
applications.
- - “Bus Rationalization Program” implemented by the DOTC in 2003. The program aims
to reduce the number of buses going through EDSA and included a moratorium on
issuance of certificate to operate for Metro Manila buses.
3.3.3 Reforms affecting supply and cost of alternative mode of transportation.
Implementation of projects that provided alternatives to bus transport, such as rail (LRT
2 and MRT 3) and AUVs.
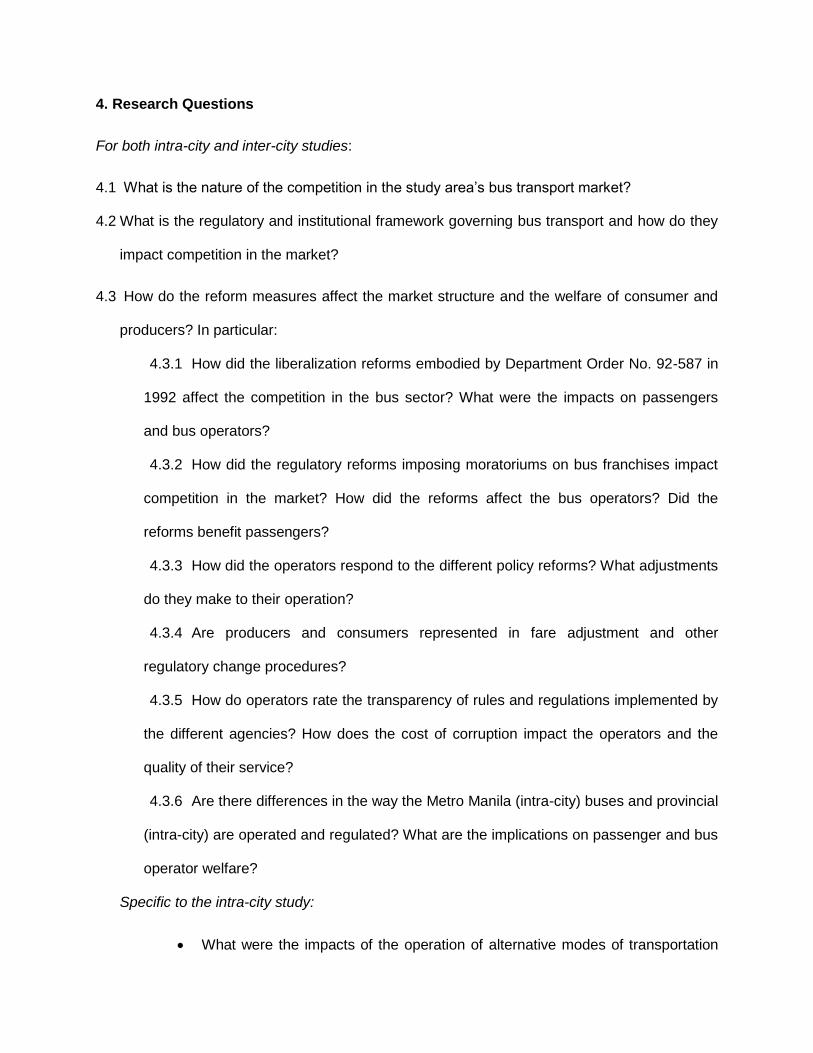
4. Research Questions
For both intra-city and inter-city studies:
4.1 What is the nature of the competition in the study area’s bus transport market?
4.2 What is the regulatory and institutional framework governing bus transport and how do they
impact competition in the market?
4.3 How do the reform measures affect the market structure and the welfare of consumer and
producers? In particular:
4.3.1 How did the liberalization reforms embodied by Department Order No. 92-587 in
1992 affect the competition in the bus sector? What were the impacts on passengers
and bus operators?
4.3.2 How did the regulatory reforms imposing moratoriums on bus franchises impact
competition in the market? How did the reforms affect the bus operators? Did the
reforms benefit passengers?
4.3.3 How did the operators respond to the different policy reforms? What adjustments
do they make to their operation?
4.3.4 Are producers and consumers represented in fare adjustment and other
regulatory change procedures?
4.3.5 How do operators rate the transparency of rules and regulations implemented by
the different agencies? How does the cost of corruption impact the operators and the
quality of their service?
4.3.6 Are there differences in the way the Metro Manila (intra-city) buses and provincial
(intra-city) are operated and regulated? What are the implications on passenger and bus
operator welfare?
Specific to the intra-city study:
What were the impacts of the operation of alternative modes of transportation

(LRT 2, MRT 3 and AUVs) on bus passengers and operators? Have the
availability of different modes of transportation benefited the poor (better access
to transportation services)?
5. Secondary Data Collected and Preliminary Findings
5.1 We have collected secondary data from established databases including the Metro Manila
Urban Transportation Integration Study (MMUTIS) and the Mega Manila Public Transportation
Planning Support System (MMPTPSS). We also reviewed existing literature and documents on
policies and regulations affecting competition in the bus transport sector.
Collected secondary data:
Data Source/s
Competition Reform documentation (legislation, statutory instruments, agency programs)
DOTC Department Orders and Memorandum Circulars; LTFRB, MMDA, LTO Memorandum Circulars and program documents, studies and references from the World Bank (WB), Asian Development Bank (ADB), University of the Philippines National Center for Transportation Studies (UP NCTS)
Cost of bus operation (per route) MMPTPSS
Number of franchises issued LTFRB
Number of registered buses, frequency of buses per day/route
LTO, MMUTIS and MMPTPSS
Number of passengers per route/day MMUTIS and MMPTPSS
Route distance/kilometres of available road, route network and other infrastructure data
MMUTIS and MMPTPSS, DOTC, DPWH
Socio-economic and land use data of the study area
National Statistical Coordination Board, National Statistics Office
5.2 Preliminary Analysis
The bus transport sector evolved from a highly regulated and concentrated market (less than 10
operators, with public participation, at least 100 units/operator) in the 1970s to the current
liberalized regime composed primarily of small operators (1,122 operators; 11 buses/operator).
Within Metro Manila (intra-city) over 5,000 buses are in operation.
DOTC Liberalization Policies (1992, D.O. No. 92-587)
Pre-reform: In the mid-70s, bus operation in Metro Manila was provided by four private consortia
and the Metro Manila Transit Corporation, a public-owned bus operator. The government
gradually allowed the formation of more consortia with a minimum of 100 buses each. By late
1970s, 14 companies were operating with 100 units each. Since the 1980s, bus operation had
been liberalized and deregulated.
Reform Policy: Department Order No. 92-587 formalized the liberalization policies by providing
a set of rules for entry and exit as well as rate- and fare-setting.
Entry and Exit – the control of entry and exit out of the industry is liberalized to introduce
or enhance the level of competition in fares and quality of service. Each route are required to
have a minimum of 2 operators. An operator who develops a new route will be allowed a
maximum of 2 years to operate solely, after which the route will be opened to at least one
additional operator. A new entrant will be allowed to operate in an existing route if the entrant
satisfies any of the following conditions: 1) the new operator is able to provide a more
efficient/cost-effective service than existing operators; 2) the new operator introduces quality or
service improvements and/or innovative/technologically-advanced services; 3) the route
warrants additional capacity; 4) practice of existing operators result in lack of competition; 4) the
existing operators has ceased operation (proven by LTFRB records); and 5) the existing
operator/s have violated the terms of their franchise and/or other LTFRB rules and regulations.
Franchise Terms- a certificate of public conveyance (CPC) or franchise describes the
route and service area and is valid for five years and can be renewed up to three times.
Fare Determination – LTFRB regulates bus fares and periodically reviews and adjusts

fares, rates and other related charges. Two factors are considered in fare determination: public
acceptability and financial viability for operators. A fare schedule (minimum and per-kilometer
fare) is set by the agency after a mandated public hearing. Passenger fares are deregulated,
except for the lowest class of service (non air-conditioned buses), which is set by the
government.
Post-Reform:
Table 5 shows the current number of operators and number of authorized buses operating in
routes in Metro Manila (within Metro Manila/intra-city and provincial routes originating from
Metro Manila/intra-city). Also shown are similar statistics for the specific routes selected in the
study. There are a total of 1,122 operators and 12,595 buses operating within/from Metro
Manila. The average operator has a franchise for 11 buses. The provincial operators on
average have smaller fleet than the inter-city routes.
In the study area, the Alabang-Fairview route has the highest number of operators. The
provincial routes (Baguio and Lucena) are more concentrated than the intra-city routes.
Table 5. Number of bus operators and buses, Manila Routes
Route Number of operators
Number of buses
Average no. of
bus/operator
Manila EDSA Route 266 3,711 14
Manila Non-EDSA Route 128 1,632 13
Manila-Provincial North Bound 371 3,684 10
Manila-Provincial South-Bound 357 3,568 10
TOTAL 1,122 12,595 11
Study Area Alabang-Fairview 21 341 16
Baclaran-Novaliches 17 171 10
Manila-Baguio 10 218 22
Manila-Lucena 10 132 13
TOTAL 58 862 15
Source: LTFRB

Impact on Congestion: Previous studies (JICA, 1997; 2009) and interviews with stakeholders
noted that congestion in Metro Manila is partly due to excess supply of buses. Negative
impacts of congestion include long travel time.
Policy Response to Congestion Issues: Moratorium on bus franchises
In an attempt to address congestion issues, DOTC issued Memorandum Circulars to impose a
moratorium on issuance of franchises for provincial buses in 2000. A nationwide moratorium on
new franchise followed in 2003. Nonetheless, LTO records show that new buses continue to be
registered each year. Interview with bus operators also revealed that the moratorium is not
binding since it is still possible to acquire a new franchise if one is willing to pay a stiff fixer’s fee
of PhP150,000 per unit. (The official franchise rate is only PhP510 for the first 2 units and
PhP70 for each additional unit thereafter).
Other Issues. The discussion at the NRG meeting raised other issues plaguing the bus
transportation sector including:
-operation of illegal (“colorum”) buses operating without a franchise
-cases where a franchise for one unit is duplicated and illegally used by several other units
The above proliferate due to weak enforcement of regulation and a regulatory framework
governed by too many agencies.
Further Analysis
In the context of Manila’s developing urban areas, designing a regulatory policy for the optimal
level of buses needs to address both competition policy and congestion issues. An optimal level
of regulation (on quantity of buses) must take into consideration the level of economic activity
and infrastructure development. The challenge is to incorporate these concerns in future efforts
to improve/enhance competition in the bus sector.

6. Data to be Collected and Types of Analysis
6.1 We are still in the process of gathering the data below:
Price data (bus ticket prices), fare changes LTFRB, Metro Manila Urban Transportation Integration Study database (MMUTIS) and Mega Manila Public Transportation Planning Support System database (MMPTPSS)
Market structure data, time series (number of operators and market share)
LTFRB
Substitute mode of transportation data (fare, ridership, capacity and cost of operation data)
MRT, LRT, DOTC and MMUTIS
Consumer and producer impacts of policy changes
FGD, Primary survey
6.2 Still to be conducted are the focus group discussions (FGDs) and the perception survey.
The stakeholders to be included in the FGD are: officials from DOTC, LTFRB, MMDA, NEDA,
and DPWH; representatives from National Consumers Affair Council (NACC) and bus operators
associations (Alliance of Concerned Transport Organizations (ACTO), Metro Bus Operators
Association (MBOA), Provincial Bus Operators Association (PBOA).
6.3 Methodology
Indicator of Market Structure: Herfindahl-Hirschman Index (HHI)
∑
, where si is the market share of firm i in the route, and N is the number of bus
operators. The higher the HHI is compared to 1/N, the less competitive is the bus market in the
route. Pursuant to DOTC D.O. 92-587, routes are required to have a minimum of two operators.
Market structure will be determined as follows:
Suggested classification:
Substantial competition:
Mild competition: 1.4<

In addition, we will also evaluate market concentration by measuring the share of the top 3
operators.
Analysis of welfare effects of reform: Qualitative Analysis
Welfare analysis will be done primarily through qualitative analysis. The data will be gathered
through FGD and perception survey.
The assessment of the impact of policy reforms on the bus operators will be implemented
through an FGD with bus operators. Similarly, the issues on representation in regulatory
changes and the impact of corruption on producers’ cost will also be explored by the FGD. The
comparison between provincial and intra-city (Metro Manila) bus operations will be analyzed
using FGD and/or stakeholder interviews along with literature research. The reforms providing
alternative modes of transportation will be assessed using passenger and fare data from
MMUTIS and MMPTPSS (consumer welfare) and FGD (consumer and producer welfare).
6.4 Focus Group Discussions
Two FGDs will be implemented. The composition will be as follows:
A. Regulators/Agencies:
DOTC (2)
LTFRB (2)
MMDA (1)
UP NCTS (1)
DPWH (1)
NEDA (1)
Total: 8
B. Bus operators/ Consumer associations

R
N
PP
Z
A
PP
n
)1(
)1(
2
2
ACTO (2)
MBAO (2)
PBOA (2)
NACC (2)
Total: 8
6.5 Perception Survey
To align the Philippine DCR with that of the other countries undertaking the study and gather
primary data for the consumer welfare analysis, a perception survey will be implemented. The
survey instrument will follow the CREW questionnaire for all countries.
The sample size for the perception survey is determined as follows2:
Where:
n is the sample size,
Z is the z-value at the desired confidence level (1.96 for 95%),
P is the estimated variance of an attribute that is present in the population (assumed
to be 0.5),
A is the precision level i.e., the margin of error allowed (5%),
R is the response rate (70% or 0.7), and
N is the total number of population
2 Nathan Associates (2013). Research Methods for the CREW Country Diagnostic Reports

Study area population
City Populationc (%)
Metro Manila 11,855,975 95%
Lucena 246,392 2%
Baguio 318,676 3%
TOTAL 12,421,043 100%
Source: National Statistics Office (2010), Census of Population.
Total Population (N) in the study area: 12,421,043
Sample size: 549
The sample will be distributed based on the share of the city population to the total study area
population. Metro Manila’s share (524) of the sample will be distributed equally into the four
routes since all routes originate (or are within) the city. Lucena and Baguio’s share of the sample
will be added in the corresponding inter-city routes. The resulting sample distribution is as
follows:
Route Sample size
Alabang-SM Fairview 131
Baclaran-Novaliches 131
Buendia (Metro Manila)-
Lucena
141
Cubao (Metro Manila)-
Baguio
145
Total 549
References:
Department of Transportation and Communication (DOTC), Republic of the Philippines (2012)
Development of a Mega Manila Public Transportation Planning Support System,
Final Report.
Japan International Cooperaton Agency (2007) Mega Manila Public Transport Study
(MMPTS), Final Report, Pacific Consultants International Philippines, Inc. and U.P.
Planning and Development Research Foundation, Inc.
Japan International Cooperation Agency (1999) Metro Manila Urban Transportation
Integration Study (MMUTIS), Final Report, Almec Corporation, Pacific Consultants
International and Yachiyo Engineering Co., Ltd.

Appendix 1. Rail Transit System Network, Metro Manila
Source: DOTC
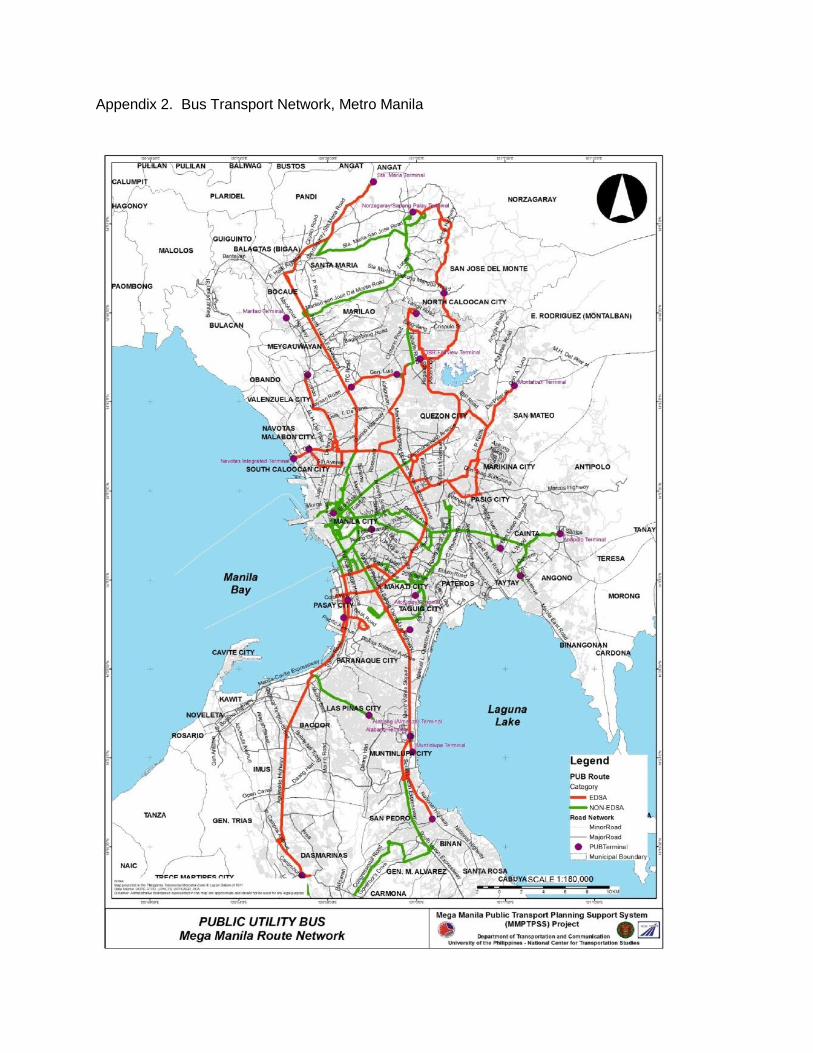
Appendix 2. Bus Transport Network, Metro Manila

Appendix 3. Jeepney Route Network, Metro Manila

Appendix 4. AUV Route Network, Metro Manila
Top Related