


Languages
Pages
Legal


Naturalgas20Reserves22Productionandconsumption27Prices28Trademovements
64thedition
BPStatisticalReviewofWorldEnergyJune2015bp.com/statisticalreview
#BPstats

20
Total proved reservesAt end 1994 At end 2004 At end 2013 At end 2014
Trillion cubic
metres
Trillion cubic
metres
Trillion cubic
metres
Trillion cubic
feet
Trillion cubic
metresShare of
totalR/P
ratio
US 4.6 5.5 9.6 345.0 9.8 5.2% 13.4Canada 1.9 1.6 2.0 71.7 2.0 1.1% 12.5Mexico 1.9 0.4 0.3 12.3 0.3 0.2% 6.0Total North America 8.5 7.5 12.0 429.0 12.1 6.5% 12.8Argentina 0.5 0.5 0.3 11.6 0.3 0.2% 9.3Bolivia 0.1 0.8 0.3 10.5 0.3 0.2% 13.9Brazil 0.1 0.3 0.5 16.4 0.5 0.2% 23.1Colombia 0.2 0.1 0.2 5.7 0.2 0.1% 13.7Peru 0.3 0.3 0.4 15.0 0.4 0.2% 33.0Trinidad & Tobago 0.3 0.5 0.3 12.2 0.3 0.2% 8.2Venezuela 4.0 4.3 5.6 197.1 5.6 3.0% *Other S. & Cent. America 0.2 0.1 0.1 2.0 0.1 ◆ 21.8Total S. & Cent. America 5.7 7.0 7.7 270.6 7.7 4.1% 43.8Azerbaijan n/a 0.9 0.9 41.2 1.2 0.6% 68.8Denmark 0.1 0.1 † 1.2 † ◆ 7.6Germany 0.2 0.2 0.1 1.5 † ◆ 5.6Italy 0.3 0.1 0.1 1.7 † ◆ 7.5Kazakhstan n/a 1.3 1.5 53.2 1.5 0.8% 78.2Netherlands 1.7 1.3 0.8 28.2 0.8 0.4% 14.3Norway 1.3 2.4 2.0 67.9 1.9 1.0% 17.7Poland 0.1 0.1 0.1 3.5 0.1 0.1% 23.6Romania 0.4 0.3 0.1 3.9 0.1 0.1% 9.6Russian Federation n/a 31.1 32.3 1152.8 32.6 17.4% 56.4Turkmenistan n/a 2.3 17.5 617.3 17.5 9.3% *Ukraine n/a 0.7 0.6 22.5 0.6 0.3% 34.3United Kingdom 0.7 0.5 0.2 8.5 0.2 0.1% 6.6Uzbekistan n/a 1.2 1.1 38.3 1.1 0.6% 19.0Other Europe & Eurasia 3.9 0.2 0.2 7.7 0.2 0.1% 32.7Total Europe & Eurasia 40.6 42.7 57.5 2049.5 58.0 31.0% 57.9Bahrain 0.2 0.1 0.2 6.4 0.2 0.1% 10.7Iran 20.8 27.5 34.0 1201.4 34.0 18.2% *Iraq 3.1 3.2 3.6 126.7 3.6 1.9% *Israel † † 0.2 6.7 0.2 0.1% 25.3Kuwait 1.5 1.6 1.8 63.0 1.8 1.0% *Oman 0.3 1.0 0.7 24.9 0.7 0.4% 24.3Qatar 7.1 25.4 24.7 866.2 24.5 13.1% *Saudi Arabia 5.3 6.8 8.2 288.4 8.2 4.4% 75.4Syria 0.2 0.3 0.3 10.1 0.3 0.2% 65.5United Arab Emirates 6.8 6.1 6.1 215.1 6.1 3.3% *Yemen 0.3 0.3 0.3 9.5 0.3 0.1% 28.0Other Middle East † † † 0.2 † ◆ 40.4Total Middle East 45.5 72.2 80.0 2818.6 79.8 42.7% *Algeria 3.0 4.5 4.5 159.1 4.5 2.4% 54.1Egypt 0.6 1.9 1.8 65.2 1.8 1.0% 37.9Libya 1.3 1.5 1.5 53.2 1.5 0.8% *Nigeria 3.5 5.2 5.1 180.1 5.1 2.7% *Other Africa 0.8 1.1 1.2 42.2 1.2 0.6% 60.3Total Africa 9.1 14.2 14.2 499.8 14.2 7.6% 69.8Australia 1.3 2.3 3.7 132.0 3.7 2.0% 67.6Bangladesh 0.3 0.4 0.3 8.9 0.3 0.1% 10.7Brunei 0.4 0.3 0.3 9.7 0.3 0.1% 23.3China 1.7 1.5 3.5 122.2 3.5 1.8% 25.7India 0.7 0.9 1.4 50.4 1.4 0.8% 45.0Indonesia 1.8 2.8 2.9 101.5 2.9 1.5% 39.2Malaysia 1.9 2.5 1.1 38.1 1.1 0.6% 16.2Myanmar 0.3 0.5 0.3 10.0 0.3 0.2% 16.8Pakistan 0.6 0.8 0.6 20.4 0.6 0.3% 13.8Papua New Guinea † † 0.2 5.3 0.2 0.1% 31.0Thailand 0.2 0.4 0.2 8.4 0.2 0.1% 5.7Vietnam 0.1 0.2 0.6 21.8 0.6 0.3% 60.4Other Asia Pacific 0.3 0.4 0.3 10.2 0.3 0.2% 15.6Total Asia Pacific 9.7 13.0 15.2 539.0 15.3 8.2% 28.7Total World 119.1 156.5 186.5 6606.4 187.1 100.0% 54.1of which: OECD 14.5 14.8 19.4 688.2 19.5 10.4% 15.6
Non-OECD 104.6 141.7 167.0 5918.3 167.6 89.6% 75.8European Union 3.6 2.8 1.5 52.7 1.5 0.8% 11.3Former Soviet Union 35.5 37.5 53.9 1926.9 54.6 29.2% 71.8
*More than 100 years. †Less than 0.05.
◆ Less than 0.05%.n/a not available.Notes: Total proved reserves of natural gas – Generally taken to be those quantities that geological and engineering information indicates with reasonable certainty can be recovered in the future from known reservoirs under existing economic and operating conditions. The data series for proved natural gas reserves does not necessarily meet the definitions, guidelines and practices used for determining proved reserves at company level, for instance as published by the US Securities and Exchange Commission, nor does it necessarily represent BP’s view of proved reserves by country.Reserves-to-production (R/P) ratio – If the reserves remaining at the end of any year are divided by the production in that year, the result is the length of time that those remaining reserves would last if production were to continue at that rate.Source of data – The estimates in this table have been compiled using a combination of primary official sources and third-party data from Cedigaz and the OPEC Secretariat.
Natural gas

21
160
0
80
120
40
NorthAmerica
S. & Cent.America
Europe &Eurasia
MiddleEast
Africa AsiaPacific
2014 by region
750
600
450
150
300
84 89 94 99 04 09 14 0
North America S. & Cent. America Europe & Eurasia Africa
Middle East Asia Pacific World
History
Reserves-to-production (R/P) ratiosYears
World proven natural gas reserves at end-2014 stood at 187.1 trillion cubic metres (tcm), sufficient to meet 54.1 years of global production. Proved reserves grew by 0.3% relative to end-2013. Growth in Russia (+0.4 tcm), Azerbaijan (+0.3 tcm) and the US (+0.2 tcm) accounted for all of the gross increase in global proved reserves in 2014. Iran (34.0 tcm) and Russia (32.6 tcm) hold the largest proved reserves.
Distribution of proved reserves in 1994, 2004 and 2014Percentage
7.6
42.74.1
6.5
31.0
8.2
27.3
4.84.4 46.1
8.3
2014Total 187.1trillion cubic
metres2004Total 156.5trillion cubic
metres1994
Total 119.1trillion cubic
metres
8.1
38.24.8
7.1
34.1
9.1
7.7
Middle EastEurope & EurasiaAsia PacificAfricaNorth AmericaS. & Cent. America

22
Production*
Billion cubic metres 2004 2005 2006 2007 2008 2009 2010 2011 2012 2013 2014
Change 2014 over
2013
2014share of
total
US 526.4 511.1 524.0 545.6 570.8 584.0 603.6 648.5 680.5 689.1 728.3 6.1% 21.4%Canada 183.7 187.1 188.4 182.7 176.6 164.0 159.9 159.7 156.0 156.1 162.0 3.8% 4.7%Mexico 43.4 52.2 57.3 53.6 53.4 59.3 57.6 58.3 57.2 58.2 58.1 -0.2% 1.7%Total North America 753.5 750.5 769.7 781.8 800.8 807.3 821.1 866.5 893.8 903.3 948.4 5.3% 27.7%Argentina 44.9 45.6 46.1 44.8 44.1 41.4 40.1 38.8 37.7 35.5 35.4 -0.3% 1.0%Bolivia 9.8 12.0 12.9 13.8 14.3 12.3 14.2 15.6 17.8 20.3 21.4 5.6% 0.6%Brazil 11.0 10.9 11.2 11.2 14.0 11.9 14.6 16.7 19.3 18.7 20.0 7.0% 0.6%Colombia 6.4 6.7 7.0 7.5 9.1 10.5 11.3 11.0 12.0 12.6 11.8 -6.3% 0.3%Peru 0.9 1.5 1.8 2.7 3.4 3.5 7.2 11.3 11.9 12.2 12.9 6.0% 0.4%Trinidad & Tobago 30.2 33.0 40.1 42.2 42.0 43.6 44.8 43.1 42.7 42.8 42.1 -1.8% 1.2%Venezuela 28.4 27.4 31.5 36.1 32.8 31.0 27.4 27.6 29.5 28.4 28.6 0.5% 0.8%Other S. & Cent. America 3.1 3.4 3.8 3.9 3.7 4.2 3.6 3.1 2.9 2.7 2.7 0.2% 0.1%Total S. & Cent. America 134.7 140.7 154.3 162.3 163.2 158.5 163.2 167.2 173.7 173.3 175.0 1.0% 5.0%Azerbaijan 4.5 5.2 6.1 9.8 14.8 14.8 15.1 14.8 15.6 16.2 16.9 4.6% 0.5%Denmark 9.4 10.4 10.4 9.2 10.1 8.4 8.2 6.6 5.8 4.8 4.6 -4.8% 0.1%Germany 16.4 15.8 15.6 14.3 13.0 12.2 10.6 10.0 9.0 8.2 7.7 -6.1% 0.2%Italy 11.9 11.1 10.1 8.9 8.5 7.3 7.7 7.7 7.9 7.1 6.6 -7.6% 0.2%Kazakhstan 12.3 12.7 13.0 15.1 16.9 16.4 15.9 17.5 18.4 18.6 19.3 3.4% 0.6%Netherlands 68.5 62.5 61.6 60.5 66.6 62.7 70.5 64.2 63.9 68.7 55.8 -18.7% 1.6%Norway 79.2 85.8 88.7 90.3 100.1 104.4 107.3 101.3 114.7 108.7 108.8 0.1% 3.1%Poland 4.4 4.3 4.3 4.3 4.1 4.1 4.1 4.3 4.3 4.2 4.2 -2.0% 0.1%Romania 12.8 12.4 11.9 11.5 11.4 11.3 10.9 10.9 10.9 10.9 11.4 5.4% 0.3%Russian Federation 573.3 580.1 595.2 592.0 601.7 527.7 588.9 607.0 592.3 604.7 578.7 -4.3% 16.7%Turkmenistan 52.8 57.0 60.4 65.4 66.1 36.4 42.4 59.5 62.3 62.3 69.3 11.1% 2.0%Ukraine 18.4 18.6 18.7 18.7 19.0 19.3 18.5 18.7 18.6 19.3 18.6 -3.7% 0.5%United Kingdom 96.4 88.2 80.0 72.1 69.6 59.7 57.1 45.2 38.9 36.5 36.6 0.3% 1.1%Uzbekistan 54.2 54.0 56.6 58.2 57.8 55.6 54.4 57.0 56.9 56.9 57.3 0.7% 1.6%Other Europe & Eurasia 11.0 10.7 10.5 10.7 10.2 10.1 10.1 9.5 8.8 7.5 6.7 -11.6% 0.2%Total Europe & Eurasia 1025.3 1028.8 1043.0 1041.2 1070.0 950.3 1021.7 1034.2 1028.2 1034.7 1002.4 -3.1% 28.8%Bahrain 9.8 10.7 11.3 11.8 12.7 12.8 13.1 13.3 13.7 15.8 16.9 7.2% 0.5%Iran 96.4 102.3 111.5 125.0 132.4 144.2 152.4 159.9 165.6 164.0 172.6 5.2% 5.0%Iraq 1.0 1.5 1.5 1.5 1.9 1.1 1.3 0.9 0.6 1.2 1.3 6.4% ◆
Kuwait 11.9 12.2 12.5 12.1 12.8 11.5 11.7 13.5 15.5 16.3 16.4 0.5% 0.5%Oman 18.5 19.8 23.7 24.0 24.1 24.8 27.1 26.5 30.0 30.5 29.0 -4.9% 0.8%Qatar 39.2 45.8 50.7 63.2 77.0 94.2 126.3 161.1 170.5 176.5 177.2 0.4% 5.1%Saudi Arabia 65.7 71.2 73.5 74.4 80.4 78.5 87.7 92.3 99.3 100.0 108.2 8.2% 3.1%Syria 6.4 5.5 5.6 5.6 5.3 5.6 8.0 7.1 5.2 4.7 4.4 -7.9% 0.1%United Arab Emirates 46.3 47.8 48.8 50.3 50.2 48.8 51.3 52.3 54.3 54.6 57.8 5.8% 1.7%Yemen – – – – – 0.8 6.2 9.4 7.6 10.3 9.6 -6.3% 0.3%Other Middle East 1.5 1.9 2.6 3.0 3.6 2.9 3.4 4.4 2.7 6.5 7.7 17.2% 0.2%Total Middle East 296.6 318.7 341.6 370.8 400.3 425.1 488.6 540.7 565.1 580.5 601.0 3.5% 17.3%Algeria 82.0 88.2 84.5 84.8 85.8 79.6 80.4 82.7 81.5 81.5 83.3 2.2% 2.4%Egypt 33.0 42.5 54.7 55.7 59.0 62.7 61.3 61.4 60.9 56.1 48.7 -13.1% 1.4%Libya 8.1 11.3 13.2 15.3 15.9 15.9 16.8 7.9 12.2 11.0 12.2 10.9% 0.4%Nigeria 24.4 25.1 29.6 36.9 36.2 26.0 37.3 40.6 43.3 36.2 38.6 6.6% 1.1%Other Africa 8.9 10.2 10.3 12.1 15.4 15.8 17.5 17.7 17.5 19.9 19.8 -0.4% 0.6%Total Africa 156.4 177.3 192.2 204.7 212.3 200.0 213.3 210.2 215.4 204.7 202.6 -1.0% 5.8%Australia 35.3 37.1 38.9 40.0 38.3 42.3 45.9 46.5 51.6 53.4 55.3 3.6% 1.6%Bangladesh 12.8 13.8 15.1 15.9 17.0 18.5 19.9 20.1 21.1 22.7 23.6 4.1% 0.7%Brunei 12.2 12.0 12.6 12.3 12.2 11.4 12.3 12.8 12.6 12.2 11.9 -2.9% 0.3%China 42.8 51.0 60.5 71.5 83.0 88.1 99.0 108.8 114.3 124.9 134.5 7.7% 3.9%India 29.2 29.6 29.3 30.1 30.5 39.2 50.8 46.1 40.3 33.7 31.7 -5.9% 0.9%Indonesia 74.6 75.1 74.3 71.5 73.7 76.9 85.7 81.5 77.1 72.1 73.4 1.7% 2.1%Malaysia 56.7 62.3 62.7 61.5 63.8 61.1 62.6 62.2 61.6 67.2 66.4 -1.2% 1.9%Myanmar 10.2 12.2 12.6 13.5 12.4 11.6 12.4 12.8 12.7 13.1 16.8 28.6% 0.5%Pakistan 34.5 39.1 39.8 40.5 41.4 41.6 42.3 42.3 43.7 42.7 42.0 -1.6% 1.2%Thailand 22.4 23.7 24.3 26.0 28.8 30.9 36.2 37.0 41.4 41.8 42.1 0.8% 1.2%Vietnam 4.2 6.4 7.0 7.1 7.5 8.0 9.4 8.5 9.4 9.8 10.2 4.7% 0.3%Other Asia Pacific 10.0 11.0 14.6 17.4 18.3 18.6 18.2 18.4 18.2 18.8 23.3 23.7% 0.7%Total Asia Pacific 344.8 373.4 391.7 407.3 426.9 448.2 494.7 496.9 504.0 512.3 531.2 3.7% 15.3%Total World 2711.3 2789.3 2892.5 2968.1 3073.4 2989.4 3202.6 3315.7 3380.2 3408.8 3460.6 1.6% 100.0%of which: OECD 1092.8 1084.3 1097.4 1101.0 1131.0 1128.4 1152.6 1171.6 1207.3 1214.9 1248.2 3.0% 36.3%
Non-OECD 1618.5 1705.0 1795.1 1867.1 1942.4 1860.9 2050.0 2144.1 2172.9 2194.0 2212.4 0.8% 63.7%European Union 229.5 214.1 203.0 190.2 192.1 174.7 178.0 157.0 148.1 146.6 132.3 -9.8% 3.8%Former Soviet Union 715.7 727.8 750.3 759.5 776.5 670.3 735.4 774.8 764.3 778.3 760.3 -2.3% 21.9%
* Excludes gas flared or recycled. Includes natural gas produced for Gas-to-Liquids transformation. Source: Includes data from Cedigaz. ◆ Less than 0.05%.Notes: As far as possible, the data above represents standard cubic metres (measured at 15ºC and 1013 mbar); as they are derived directly from tonnes of oil equivalent using an average conversion factor, they do not necessarily equate with gas volumes expressed in specific national terms. Annual changes and shares of total are calculated using million tonnes of oil equivalent figures. Natural gas production data expressed in billion cubic feet per day is available at bp.com/statisticalreview
23
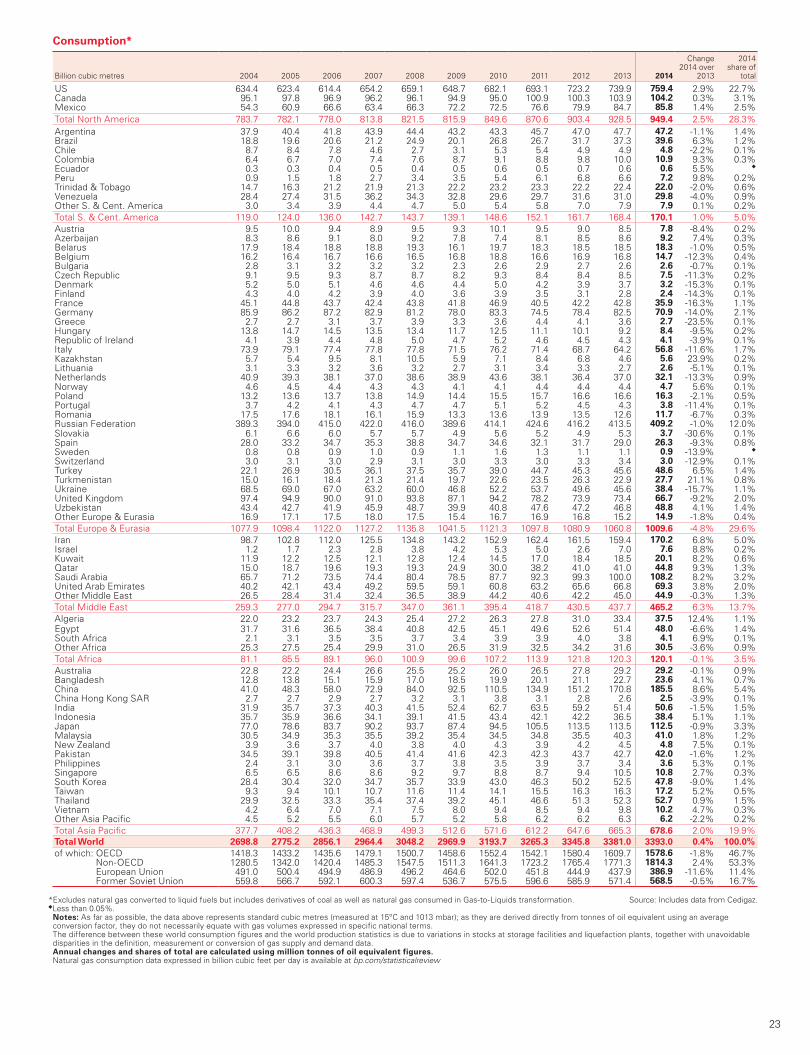
Consumption*
Billion cubic metres 2004 2005 2006 2007 2008 2009 2010 2011 2012 2013 2014
Change 2014 over
2013
2014share of
total
US 634.4 623.4 614.4 654.2 659.1 648.7 682.1 693.1 723.2 739.9 759.4 2.9% 22.7%Canada 95.1 97.8 96.9 96.2 96.1 94.9 95.0 100.9 100.3 103.9 104.2 0.3% 3.1%Mexico 54.3 60.9 66.6 63.4 66.3 72.2 72.5 76.6 79.9 84.7 85.8 1.4% 2.5%Total North America 783.7 782.1 778.0 813.8 821.5 815.9 849.6 870.6 903.4 928.5 949.4 2.5% 28.3%Argentina 37.9 40.4 41.8 43.9 44.4 43.2 43.3 45.7 47.0 47.7 47.2 -1.1% 1.4%Brazil 18.8 19.6 20.6 21.2 24.9 20.1 26.8 26.7 31.7 37.3 39.6 6.3% 1.2%Chile 8.7 8.4 7.8 4.6 2.7 3.1 5.3 5.4 4.9 4.9 4.8 -2.2% 0.1%Colombia 6.4 6.7 7.0 7.4 7.6 8.7 9.1 8.8 9.8 10.0 10.9 9.3% 0.3%Ecuador 0.3 0.3 0.4 0.5 0.4 0.5 0.6 0.5 0.7 0.6 0.6 5.5% ◆
Peru 0.9 1.5 1.8 2.7 3.4 3.5 5.4 6.1 6.8 6.6 7.2 9.8% 0.2%Trinidad & Tobago 14.7 16.3 21.2 21.9 21.3 22.2 23.2 23.3 22.2 22.4 22.0 -2.0% 0.6%Venezuela 28.4 27.4 31.5 36.2 34.3 32.8 29.6 29.7 31.6 31.0 29.8 -4.0% 0.9%Other S. & Cent. America 3.0 3.4 3.9 4.4 4.7 5.0 5.4 5.8 7.0 7.9 7.9 0.1% 0.2%Total S. & Cent. America 119.0 124.0 136.0 142.7 143.7 139.1 148.6 152.1 161.7 168.4 170.1 1.0% 5.0%Austria 9.5 10.0 9.4 8.9 9.5 9.3 10.1 9.5 9.0 8.5 7.8 -8.4% 0.2%Azerbaijan 8.3 8.6 9.1 8.0 9.2 7.8 7.4 8.1 8.5 8.6 9.2 7.4% 0.3%Belarus 17.9 18.4 18.8 18.8 19.3 16.1 19.7 18.3 18.5 18.5 18.3 -1.0% 0.5%Belgium 16.2 16.4 16.7 16.6 16.5 16.8 18.8 16.6 16.9 16.8 14.7 -12.3% 0.4%Bulgaria 2.8 3.1 3.2 3.2 3.2 2.3 2.6 2.9 2.7 2.6 2.6 -0.7% 0.1%Czech Republic 9.1 9.5 9.3 8.7 8.7 8.2 9.3 8.4 8.4 8.5 7.5 -11.3% 0.2%Denmark 5.2 5.0 5.1 4.6 4.6 4.4 5.0 4.2 3.9 3.7 3.2 -15.3% 0.1%Finland 4.3 4.0 4.2 3.9 4.0 3.6 3.9 3.5 3.1 2.8 2.4 -14.3% 0.1%France 45.1 44.8 43.7 42.4 43.8 41.8 46.9 40.5 42.2 42.8 35.9 -16.3% 1.1%Germany 85.9 86.2 87.2 82.9 81.2 78.0 83.3 74.5 78.4 82.5 70.9 -14.0% 2.1%Greece 2.7 2.7 3.1 3.7 3.9 3.3 3.6 4.4 4.1 3.6 2.7 -23.5% 0.1%Hungary 13.8 14.7 14.5 13.5 13.4 11.7 12.5 11.1 10.1 9.2 8.4 -9.5% 0.2%Republic of Ireland 4.1 3.9 4.4 4.8 5.0 4.7 5.2 4.6 4.5 4.3 4.1 -3.9% 0.1%Italy 73.9 79.1 77.4 77.8 77.8 71.5 76.2 71.4 68.7 64.2 56.8 -11.6% 1.7%Kazakhstan 5.7 5.4 9.5 8.1 10.5 5.9 7.1 8.4 6.8 4.6 5.6 23.9% 0.2%Lithuania 3.1 3.3 3.2 3.6 3.2 2.7 3.1 3.4 3.3 2.7 2.6 -5.1% 0.1%Netherlands 40.9 39.3 38.1 37.0 38.6 38.9 43.6 38.1 36.4 37.0 32.1 -13.3% 0.9%Norway 4.6 4.5 4.4 4.3 4.3 4.1 4.1 4.4 4.4 4.4 4.7 5.6% 0.1%Poland 13.2 13.6 13.7 13.8 14.9 14.4 15.5 15.7 16.6 16.6 16.3 -2.1% 0.5%Portugal 3.7 4.2 4.1 4.3 4.7 4.7 5.1 5.2 4.5 4.3 3.8 -11.4% 0.1%Romania 17.5 17.6 18.1 16.1 15.9 13.3 13.6 13.9 13.5 12.6 11.7 -6.7% 0.3%Russian Federation 389.3 394.0 415.0 422.0 416.0 389.6 414.1 424.6 416.2 413.5 409.2 -1.0% 12.0%Slovakia 6.1 6.6 6.0 5.7 5.7 4.9 5.6 5.2 4.9 5.3 3.7 -30.6% 0.1%Spain 28.0 33.2 34.7 35.3 38.8 34.7 34.6 32.1 31.7 29.0 26.3 -9.3% 0.8%Sweden 0.8 0.8 0.9 1.0 0.9 1.1 1.6 1.3 1.1 1.1 0.9 -13.9% ◆
Switzerland 3.0 3.1 3.0 2.9 3.1 3.0 3.3 3.0 3.3 3.4 3.0 -12.9% 0.1%Turkey 22.1 26.9 30.5 36.1 37.5 35.7 39.0 44.7 45.3 45.6 48.6 6.5% 1.4%Turkmenistan 15.0 16.1 18.4 21.3 21.4 19.7 22.6 23.5 26.3 22.9 27.7 21.1% 0.8%Ukraine 68.5 69.0 67.0 63.2 60.0 46.8 52.2 53.7 49.6 45.6 38.4 -15.7% 1.1%United Kingdom 97.4 94.9 90.0 91.0 93.8 87.1 94.2 78.2 73.9 73.4 66.7 -9.2% 2.0%Uzbekistan 43.4 42.7 41.9 45.9 48.7 39.9 40.8 47.6 47.2 46.8 48.8 4.1% 1.4%Other Europe & Eurasia 16.9 17.1 17.5 18.0 17.5 15.4 16.7 16.9 16.8 15.2 14.9 -1.8% 0.4%Total Europe & Eurasia 1077.9 1098.4 1122.0 1127.2 1135.8 1041.5 1121.3 1097.8 1080.9 1060.8 1009.6 -4.8% 29.6%Iran 98.7 102.8 112.0 125.5 134.8 143.2 152.9 162.4 161.5 159.4 170.2 6.8% 5.0%Israel 1.2 1.7 2.3 2.8 3.8 4.2 5.3 5.0 2.6 7.0 7.6 8.8% 0.2%Kuwait 11.9 12.2 12.5 12.1 12.8 12.4 14.5 17.0 18.4 18.5 20.1 8.2% 0.6%Qatar 15.0 18.7 19.6 19.3 19.3 24.9 30.0 38.2 41.0 41.0 44.8 9.3% 1.3%Saudi Arabia 65.7 71.2 73.5 74.4 80.4 78.5 87.7 92.3 99.3 100.0 108.2 8.2% 3.2%United Arab Emirates 40.2 42.1 43.4 49.2 59.5 59.1 60.8 63.2 65.6 66.8 69.3 3.8% 2.0%Other Middle East 26.5 28.4 31.4 32.4 36.5 38.9 44.2 40.6 42.2 45.0 44.9 -0.3% 1.3%Total Middle East 259.3 277.0 294.7 315.7 347.0 361.1 395.4 418.7 430.5 437.7 465.2 6.3% 13.7%Algeria 22.0 23.2 23.7 24.3 25.4 27.2 26.3 27.8 31.0 33.4 37.5 12.4% 1.1%Egypt 31.7 31.6 36.5 38.4 40.8 42.5 45.1 49.6 52.6 51.4 48.0 -6.6% 1.4%South Africa 2.1 3.1 3.5 3.5 3.7 3.4 3.9 3.9 4.0 3.8 4.1 6.9% 0.1%Other Africa 25.3 27.5 25.4 29.9 31.0 26.5 31.9 32.5 34.2 31.6 30.5 -3.6% 0.9%Total Africa 81.1 85.5 89.1 96.0 100.9 99.6 107.2 113.9 121.8 120.3 120.1 -0.1% 3.5%Australia 22.8 22.2 24.4 26.6 25.5 25.2 26.0 26.5 27.8 29.2 29.2 -0.1% 0.9%Bangladesh 12.8 13.8 15.1 15.9 17.0 18.5 19.9 20.1 21.1 22.7 23.6 4.1% 0.7%China 41.0 48.3 58.0 72.9 84.0 92.5 110.5 134.9 151.2 170.8 185.5 8.6% 5.4%China Hong Kong SAR 2.7 2.7 2.9 2.7 3.2 3.1 3.8 3.1 2.8 2.6 2.5 -3.9% 0.1%India 31.9 35.7 37.3 40.3 41.5 52.4 62.7 63.5 59.2 51.4 50.6 -1.5% 1.5%Indonesia 35.7 35.9 36.6 34.1 39.1 41.5 43.4 42.1 42.2 36.5 38.4 5.1% 1.1%Japan 77.0 78.6 83.7 90.2 93.7 87.4 94.5 105.5 113.5 113.5 112.5 -0.9% 3.3%Malaysia 30.5 34.9 35.3 35.5 39.2 35.4 34.5 34.8 35.5 40.3 41.0 1.8% 1.2%New Zealand 3.9 3.6 3.7 4.0 3.8 4.0 4.3 3.9 4.2 4.5 4.8 7.5% 0.1%Pakistan 34.5 39.1 39.8 40.5 41.4 41.6 42.3 42.3 43.7 42.7 42.0 -1.6% 1.2%Philippines 2.4 3.1 3.0 3.6 3.7 3.8 3.5 3.9 3.7 3.4 3.6 5.3% 0.1%Singapore 6.5 6.5 8.6 8.6 9.2 9.7 8.8 8.7 9.4 10.5 10.8 2.7% 0.3%South Korea 28.4 30.4 32.0 34.7 35.7 33.9 43.0 46.3 50.2 52.5 47.8 -9.0% 1.4%Taiwan 9.3 9.4 10.1 10.7 11.6 11.4 14.1 15.5 16.3 16.3 17.2 5.2% 0.5%Thailand 29.9 32.5 33.3 35.4 37.4 39.2 45.1 46.6 51.3 52.3 52.7 0.9% 1.5%Vietnam 4.2 6.4 7.0 7.1 7.5 8.0 9.4 8.5 9.4 9.8 10.2 4.7% 0.3%Other Asia Pacific 4.5 5.2 5.5 6.0 5.7 5.2 5.8 6.2 6.2 6.3 6.2 -2.2% 0.2%Total Asia Pacific 377.7 408.2 436.3 468.9 499.3 512.6 571.6 612.2 647.6 665.3 678.6 2.0% 19.9%Total World 2698.8 2775.2 2856.1 2964.4 3048.2 2969.9 3193.7 3265.3 3345.8 3381.0 3393.0 0.4% 100.0%of which: OECD 1418.3 1433.2 1435.6 1479.1 1500.7 1458.6 1552.4 1542.1 1580.4 1609.7 1578.6 -1.8% 46.7%
Non-OECD 1280.5 1342.0 1420.4 1485.3 1547.5 1511.3 1641.3 1723.2 1765.4 1771.3 1814.3 2.4% 53.3%European Union 491.0 500.4 494.9 486.9 496.2 464.6 502.0 451.8 444.9 437.9 386.9 -11.6% 11.4%Former Soviet Union 559.8 566.7 592.1 600.3 597.4 536.7 575.5 596.6 585.9 571.4 568.5 -0.5% 16.7%
*Excludes natural gas converted to liquid fuels but includes derivatives of coal as well as natural gas consumed in Gas-to-Liquids transformation. Source: Includes data from Cedigaz. ◆Less than 0.05%.
Notes: As far as possible, the data above represents standard cubic metres (measured at 15ºC and 1013 mbar); as they are derived directly from tonnes of oil equivalent using an average conversion factor, they do not necessarily equate with gas volumes expressed in specific national terms. The difference between these world consumption figures and the world production statistics is due to variations in stocks at storage facilities and liquefaction plants, together with unavoidable disparities in the definition, measurement or conversion of gas supply and demand data.Annual changes and shares of total are calculated using million tonnes of oil equivalent figures.Natural gas consumption data expressed in billion cubic feet per day is available at bp.com/statisticalreview

24
Production*
Million tonnes oil equivalent 2004 2005 2006 2007 2008 2009 2010 2011 2012 2013 2014
Change 2014 over
2013
2014share of
total
US 480.7 467.6 479.3 498.6 521.7 532.7 549.5 589.8 620.2 629.8 668.2 6.1% 21.4%Canada 165.3 168.4 169.6 164.4 158.9 147.6 143.9 143.7 140.4 140.5 145.8 3.8% 4.7%Mexico 39.0 47.0 51.6 48.2 48.0 53.3 51.8 52.4 51.5 52.4 52.3 -0.2% 1.7%Total North America 685.0 683.0 700.5 711.2 728.6 733.6 745.2 786.0 812.1 822.6 866.3 5.3% 27.7%Argentina 40.4 41.1 41.5 40.3 39.7 37.3 36.1 34.9 34.0 32.0 31.9 -0.3% 1.0%Bolivia 8.8 10.8 11.6 12.4 12.9 11.1 12.8 14.0 16.0 18.3 19.3 5.6% 0.6%Brazil 9.9 9.8 10.0 10.1 12.6 10.7 13.1 15.1 17.3 16.9 18.0 7.0% 0.6%Colombia 5.7 6.0 6.3 6.8 8.2 9.5 10.1 9.9 10.8 11.4 10.7 -6.3% 0.3%Peru 0.8 1.4 1.6 2.4 3.1 3.1 6.5 10.2 10.7 11.0 11.6 6.0% 0.4%Trinidad & Tobago 27.2 29.7 36.1 38.0 37.8 39.3 40.3 38.8 38.4 38.6 37.9 -1.8% 1.2%Venezuela 25.6 24.7 28.3 32.5 29.5 27.9 24.7 24.8 26.5 25.6 25.7 0.5% 0.8%Other S. & Cent. America 2.8 3.1 3.4 3.5 3.3 3.8 3.2 2.8 2.7 2.4 2.4 0.2% 0.1%Total S. & Cent. America 121.2 126.6 138.9 146.1 146.9 142.7 146.9 150.5 156.4 156.0 157.5 1.0% 5.0%Azerbaijan 4.1 4.7 5.5 8.8 13.3 13.3 13.6 13.3 14.0 14.6 15.3 4.6% 0.5%Denmark 8.5 9.4 9.4 8.3 9.1 7.6 7.4 5.9 5.2 4.4 4.2 -4.8% 0.1%Germany 14.7 14.2 14.1 12.9 11.7 11.0 9.6 9.0 8.1 7.4 6.9 -6.1% 0.2%Italy 10.7 10.0 9.1 8.0 7.6 6.6 6.9 7.0 7.1 6.4 5.9 -7.6% 0.2%Kazakhstan 11.1 11.4 11.7 13.6 15.2 14.8 14.3 15.7 16.5 16.7 17.3 3.4% 0.6%Netherlands 61.6 56.3 55.4 54.5 60.0 56.4 63.5 57.8 57.5 61.8 50.2 -18.7% 1.6%Norway 71.3 77.3 79.8 81.3 90.1 94.0 96.5 91.1 103.3 97.9 97.9 0.1% 3.1%Poland 3.9 3.9 3.9 3.9 3.7 3.7 3.7 3.8 3.9 3.8 3.7 -2.0% 0.1%Romania 11.5 11.2 10.7 10.4 10.3 10.1 9.8 9.8 9.8 9.8 10.3 5.4% 0.3%Russian Federation 516.0 522.1 535.6 532.8 541.5 474.9 530.0 546.3 533.0 544.2 520.9 -4.3% 16.7%Turkmenistan 47.5 51.3 54.3 58.9 59.5 32.7 38.1 53.6 56.1 56.1 62.3 11.1% 2.0%Ukraine 16.5 16.7 16.9 16.9 17.1 17.3 16.7 16.8 16.7 17.3 16.7 -3.7% 0.5%United Kingdom 86.7 79.4 72.0 64.9 62.7 53.7 51.4 40.7 35.0 32.8 32.9 0.3% 1.1%Uzbekistan 48.8 48.6 51.0 52.4 52.0 50.0 49.0 51.3 51.2 51.2 51.6 0.7% 1.6%Other Europe & Eurasia 9.9 9.6 9.4 9.6 9.2 9.1 9.1 8.5 7.9 6.8 6.0 -11.6% 0.2%Total Europe & Eurasia 922.7 925.9 938.7 937.0 963.0 855.2 919.5 930.8 925.4 931.2 902.1 -3.1% 28.8%Bahrain 8.8 9.6 10.2 10.6 11.4 11.5 11.8 12.0 12.4 14.2 15.2 7.2% 0.5%Iran 86.8 92.1 100.3 112.5 119.2 129.8 137.1 143.9 149.1 147.6 155.3 5.2% 5.0%Iraq 0.9 1.3 1.3 1.3 1.7 1.0 1.2 0.8 0.6 1.1 1.1 6.4% ◆
Kuwait 10.7 11.0 11.3 10.9 11.5 10.3 10.6 12.2 14.0 14.7 14.7 0.5% 0.5%Oman 16.7 17.8 21.3 21.6 21.7 22.3 24.4 23.9 27.0 27.5 26.1 -4.9% 0.8%Qatar 35.3 41.2 45.6 56.9 69.3 84.8 113.7 145.0 153.4 158.8 159.5 0.4% 5.1%Saudi Arabia 59.1 64.1 66.1 67.0 72.4 70.6 78.9 83.0 89.4 90.0 97.4 8.2% 3.1%Syria 5.8 4.9 5.1 5.0 4.8 5.0 7.2 6.4 4.7 4.3 3.9 -7.9% 0.1%United Arab Emirates 41.7 43.0 43.9 45.3 45.2 44.0 46.2 47.1 48.9 49.1 52.0 5.8% 1.7%Yemen – – – – – 0.7 5.6 8.5 6.8 9.2 8.7 -6.3% 0.3%Other Middle East 1.3 1.7 2.3 2.7 3.3 2.6 3.1 4.0 2.4 5.9 6.9 17.2% 0.2%Total Middle East 266.9 286.8 307.4 333.7 360.3 382.6 439.7 486.6 508.6 522.4 540.9 3.5% 17.3%Algeria 73.8 79.4 76.0 76.3 77.2 71.6 72.4 74.4 73.4 73.4 75.0 2.2% 2.4%Egypt 29.7 38.3 49.2 50.1 53.1 56.4 55.2 55.3 54.8 50.5 43.8 -13.1% 1.4%Libya 7.3 10.2 11.9 13.8 14.3 14.3 15.1 7.1 11.0 9.9 11.0 10.9% 0.4%Nigeria 22.0 22.5 26.6 33.2 32.6 23.4 33.6 36.5 39.0 32.6 34.7 6.6% 1.1%Other Africa 8.0 9.2 9.2 10.9 13.9 14.2 15.7 15.9 15.8 17.9 17.8 -0.4% 0.6%Total Africa 140.8 159.5 173.0 184.3 191.1 180.0 192.0 189.2 193.8 184.2 182.4 -1.0% 5.8%Australia 31.7 33.4 35.0 36.0 34.4 38.1 41.3 41.9 46.4 48.0 49.8 3.6% 1.6%Bangladesh 11.5 12.4 13.6 14.3 15.3 16.7 17.9 18.1 19.0 20.4 21.2 4.1% 0.7%Brunei 11.0 10.8 11.3 11.0 10.9 10.3 11.1 11.5 11.3 11.0 10.7 -2.9% 0.3%China 38.6 45.9 54.4 64.4 74.7 79.3 89.1 98.0 102.9 112.4 121.0 7.7% 3.9%India 26.3 26.7 26.4 27.1 27.5 35.3 45.8 41.5 36.3 30.3 28.5 -5.9% 0.9%Indonesia 67.1 67.6 66.9 64.4 66.4 69.2 77.1 73.3 69.4 64.9 66.1 1.7% 2.1%Malaysia 51.0 56.1 56.4 55.4 57.4 55.0 56.3 56.0 55.4 60.5 59.8 -1.2% 1.9%Myanmar 9.2 11.0 11.3 12.2 11.2 10.4 11.2 11.5 11.5 11.8 15.2 28.6% 0.5%Pakistan 31.0 35.1 35.8 36.5 37.3 37.4 38.1 38.1 39.4 38.4 37.8 -1.6% 1.2%Thailand 20.1 21.3 21.9 23.4 25.9 27.8 32.6 33.3 37.3 37.6 37.9 0.8% 1.2%Vietnam 3.7 5.8 6.3 6.4 6.7 7.2 8.5 7.6 8.4 8.8 9.2 4.7% 0.3%Other Asia Pacific 9.0 9.9 13.1 15.6 16.5 16.7 16.4 16.6 16.4 16.9 21.0 23.7% 0.7%Total Asia Pacific 310.3 336.1 352.5 366.6 384.2 403.4 445.3 447.2 453.6 461.1 478.1 3.7% 15.3%Total World 2447.0 2518.0 2611.0 2678.9 2774.0 2697.5 2888.6 2990.3 3049.9 3077.6 3127.3 1.6% 100.0%of which: OECD 990.4 983.4 995.4 998.6 1025.9 1022.7 1043.6 1060.6 1094.2 1103.0 1136.2 3.0% 36.3%
Non-OECD 1456.6 1534.5 1615.6 1680.4 1748.2 1674.8 1845.0 1929.7 1955.6 1974.6 1991.1 0.8% 63.7%European Union 206.5 192.7 182.7 171.2 172.9 157.2 160.2 141.3 133.3 132.0 119.1 -9.8% 3.8%Former Soviet Union 644.1 655.0 675.3 683.6 698.8 603.3 661.8 697.3 687.9 700.4 684.3 -2.3% 21.9%
*Excludes gas flared or recycled. Includes natural gas produced for Gas-to-Liquids transformation. Source: Includes data from Cedigaz. ◆ Less than 0.05%.

25
Consumption*
Million tonnes oil equivalent 2004 2005 2006 2007 2008 2009 2010 2011 2012 2013 2014
Change 2014 over
2013
2014share of
total
US 577.7 568.6 560.4 596.3 600.8 590.1 619.3 628.8 657.4 675.8 695.3 2.9% 22.7%Canada 85.6 88.0 87.3 86.6 86.5 85.4 85.5 90.8 90.2 93.5 93.8 0.3% 3.1%Mexico 48.8 54.8 59.9 57.1 59.7 65.0 65.2 68.9 71.9 76.2 77.2 1.4% 2.5%Total North America 712.1 711.5 707.6 739.9 747.0 740.5 770.0 788.6 819.6 845.5 866.3 2.5% 28.3%Argentina 34.1 36.4 37.6 39.5 40.0 38.9 39.0 41.1 42.3 42.9 42.4 -1.1% 1.4%Brazil 16.9 17.6 18.5 19.1 22.4 18.1 24.1 24.0 28.5 33.6 35.7 6.3% 1.2%Chile 7.8 7.5 7.0 4.1 2.4 2.8 4.8 4.8 4.4 4.4 4.3 -2.2% 0.1%Colombia 5.7 6.0 6.3 6.7 6.8 7.8 8.2 8.0 8.9 9.0 9.8 9.3% 0.3%Ecuador 0.3 0.3 0.4 0.4 0.4 0.5 0.5 0.5 0.6 0.5 0.6 5.5% ◆
Peru 0.8 1.4 1.6 2.4 3.1 3.1 4.9 5.5 6.1 5.9 6.5 9.8% 0.2%Trinidad & Tobago 13.2 14.7 19.1 19.7 19.2 19.9 20.9 21.0 20.0 20.2 19.8 -2.0% 0.6%Venezuela 25.6 24.7 28.3 32.5 30.9 29.5 26.7 26.7 28.5 27.9 26.8 -4.0% 0.9%Other S. & Cent. America 2.7 3.1 3.5 3.9 4.3 4.5 4.8 5.2 6.3 7.1 7.1 0.1% 0.2%Total S. & Cent. America 107.1 111.6 122.4 128.5 129.3 125.2 133.8 136.9 145.5 151.6 153.1 1.0% 5.0%Austria 8.5 9.0 8.5 8.0 8.6 8.4 9.1 8.5 8.1 7.6 7.0 -8.4% 0.2%Azerbaijan 7.5 7.7 8.2 7.2 8.2 7.0 6.7 7.3 7.7 7.7 8.3 7.4% 0.3%Belarus 16.1 16.5 16.9 16.9 17.4 14.5 17.8 16.5 16.7 16.7 16.5 -1.0% 0.5%Belgium 14.6 14.7 15.0 14.9 14.8 15.1 17.0 14.9 15.2 15.1 13.3 -12.3% 0.4%Bulgaria 2.5 2.8 2.9 2.9 2.9 2.1 2.3 2.6 2.5 2.4 2.4 -0.7% 0.1%Czech Republic 8.2 8.5 8.4 7.8 7.8 7.4 8.4 7.6 7.5 7.6 6.8 -11.3% 0.2%Denmark 4.7 4.5 4.6 4.1 4.1 4.0 4.5 3.8 3.5 3.4 2.8 -15.3% 0.1%Finland 3.9 3.6 3.8 3.5 3.6 3.2 3.6 3.1 2.7 2.6 2.2 -14.3% 0.1%France 40.6 40.3 39.3 38.2 39.4 37.6 42.2 36.4 38.0 38.6 32.3 -16.3% 1.1%Germany 77.3 77.6 78.5 74.6 73.1 70.2 75.0 67.1 70.5 74.2 63.8 -14.0% 2.1%Greece 2.4 2.4 2.8 3.3 3.5 2.9 3.2 4.0 3.7 3.2 2.5 -23.5% 0.1%Hungary 12.5 13.3 13.1 12.2 12.1 10.5 11.3 10.0 9.1 8.3 7.5 -9.5% 0.2%Republic of Ireland 3.7 3.5 3.9 4.3 4.5 4.3 4.7 4.1 4.0 3.9 3.7 -3.9% 0.1%Italy 66.5 71.2 69.7 70.0 70.0 64.4 68.6 64.3 61.8 57.8 51.1 -11.6% 1.7%Kazakhstan 5.1 4.9 8.5 7.3 9.4 5.3 6.3 7.6 6.1 4.1 5.1 23.9% 0.2%Lithuania 2.8 2.9 2.9 3.3 2.9 2.5 2.8 3.1 3.0 2.4 2.3 -5.1% 0.1%Netherlands 36.8 35.4 34.3 33.3 34.7 35.0 39.2 34.3 32.8 33.3 28.9 -13.3% 0.9%Norway 4.1 4.0 4.0 3.8 3.9 3.7 3.7 4.0 3.9 4.0 4.2 5.6% 0.1%Poland 11.9 12.2 12.4 12.4 13.5 13.0 14.0 14.1 15.0 15.0 14.7 -2.1% 0.5%Portugal 3.4 3.8 3.7 3.9 4.3 4.2 4.6 4.7 4.0 3.8 3.4 -11.4% 0.1%Romania 15.7 15.8 16.3 14.5 14.3 11.9 12.2 12.5 12.2 11.3 10.6 -6.7% 0.3%Russian Federation 350.4 354.6 373.5 379.8 374.4 350.7 372.7 382.1 374.6 372.1 368.3 -1.0% 12.0%Slovakia 5.5 5.9 5.4 5.1 5.2 4.4 5.0 4.6 4.4 4.8 3.3 -30.6% 0.1%Spain 25.2 29.8 31.2 31.8 34.9 31.2 31.1 28.9 28.6 26.1 23.7 -9.3% 0.8%Sweden 0.7 0.7 0.8 0.9 0.8 1.0 1.4 1.1 1.0 1.0 0.8 -13.9% ◆
Switzerland 2.7 2.8 2.7 2.6 2.8 2.7 3.0 2.7 2.9 3.1 2.7 -12.9% 0.1%Turkey 19.9 24.2 27.4 32.5 33.8 32.1 35.1 40.2 40.7 41.1 43.7 6.5% 1.4%Turkmenistan 13.5 14.5 16.5 19.1 19.3 17.7 20.4 21.2 23.7 20.6 24.9 21.1% 0.8%Ukraine 61.7 62.1 60.3 56.9 54.0 42.1 47.0 48.3 44.6 41.0 34.6 -15.7% 1.1%United Kingdom 87.6 85.4 81.0 81.9 84.4 78.4 84.8 70.4 66.5 66.1 60.0 -9.2% 2.0%Uzbekistan 39.1 38.4 37.7 41.3 43.8 35.9 36.8 42.9 42.5 42.2 43.9 4.1% 1.4%Other Europe & Eurasia 15.2 15.4 15.7 16.2 15.7 13.9 15.0 15.2 15.1 13.7 13.4 -1.8% 0.4%Total Europe & Eurasia 970.1 988.6 1009.8 1014.5 1022.2 937.4 1009.2 988.0 972.8 954.7 908.7 -4.8% 29.6%Iran 88.9 92.5 100.8 113.0 121.3 128.9 137.6 146.2 145.4 143.4 153.2 6.8% 5.0%Israel 1.1 1.5 2.1 2.5 3.4 3.8 4.8 4.5 2.3 6.3 6.8 8.8% 0.2%Kuwait 10.7 11.0 11.3 10.9 11.5 11.1 13.1 15.3 16.6 16.7 18.1 8.2% 0.6%Qatar 13.5 16.8 17.6 17.4 17.4 22.4 27.0 34.4 36.9 36.9 40.3 9.3% 1.3%Saudi Arabia 59.1 64.1 66.1 67.0 72.4 70.6 78.9 83.0 89.4 90.0 97.4 8.2% 3.2%United Arab Emirates 36.2 37.8 39.0 44.3 53.5 53.2 54.7 56.9 59.0 60.1 62.4 3.8% 2.0%Other Middle East 23.9 25.5 28.3 29.1 32.9 35.0 39.8 36.6 37.9 40.5 40.4 -0.3% 1.3%Total Middle East 233.4 249.3 265.2 284.1 312.3 325.0 355.9 376.8 387.5 393.9 418.6 6.3% 13.7%Algeria 19.8 20.9 21.4 21.9 22.8 24.5 23.7 25.1 27.9 30.0 33.7 12.4% 1.1%Egypt 28.5 28.4 32.9 34.5 36.8 38.3 40.6 44.7 47.3 46.3 43.2 -6.6% 1.4%South Africa 1.9 2.8 3.1 3.1 3.4 3.0 3.5 3.5 3.6 3.5 3.7 6.9% 0.1%Other Africa 22.7 24.8 22.9 26.9 27.9 23.8 28.7 29.2 30.8 28.5 27.4 -3.6% 0.9%Total Africa 73.0 77.0 80.2 86.4 90.8 89.6 96.5 102.5 109.7 108.2 108.1 -0.1% 3.5%Australia 20.5 19.9 22.0 23.9 23.0 22.7 23.4 23.9 25.1 26.3 26.3 -0.1% 0.9%Bangladesh 11.5 12.4 13.6 14.3 15.3 16.7 17.9 18.1 19.0 20.4 21.2 4.1% 0.7%China 36.9 43.5 52.2 65.6 75.6 83.2 99.4 121.4 136.0 153.7 166.9 8.6% 5.4%China Hong Kong SAR 2.4 2.4 2.6 2.5 2.9 2.8 3.4 2.7 2.5 2.4 2.3 -3.9% 0.1%India 28.7 32.1 33.5 36.3 37.4 47.1 56.4 57.2 53.2 46.3 45.6 -1.5% 1.5%Indonesia 32.1 32.3 32.9 30.7 35.2 37.3 39.1 37.9 38.0 32.8 34.5 5.1% 1.1%Japan 69.3 70.7 75.4 81.2 84.4 78.7 85.1 94.9 102.2 102.2 101.2 -0.9% 3.3%Malaysia 27.4 31.4 31.8 31.9 35.3 31.8 31.0 31.3 31.9 36.3 36.9 1.8% 1.2%New Zealand 3.5 3.2 3.3 3.6 3.4 3.6 3.9 3.5 3.8 4.0 4.3 7.5% 0.1%Pakistan 31.0 35.1 35.8 36.5 37.3 37.4 38.1 38.1 39.4 38.4 37.8 -1.6% 1.2%Philippines 2.1 2.8 2.7 3.2 3.4 3.4 3.2 3.5 3.3 3.0 3.2 5.3% 0.1%Singapore 5.9 5.9 7.7 7.7 8.3 8.7 7.9 7.9 8.5 9.5 9.7 2.7% 0.3%South Korea 25.5 27.3 28.8 31.2 32.1 30.5 38.7 41.7 45.2 47.3 43.0 -9.0% 1.4%Taiwan 8.4 8.5 9.1 9.6 10.5 10.2 12.7 14.0 14.7 14.7 15.5 5.2% 0.5%Thailand 26.9 29.3 30.0 31.8 33.6 35.3 40.5 41.9 46.1 47.0 47.4 0.9% 1.5%Vietnam 3.7 5.8 6.3 6.4 6.7 7.2 8.5 7.6 8.4 8.8 9.2 4.7% 0.3%Other Asia Pacific 4.1 4.7 4.9 5.4 5.1 4.6 5.2 5.6 5.6 5.7 5.6 -2.2% 0.2%Total Asia Pacific 340.0 367.3 392.7 422.0 449.4 461.4 514.4 551.0 582.8 598.8 610.7 2.0% 19.9%Total World 2435.6 2505.3 2577.9 2675.4 2751.0 2679.1 2879.7 2943.8 3017.8 3052.8 3065.5 0.4% 100.0%of which: OECD 1283.2 1297.5 1299.5 1338.7 1358.3 1318.9 1402.5 1392.9 1429.0 1458.6 1432.6 -1.8% 46.7%
Non-OECD 1152.4 1207.8 1278.4 1336.8 1392.8 1360.2 1477.2 1550.9 1588.8 1594.1 1632.9 2.4% 53.3%European Union 441.9 450.4 445.4 438.2 446.6 418.2 451.8 406.6 400.4 394.1 348.2 -11.6% 11.4%Former Soviet Union 503.8 510.0 532.9 540.3 537.6 483.0 518.0 536.9 527.3 514.2 511.6 -0.5% 16.7%
* Excludes natural gas converted to liquid fuels but includes derivatives of coal as well as natural gas consumed in Gas-to-Liquids transformation. Source: Includes data from Cedigaz. ◆ Less than 0.05%.
Note: The difference between these world consumption figures and the world production statistics is due to variations in stocks at storage facilities and liquefaction plants, together with unavoidable disparities in the definition, measurement or conversion of gas supply and demand data.

26
0
3500
2500
3000
500
1500
1000
2000
Rest of World Asia Pacific Europe & Eurasia North America
89 9994 0904 14
Production by regionBillion cubic metres
0
3500
2500
3000
500
1500
1000
2000
89 9994 0904 14
Consumption by regionBillion cubic metres
World natural gas production increased by 1.6% in 2014, four times the growth rate of global consumption (+0.4%). Production growth was below average in all regions except North America. The US (+6.1%) recorded the largest growth increment while Russia had the largest decline (-4.3%). Consumption growth was below average in all regions except North America and the Middle East. The US (+2.9%) recorded the largest growth in consumption in the world while the EU had the biggest decline on record (-11.6%).
Consumption per capita 2014Tonnes oil equivalent
0-0.50.5-1.0 1.0-1.51.5-2.0> 2.0
Source: Includes data from Cedigaz.

27
PricesLNG Natural gas Crude oil
US dollars per million BtuJapan
cifAverage German
Import Price*UK
(Heren NBP Index)†US
Henry Hub‡Canada
(Alberta)‡OECD
countries cif
1984 5.10 4.00 – – – 5.001985 5.23 4.25 – – – 4.751986 4.10 3.93 – – – 2.571987 3.35 2.55 – – – 3.091988 3.34 2.22 – – – 2.561989 3.28 2.00 – 1.70 – 3.011990 3.64 2.78 – 1.64 1.05 3.821991 3.99 3.19 – 1.49 0.89 3.331992 3.62 2.69 – 1.77 0.98 3.191993 3.52 2.50 – 2.12 1.69 2.821994 3.18 2.35 – 1.92 1.45 2.701995 3.46 2.39 – 1.69 0.89 2.961996 3.66 2.46 1.87 2.76 1.12 3.541997 3.91 2.64 1.96 2.53 1.36 3.291998 3.05 2.32 1.86 2.08 1.42 2.161999 3.14 1.88 1.58 2.27 2.00 2.982000 4.72 2.89 2.71 4.23 3.75 4.832001 4.64 3.66 3.17 4.07 3.61 4.082002 4.27 3.23 2.37 3.33 2.57 4.172003 4.77 4.06 3.33 5.63 4.83 4.892004 5.18 4.32 4.46 5.85 5.03 6.272005 6.05 5.88 7.38 8.79 7.25 8.742006 7.14 7.85 7.87 6.76 5.83 10.662007 7.73 8.03 6.01 6.95 6.17 11.952008 12.55 11.56 10.79 8.85 7.99 16.762009 9.06 8.52 4.85 3.89 3.38 10.412010 10.91 8.01 6.56 4.39 3.69 13.472011 14.73 10.49 9.04 4.01 3.47 18.562012 16.75 10.93 9.46 2.76 2.27 18.822013 16.17 10.73 10.63 3.71 2.93 18.252014 16.33 9.11 8.22 4.35 3.87 16.80
*Source: 1984-1990 German Federal Statistical Office, 1991-2014 German Federal Office of Economics and Export Control (BAFA). †Source: ICIS Heren Energy Ltd. ‡Source: Energy Intelligence Group, Natural Gas Week. Note: cif = cost+insurance+freight (average prices).
0
3
6
9
12
18 US Henry Hub Average German Import Price cif UK NBP Japan LNG cif
1412 1311100997 0099 98 02 0301 04 06 0705 08
15
Prices$/Mmbtu

28
Trade movements 2014 by pipelineBillion cubic metres From
To
US – 74.6 † – – – – – – – – – – – – – – – – – – – 74.6 Canada 21.8 – – – – – – – – – – – – – – – – – – – – – 21.8 Mexico 20.5 – – – – – – – – – – – – – – – – – – – – – 20.5 North America 42.3 74.6 † – – – – – – – – – – – – – – – – – – – 116.9
Argentina – – – 5.4 – – – – – – – – – – – – – – – – – – 5.4 Brazil – – – 11.1 0.1 – – – – – – – – – – – – – – – – – 11.1 Other S. & Cent. America – – – – 1.3 – – – – – – – – – – – – – – – – – 1.3 S. & Cent. America – – – 16.4 1.3 – – – – – – – – – – – – – – – – – 17.8
Austria – – – – – – 3.9 – – – – 3.9 – – – – – – – – – – 7.7 Belgium – – – – – 5.4 7.1 4.4 – – – 9.9 – – – – – – – – – – 26.8 Czech Republic – – – – – – 2.6 – – – – 4.7 – – – – – – – – – – 7.3 Finland – – – – – – – – – – – 3.1 – – – – – – – – – – 3.1 France – – – – – 4.9 15.5 – † – – 7.0 – – – – – – – – – – 27.4 Germany – – – – – 18.1 27.7 – 0.7 – – 38.5 – – – – – – – – – – 85.0 Greece – – – – – – – – 0.6 – – 1.7 – – – – – – – – – – 2.3 Hungary – – – – – – – – – – – 5.2 – – – – – – – – – – 5.2 Ireland – – – – – – – 4.5 – – – – – – – – – – – – – – 4.5 Italy – – – – – 8.3 4.8 – 0.3 – – 21.3 – – – – 6.2 6.0 – – – – 46.9 Netherlands – – – – – – 9.4 1.7 8.7 – – 3.5 – – – – – – – – – – 23.2 Poland – – – – – – – – 1.7 – – 8.9 – – – – – – – – – – 10.6 Slovakia – – – – – – – – – – – 4.3 – – – – – – – – – – 4.3 Spain – – – – – – 3.1 – 1.1 – – – – – – – 11.1 – – – – – 15.4 Turkey – – – – – – – – – 5.3 – 26.9 – – 8.9 – – – – – – – 41.1 United Kingdom – – – – – 6.6 25.9 – 0.4 – – – – – – – – – – – – – 32.9 Other Europe – – – – – 0.8 1.1 † 5.4 – – 8.8 – – – – 2.2 – – – – – 18.2
Europe – – – – – 44.1 101.1 10.6 18.8 5.3 – 147.7 – – 8.9 – 19.5 6.0 – – – – 361.9
Belarus – – – – – – – – – – – 17.9 – – – – – – – – – – 17.9 Kazakhstan – – – – – – – – – – – 4.3 0.5 2.0 – – – – – – – – 6.7 Russian Federation – – – – – – – – – 0.2 10.9 – 9.0 4.1 – – – – – – – – 24.2 Ukraine – – – – – – – – 4.6 – – 12.9 – – – – – – – – – – 17.5 Other Former Soviet Union – – – – – – – – – 1.9 0.2 4.6 – † 0.7 – – – – – – – 7.4
Former Soviet Union – – – – – – – – 4.6 2.1 11.1 39.8 9.5 6.1 0.7 – – – – – – – 73.8
Iran – – – – – – – – – 0.3 – – 6.5 – – – – – – – – – 6.9 Jordan – – – – – – – – – – – – – – – – – – 0.3 – – – 0.3 Oman – – – – – – – – – – – – – – – 2.1 – – – – – – 2.1 United Arab Emirates – – – – – – – – – – – – – – – 18.0 – – – – – – 18.0 Middle East – – – – – – – – – 0.3 – – 6.5 – – 20.1 – – 0.3 – – – 27.2 South Africa – – – – – – – – – – – – – – – – – – 4.0 – – – 4.0 Other Africa – – – – – – – – – – – – – – – – 4.0 – 0.5 – – – 4.5 Africa – – – – – – – – – – – – – – – – 4.0 – 4.5 – – – 8.5
Australia – – – – – – – – – – – – – – – – – – – – – 5.7 5.7 China – – – – – – – – – – 0.4 – 25.5 2.4 – – – – – – 3.0 – 31.3 Malaysia – – – – – – – – – – – – – – – – – – – 2.9 – – 2.9 Singapore – – – – – – – – – – – – – – – – – – – 6.6 – 1.7 8.3 Thailand – – – – – – – – – – – – – – – – – – – – 9.7 – 9.7 Asia Pacific – – – – – – – – – – 0.4 – 25.5 2.4 – – – – – 9.5 12.7 7.3 57.8 Total exports 42.3 74.6 † 16.4 1.3 44.1 101.1 10.6 23.4 7.7 11.4 187.4 41.6 8.5 9.6 20.1 23.5 6.0 4.8 9.5 12.7 7.3 663.9
†Less than 0.05. Source: Includes data from CISStat, FGE MENAgas service, IHS, PIRA Energy Group.
Trade movements 2014 as liquefied natural gasBillion cubic metres From
To
US – – 1.2 – 0.2 0.1 – – – – 0.2 – – – – – – – – – – – 1.7 Canada † – 0.6 – – – – – – – – – – – – – – – – – – – 0.6 Mexico † – 0.4 4.3 0.2 0.2 – – 1.4 – – – – – – 2.5 – – 0.3 – – – 9.3
North America † – 2.2 4.3 0.3 0.3 – – 1.4 – 0.2 – – – – 2.5 – – 0.3 – – – 11.6
Argentina – 0.1 3.4 – 0.2 1.1 – – 0.9 – – – – – – 0.9 – – – – – – 6.5 Brazil 0.1 – 1.9 – 1.1 1.7 – – 0.6 – – 0.1 0.1 – 0.5 1.9 – – – – – – 7.9 Chile – – 3.7 – – – – – 0.1 – – – – – 0.1 – – – – – – – 3.8 Other S. & Cent. America – – 2.6 – 0.1 0.1 – – 0.1 – – – – – – 0.2 – – – – – – 3.0 S. & Cent. America 0.1 0.1 11.5 – 1.3 2.9 – – 1.7 – – 0.1 0.1 – 0.5 3.0 – – – – – – 21.4
Belgium – – – – – – – – 2.9 – – † – – – – – – – – – – 2.9 France – – 0.1 0.1 0.2 0.1 – – 1.0 – – 4.4 – – 0.1 1.2 – – – – – – 7.1 Italy – – 0.1 – – 0.1 – – 4.3 – – 0.1 – – – – – – – – – – 4.5 Spain – – 2.0 1.2 1.2 0.2 – 0.2 3.0 – – 4.9 – – – 2.7 – – – – – – 15.5 Turkey – – 0.1 – 0.3 0.2 – – 1.1 – – 4.1 – – – 1.5 – – – – – – 7.3 United Kingdom – – 0.4 – – – – – 10.4 – – 0.5 – – – † – – – – – – 11.3 Other Europe & Eurasia – – 0.5 – 1.0 0.2 – – 0.9 – – 0.6 – – – 0.4 – – – – – – 3.5 Europe and Eurasia – – 3.1 1.3 2.7 0.8 – 0.2 23.6 – – 14.6 – – 0.1 5.8 – – – – – – 52.1 Middle East – – 1.2 – – 0.4 – 0.1 2.3 – 0.4 – – – – 0.7 0.1 – – 0.3 – – 5.4
China – – 0.2 – 0.2 0.3 0.2 0.2 9.2 – 1.4 0.3 0.2 0.2 1.0 0.6 5.2 0.2 3.5 4.1 0.4 0.1 27.1 India – – 0.1 – 0.1 0.3 – 0.1 16.2 0.1 0.6 0.2 – – – 1.2 – – – 0.1 – 0.1 18.9 Japan 0.3 – 0.2 0.1 0.5 1.3 11.5 4.7 21.9 7.7 1.3 1.0 0.1 0.1 1.2 6.5 25.0 5.9 7.8 20.3 3.0 – 120.6 Malaysia – – – – 0.1 0.2 – – 0.1 – 0.4 0.5 – 0.1 – 0.4 0.1 0.4 – 0.2 – – 2.4 Singapore – – 0.4 – – 0.2 – – – – – – – – 1.9 – – – 0.1 – – – 2.6 South Korea – – 0.2 – 0.1 1.5 2.6 5.1 17.7 0.1 4.2 0.5 0.1 0.1 0.1 4.4 1.2 1.0 7.1 5.1 – – 51.1 Taiwan – – 0.1 – – 0.1 0.1 0.2 8.0 – 0.3 0.1 – – 0.2 0.2 0.1 0.8 2.8 3.9 1.3 – 18.1 Thailand – – 0.1 – – – 0.1 0.1 1.3 – 0.1 – – – – 0.2 – – – 0.1 – – 1.9 Asia Pacific 0.3 – 1.2 0.1 0.9 3.8 14.5 10.4 74.4 8.0 8.3 2.6 0.4 0.4 4.4 13.3 31.6 8.3 21.4 33.7 4.7 0.2 242.7 Total exports 0.4 0.1 19.3 5.7 5.3 8.2 14.5 10.6 103.4 8.0 8.9 17.3 0.5 0.4 5.0 25.3 31.6 8.3 21.7 33.9 4.7 0.2 333.3
†Less than 0.05. Source: Includes data from GIIGNL, IHS Waterborne, PIRA Energy Group, Poten, Wood Mackenzie. *Includes re-exports.
Trin
idad
&
Tob
ago
US*
Peru
Nor
way
Oth
er
Eur
ope*
Rus
sian
F
eder
atio
n
Om
an
Qat
ar
Uni
ted
Ara
b E
mira
tes
Yem
en
Alg
eria
Egyp
t
Ang
ola
Equa
toria
l G
uine
a
Nig
eria
Aus
tral
ia
Bru
nei
Indo
nesi
a
Sou
th
Kor
ea*
Mal
aysi
a
Papu
a N
ew
Gui
nea
Tota
l im
po
rts
Bra
zil*
Can
ada
US
Mex
ico
Bol
ivia
Oth
er S
. & C
ent.
Am
eric
a
Net
herla
nds
Nor
way
Uni
ted
Kin
gdom
Oth
er E
urop
e
Kaz
akhs
tan
Aze
rbai
jan
Rus
sian
F
eder
atio
n
Turk
men
ista
n
Uzb
ekis
tan
Iran
Qat
ar
Alg
eria
Liby
a
Oth
er A
fric
a
Indo
nesi
a
Oth
er A
sia
P
acifi
cTo
tal
imp
ort
s
Mya
nmar

29
74.621.8
20.5
11.1
6.5
26.9
39.8
120.8
25.5
9.7
6.6
3.110.5
4.15.8 23.7
35.7
27.2
17.0
20.1
28.3 25.0
34.0
5.2
7.7
13.2
7.5
Pipeline gas
LNG
24.2
14.2
5.7
11.5
3.4
1.9
6.5
8.5
USCanadaMexicoS. & Cent. AmericaEurope & EurasiaMiddle EastAfrica Asia Pacific
Major trade movements 2014Trade flows worldwide (billion cubic metres)
Source: Includes data from Cedigaz, CISStat, FGE MENAgas service, GIIGNL, IHS Waterborne, PIRA Energy Group, Wood Mackenzie.
Gas trade in 2013 and 2014 2013 2014
Billion cubic metresPipeline imports
LNG imports
Pipeline exports
LNG exports
Pipeline imports
LNG imports
Pipeline exports
LNG exports
US 78.9 2.7 44.4 0.1 74.6 1.7 42.3 0.4 Canada 25.8 1.1 78.9 – 21.8 0.6 74.6 – Mexico 18.6 7.8 † – 20.5 9.3 † – Trinidad and Tobago – – – 19.8 – – – 19.3 Other S. & Cent. America 18.6 19.6 18.6 5.7 17.8 21.4 17.8 5.8 France 30.5 8.7 1.1 0.6 27.4 7.1 1.1 0.6 Germany 98.4 – 15.1 – 85.0 – 10.1 – Italy 51.6 5.5 0.2 – 46.9 4.5 0.2 – Netherlands 21.5 0.8 51.3 0.2 23.2 1.1 44.1 0.6 Norway † – 102.4 3.8 † – 101.1 5.3 Spain 15.3 14.9 0.9 2.6 15.4 15.5 0.6 5.1 Turkey 38.2 6.1 0.6 – 41.1 7.3 0.6 – United Kingdom 40.0 9.4 9.0 – 32.9 11.3 10.6 – Other Europe 99.5 6.0 11.8 1.6 90.0 5.3 10.8 2.0 Russian Federation 27.0 – 212.0 14.2 24.2 – 187.4 14.5 Ukraine 25.0 – – – 17.5 – – – Other Former Soviet Union 32.2 – 67.1 – 32.1 – 69.3 – Qatar – – 19.9 105.6 – – 20.1 103.4 Other Middle East 25.5 4.5 9.4 28.5 27.2 5.4 9.6 27.5 Algeria – – 28.8 14.9 – – 23.5 17.3 Other Africa 7.2 – 9.3 31.6 8.5 – 10.8 31.2 China 27.3 24.5 – – 31.3 27.1 – – Japan – 119.0 – – – 120.6 – – Indonesia – – 10.0 22.4 – – 9.5 21.7 South Korea – 54.2 – – – 51.1 – 0.2 Other Asia Pacific 26.4 40.4 16.7 73.5 26.5 43.9 20.0 78.6 Total World 707.5 325.3 707.5 325.3 663.9 333.3 663.9 333.3
†Less than 0.05. Source: Includes data from CISStat, FGE MENAgas service, GIIGNL, IHS Waterborne, PIRA Energy Group, Poten, Wood Mackenzie.
Top Related