


Languages
Pages
Legal


Contact BIO Intelligence Service S.A.S.
Shailendra Mudgal – Jonathan Bain
℡ +33 (0)1 53 90 11 80
European Commission DG ENTR
Preparatory Study for Eco-design Requirements
of EuPs [Contract N° S12.515749]
Lot 1
Refrigerating and freezing equipment: Service cabinets, blast cabinets, walk-in cold rooms, industrial process
chillers, water dispensers, ice-makers, dessert and beverage machines,
minibars, wine storage appliances and packaged condensing units
Task 6: Improvement
Potential
Final report
May 2011

2
European Commission, DG ENTR
Preparatory Study for Eco-design Requirements of EuPs
ENTR Lot 1: Refrigerating and freezing equipment – Task 6
May 2011
Project Team
BIO Intelligence Service
Mr. Shailendra Mudgal
Mr. Benoît Tinetti
Mr. Jonathan Bain
Mr. Raul Cervantes
Mr. Alvaro de Prado Trigo
Disclaimer:
The project team does not accept any liability for any direct or indirect damage resulting from the
use of this report or its content.
This report contains the results of research by the authors and is not to be perceived as the opinion
of the European Commission. The European Commission is not responsible for any use that may be
made of the information contained therein.

May 2011
European Commission, DG ENTR
Proposal for Preparatory Study for Eco-design Requirements of EuPs
ENTR Lot 1: Refrigerating and freezing equipment – Task 6
3
Contents
6. Improvement Potential .................................................................................................... 7
6.1. Introduction ..................................................................................................................... 7
6.2. Identification of design options ........................................................................................ 8
6.2.1. HT and LT service cabinet Base Cases ........................................................................................ 9
6.2.1.1 Option 1: High efficiency compressor ................................................................................. 10
6.2.1.2 Option 2: ECM fans for evaporator...................................................................................... 10
6.2.1.3 Option 3: ECM fans for condenser ....................................................................................... 10
6.2.1.4 Option 4: High efficiency fan blades .................................................................................... 11
6.2.1.5 Option 5: Sealing door frame .............................................................................................. 11
6.2.1.6 Option 6: R290 ..................................................................................................................... 11
6.2.1.7 Option 7: Thicker insulation................................................................................................. 11
6.2.1.8 Scenario A: Incorporates options 1+2+3+4+5+7 .................................................................. 11
6.2.1.9 Scenario B: Incorporates options 1+2+3+4+5+6+7 .............................................................. 12
6.2.2. Blast cabinet Base Case ............................................................................................................ 12
6.2.2.1 Option 1: High efficiency fan blades .................................................................................... 12
6.2.2.2 Option 2: Electronic Expansion Valve (EEV) ......................................................................... 13
6.2.2.3 Option 3: Variable speed drive (VSD) compressor .............................................................. 13
6.2.2.4 Option 4: Insulation thickness ............................................................................................. 13
6.2.2.5 Option 5: Evaporator ECM fans ........................................................................................... 14
6.2.2.6 Option 6: R290 ..................................................................................................................... 14
6.2.2.7 Scenario A: Incorporates options 1+2+3+4 .......................................................................... 14
6.2.2.8 Scenario B: Incorporates options 1+2+3+4+5 ...................................................................... 14
6.2.2.9 Scenario C: Incorporates options 1+2+3+4+5+6 .................................................................. 15
6.2.3. Walk-in cold room Base Case ................................................................................................... 15
6.2.3.1 Option 1: Strip door curtains ............................................................................................... 16
6.2.3.2 Option 2: Auto door closer .................................................................................................. 16
6.2.3.3 Options 3: PSCM fan for evaporator .................................................................................... 16
6.2.3.4 Options 4: ECM fan for evaporator...................................................................................... 16
6.2.3.5 Option 5: High efficiency fan blades .................................................................................... 16
6.2.3.6 Option 6: Thicker insulation................................................................................................. 17
6.2.3.7 Option 7: ECM fan for condenser ........................................................................................ 17
6.2.3.8 Option 8: R134a to replace R404a at HT, and R410a to replace R404a at LT ...................... 17
6.2.3.9 Option 9: High efficiency LED lighting .................................................................................. 17

4
European Commission, DG ENTR
Preparatory Study for Eco-design Requirements of EuPs
ENTR Lot 1: Refrigerating and freezing equipment – Task 6
May 2011
6.2.3.10 Option 10: Floating head pressure (plus electronic expansion valve) ................................. 17
6.2.3.11 Option 11: Ambient subcooling ........................................................................................... 17
6.2.3.12 Option 12: High efficiency compressor................................................................................ 18
6.2.3.13 Scenario A: Incorporates options 1+3+5+6+7 ...................................................................... 18
6.2.3.14 Scenario B: Incorporates all options 2+4+5 to 12 ................................................................ 18
6.2.4. MT and LT industrial process chiller Base Cases ...................................................................... 18
6.2.4.1 Option 1: Electronic expansion valve................................................................................... 19
6.2.4.2 Option 2: High efficiency compressor ................................................................................. 20
6.2.4.3 Option 3: Improved heat exchange ..................................................................................... 20
6.2.4.4 Option 4: ECM fan condenser .............................................................................................. 20
6.2.4.5 Option 5: Refrigerant R290 ................................................................................................. 21
6.2.4.6 Scenario A: Incorporates options 1+2+3 .............................................................................. 21
6.2.4.7 Scenario B: Incorporates options 1+2+3+5 .......................................................................... 21
6.2.5. MT and LT remote condensing unit Base Cases ....................................................................... 21
6.2.5.1 Option 1: Increased exchanger surfaces .............................................................................. 23
6.2.5.2 Option 2: ECM compressor .................................................................................................. 23
6.2.5.3 Option 3: Digital modulation control for compressor ......................................................... 23
6.2.5.4 Option 4: Scroll compressor ................................................................................................ 23
6.2.5.5 Option 5: Variable Speed Drive............................................................................................ 24
6.2.5.6 Option 6: High efficiency fan blades .................................................................................... 24
6.2.5.7 Option 7: ECM for fans ........................................................................................................ 24
6.2.5.8 Option 8: Refrigerant R290 .................................................................................................. 24
6.2.5.9 Scenario A: Increased exchanger surfaces + Scroll compressor + Variable Speed Drive +
High efficiency fan blades + ECM for fans + Refrigerant R290 .................................................................. 25
6.2.5.10 Scenario B: Increased exchanger surfaces + ECM compressor + Digital modulation for
compressor + High efficiency fan blades + ECM for fans .......................................................................... 25
6.3. Analysis BAT and LLCC .................................................................................................... 25
6.3.1. HT and LT service cabinet Base Cases ...................................................................................... 26
6.3.2. Blast cabinet Base Case ............................................................................................................ 32
6.3.3. Walk-in cold room Base Case ................................................................................................... 37
6.3.4. MT and LT process chiller Base Cases ...................................................................................... 42
6.3.5. MT and LT remote condensing unit Base Cases ....................................................................... 48
6.4. BNAT and long-term systems analysis ............................................................................. 53
6.5. Sensitivity analysis of the main parameters .................................................................... 54
6.5.1. Assumptions related to the product price ............................................................................... 55
6.5.2. Assumptions related to the product lifetime ........................................................................... 57

May 2011
European Commission, DG ENTR
Proposal for Preparatory Study for Eco-design Requirements of EuPs
ENTR Lot 1: Refrigerating and freezing equipment – Task 6
5
6.5.3. Assumptions related to the annual electricity consumption of the Base Cases ...................... 62
6.5.4. Assumptions related to the electricity tariff and the discount rate ........................................ 67
6.5.5. Assumptions related to the product stock ............................................................................... 71
6.6. Conclusions .................................................................................................................... 74

6
European Commission, DG ENTR
Preparatory Study for Eco-design Requirements of EuPs
ENTR Lot 1: Refrigerating and freezing equipment – Task 6
May 2011
This page is left intentionally blank

May 2011
European Commission, DG ENTR
Proposal for Preparatory Study for Eco-design Requirements of EuPs
ENTR Lot 1: Refrigerating and freezing equipment – Task 6
7
6. Improvement Potential
6.1. INTRODUCTION
Task 6 quantitatively analyses design options, based on the prioritised improvement
options selected in Task 5, for each of the product groups. The impact of each of these
“options” is calculated using the MEEuP EcoReport tool, and their environmental costs
and benefits, particularly relative energy consumption, and economic impacts, in terms
of Life Cycle Cost (LCC), are assessed. The assessment of monetary LCC is relevant as it
indicates whether design solutions may impact the user expenditure over the total
lifetime of the product (purchase, operating, end-of-life costs, etc.).
This allows identification of the Best Available Technology (BAT) solution, and the
option with the Least Life Cycle Costs (LLCC). The BAT will be the option that results in
the most significant reductions in environmental impacts and indicates a short- to
medium-term target that will probably be more subject to promotion measures than to
restrictive action. In the case where the LLCC solution is set as a minimum target, the
distance between the LLCC and the BAT indicates the remaining space for product-
differentiation (competition).
The Best Not yet Available Technologies (BNAT) are also discussed, assessing longer-
term improvement potential of the product groups.

8
European Commission, DG ENTR
Preparatory Study for Eco-design Requirements of EuPs
ENTR Lot 1: Refrigerating and freezing equipment – Task 6
May 2011
6.2. IDENTIFICATION OF DESIGN OPTIONS
This section presents the different improvement options applicable to each Base Case.
The design option(s) should:
• not have a significant variation in the functionality and in the performance
parameters compared to the Base Cases and in the product-specific inputs;
• have a significant potential for ecodesign improvement without significantly
deteriorating other impact parameters; and
• not entail excessive costs, and Impacts on the manufacturer should be
investigated.
The energy savings per technology are not additive. Instead, a common methodology
for all products has been used as described in Task 5 (section § 5.5). The energy saving
for the different improvement options are not additive. The percentage of savings per
option is subtracted from the energy consumption level that already accounts for
reductions enabled by other improvement options already considered. The example
below gives a better idea of the calculation methodology (figures do not correspond to
any particular product).
Improvement option Energy saving of AEC enabled
by improvement (%)
Product AEC (%)
Improvement 1 5 (100-5)
Improvement 2 10 (100-10)
Improvement 3 20 (100-20)
TOTAL 35 65
Final AEC = 100*((100-5)*(100-10)*(100-20)) = 68.4% of original
(reduction of 31.6% instead of the 35% calculated by addition of improvements)
For each of the improvement options, the modifications implied by their
implementation in the Base Case are quantified by the change in energy consumption.
It is currently assumed that the differences in the material used for the improvement
options are not significant, and hence changes in material quantities have not been
assessed. Besides, it is assumed that the improvement options are equally applicable
to all sub-types of equipment in each product category. However, the analysis
differentiates between positive and negative operating temperatures for service
cabinets, chillers and remote condensing units (as does the Base Case). The
improvement potential of a particular improvement option or a combination of
improvement options is evaluated using the MEEuP EcoReport tool.
The cost effectiveness of an improvement option can be expressed in terms payback
time in years, defined as a ratio between:
(Cost increase with reference to the Base Case) and (annual electricity consumption
difference in kWh*electricity tariff)

May 2011
European Commission, DG ENTR
Proposal for Preparatory Study for Eco-design Requirements of EuPs
ENTR Lot 1: Refrigerating and freezing equipment – Task 6
9
Besides, the impact on the life cycle cost of the Base Case of each individual design
option can be calculated. On this basis, the combination of design options with the
least life cycle cost can be identified.
In Task 7, the scenarios will be investigated as a basis for defining future Ecodesign
requirements, taking into account, among other parameters, life cycle costs and
technical constrains.
6.2.1. HT AND LT SERVICE CABINET BASE CASES
After an analysis of available technologies in Task 5, the improvement options selected
to reduce the environmental impacts of a service cabinet aim at reducing the total
energy consumption (TEC) of the cabinet. Each of the improvement options applicable
to the Base Case are presented in this section with their relative impacts on the
product cost compared to the Base Case.
Table 6-1 and Table 6-2 present the summary of the selected improvement options of
the Base Cases for service cabinets at high temperature (HT) and low temperature (LT).
Table 6-1: Identified energy saving potentials for the HT service cabinet Base Case
Improvement option TEC savings
compared to
Base Case (%)
Increase of product
price compared to
Base Case (€)
Payback
time
(years)
Option 1 High efficiency compressor 7% 20 1.19
Option 2 ECM evaporator fan motor 12% 18 0.63
Option 3 ECM condenser fan motor 8% 20 1.04
Option 4 High efficiency fan blades 3% 5 0.69
Option 5 Sealing door frame 19% 0 0.00
Option 6 R290 5% 40 3.33
Option 7 Thicker insulation 4% 100 10.42
Scenario A Incorporates options
1+2+3+4+5+7 43% 163 1.58
Scenario B Incorporates options
1+2+3+4+5+6+7 46% 203 1.84
Weighted real
BAT
improvement
As described in Task 5, this
product includes R290 75% 1300 7.22

10
European Commission, DG ENTR
Preparatory Study for Eco-design Requirements of EuPs
ENTR Lot 1: Refrigerating and freezing equipment – Task 6
May 2011
Table 6-2: Identified energy saving potentials for the LT service cabinet Base Case
Improvement option TEC savings
compared to
Base Case (%)
Increase of product
price compared to
Base Case (€)
Payback
time
(years)
Option 1 High efficiency compressor 10% 40 0.67
Option 2 ECM evap 7% 18 0.43
Option 3 ECM cond 3% 20 1.11
Option 4 High Efficiency Fan Blades 3% 5 0.28
Option 5 Sealing door frame 26% 0 0.00
Option 6 R290 5% 40 1.33
Option 7 Thicker insulation 5% 110 3.67
Scenario A Incorporates options
1+2+3+4+5 45% 193 0.71
Scenario B Incorporates options
1+2+3+4+5+6+7 47% 233 0.83
Weighted real
BAT
improvement
As described in Task 5, this
product includes R290 56% 1450 4.32
6.2.1.1 Option 1: High efficiency compressor
• Environmental impacts: by using a high efficiency compressor, the equipment
has a better performance and requires about 7% less energy input for HT, and
10% for LT, to achieve the same temperature targets.
• Costs: the cost of the original HT Base Case would increase approximately €20
if this technology is implemented, and €40 for LT.
• Constraints: none identified.
6.2.1.2 Option 2: ECM fans for evaporator
• Environmental impacts: ECM is more efficient, hence draws less power and
produces a lower heat load, reducing the burden on the refrigeration system.
This technology is estimated to save about 12% of the TEC for HT and 7% for
LT.
• Costs: € 18 for HT and LT, under 1% of the purchase prices.
• Constraints: none identified.
6.2.1.3 Option 3: ECM fans for condenser
• Environmental impacts: ECM is more efficient, hence draws less. This
technology is estimated to save about 8% of the TEC for HT and 3% for LT.
• Costs: €20 for HT and LT, 1% of the purchase prices.
• Constraints: none identified.

May 2011
European Commission, DG ENTR
Proposal for Preparatory Study for Eco-design Requirements of EuPs
ENTR Lot 1: Refrigerating and freezing equipment – Task 6
11
6.2.1.4 Option 4: High efficiency fan blades
• Environmental impacts: these could reduce the required power of the fan
motor, due to their high efficiency, hence reduce consumption of energy and
lower heat load created by the motors, also reducing the burden on the
refrigeration system. This technology is estimated to save about 3% of the TEC
for HT and LT.
• Costs: €5 for HT and LT, under 1% of the purchase prices.
• Constraints: none identified.
6.2.1.5 Option 5: Sealing door frame
• Environmental impacts: this design feature reduces the heat infiltration into
the internal volume of the product, thereby reducing the load on the
refrigeration system. This option could reduce TEC by 19% for HT and 26% for
LT.
• Costs: this option is thought to incur no additional costs.
• Constraints: none identified.
6.2.1.6 Option 6: R290
• Environmental impacts: this technology would reduce consumption of energy
of the refrigeration system, saving about 5% of the TEC for HT and LT, and
reduce the GWP due to leakage.
• Costs: €40 for HT and LT.
• Constraints: the flammability of the refrigerant would need to be carefully and
safely managed. Products would need modification to eliminate potential
sources of sparking (e.g. the internal light fitting and possibly motor starter). As
hydrocarbons are already widely used in the commercial market and domestic
sector, it is conceived that this is not a significant issue.
6.2.1.7 Option 7: Thicker insulation
• Environmental impacts: this technology would reduce consumption of energy
of the refrigeration system, saving about 4% of the TEC for HT and 5% LT
• Costs: approximately €100 for HT, and €110 for LT.
• Constraints: If the external dimensions of the product are constrained, thicker
insulation will reduce the internal storage.
6.2.1.8 Scenario A: Incorporates options 1+2+3+4+5+7
• Environmental impacts: the combination of these technologies is estimated to
reduce TEC by 43% for HT and 45% for LT.
• Costs: €163 for HT and €193 LT.
• Constraints: this option has the same constraint as each of its components.

12
European Commission, DG ENTR
Preparatory Study for Eco-design Requirements of EuPs
ENTR Lot 1: Refrigerating and freezing equipment – Task 6
May 2011
6.2.1.9 Scenario B: Incorporates options 1+2+3+4+5+6+7
• Environmental impacts: the combination of these technologies is estimated to
reduce TEC by 46% for HT and 47% for LT.
• Costs: €203 for HT and €233 for LT.
• Constraints: this option has the same constraint as each of its components. The
use of R290 has been cautioned by some stakeholders.
6.2.2. BLAST CABINET BASE CASE
The potential improvement options for blast cabinets are expressed in Table 6-3. The
improvement options aim to reduce the TEC of the equipment, by reducing the
electricity consumption during the use-phase. By comparison of the price of the actual
BAT model and the improvement potentials, the prices of the latter might have been
underestimated.
Table 6-3: Identified energy saving potentials for the Base Case Blast Cabinets
Improvement option
TEC savings
compared to base-
case (%)
Increase of
product price
compared to base-
case (€)
Payback
time
(years)
Option 1 High Efficiency Fan Blades 9% 10 0.3
Option 2 Electronic expansion valve 12% 100 1.8
Option 3 Variable speed drive (VSD)
compressor 10% 200 5.5
Option 4 Insulation thickness 4% 100 6.9
Option 5 ECM Fan for evaporator 7% 64 1.6
Option 6 R290 5% 200 11.0
Scenario A 1+2+3+4 31% 410 5.1
Scenario B 1+2+3+4+5 36% 450 4.7
Scenario C 1+2+3+4+5+6 39% 650 5.7
Weighted
real BAT
improvement
As described in Task 5 35% 753 5.9
6.2.2.1 Option 1: High efficiency fan blades
• Environmental impacts: this technology is estimated to save around 9% of the
TEC. It is relevant for blast cabinets due to the high use of energy used by the
fans.

May 2011
European Commission, DG ENTR
Proposal for Preparatory Study for Eco-design Requirements of EuPs
ENTR Lot 1: Refrigerating and freezing equipment – Task 6
13
• Costs: the implementation of this option is estimated to increase the price by €
10 per fan per product. The payback period of this technology is less than 1
year when compared to the weighted product price.
• Constraints: none identified.
6.2.2.2 Option 2: Electronic Expansion Valve (EEV)
• Environmental impacts: in contrast to traditional expansion valve, it is not
activated by thermostatic forces auctioning springs, bellows or pushing rods.
EEV are activated by more accurate signals emitted from an electronic
controller. Therefore, these are considered to be more precise and to have
fewer variations. Thanks to this, the TEC can be decreased by around 12%.
• Costs: the cost increase due to the addition of electronic expansion valve to
blast cabinets is about €100 per valve. The payback period of this technology is
less than 2 year when compared to the weighted product price.
• Constraints: this technology provides significant improvement, but requires
more maintenance as it is non-mechanical and less-robust.
6.2.2.3 Option 3: Variable speed drive (VSD) compressor
• Environmental impacts: VSD for compressors allows operation at a wide range
of workloads optimising the energy consumption and increasing the efficiency.
By using this technology it is possible to save up to 10% of the TEC.
• Costs: this technology increases the cost of the Base Case by € 400. The
payback period of this technology is less than 6 years when compared to the
weighted product price.
• Constraints: this technology could, if not controlled properly, reduce the
energy efficiency of the whole system by decreasing the heat exchange rate
and making the chilling or freezing process longer. Since food safety is the main
requirement of blast equipment, this option has to be carefully controlled to
avoid extra cycle time.
6.2.2.4 Option 4: Insulation thickness
• Environmental impacts: the heat transfer from the exterior is reduced by this
option, avoiding extra heat coming from the surroundings. In this way, the
refrigeration system is only focused on the heat load of the foodstuff. Using
this technology there is a potential to save up to 4%energy.
• Costs: the cost of the Base Case increases by € 100, i.e. 1.7% of the total price.
The payback time is estimated to be almost 7 years. The proportion of increase
in price to the energy savings prevents to integrate this improvement option to
other ones.
• Constraints: this option depends on the availability of space to fit the new
thickness of insulation. It is necessary to determine the optimal thickness
during the designing phase.

14
European Commission, DG ENTR
Preparatory Study for Eco-design Requirements of EuPs
ENTR Lot 1: Refrigerating and freezing equipment – Task 6
May 2011
6.2.2.5 Option 5: Evaporator ECM fans
• Environmental impacts: This technology increases the efficiency of the system
and leads to 7% energy savings as compared to the TEC.
• Costs: the implementation of this technology implies € 64 increase in cost as
compared to the initial Base Case, i.e. 1% of the final cost. The payback period
of this technology is less than 2 years when compared to the weighted product
price.
• Constraints: none identified.
6.2.2.6 Option 6: R290
• Environmental impacts: This technology increases the energy efficiency of
these machines, and reduces the GWP. The potential energy savings from using
R290 are 5%.
• Costs: the implementation of this technology implies 5% increase in cost as
compared to the initial Base Case, i.e. € 200. The payback period of this
technology is less than 11 years when compared to the weighted product price.
• Constraints: safety problems due to its flammability.
6.2.2.7 Scenario A: Incorporates options 1+2+3+4
• Environmental impacts: this option combines the benefits of option 1, 2, 3 and
4 which results in an estimated 31% of savings in the TEC. This saving is not a
simple addition of the savings resulting from each of the 4 options considered
here, but it is rather an estimation which considers possible overlaps. The
energy savings of every technology has been deducted from the reduced
energy used when applied another technology. In cost addition, this option is
the least expensive.
• Costs: the total increase in cost due to the combination presented in this
option is € 410, and has a payback time of 3.7 years.
• Constraints: this option has the same constraint as each of its components.
6.2.2.8 Scenario B: Incorporates options 1+2+3+4+5
• Environmental impacts: this option combines the benefits of option 1, 2, 3, 4
and 5 which results in an estimated 36% of savings in the TEC. This saving is not
a simple addition of the savings resulting from each of the 5 options considered
here, but it is rather an estimation which considers possible overlaps. The
energy savings of every technology has been deducted from the reduced
energy used when applied another technology.
• Costs: the total increase in cost due to this combination is € 450, and it has
payback time of 3.5 years.
• Constraints: this option has the same constraint as each of its components.

May 2011
European Commission, DG ENTR
Proposal for Preparatory Study for Eco-design Requirements of EuPs
ENTR Lot 1: Refrigerating and freezing equipment – Task 6
15
6.2.2.9 Scenario C: Incorporates options 1+2+3+4+5+6
• Environmental impacts: this option combines the benefits of option 1, 2, 3, 4, 5
and 6 which results in an estimated 39% of savings in the TEC. This saving is not
a simple addition of the savings resulting from each of the 6 options considered
here, but it is rather an estimation which considers possible overlaps. The
energy savings of every technology has been deducted from the reduced
energy used when applied another technology. In cost addition, this option is
the most expensive.
• Costs: the total increase in cost due to this combination is € 650, and it has
payback time of about 4.5 years.
• Constraints: this option has the same constraint as each of its components.
6.2.3. WALK-IN COLD ROOM BASE CASE
After a detailed analysis of available technologies in Task 5, the improvement options
selected to reduce the environmental impacts of a service cabinet aim at reducing the
TEC. Each of the improvement options applicable to the Base Case are presented here
with their relative impact on the product cost compared to the Base Case. Table 6-4
presents the summary of the selected improvement options.
Table 6-4: Identified energy saving potentials for the walk-in cold room Base Case
Improvement option
TEC savings
compared to
Base Case (%)
Increase of product
price compared to
Base Case (€)
Payback
time
(years)
Option 1 Strip door curtains 13% 70 0.37
Option 2 Auto door closer 12% 111 0.63
Option 3 PSC evaporator fan 10% 100 0.69
Option 4 ECM evaporator fan 13% 150 0.79
Option 5 High efficiency fan blades 3% 50 1.14
Option 6 Insulation thickness 15% 250 1.14
Option 7 ECM condenser fan 3% 60 1.37
Option 8
R134a to replace R404a at HT,
and R410a to replace R404a
at LT
0% 0 0.00
Option 9 High efficiency LED light bulbs 4% 200 3.43
Option 10 Floating head pressure (plus
electronic expansion valve) 8% 150 1.29
Option 11 Ambient subcooling 4% 170 2.91
Option 12 High efficiency compressor 5% 200 2.74
Scenario A Incorporates options
1+3+5+6+7 37% 530 0.98
Scenario B Incorporates all options
2+4+5 to 12 48% 1,341 1.92
Weighted real As described in Task 5, this 35% 1,760 3.45

16
European Commission, DG ENTR
Preparatory Study for Eco-design Requirements of EuPs
ENTR Lot 1: Refrigerating and freezing equipment – Task 6
May 2011
Improvement option
TEC savings
compared to
Base Case (%)
Increase of product
price compared to
Base Case (€)
Payback
time
(years)
BAT
improvement
product includes
R134a/R410a
6.2.3.1 Option 1: Strip door curtains
• Environmental impacts: this technology is estimated to save about 13% of the
TEC
• Costs: €70, under 1% of the purchase price.
• Constraints: none identified.
6.2.3.2 Option 2: Auto door closer
• Environmental impacts: this technology is estimated to save about 12% of the
TEC.
• Costs: €111, just over 1% of the purchase price.
• Constraints: none identified.
6.2.3.3 Options 3: PSCM fan for evaporator
• Environmental impacts: ECM is more efficient, hence draws less power and
produces a lower heat load, reducing the burden on the refrigeration system.
This technology is estimated to save about 10% of the TEC.
• Costs: €100, just over 1% of the purchase price.
• Constraints: none identified.
6.2.3.4 Options 4: ECM fan for evaporator
• Environmental impacts: ECM is more efficient, hence draws less power and
produces a lower heat load, reducing the burden on the refrigeration system.
This technology is estimated to save about 13% of the TEC.
• Costs: €150, just over 1% of the purchase price.
• Constraints: none identified.
6.2.3.5 Option 5: High efficiency fan blades
• Environmental impacts: these could reduce the required power of the fan
motor, due to their high efficiency, hence reducing consumption of energy and
lower heat load created by the motors, also reducing the burden on the
refrigeration system. This technology is estimated to save about 3% of the TEC.
• Costs: €50.
• Constraints: none identified.

May 2011
European Commission, DG ENTR
Proposal for Preparatory Study for Eco-design Requirements of EuPs
ENTR Lot 1: Refrigerating and freezing equipment – Task 6
17
6.2.3.6 Option 6: Thicker insulation
• Environmental impacts: this technology would reduce the heat load, hence
reduce consumption of energy of the refrigeration system, saving about 15% of
the TEC.
• Costs: €250, 3% of the purchase price.
• Constraints: this option would reduce the internal storage volume or increase
the product footprint.
6.2.3.7 Option 7: ECM fan for condenser
• Environmental impacts: ECM is more efficient, hence draws less power. This
technology is estimated to save about 3% of the TEC.
• Costs: €60.
• Constraints: none identified.
6.2.3.8 Option 8: R134a to replace R404a at HT, and R410a to replace R404a at LT
• Environmental impacts: this technology will reduce the GWP caused during use
and at disposal.
• Costs: this option is believed to have no additional costs.
• Constraints: none identified.
6.2.3.9 Option 9: High efficiency LED lighting
• Environmental impacts: this technology is estimated to save about 4% of the
TEC.
• Costs: €200.
• Constraints: none identified.
6.2.3.10 Option 10: Floating head pressure (plus electronic expansion valve)
• Environmental impacts: this technology could replace electric defrost, hence
reducing consumption of energy, saving about 8% of the TEC. The additional
piping and connections required would potentially increase leakage of
refrigerant from the product, and the size of the refrigerant charge would need
to be increased.
• Costs: €150, around 3.5% of the purchase price.
• Constraints: none identified.
6.2.3.11 Option 11: Ambient subcooling
• Environmental impacts: this technology is estimated to save about 4% of the
TEC.
• Costs: €170.

18
European Commission, DG ENTR
Preparatory Study for Eco-design Requirements of EuPs
ENTR Lot 1: Refrigerating and freezing equipment – Task 6
May 2011
• Constraints: none identified.
6.2.3.12 Option 12: High efficiency compressor
• Environmental impacts: this technology is estimated to save about 5% of the
TEC.
• Costs: €200.
• Constraints: none identified.
6.2.3.13 Scenario A: Incorporates options 1+3+5+6+7
Options 1 and 3 are selected in place of 2 and 4, to provide a “low-cost” option.
• Environmental impacts: the combination of these technologies is estimated to
be able to reduce TEC by 37%.
• Costs: €530.
• Constraints: this option has the same constraint as each of its components.
6.2.3.14 Scenario B: Incorporates options 2+4+5 to 12
Options 2 and 4 are selected in place of 1 and 3, to provide a “high-savings” option.
• Environmental impacts: the combination of these technologies is estimated to
be able to reduce TEC by 48%.
• Costs: €1,341.
• Constraints: this option has the same constraint as each of its components.
6.2.4. MT AND LT INDUSTRIAL PROCESS CHILLER BASE CASES
The analysis of available technologies for MT and LT chillers in Task 5 serves as input
for determining the best options and their environmental and economic input in the
present section. The objective of these technologies is to decrease TEC.
The summary of the costs and TEC savings of the improvement options considered for
MT and LT chillers are presented in Table 6-5 and Table 6-6.
The BAT model is presented as well. The increase in price for this has been estimated
by stakeholder to be around 50% of the product price. However, compared to the
single improvements it is not consistent. The resulting gap can be the product of
underestimation of the single improvement option prices and the overestimation of
the BAT price.
Table 6-5: Identified energy saving potentials for the MT chillers Base Case
Improvement option
TEC savings
compared to
base-case (%)
Increase of
product price
compared to
base-case (€)
Payback
time
(years)
Option 1 Electronic expansion valve* 5% 1,000 0.40

May 2011
European Commission, DG ENTR
Proposal for Preparatory Study for Eco-design Requirements of EuPs
ENTR Lot 1: Refrigerating and freezing equipment – Task 6
19
Improvement option
TEC savings
compared to
base-case (%)
Increase of
product price
compared to
base-case (€)
Payback
time
(years)
Option 2 High efficiency compressor** 5% 6,000 2.38
Option 3 Improved heat exchange** 15% 11,000 1.45
Option 4 ECM fan condenser*** 2% 2,200 2.18
Option 5 R290 5% 2,750 1.09
Scenario A Option 1+2+3 23% 18,000 1.53
Scenario B Option 1+2+3+5 27% 20,750 1.51
Weighted real
BAT
improvement
As described in Task 5 9% 27,500 6.05
*Savings only applicable to part-load. Energy savings possible, but this options does not change the COP value **Including several features within the options for increasing the component efficiency
***Only applicable to air-cooled chillers. To be considered for the MEPS (see Task 7)
Table 6-6: Identified energy saving potentials for the LT chillers Base Case
Improvement option
TEC savings
compared to
base-case (%)
Increase of
product price
compared to
base-case (€)
Payback
time
(years)
Option 1 Electronic expansion valve* 5% 1,000 0.28
Option 2 High efficiency compressor** 5% 7,000 1.99
Option 3 Improved heat exchange** 15% 14,000 1.32
Option 4 ECM fan condenser*** 2% 2,800 1.99
Option 5 R290 5% 3,500 0.99
Scenario A Option 1+2+3 23% 22,000 1.34
Scenario B Option 1+2+3+5 27% 25,500 1.33
Weighted real
BAT
improvement
As described in Task 5 9% 35,000 5.51
*Savings only applicable to part-load. Energy savings possible, but this options does not change the COP value **Including several features within the options for increasing the component efficiency
***Only applicable to air-cooled chillers. To be considered for the MEPS (see Task 7)
6.2.4.1 Option 1: Electronic expansion valve
• Environmental impacts: this kind of expansion valves do not use springs,
bellows or pushing rods activated by thermostatic forces to activate or de-
activate the system. Instead, they are activated through electronic signal
coming from electronic controllers. This results in chillers with more
adaptability and less energy consumption, around 5% reduction in TEC. It is
applicable only to part-load conditions. Hence, it has impact on the energy
consumption, but not on the COP value.
• Costs: the additional cost due to the electronic expansion valve to blast
cabinets is about € 1,000. The payback time is considered to be less than half a
year.

20
European Commission, DG ENTR
Preparatory Study for Eco-design Requirements of EuPs
ENTR Lot 1: Refrigerating and freezing equipment – Task 6
May 2011
• Constraints: None identified.
6.2.4.2 Option 2: High efficiency compressor
• Environmental impacts: this option considers the use of any of the
technologies as expressed in Task 5 that improve the efficiency of the
equipment, e.g. change of compressor type for more performing ones, etc. The
use of a high efficiency compressor allows better performance of the
equipment and leads to a reduction of 5% in energy consumption.
• Costs: this technology increases the equipment cost by €6,000 to 7,000, i.e.
10%, and has a payback period of around 2.5 for medium temperature
equipment and around 2 years for low temperature machines.
• Constraints: the applicability and results of this depends on the working
requirements of the product.
6.2.4.3 Option 3: Improved heat exchange
• Environmental impacts: this technology might include new heat exchanger
surfaces, e.g. microchannel, non-circular tubes (AC), flooded heat exchanger
(WC), and/or sub-cooling (AC/WC), selected from the relevant alternatives for
heat exchange technologies as stated in Task 5. According to stakeholders1 and
literature, the improvement of heat exchangers may vary between 10 to 20%
for water-cooled and, it is expected to be 15% for air-cooled. Therefore, for
this analysis it is considered that this option could lead to 15% of energy
consumption reduction.
• Costs: this technology increases the equipment cost by €11,000 (MT) or
€14,000 (LT). The payback time is considered to be less than 2 years.
• Constraints: the applicability and results of this depends on the working
requirements of the product.
6.2.4.4 Option 4: ECM fan condenser
• Environmental impacts: this technology could lead to 2% of savings in the TEC.
It is applicable only to air-cooled chillers. Therefore, it is considered only for
establishing the MEPS in task 7, but not during the analysis of this task.
• Costs: the increase in price is estimated to be around €2,200 and €2,800 for
medium and low temperature respectively. The estimated payback time under
these conditions is almost 2 years.
• Constraints: reduced flow on the condenser can lead to reduction of the heat
transfer. The application requires appropriate tuning, otherwise it can lead to
decrease in performance.
1 Source: Daikin, Trane, chiller expert

May 2011
European Commission, DG ENTR
Proposal for Preparatory Study for Eco-design Requirements of EuPs
ENTR Lot 1: Refrigerating and freezing equipment – Task 6
21
6.2.4.5 Option 5: Refrigerant R290
• Environmental impacts: it provides 5% of energy reduction, while it presents a
lower GWP value. An additional benefit is represented by the lower amount of
refrigerant needed in the equipment.
• Costs: the ambient sub-cooling is considered to increase the cost of the Base
Case between €2,750 and €3,500, 5% of the total cost. The payback time of this
option is around 1 year.
• Constraints: this option presents safety issues related to handling dangerous
materials.
6.2.4.6 Scenario A: Incorporates options 1+2+3
• Environmental impacts: the combination of the improvement options 1+2+3 is
estimated to provide 23% of energy savings for both MT chillers and LT chillers.
• Costs: the total increase in cost due to this combination is €18,000 and
€22,000, and has a payback time of little less than 2 year.
• Constraints: this option has the same constraint as each of its components.
6.2.4.7 Scenario B: Incorporates options 1+2+3+5
• Environmental impacts: the simultaneous application of options 1+2+3+4+5
can provide up to 27% of energy savings.
• Costs: the total increase in cost due to this combination is €20,750 to 25,500
(for MT and LT respectively), and has a payback time of almost 2 years.
• Constraints: this option has the same constraint as each of its components.
6.2.5. MT AND LT REMOTE CONDENSING UNIT BASE CASES
The technical analysis of best performance remote condensing units carried out in Task
5 showed several technologies are considered by stakeholders as potential energy
saving options.
Most of them are already in the market implemented in some products, even though
the high cost of some of them prevent their application to all the product ranges.
Regarding other environmental aspects of the product, some alternative refrigerants
have been pointed out by stakeholders, presenting lower GWP and similar energy
performance in the system, as shown in Task 5. However, only Propane has been
prioritised for the analysis when compared with the other improvement options.
The table below summarises some of these improvement measures.
Some of the improvement options selected do not have effect in the COP of the
condensing unit, being only beneficial for the lower annual energy consumption in part
load or seasonal conditions. Therefore, the power input reduction used in Task 7 is also
presented in the tables.

22
European Commission, DG ENTR
Preparatory Study for Eco-design Requirements of EuPs
ENTR Lot 1: Refrigerating and freezing equipment – Task 6
May 2011
Table 6-7: Identified energy saving potentials for the MT remote condensing unit Base Case
Improvement option
TEC savings
compared to
Base Case (%)
Power input
reduction
compared to
Base Case (%)
Increase of
product
price
compared
to Base Case
(€)
Payback
time
(years)
Option 1 Increase heat exchanger
surfaces 5 5 199 1.1
Option 2 ECM compressor 9 9 663 2.0
Option 3 Digital modulation control for
compressor* 10 0 663 1.8
Option 4 Scroll compressor 10 10 1,060 2.8
Option 5 Variable speed drive* 10 0 1,657 4.4
Option 6 High efficiency fan blades 0.5 0.5 133 7.1
Option 7 ECM for fans 0.5 0.5 331 17.7
Option 8 R290** 5 5 30 0.2
Scenario A Options 1+4+5+6+7+8 28 20 3,410 3.3
Scenario B Options 1+2+3+6+7 23 14 1,988 2.3
Weighted real
BAT
improvement
As described in Task 5 19 10 335 0.5
*Improvement at part load not reflected in COP
**This improvement also has lower direct GWP emissions
Table 6-8: Identified energy saving potentials for the LT remote condensing unit Base Case
Improvement option
TEC savings
compared to
Base Case (%)
Power input
reduction
compared to
Base Case (%)
Increase of
product
price
compared
to Base
Case (€)
Payback
time
(years)
Option 1 Increase heat exchanger
surfaces 5 5 238 0.8
Option 2 ECM compressor 9 9 793 1.5
Option 3 Digital modulation control for
compressor* 10 0 793 1.3
Option 4 Scroll compressor 10 10 1,269 2.1
Option 5 Variable speed drive* 10 0 1,983 3.3
Option 6 High efficiency fan blades 0.5 0.5 159 5.3
Option 7 ECM for fans 1 1 397 6.6
Option 8 R290** 5 5 40 0.1
Scenario A Options 1+4+5+6+7+8 28 20 4,086 2.4
Scenario B Options 1+2+3+6+7 23 15 2,380 1.7
Weighted real
BAT
improvement
As described in Task 5 20 11 5,478 4.6
*Improvement at part load not reflected in COP
**This improvement also has lower direct GWP emissions

May 2011
European Commission, DG ENTR
Proposal for Preparatory Study for Eco-design Requirements of EuPs
ENTR Lot 1: Refrigerating and freezing equipment – Task 6
23
6.2.5.1 Option 1: Increased exchanger surfaces
• Environmental impacts: Increased heat exchanger surfaces can save up to 5%
TEC.
• Cost: The increase in price of increased heat exchanger surface is €199 for MT
Base Case and €238 for LT Base Case. The payback period is 1.1 and 0.8 years,
respectively.
• Constraints: To increase the heat exchanger surface increases also the product
footprint, usually a quite important aspect for the end user.
6.2.5.2 Option 2: ECM compressor
• Environmental impacts: ECM compressor can save up to 9% of TEC in MT and
LT condensing units.
• Cost: the increase in price of condensing units using ECM is up to 10%
compared to the Base Case, and the payback period is around 2.0 years for MT
Base Case and 1.5 years for LT Base Case.
• Constraints: no drawback has been found for this improvement option.
6.2.5.3 Option 3: Digital modulation control for compressor
• Environmental impacts: A digital controlled motor for compressors allows the
condensing unit to modulate not only the rotation speed of the compressor
but also the flow of the refrigerant, optimising the energy consumption. This
allows the condensing unit to work at a wide range of workloads optimising the
energy consumption. This technology can save 10% of TEC compared to the
Base Case, depending on the operating conditions and characteristics of the
system.
• Cost: the increase in price of condensing units using digital controls is up to
10% compared to the Base Case, and the payback period is around 1.8 years
for MT Base Case and 1.3 years for LT Base Case.
• Constraints: this improvement is not reflected in a COP increase since this is
tested at one point, and does not take into account partial load conditions.
6.2.5.4 Option 4: Scroll compressor
• Environmental impacts: scroll compressors usually are more efficient than
hermetic reciprocating compressors, allowing up to 10% reduction in TEC,
depending on the size of the compressor and the cooling capacity of the
condensing unit.
• Cost: the increase in price of condensing units using scroll compressors is
around 16% compared to the Base Case, and the payback period is around 2.8
years for MT Base Case and 2.1 years for LT Base Case.
• Constraints: due to the increase in price scroll compressors are more suitable
to be used in condensing units for MT over 10kW of cooling capacity. For LT
condensing units, scroll compressors are usually only used up to 10 kW.

24
European Commission, DG ENTR
Preparatory Study for Eco-design Requirements of EuPs
ENTR Lot 1: Refrigerating and freezing equipment – Task 6
May 2011
6.2.5.5 Option 5: Variable Speed Drive
• Environmental impacts: Variable speed drive for compressors allows the
condensing unit to work at a wide range of workloads optimising the energy
consumption. This technology can save 10% of TEC compared to the Base Case,
depending on the operating conditions and characteristics of the system.
• Cost: the increase in price of condensing units using variable speed is up to 10%
compared to the Base Case, and the payback period is around 4.4 years for MT
Base Case and 3.3 years for LT Base Case.
• Constraints: this improvement is not reflected in a COP increase since this is
tested at one point, and does not take into account partial load conditions.
6.2.5.6 Option 6: High efficiency fan blades
• Environmental impacts: high efficiency fan blades for condenser can achieve up
to 0.5% of energy savings of the total energy consumption of the condensing
unit.
• Cost: the cost increase of high efficiency fan blades is around 0.5% of the price
of the condensing unit. The payback period of this improvement is about 7.1
years for MT condensing units and 5.3 years for LT condensing units
• Constraints: no drawback has been found for this improvement option.
6.2.5.7 Option 7: ECM for fans
• Environmental impacts: Electronically commutated motor for fans can achieve
0.5% of energy savings for MT remote condensing units and 1% of energy
savings for LT remote condensing units.
• Cost: The cost increase of ECM fans is around 5% of the total price of the
condensing unit. The payback period is of 17.7 years for MT Base Case and 6.6
years for LT Base Case.
• Constraints: no drawback has been found for this improvement option.
6.2.5.8 Option 8: Refrigerant R290
• Environmental impacts: the use of propane as refrigerant can provide 5%
energy savings compared to the Base Case, and the GWP direct emissions will
be much lower.
• Cost: the cost of using propane in remote condensing units around €30 per MT
unit and €40 per LT unit, and the payback time is around two months for MT
and LT condensing units.
• Constraints: propane is a flammable refrigerant, and its use is restricted
depending on the type of facility.

May 2011
European Commission, DG ENTR
Proposal for Preparatory Study for Eco-design Requirements of EuPs
ENTR Lot 1: Refrigerating and freezing equipment – Task 6
25
6.2.5.9 Scenario A: Increased exchanger surfaces + Scroll compressor + Variable Speed
Drive + High efficiency fan blades + ECM for fans + Refrigerant R290
• Environmental impacts: the combination of these technologies can achieve up
to 28% reduction in TEC compared to the condensing unit Base Case. However,
due to that some of the options included only achieve gains through better
part load performance, the power input reduction would be only of 20%.
• Cost: a condensing unit combining these technologies can increase the price by
€3,400 for MT and €4,000 for LT and the corresponding payback period is
around 3.3 years for MT and 2.4 years for LT.
• Constraints: some of these improvements are not reflected in a COP increase
since this is tested at one point, and does not take into account partial load
conditions.
6.2.5.10 Scenario B: Increased exchanger surfaces + ECM compressor + Digital modulation
for compressor + High efficiency fan blades + ECM for fans
• Environmental impacts: the combination of these technologies can achieve up
to 23% reduction in TEC compared to the condensing unit Base Case. However,
due to that some of the options included only achieve gains through better
part load performance, the power input reduction would be only of 14% for
medium temperature condensing units and 15% for low temperature units.
• Cost: a condensing unit combining these technologies can result in an increase
of the price by €2,000 for MT and €2,400 for LT, and the corresponding
payback period is around 2.3 years for MT and 1.7 years for LT.
• Constraints: some of these improvements are not reflected in a COP increase
since this is tested at one point, and does not take into account partial load
conditions.
6.3. ANALYSIS BAT AND LLCC
Scope: The design option(s) identified in the technical, environmental and economic
analysis in subtask 6.1 will be ranked to identify the Best Available Technology (BAT)
defined in subtask 5.1 and the LLCC. Drawing of a LCC-curve (Y-axis= LLCC, X-
axis=options) allows identification of these LLCC and BAT points2.
The performance will be compared using the weighted Base Case and applying to this
the improvement options. The comparison is made in terms of TEC, GWP, electricity
use and LCC. If some of the options are only applicable to small share of the market,
the impact on the energy will be weighted and then compared.
2 This is usually the last point of the curve showing the product design with the lowest environmental
impact, irrespective of the price.

26
European Commission, DG ENTR
Preparatory Study for Eco-design Requirements of EuPs
ENTR Lot 1: Refrigerating and freezing equipment – Task 6
May 2011
LLC is the sum of the Base Case price, plus cost of improvements, added to the costs of
electricity, and the costs of installation and maintenance as described in Task 4.
6.3.1. HT AND LT SERVICE CABINET BASE CASES
The following tables Table 6-10indicate the main impacts of the improvement options
proposed for the service cabinet Base Case. Combinations of the individual options are
also analysed.
Table 6-9: Summary of the cost and benefit effects of implementing individual
improvement options for the HT service cabinet Base Case
Option Option description
TEC
savings
(%)
Cost
increase
(Euros)
Annual
Energy
consumption
(kWh)
Total
Electricity
consumption
(MWh)*
Total CO2
emissions
(kg eq.
CO2)
Electricity
costs
(Euros)
LCC
(Euros)
0 Base Case 2,000 17.00 9.26 1701 2784
Option 1 High efficiency
compressor 7% 20 € 1,860 15.81 8.71 1582 2685
Option 2 ECM evaporator fan
motor 12% 18 € 1,760 14.96 8.32 1497 2598
Option 3 ECM condenser fan
motor 8% 20 € 1,840 15.64 8.63 1565 2668
Option 4 High efficiency fan
blades 3% 5 € 1,940 16.49 9.02 1650 2738
Option 5 Sealing door frame 19% 0 € 1,620 13.77 7.78 1378 2461
Option 6 R290 5% 40 € 1,900 16.15 8.48 1616 2739
Option 7 Thicker insulation 4% 100 € 1,920 16.32 8.95 1633 2816
Scenario A Incorporates options
1+2+3+4+5+7 43% 163 € 1,140 9.69 5.91 970 2216
Scenario B Incorporates options
1+2+3+4+5+6+7 46% 203 € 1,080 9.18 4.05 697 2205
Weighted real
BAT
improvement
As described in Task 5,
this product includes
R290
75% 1,300 € 500 4.25 3.02 425 2809
*: during the use phase
Table 6-10: Summary of the cost and benefit effects of implementing individual
improvement options for the Base Case LT service cabinet Base Case
Option Option description
TEC
savings
(%)
Cost
increase
(Euros)
Annual
Energy
consumption
(kWh)
Total
Electricity
consumption
(MWh)*
Total CO2
emissions
(kg eq.
CO2)
Electricity
costs
(Euros)
LCC
(Euros)
0 Base Case 5,000 42.50 21.19 4252 5436
Option 1 High efficiency
compressor 10% 40 € 4,500 38.25 20.22 3827 5051
Option 2 ECM evap 7% 18 € 4,650 39.53 20.81 3955 5156
Option 3 ECM cond 3% 20 € 4,850 41.23 21.59 4125 5328
Option 4 High Efficiency Fan
Blades 3% 5 € 4,850 41.23 21.59 4125 5313
Option 5 Sealing door frame 26% 0 € 3,700 31.45 17.11 3147 4330
Option 6 R290 5% 40 € 4,750 40.38 19.67 4040 5263
Option 7 Thicker insulation 5% 110 € 4,750 40.38 21.20 4040 5333
Scenario A Incorporates options
1+2+3+4+5 45% 193 € 2,750 23.38 13.41 2339 3715
Scenario B Incorporates options
1+2+3+4+5+6+7 47% 233 € 2,650 22.53 11.49 2254 3670

May 2011
European Commission, DG ENTR
Proposal for Preparatory Study for Eco-design Requirements of EuPs
ENTR Lot 1: Refrigerating and freezing equipment – Task 6
27
Option Option description
TEC
savings
(%)
Cost
increase
(Euros)
Annual
Energy
consumption
(kWh)
Total
Electricity
consumption
(MWh)*
Total CO2
emissions
(kg eq.
CO2)
Electricity
costs
(Euros)
LCC
(Euros)
Weighted real
BAT
improvement
As described in Task 5,
this product includes
R290
56% 1,450 € 2,200 18.70 9.74 1871 4504
*: during the use
phase
An environmental and economic assessment was carried out for each improvement option
and for their combination, using the EcoReport tool. Outcomes of these assessments, taking
into account the whole life cycle, are provided in Table 6-11 and Table 6-12 with absolute
values (in units) and variations with the Base Case.

28
European Commission, DG ENTR
Preparatory Study for Eco-design Requirements of EuPs
ENTR Lot 1: Refrigerating and freezing equipment – Task 6
May 2011
Table 6-11: Environmental impacts of the HT service cabinet Base Case and its improvement options
life-cycle indicators
per unit
unit Base Case Option 1 Option 2 Option 3 Option 4 Option 5 Option 6 Option 7 Scenario A Scenario B Weighted real BAT
improvement
Other resources
and waste
Total Energy
(GER)
GJ 194.97 182.47 173.55 180.69 189.61 161.05 186.04 187.83 118.21 112.86 61.09
% change with BC 0.00% -6.41% -10.99% -7.32% -2.75% -17.40% -4.58% -3.66% -39.37% -42.11% -68.67%
of which,
electricity
primary GJ 182.06 169.57 160.64 167.78 176.71 148.15 173.14 174.92 105.31 99.95 48.19
MWh 17.34 16.15 15.30 15.98 16.83 14.11 16.49 16.66 10.03 9.52 4.59
% change with BC 0.00% -6.86% -11.77% -7.84% -2.94% -18.63% -4.90% -3.92% -42.16% -45.10% -73.53%
Water (process) kL 18.18 17.35 16.75 17.23 17.82 15.92 17.59 17.70 13.06 12.71 9.26
% change with BC 0.00% -4.58% -7.85% -5.24% -1.96% -12.44% -3.27% -2.62% -28.15% -30.11% -49.09%
Water (cooling) kL 484.99 451.67 427.87 446.91 470.71 394.55 461.19 465.95 280.31 266.03 127.99
% change with BC 0.00% -6.87% -11.78% -7.85% -2.94% -18.65% -4.91% -3.93% -42.20% -45.15% -73.61%
Waste, non-haz./
landfill
kg 412.34 397.86 387.51 395.79 406.13 373.02 402.00 404.06 323.35 317.14 257.12
% change with BC 0.00% -3.51% -6.02% -4.02% -1.51% -9.54% -2.51% -2.01% -21.58% -23.09% -37.64%
Waste,
hazardous/
incinerated
kg 24.95 24.67 24.46 24.63 24.83 24.17 24.75 24.79 23.19 23.06 21.87
% change with BC 0.00% -1.15% -1.98% -1.32% -0.49% -3.13% -0.82% -0.66% -7.09% -7.58% -12.36%
Emissions (Air)
Greenhouse
Gases in GWP100
t CO2 eq. 9.26 8.71 8.32 8.63 9.02 7.78 8.48 8.95 5.91 5.28 3.02
% change with BC 0.00% -5.89% -10.10% -6.73% -2.52% -15.99% -8.44% -3.37% -36.18% -42.94% -67.34%
Acidification,
emissions
kg SO2 eq. 52.44 49.22 46.92 48.76 51.06 43.70 50.14 50.60 32.67 31.29 17.96
% change with BC 0.00% -6.14% -10.52% -7.01% -2.63% -16.65% -4.38% -3.51% -37.69% -40.32% -65.74%
Volatile Organic
Compounds
(VOC)
g 126.60 121.90 118.53 121.22 124.59 113.83 123.24 123.91 97.69 95.68 76.18
% change with BC 0.00% -3.72% -6.37% -4.25% -1.59% -10.09% -2.66% -2.12% -22.83% -24.43% -39.83%
Persistent
Organic
Pollutants (POP)
ng i-Teq 2876.81 2794.91 2736.41 2783.21 2841.71 2654.51 2818.31 2830.01 2373.71 2338.61 1999.31
% change with BC 0.00% -2.85% -4.88% -3.25% -1.22% -7.73% -2.03% -1.63% -17.49% -18.71% -30.50%
Heavy Metals mg Ni eq. 12748.05 12533.6
8
12380.56 12503.06 12656.18 12166.20 12594.93 12625.55 11431.22 11339.35 10451.26
% change with BC 0.00% -1.68% -2.88% -1.92% -0.72% -4.56% -1.20% -0.96% -10.33% -11.05% -18.02%
PAHs mg Ni eq. 1387.37 1362.75 1345.17 1359.24 1376.82 1320.56 1369.79 1373.30 1236.16 1225.61 1123.63
% change with BC 0.00% -1.77% -3.04% -2.03% -0.76% -4.82% -1.27% -1.01% -10.90% -11.66% -19.01%

May 2011
European Commission, DG ENTR
Proposal for Preparatory Study for Eco-design Requirements of EuPs
ENTR Lot 1: Refrigerating and freezing equipment – Task 6
29
life-cycle indicators
per unit
unit Base Case Option 1 Option 2 Option 3 Option 4 Option 5 Option 6 Option 7 Scenario A Scenario B Weighted real BAT
improvement
Particulate
Matter (PM,
dust)
kg 9.51 9.44 9.39 9.43 9.48 9.32 9.46 9.47 9.08 9.05 8.77
% change with BC 0.00% -0.72% -1.24% -0.83% -0.31% -1.96% -0.52% -0.41% -4.44% -4.75% -7.75%
Emissions
(Water)
Heavy Metals mg Hg/20 7357.64 7277.07 7219.53 7265.56 7323.11 7138.96 7300.09 7311.60 6862.74 6828.22 6494.45
% change with BC 0.00% -1.09% -1.88% -1.25% -0.47% -2.97% -0.78% -0.63% -6.73% -7.20% -11.73%
Eutrophication gg PO4 273.02 272.64 272.37 272.59 272.86 271.98 272.75 272.80 270.66 270.50 268.91
% change with BC 0.00% -0.14% -0.24% -0.16% -0.06% -0.38% -0.10% -0.08% -0.86% -0.92% -1.51%
Economic
indicators
Electricity cost € 1701 1582 1497 1565 1650 1378 1616 1633 970 919 425
% change with BC 0.00% -7.00% -12.00% -8.00% -3.00% -19.00% -5.00% -4.00% -43.00% -46.00% -75.00%
Life-cycle cost € 2784 2685 2598 2668 2738 2461 2739 2816 2216 2205 2809
% change with BC 0.00% -3.56% -6.68% -4.17% -1.65% -11.61% -1.62% 1.15% -20.04% -20.81% 0.87%
Table 6-12: Environmental impacts of the LT service cabinet Base Case and its improvement options
life-cycle indicators
per unit
unit Base Case Option 1 Option 2 Option 3 Option 4 Option 5 Option 6 Option 7 Scenario A Scenario B Weighted real
BAT
improvement
Other resources and
waste
Total Energy (GER) GJ 464.16 419.53 432.92 450.77 450.77 348.13 441.84 441.84 263.34 254.42 214.26
% change with BC 0.00% -9.61% -6.73% -2.88% -2.88% -25.00% -4.81% -4.81% -43.26% -45.19% -53.84%
of which, electricity primary GJ 450.17 405.55 418.93 436.78 436.78 334.15 427.86 427.86 249.36 240.43 200.27
MWh 42.87 38.62 39.90 41.60 41.60 31.82 40.75 40.75 23.75 22.90 19.07
% change with BC 0.00% -9.91% -6.94% -2.97% -2.97% -25.77% -4.96% -4.96% -44.61% -46.59% -55.51%
Water (process) kL 36.66 33.68 34.58 35.77 35.77 28.92 35.17 35.17 23.27 22.68 20.00
% change with BC 0.00% -8.12% -5.68% -2.43% -2.43% -21.10% -4.06% -4.06% -36.52% -38.14% -45.45%
Water (cooling) kL 1199.89 1080.89 1116.59 1164.19 1164.19 890.49 1140.39 1140.39 664.39 640.59 533.49
% change with BC 0.00% -9.92% -6.94% -2.98% -2.98% -25.79% -4.96% -4.96% -44.63% -46.61% -55.54%
Waste, non-haz./ kg 743.22 691.48 707.00 727.70 727.70 608.69 717.35 717.35 510.39 500.04 453.47

30
European Commission, DG ENTR
Preparatory Study for Eco-design Requirements of EuPs
ENTR Lot 1: Refrigerating and freezing equipment – Task 6
May 2011
life-cycle indicators
per unit
unit Base Case Option 1 Option 2 Option 3 Option 4 Option 5 Option 6 Option 7 Scenario A Scenario B Weighted real
BAT
improvement
landfill % change with BC 0.00% -6.96% -4.87% -2.09% -2.09% -18.10% -3.48% -3.48% -31.33% -32.72% -38.99%
Waste, hazardous/
incinerated
kg 33.21 32.18 32.49 32.90 32.90 30.53 32.69 32.69 28.58 28.37 27.45
% change with BC 0.00% -3.10% -2.17% -0.93% -0.93% -8.05% -1.55% -1.55% -13.94% -14.55% -17.34%
Emissions (Air)
Greenhouse Gases in
GWP100
t CO2 eq. 21.19 20.22 20.81 21.59 21.59 17.11 19.67 21.20 13.41 11.49 9.74
% change with BC 0.00% -4.56% -1.80% 1.88% 1.88% -19.26% -7.16% 0.04% -36.73% -45.76% -54.03%
Acidification,
emissions
kg SO2 eq. 121.99 110.50 113.95 118.54 118.54 92.11 116.25 116.25 70.28 67.98 57.64
% change with BC 0.00% -9.42% -6.59% -2.83% -2.83% -24.49% -4.71% -4.71% -42.39% -44.27% -52.75%
Volatile Organic
Compounds (VOC)
g 230.26 213.45 218.49 225.21 225.21 186.56 221.85 221.85 154.63 151.26 136.14
% change with BC 0.00% -7.30% -5.11% -2.19% -2.19% -18.98% -3.65% -3.65% -32.85% -34.31% -40.88%
Persistent Organic
Pollutants (POP)
ng i-Teq 4801.90 4509.40 4597.15 4714.15 4714.15 4041.40 4655.65 4655.65 3485.65 3427.15 3163.91
% change with BC 0.00% -6.09% -4.26% -1.83% -1.83% -15.84% -3.05% -3.05% -27.41% -28.63% -34.11%
Heavy Metals mg Ni eq. 18304.95 17539.35 17769.03 18075.27 18075.27 16314.40 17922.15 17922.15 14859.77 14706.65 14017.61
% change with BC 0.00% -4.18% -2.93% -1.25% -1.25% -10.87% -2.09% -2.09% -18.82% -19.66% -23.42%
PAHs mg Ni eq. 2011.50 1923.59 1949.96 1985.13 1985.13 1782.93 1967.54 1967.54 1615.90 1598.31 1519.19
% change with BC 0.00% -4.37% -3.06% -1.31% -1.31% -11.36% -2.19% -2.19% -19.67% -20.54% -24.47%
Particulate Matter
(PM, dust)
kg 11.32 11.07 11.15 11.24 11.24 10.68 11.20 11.20 10.21 10.16 9.94
% change with BC 0.00% -2.17% -1.52% -0.65% -0.65% -5.64% -1.08% -1.08% -9.76% -10.19% -12.14%
Emissions (Water)
Heavy Metals mg Hg/20 9704.52 9416.79 9503.11 9618.20 9618.20 8956.42 9560.65 9560.65 8409.74 8352.19 8093.24
% change with BC 0.00% -2.96% -2.08% -0.89% -0.89% -7.71% -1.48% -1.48% -13.34% -13.94% -16.60%
Eutrophication gg PO4 308.01 306.64 307.05 307.60 307.60 304.44 307.32 307.32 301.83 301.56 300.32
% change with BC 0.00% -0.45% -0.31% -0.13% -0.13% -1.16% -0.22% -0.22% -2.00% -2.09% -2.49%
Economic indicators
Electricity cost € 4252 3827 3955 4125 4125 3147 4040 4040 2339 2254 1871
% change with BC 0.00% -10.00% -7.00% -3.00% -3.00% -26.00% -5.00% -5.00% -45.00% -47.00% -56.00%
Life-cycle cost € 5436 5051 5156 5328 5313 4330 5263 5333 3715 3670 4504
% change with BC 0.00% -7.09% -5.14% -1.98% -2.25% -20.34% -3.18% -1.89% -31.66% -32.48% -17.13%

May 2011
European Commission, DG ENTR
Proposal for Preparatory Study for Eco-design Requirements of EuPs
ENTR Lot 1: Refrigerating and freezing equipment – Task 6
31
For high-temperature, the LLCC is Scenario B and the real weighted BAT is the BAT
option. The LLCC model allows GER saving of 42% compared to Base Case, and MWh
saving of 46%.
For low-temperature Scenario B is again the LLCC, while the real weigheted BAT is the
BAT option. The LLC model allows GER saving of 45% compared to Base Case, and
MWh saving of 47%.
0
50
100
150
200
250
0
500
1000
1500
2000
2500
3000
Ba
se-c
ase
Op
tio
n 1
Op
tio
n 2
Op
tio
n 3
Op
tio
n 4
Op
tio
n 5
Op
tio
n 6
Op
tio
n 7
Sc
en
ari
o A
Sc
en
ari
o B
We
igh
ted
re
al
BA
T
imp
rov
em
en
t
Pri
ma
ry e
ne
rgy
(G
J)
Co
st (
€)
Total Energy (GER) Life-cycle cost
Figure 6-1: HT service cabinet Base Case – TEC and LCC
0
50
100
150
200
250
300
350
400
450
500
0
1000
2000
3000
4000
5000
6000
Ba
se-c
ase
Op
tio
n 1
Op
tio
n 2
Op
tio
n 3
Op
tio
n 4
Op
tio
n 5
Op
tio
n 6
Op
tio
n 7
Sc
en
ari
o A
Sce
na
rio
B
We
igh
ted
re
al B
AT
imp
rov
em
en
t
Pri
ma
ry e
ne
rgy
(G
J)
Co
st (
€)
Total Energy (GER) Life-cycle cost
Figure 6-2: LT service cabinet Base Case – TEC and LCC

32
European Commission, DG ENTR
Preparatory Study for Eco-design Requirements of EuPs
ENTR Lot 1: Refrigerating and freezing equipment – Task 6
May 2011
61.1% 58.9% 57.6% 58.6% 60.3% 56.0% 59.0% 58.0%
43.8% 41.7%
15.1%
0%
20%
40%
60%
80%
100%
Ba
se-c
ase
Op
tio
n 1
Op
tio
n 2
Op
tio
n 3
Op
tio
n 4
Op
tio
n 5
Op
tio
n 6
Op
tio
n 7
Sce
na
rio
A
Sc
en
ari
o B
We
igh
ted
re
al
BA
T
imp
rove
me
nt
Electricity cost Life-cycle cost
Figure 6-3: HT service cabinet Base Case – LCC and electricity costs
78.2% 75.8% 76.7% 77.4% 77.6% 72.7% 76.8% 75.7%63.0% 61.4%
41.5%
0%
20%
40%
60%
80%
100%
Base
-ca
se
Op
tio
n 1
Op
tio
n 2
Op
tio
n 3
Op
tio
n 4
Op
tio
n 5
Op
tio
n 6
Op
tio
n 7
Sc
en
ari
o A
Sc
en
ari
o B
We
igh
ted
re
al
BA
T
imp
rove
me
nt
Electricity cost Life-cycle cost
Figure 6-4: LT service cabinet Base Case – LCC and electricity costs
6.3.2. BLAST CABINET BASE CASE
The main impacts of the improvement options for blast cabinets are shown in the
Table 6-13. Three combinations of four individual options each are also analysed.

May 2011
European Commission, DG ENTR
Proposal for Preparatory Study for Eco-design Requirements of EuPs
ENTR Lot 1: Refrigerating and freezing equipment – Task 6
33
Table 6-13: Summary of the cost and benefit effects of implementing individual
improvement options for the Base Case Blast cabinet
Option Option description
TEC
savings
(%)
Cost
increase
(Euros)
Annual
Energy
consumption
(kWh)
Total
Electricity
consumption
(MWh)*
Total CO2
emissions
(Ton eq.
CO2)
Electricity
costs
(Euros)
LCC
(Euros)
0 Base Case 3,031 25.8 27.9 2,578 9,512
Option 1 High Efficiency Fan
Blades 9% 10 2,758 25.7 26.9 2,346 9,290
Option 2 Electronic expansion
valve 12% 100 2,667 25.7 26.5 2,268 9,310
Option 3 Variable speed drive
(VSD) compressor 10% 200 2,728 25.7 26.8 2,320 9,470
Option 4 Insulation thickness 4% 100 2,910 25.8 27.5 2,475 9,517
Option 5 ECM Fan for
evaporator 7% 40 2,819 25.7 27.1 2,398 9,375
Option 6 R290 5% 200 2,879 25.8 12.2 2,449 9,599
Scenario A 1+2+3+4 31% 410 2,097 25.7 24.3 1,783 9,161
Scenario B 1+2+3+4+5 36% 450 1,950 25.7 23.7 1,658 9,080
Scenario C 1+2+3+4+5+6 39% 650 1,853 25.7 8.2 1,576 9,214
Weighted real
BAT
improvement
As described in Task 5 35% 753 1,970 25.7 23.8 1,675 9,425
Using the EcoReport tool, the economic and environmental impact of the different individual
options and its combinations was done for the whole product life cycle. The results of these
analyses are presented in Table 6-14.

34
European Commission, DG ENTR
Preparatory Study for Eco-design Requirements of EuPs
ENTR Lot 1: Refrigerating and freezing equipment – Task 6
May 2011
Table 6-14: Environmental impacts of the Base Case Blast cabinet and its improvement options
life-cycle indicators per
unit unit Base-case Option 1 Option 2 Option 3 Option 4 Option 5 Option 5
Scenario
A
Scenario
B
Scenario
C
Weighted real
BAT
improvement
Other resources and waste
Total Energy (GER)
GJ 283.77 259.41 251.29 256.73 272.97 264.85 270.21 200.41 187.29 178.64 189.08
% change
with BC 0.00% -8.59% -11.45% -9.53% -3.81% -6.67% -4.78% -29.38% -34.00% -37.05% -33.37%
of which, electricity
primary GJ 272.71 248.34 240.22 245.66 261.91 253.78 259.14 189.35 176.23 167.57 178.01
MWh 25.97 23.65 22.88 23.40 24.94 24.17 24.68 18.03 16.78 15.96 16.95
% change
with BC 0.00% -8.93% -11.91% -9.92% -3.96% -6.94% -4.97% -30.57% -35.38% -38.55% -34.72%
Water (process)
kL 22.84 21.21 20.67 21.03 22.12 21.58 21.93 17.28 16.41 15.83 16.52
% change
with BC 0.00% -7.11% -9.48% -7.89% -3.15% -5.52% -3.96% -24.33% -28.16% -30.69% -27.64%
Water (cooling)
kL 724.93 659.96 638.30 652.82 696.13 674.48 688.76 502.64 467.65 444.57 472.41
% change
with BC 0.00% -8.96% -11.95% -9.95% -3.97% -6.96% -4.99% -30.66% -35.49% -38.67% -34.83%
Waste, non-haz./ landfill
kg 505.80 477.55 468.13 474.44 493.28 483.86 490.07 409.15 393.94 383.90 396.01
% change
with BC 0.00% -5.59% -7.45% -6.20% -2.48% -4.34% -3.11% -19.11% -22.12% -24.10% -21.71%
Waste, hazardous/
incinerated
kg 18.20 17.64 17.45 17.58 17.95 17.76 17.89 16.28 15.98 15.78 16.02
% change
with BC 0.00% -3.09% -4.11% -3.42% -1.37% -2.40% -1.72% -10.56% -12.22% -13.31% -11.99%
Emissions (Air)
Greenhouse Gases in
GWP100
t CO2 eq. 27.94 26.87 26.52 26.76 27.47 27.11 12.19 24.30 23.73 8.21 23.81
% change
with BC 0.00% -3.81% -5.07% -4.22% -1.69% -2.96% -56.37% -13.02% -15.07% -70.61% -14.79%
Acidification, emissions
kg SO2 eq. 75.63 69.35 67.26 68.66 72.85 70.76 72.13 54.16 50.78 48.56 51.24
% change
with BC 0.00% -8.30% -11.06% -9.21% -3.68% -6.44% -4.62% -28.38% -32.85% -35.80% -32.24%
Volatile Organic
Compounds (VOC)
g 178.10 168.92 165.86 167.91 174.03 170.97 172.99 146.70 141.76 138.50 142.43
% change
with BC 0.00% -5.15% -6.87% -5.72% -2.28% -4.00% -2.87% -17.63% -20.40% -22.23% -20.03%
Persistent Organic ng i-Teq 3211.37 3051.67 2998.43 3034.12 3140.59 3087.35 3122.45 2664.99 2578.99 2522.25 2590.69

May 2011
European Commission, DG ENTR
Proposal for Preparatory Study for Eco-design Requirements of EuPs
ENTR Lot 1: Refrigerating and freezing equipment – Task 6
35
life-cycle indicators per
unit unit Base-case Option 1 Option 2 Option 3 Option 4 Option 5 Option 5
Scenario
A
Scenario
B
Scenario
C
Weighted real
BAT
improvement
Pollutants (POP) % change
with BC 0.00% -4.97% -6.63% -5.52% -2.20% -3.86% -2.77% -17.01% -19.69% -21.46% -19.33%
Heavy Metals
mg Ni eq. 12819.05 12401.03 12261.70 12355.10 12633.78 12494.44 12586.31 11388.91 11163.83 11015.30 11194.45
% change
with BC 0.00% -3.26% -4.35% -3.62% -1.45% -2.53% -1.82% -11.16% -12.91% -14.07% -12.67%
PAHs
mg Ni eq. 1203.13 1155.13 1139.13 1149.86 1181.86 1165.86 1176.41 1038.91 1013.07 996.01 1016.58
% change
with BC 0.00% -3.99% -5.32% -4.43% -1.77% -3.10% -2.22% -13.65% -15.80% -17.22% -15.51%
Particulate Matter (PM,
dust)
kg 4.88 4.74 4.70 4.73 4.82 4.77 4.80 4.42 4.35 4.30 4.36
% change
with BC 0.00% -2.75% -3.66% -3.05% -1.22% -2.13% -1.53% -9.40% -10.88% -11.85% -10.68%
Emissions (Water)
Heavy Metals
mg Hg/20 6671.17 6514.07 6461.70 6496.81 6601.54 6549.17 6583.70 6133.69 6049.10 5993.28 6060.61
% change
with BC 0.00% -2.35% -3.14% -2.61% -1.04% -1.83% -1.31% -8.06% -9.32% -10.16% -9.15%
Eutrophication
gg PO4 186.24 185.49 185.24 185.41 185.91 185.66 185.82 183.68 183.27 183.01 183.33
% change
with BC 0.00% -0.40% -0.54% -0.45% -0.18% -0.31% -0.22% -1.38% -1.59% -1.74% -1.56%
Economic indicators
Electricity cost
€ 2578 2346 2268 2320 2475 2398 2449 1783 1658 1576 1675
% change
with BC 0.00% -9.01% -12.01% -10.00% -3.99% -6.99% -5.01% -30.81% -35.66% -38.87% -35.00%
Life-cycle cost
€ 9512 9290 9310 9470 9517 9375 9599 9161 9080 9214 9425
% change
with BC 0.00% -2.33% -2.12% -0.43% 0.06% -1.44% 0.92% -3.68% -4.54% -3.13% -0.91%

36
European Commission, DG ENTR
Preparatory Study for Eco-design Requirements of EuPs
ENTR Lot 1: Refrigerating and freezing equipment – Task 6
May 2011
The Scenario C results in the least energy consuming product having 37% of energy
reduction. It is not the Least Life Cycle Cost (LLCC) scenario, but it decrease in 3% the
Life Cycle Cost (LCC) of the weighted Base Case.
The Scenario B represents the LLCC scenario. It reduces about 4% the LCC, while it
reduces in 34% the energy consumption.
Even though there is a combination of options which achieves lower LCC (options
1+2+5, with LCC 0.07% lower than Scenario B), the energy savings are lower (around
26%). Therefore, this option has not been selected as LLCC.
In terms of GWP, the Scenario C is the one presenting the most improvement. The
GWP is reduced by 70% with the introduction of R290 as refrigerant.
This comparison between all options is made in Figure 6-5 and Figure 6-6.
These results indicate that combined Scenario B is the LLCC and the theoretical model
Scenario C is the least energy consuming.
0
50
100
150
200
250
300
8000
8200
8400
8600
8800
9000
9200
9400
9600
9800
Ba
se-c
ase
Op
tio
n 1
Op
tio
n 2
Op
tio
n 3
Op
tio
n 4
Op
tio
n 5
Op
tio
n 5
Sce
na
rio
A
Sce
na
rio
B
Sce
na
rio
C
We
igh
ted
re
al
BA
T
imp
rove
me
nt
Pri
ma
ry e
ne
rgy
(G
J)
Co
st (
€)
Total Energy (GER) Life-cycle cost

May 2011
European Commission, DG ENTR
Proposal for Preparatory Study for Eco-design Requirements of EuPs
ENTR Lot 1: Refrigerating and freezing equipment – Task 6
37
Figure 6-5: Base Case Blast cabinet – TEC and LCC
27.1% 25.2% 24.4% 24.5% 26.0% 25.6% 25.5%19.5% 18.3% 17.1% 17.8%
0%
20%
40%
60%
80%
100%
Ba
se-c
ase
Op
tio
n 1
Op
tio
n 2
Op
tio
n 3
Op
tio
n 4
Op
tio
n 5
Op
tio
n 5
Sc
en
ari
o A
Sc
en
ari
o B
Sc
en
ari
o C
We
igh
ted
re
al
BA
T
imp
rov
em
en
t
Electricity cost Life-cycle cost
Figure 6-6: Base Case Blast cabinet – LCC and electricity costs
6.3.3. WALK-IN COLD ROOM BASE CASE
Table 6-15 indicates the main impacts of the improvement options proposed for the
walk-in cold room Base Case. Combinations of the individual options are also analysed.
Table 6-15: Summary of the cost and benefit effects of implementing individual
improvement options for the HT walk-in cold room Base Case
Option Option
description
TEC
savings
(%)
Cost
increase
(Euros)
Annual Energy
consumption
(kWh)
Total
Electricity
consumption
(MWh)*
Total CO2
emissions
(kg eq.
CO2)
Electricity
costs
(Euros)
LCC
(Euros)
0 Base Case 12,155 121.5 86.6 11830 23104
Option 1 Strip door
curtains 13% 70 € 10,575 105.7 79.3 10292 21636
Option 2 Auto door closer 12% 111 € 10,696 107.0 79.9 10411 21795
Option 3 PSC evaporator
fan 10% 100 € 10,939 109.4 81.0 10647 22021
Option 4 ECM evaporator
fan 13% 150 € 10,575 105.7 79.3 10292 21716
Option 5 High efficiency
fan blades 3% 50 € 11,790 117.9 84.9 11475 22799
Option 6 Insulation
thickness 15% 250 € 10,332 103.3 78.2 10056 21580
Option 7 ECM condenser
fan 3% 60 € 11,790 117.9 84.9 11475 22809
Option 8
R134a to replace
R404a at HT, and
R410a to replace
R404a at LT
0% 0 € 12,155 121.5 72.0 11830 23104
Option 9 High efficiency
LED light bulbs 4% 200 € 11,669 116.7 84.3 11357 22831
Option 10 Floating head
pressure (plus 8% 150 € 11,182 111.8 82.1 10884 22308

38
European Commission, DG ENTR
Preparatory Study for Eco-design Requirements of EuPs
ENTR Lot 1: Refrigerating and freezing equipment – Task 6
May 2011
Option Option
description
TEC
savings
(%)
Cost
increase
(Euros)
Annual Energy
consumption
(kWh)
Total
Electricity
consumption
(MWh)*
Total CO2
emissions
(kg eq.
CO2)
Electricity
costs
(Euros)
LCC
(Euros)
electronic
expansion valve)
Option 11 Ambient
subcooling 4% 170 € 11,669 116.7 84.3 11357 22801
Option 12 High efficiency
compressor 5% 200 € 11,547 115.5 83.8 11239 22713
Scenario A
Incorporates
options
1+2+3+4+5+6
37% 530 € 7,658 76.6 65.9 7453 19257
Scenario B Incorporates all
options 1 to 12 48% 1,341 € 6,321 63.2 45.3 6152 18767
Weighted
real BAT
improvement
As described in
Task 5, this
product includes
R134a/R410a
35% 1,760 € 7,901 79.0 52.5 7690 20724
*: during the use phase
An environmental and economic assessment was carried out for each improvement
option and for their combination, using the EcoReport tool. Outcomes of these
assessments, taking into account the whole life cycle, are provided in Table 6-16 with
absolute values (in units) and variations with the Base Case.

May 2011
European Commission, DG ENTR
Proposal for Preparatory Study for Eco-design Requirements of EuPs
ENTR Lot 1: Refrigerating and freezing equipment – Task 6
39
Table 6-16: Environmental impacts of the walk-in cold room Base Case and its improvement options
life-cycle
indicators
per unit
unit Base Case Option 1 Option 2 Option 3 Option 4 Option 5 Option 6 Option 7 Option 8 Option 9 Option 10 Option 11 Option 12 Scenario A Scenario B
Weighted
real BAT
improvem
ent
Other resources and waste
Total Energy
(GER)
GJ 1475.34 1309.42 1322.18 1347.71 1309.42 1437.05 1283.90 1437.05 1475.34 1424.29 1373.24 1424.29 1411.52 1003.12 862.73 1028.65
% change
with BC
0.00% -11.25% -10.38% -8.65% -11.25% -2.60% -12.98% -2.60% 0.00% -3.46% -6.92% -3.46% -4.33% -32.01% -41.52% -30.28%
of which,
electricity
primary
GJ
1386.50 1220.59 1233.35 1258.87 1220.59 1348.21 1195.06 1348.21 1386.50 1335.45 1284.40 1335.45 1322.69 914.28 773.90 939.81
MWh 132.05 116.25 117.46 119.89 116.25 128.40 113.82 128.40 132.05 127.19 122.32 127.19 125.97 87.07 73.70 89.51
% change
with BC
0.00% -11.97% -11.05% -9.20% -11.97% -2.76% -13.81% -2.76% 0.00% -3.68% -7.36% -3.68% -4.60% -34.06% -44.18% -32.22%
Water
(process)
kL 148.61 137.55 138.40 140.10 137.55 146.06 135.85 146.06 148.61 145.21 141.80 145.21 144.35 117.13 107.77 118.83
% change
with BC
0.00% -7.44% -6.87% -5.73% -7.44% -1.72% -8.59% -1.72% 0.00% -2.29% -4.58% -2.29% -2.86% -21.18% -27.48% -20.04%
Water
(cooling)
kL 3496.69 3054.26 3088.29 3156.36 3054.26 3394.59 2986.19 3394.59 3496.69 3360.56 3224.43 3360.56 3326.53 2237.45 1863.09 2305.52
% change
with BC
0.00% -12.65% -11.68% -9.73% -12.65% -2.92% -14.60% -2.92% 0.00% -3.89% -7.79% -3.89% -4.87% -36.01% -46.72% -34.07%
Waste, non-
haz./ landfill
kg 3513.50 3321.13 3335.93 3365.52 3321.13 3469.10 3291.53 3469.10 3513.50 3454.31 3395.12 3454.31 3439.51 2965.99 2803.22 2995.59
% change
with BC
0.00% -5.48% -5.05% -4.21% -5.48% -1.26% -6.32% -1.26% 0.00% -1.68% -3.37% -1.68% -2.11% -15.58% -20.22% -14.74%
Waste,
hazardous/
incinerated
kg 120.35 116.53 116.82 117.41 116.53 119.47 115.94 119.47 120.35 119.17 118.00 119.17 118.88 109.47 106.23 110.06
% change
with BC
0.00% -3.18% -2.93% -2.44% -3.18% -0.73% -3.67% -0.73% 0.00% -0.98% -1.95% -0.98% -1.22% -9.04% -11.73% -8.55%
Emissions (Air)
Greenhouse
Gases in
GWP100
t CO2 eq. 86.56 79.32 79.87 80.99 79.32 84.89 78.20 84.89 72.03 84.33 82.10 84.33 83.77 65.95 45.30 52.54
% change
with BC
0.00% -8.36% -7.72% -6.43% -8.36% -1.93% -9.65% -1.93% -16.78% -2.57% -5.15% -2.57% -3.22% -23.81% -47.67% -39.30%
Acidification
, emissions
kg SO2 eq. 442.91 400.19 403.48 410.05 400.19 433.06 393.62 433.06 442.91 429.77 416.62 429.77 426.48 321.32 285.17 327.89
% change
with BC
0.00% -9.65% -8.90% -7.42% -9.65% -2.23% -11.13% -2.23% 0.00% -2.97% -5.94% -2.97% -3.71% -27.45% -35.62% -25.97%
Volatile
Organic
Compounds
(VOC)
g 1044.68 982.19 987.00 996.61 982.19 1030.26 972.58 1030.26 1044.68 1025.45 1006.23 1025.45 1020.65 866.83 813.96 876.44
% change
with BC
0.00% -5.98% -5.52% -4.60% -5.98% -1.38% -6.90% -1.38% 0.00% -1.84% -3.68% -1.84% -2.30% -17.02% -22.09% -16.10%
Persistent ng i-Teq 32295.66 31208.17 31291.8 31459.13 31208.17 32044.70 31040.86 32044.70 32295.66 31961.05 31626.43 31961.05 31877.39 29200.49 28280.30 29367.79

40
European Commission, DG ENTR
Preparatory Study for Eco-design Requirements of EuPs
ENTR Lot 1: Refrigerating and freezing equipment – Task 6
May 2011
life-cycle
indicators
per unit
unit Base Case Option 1 Option 2 Option 3 Option 4 Option 5 Option 6 Option 7 Option 8 Option 9 Option 10 Option 11 Option 12 Scenario A Scenario B
Weighted
real BAT
improvem
ent
Organic
Pollutants
(POP)
2
% change
with BC
0.00% -3.37% -3.11% -2.59% -3.37% -0.78% -3.89% -0.78% 0.00% -1.04% -2.07% -1.04% -1.30% -9.58% -12.43% -9.07%
Heavy
Metals
mg Ni eq. 820161.44 817314.99 817533.
95
817971.87 817314.9
9
819504.57 816877.08 819504.5
7
820161.44 819285.61 818409.78 819285.61 819066.65 812060.01 809651.48 812497.93
% change
with BC
0.00% -0.35% -0.32% -0.27% -0.35% -0.08% -0.40% -0.08% 0.00% -0.11% -0.21% -0.11% -0.13% -0.99% -1.28% -0.93%
PAHs
mg Ni eq. 8014.01 7687.16 7712.30 7762.58 7687.16 7938.58 7636.87 7938.58 8014.01 7913.44 7812.87 7913.44 7888.30 7083.74 6807.17 7134.02
% change
with BC
0.00% -4.08% -3.76% -3.14% -4.08% -0.94% -4.71% -0.94% 0.00% -1.25% -2.51% -1.25% -1.57% -11.61% -15.06% -10.98%
Particulate
Matter (PM,
dust)
kg 79.63 78.71 78.78 78.92 78.71 79.41 78.57 79.41 79.63 79.34 79.06 79.34 79.27 77.03 76.26 77.17
% change
with BC
0.00% -1.15% -1.06% -0.88% -1.15% -0.26% -1.32% -0.26% 0.00% -0.35% -0.71% -0.35% -0.44% -3.26% -4.23% -3.09%
Emissions (Water)
Heavy
Metals
mg Hg/20 79337.92 78268.16 78350.4
5
78515.03 78268.16 79091.06 78103.58 79091.06 79337.92 79008.77 78679.61 79008.77 78926.48 76293.22 75388.04 76457.80
% change
with BC
0.00% -1.35% -1.24% -1.04% -1.35% -0.31% -1.56% -0.31% 0.00% -0.41% -0.83% -0.41% -0.52% -3.84% -4.98% -3.63%
Eutrophicati
on
gg PO4 5254.03 5248.93 5249.32 5250.11 5248.93 5252.85 5248.14 5252.85 5254.03 5252.46 5250.89 5252.46 5252.07 5239.51 5235.20 5240.30
% change
with BC
0.00% -0.10% -0.09% -0.07% -0.10% -0.02% -0.11% -0.02% 0.00% -0.03% -0.06% -0.03% -0.04% -0.28% -0.36% -0.26%
Economic indicators
Electricity
cost
€ 11830 10292 10411 10647 10292 11475 10056 11475 11830 11357 10884 11357 11239 7453 6152 7690
% change
with BC
0.00% -13.00% -12.00% -10.00% -13.00% -3.00% -15.00% -3.00% 0.00% -4.00% -8.00% -4.00% -5.00% -37.00% -48.00% -35.00%
Life-cycle
cost
€ 23104 21636 21795 22021 21716 22799 21580 22809 23104 22831 22308 22801 22713 19257 18767 20724
% change
with BC
0.00% -6.35% -5.66% -4.69% -6.01% -1.32% -6.60% -1.28% 0.00% -1.18% -3.45% -1.31% -1.69% -16.65% -18.77% -10.30%

May 2011
European Commission, DG ENTR
Proposal for Preparatory Study for Eco-design Requirements of EuPs
ENTR Lot 1: Refrigerating and freezing equipment – Task 6
41
Scenario B leads to the highest reduction in environmental impacts, as the use phase is
the main contributor of environmental impacts. Therefore, over the life cycle of a walk-
in cold room, these combination of improvement options could allow GER saving of
42% compared to the Base Case, and MWh saving of 48%.
In terms of economic impacts, the life-cycle cost of Scenario B is 19% lower than the
one of the Base Case. Thus, Scenario B is considered as the LLCC and BAT option.
0
200
400
600
800
1000
1200
1400
1600
15000
17000
19000
21000
23000
25000
Ba
se-c
ase
Op
tio
n 1
Op
tio
n 2
Op
tio
n 3
Op
tio
n 4
Op
tio
n 5
Op
tio
n 6
Op
tio
n 7
Op
tio
n 8
Op
tio
n 9
Op
tio
n 1
0
Op
tio
n 1
1
Op
tio
n 1
2
Sce
na
rio
A
Sce
na
rio
B
We
igh
ted
re
al B
AT
imp
rove
me
nt
Pri
ma
ry e
ne
rgy
(G
J)
Co
st (
€)
Total Energy (GER) Life-cycle cost
Figure 6-7: Walk-in cold room Base Case – TEC and LCC
51.2% 47.6% 47.8% 48.4% 47.4% 50.3% 46.6% 50.3% 51.2% 49.7% 48.8% 49.8% 49.5%38.7%
32.8% 37.1%
0%
20%
40%
60%
80%
100%
Ba
se-c
ase
Op
tio
n 1
Op
tio
n 2
Op
tio
n 3
Op
tio
n 4
Op
tio
n 5
Op
tio
n 6
Op
tio
n 7
Op
tio
n 8
Op
tio
n 9
Op
tio
n 1
0
Op
tio
n 1
1
Op
tio
n 1
2
Sce
na
rio
A
Sce
na
rio
B
We
igh
ted
re
al B
AT
imp
rove
me
nt
Electricity cost Life-cycle cost
Figure 6-8: Walk-in cold room Base Case – LCC and electricity costs

42
European Commission, DG ENTR
Preparatory Study for Eco-design Requirements of EuPs
ENTR Lot 1: Refrigerating and freezing equipment – Task 6
May 2011
6.3.4. MT AND LT PROCESS CHILLER BASE CASES
Table 6-21 and Table 6-22 indicate the main impacts of the improvement options
proposed for the chillers Base Case. Combinations of the individual options are also
analysed.
Table 6-17: Summary of the cost and benefit effects of implementing individual
improvement options for the MT chiller Base Case
Option Option
description
TEC
savings
(%)
Cost
increase
(Euros)
Annual
Energy
consumption
(kWh)
Total
Electricity
consumption
(MWh)*
Total CO2
emissions
(kg eq.
CO2)
Electricity
costs
(Euros)
LCC
(Euros)
0 Base Case 420,946 5,861 2,783 521,361 580,437
Option 1
Electronic
expansion
valve*
5% 1,000 399,898 5,859 2,846 533,547 599,298
Option 2
High
efficiency
compressor**
5% 6,000 399,898 5,859 2,846 533,547 605,169
Option 3
Improved
heat
exchange**
15% 11,000 357,804 5,853 2,556 477,384 554,876
Option 4 ECM fan
condenser*** 2% 2,200 412,527 5,860 2,933 550,396 617,556
Option 5 R290 5% 2,750 399,898 5,859 2,761 533,547 601,353
Scenario A Option 1+2+3 23% 18,000 322,918 5,848 2,317 430,839 516,550
Scenario B Option
1+2+3+5 27% 20,750 306,772 5,846 2,121 409,297 498,237
Weighted
real BAT
improvement
As described
in Task 5 9% 27,500 383,061 5,856 2,730 511,082 607,947
*Including several features within the options for increasing the component efficiency **
Only applicable to air-cooled chillers. Not considered in this analysis, but in task 7 ***
Changes in the system are required. Integrated with a secondary fluid
Table 6-18: Summary of the cost and benefit effects of implementing individual
improvement options for the Base Case LT chillers Base Case
Option Option
description
TEC
savings
(%)
Cost
increase
(Euros)
Annual
Energy
consumption
(kWh)
Total
Electricity
consumption
(MWh)*
Total CO2
emissions
(kg eq.
CO2)
Electricity
costs
(Euros)
LCC
(Euros)
0 Base Case 587,659 8,183 4,011 727,834 810,022
Option 1
Electronic
expansion
valve*
5% 1,000 558,276 8,179 4,099 744,855 828,218
Option 2
High
efficiency
compressor**
5% 7,000 558,276 8,179 4,099 744,855 835,262
Option 3 Improved 15% 14,000 499,510 8,170 3,695 666,449 765,075

May 2011
European Commission, DG ENTR
Proposal for Preparatory Study for Eco-design Requirements of EuPs
ENTR Lot 1: Refrigerating and freezing equipment – Task 6
43
Option Option
description
TEC
savings
(%)
Cost
increase
(Euros)
Annual
Energy
consumption
(kWh)
Total
Electricity
consumption
(MWh)*
Total CO2
emissions
(kg eq.
CO2)
Electricity
costs
(Euros)
LCC
(Euros)
heat
exchange**
Option 4 ECM fan
condenser*** 2% 2,800 575,905 8,181 4,220 768,377 853,853
Option 5 R290 5% 3,500 558,276 8,179 4,220 768,377 853,853
Scenario A Option 1+2+3 23% 22,000 450,808 8,164 3,360 601,470 709,490
Scenario B Option
1+2+3+5 27% 25,500 428,267 8,161 2,958 571,397 683,526
Weighted
real BAT
improvement
As described
in Task 5 9% 35,000 534,769 8,175 3,937 713,493 836,776
0 Base Case 587,659 8,183 4,011 727,834 810,022
*Including several features within the options for increasing the component efficiency **
Only applicable to air-cooled chillers. Not considered in this analysis, but in task 7 ***
Changes in the system are required. Integrated with a secondary fluid
The environmental and economic assessment results for the different options are
presented in Table 6-19 and Table 6-20. These results were carried out by using the
Ecoreport tool.

44
European Commission, DG ENTR
Preparatory Study for Eco-design Requirements of EuPs
ENTR Lot 1: Refrigerating and freezing equipment – Task 6
May 2011
Table 6-19: Environmental impacts of the MT chillers Base Case and its improvement options
life-cycle indicators per unit unit Base-case Option 1 Option 2 Option 3 Option 5 Scenario A Scenario B Weighted real BAT
improvement
Other resources and waste
Total Energy (GER) GJ 61742.54 63181.12 63181.12 56551.22 63181.12 51056.70 48513.72 60529.16
% change with BC 0.00% 2.33% 2.33% -8.41% 2.33% -17.31% -21.43% -1.97%
of which, electricity
primary GJ 61587.34 63025.92 63025.92 56396.02 63025.92 50901.50 48358.52 60373.96
MWh 5865.46 6002.47 6002.47 5371.05 6002.47 4847.76 4605.57 5749.90
% change with BC 0.00% 2.34% 2.34% -8.43% 2.34% -17.35% -21.48% -1.97%
Water (process) kL 4142.00 4237.90 4237.90 3795.91 4237.90 3429.61 3260.08 4061.10
% change with BC 0.00% 2.32% 2.32% -8.36% 2.32% -17.20% -21.29% -1.95%
Water (cooling) kL 164242.29 168078.49 168078.49 150398.77 168078.49 135746.71 128965.43 161006.61
% change with BC 0.00% 2.34% 2.34% -8.43% 2.34% -17.35% -21.48% -1.97%
Waste, non-haz./ landfill kg 75430.38 77098.33 77098.33 69411.34 77098.33 63040.75 60092.31 74023.54
% change with BC 0.00% 2.21% 2.21% -7.98% 2.21% -16.43% -20.33% -1.87%
Waste, hazardous/ incinerated kg 1429.16 1462.30 1462.30 1309.53 1462.30 1182.92 1124.32 1401.20
% change with BC 0.00% 2.32% 2.32% -8.37% 2.32% -17.23% -21.33% -1.96%
Emissions (Air)
Greenhouse Gases in GWP100 t CO2 eq. 2782.95 2845.73 2845.73 2556.41 2760.80 2316.63 2120.72 2730.00
% change with BC 0.00% 2.26% 2.26% -8.14% -0.80% -16.76% -23.80% -1.90%
Acidification, emissions kg SO2 eq. 15927.95 16298.38 16298.38 14591.18 16298.38 13176.34 12521.53 15615.50
% change with BC 0.00% 2.33% 2.33% -8.39% 2.33% -17.28% -21.39% -1.96%
Volatile Organic Compounds (VOC) g 23919.46 24461.26 24461.26 21964.28 24461.26 19894.90 18937.15 23462.47
% change with BC 0.00% 2.27% 2.27% -8.17% 2.27% -16.83% -20.83% -1.91%
Persistent Organic Pollutants (POP) ng i-Teq 442577.07 452006.34 452006.34 408550.14 452006.34 372535.82 355867.65 434623.86
% change with BC 0.00% 2.13% 2.13% -7.69% 2.13% -15.83% -19.59% -1.80%
Heavy Metals mg Ni eq. 1182020.62 1206701.17 1206701.17 1092957.18 1206701.17 998691.85 955063.92 1161203.58
% change with BC 0.00% 2.09% 2.09% -7.53% 2.09% -15.51% -19.20% -1.76%
PAHs mg Ni eq. 124267.98 127101.99 127101.99 114041.02 127101.99 103216.74 98207.04 121877.60
% change with BC 0.00% 2.28% 2.28% -8.23% 2.28% -16.94% -20.97% -1.92%
Particulate Matter (PM, dust) kg 413.24 421.15 421.15 384.69 421.15 354.47 340.48 406.57
% change with BC 0.00% 1.91% 1.91% -6.91% 1.91% -14.22% -17.61% -1.61%
Emissions (Water)
Heavy Metals mg Hg/20 441421.65 450697.17 450697.17 407949.56 450697.17 372522.49 356126.11 433598.13
% change with BC 0.00% 2.10% 2.10% -7.58% 2.10% -15.61% -19.32% -1.77%
Eutrophication gg PO4 5894.21 5938.44 5938.44 5734.60 5938.44 5565.67 5487.48 5856.90
% change with BC 0.00% 0.75% 0.75% -2.71% 0.75% -5.57% -6.90% -0.63%
Economic indicators
Electricity cost € 521361 533547 533547 477384 533547 430839 409297 511082
% change with BC 0.00% 2.34% 2.34% -8.43% 2.34% -17.36% -21.49% -1.97%
Life-cycle cost € 580437 599298 605169 554876 601353 516550 498237 607947
% change with BC 0.00% 3.25% 4.26% -4.40% 3.60% -11.01% -14.16% 4.74%
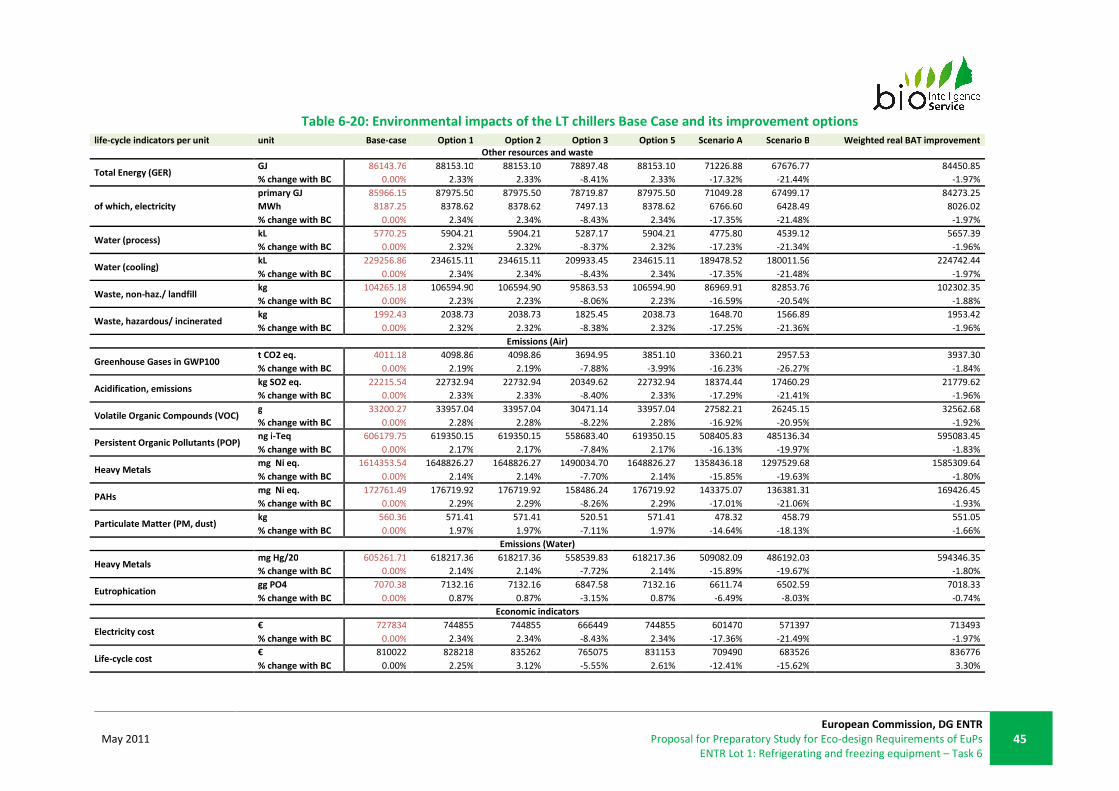
May 2011
European Commission, DG ENTR
Proposal for Preparatory Study for Eco-design Requirements of EuPs
ENTR Lot 1: Refrigerating and freezing equipment – Task 6
45
Table 6-20: Environmental impacts of the LT chillers Base Case and its improvement options
life-cycle indicators per unit unit Base-case Option 1 Option 2 Option 3 Option 5 Scenario A Scenario B Weighted real BAT improvement
Other resources and waste
Total Energy (GER) GJ 86143.76 88153.10 88153.10 78897.48 88153.10 71226.88 67676.77 84450.85
% change with BC 0.00% 2.33% 2.33% -8.41% 2.33% -17.32% -21.44% -1.97%
of which, electricity
primary GJ 85966.15 87975.50 87975.50 78719.87 87975.50 71049.28 67499.17 84273.25
MWh 8187.25 8378.62 8378.62 7497.13 8378.62 6766.60 6428.49 8026.02
% change with BC 0.00% 2.34% 2.34% -8.43% 2.34% -17.35% -21.48% -1.97%
Water (process) kL 5770.25 5904.21 5904.21 5287.17 5904.21 4775.80 4539.12 5657.39
% change with BC 0.00% 2.32% 2.32% -8.37% 2.32% -17.23% -21.34% -1.96%
Water (cooling) kL 229256.86 234615.11 234615.11 209933.45 234615.11 189478.52 180011.56 224742.44
% change with BC 0.00% 2.34% 2.34% -8.43% 2.34% -17.35% -21.48% -1.97%
Waste, non-haz./ landfill kg 104265.18 106594.90 106594.90 95863.53 106594.90 86969.91 82853.76 102302.35
% change with BC 0.00% 2.23% 2.23% -8.06% 2.23% -16.59% -20.54% -1.88%
Waste, hazardous/ incinerated kg 1992.43 2038.73 2038.73 1825.45 2038.73 1648.70 1566.89 1953.42
% change with BC 0.00% 2.32% 2.32% -8.38% 2.32% -17.25% -21.36% -1.96%
Emissions (Air)
Greenhouse Gases in GWP100 t CO2 eq. 4011.18 4098.86 4098.86 3694.95 3851.10 3360.21 2957.53 3937.30
% change with BC 0.00% 2.19% 2.19% -7.88% -3.99% -16.23% -26.27% -1.84%
Acidification, emissions kg SO2 eq. 22215.54 22732.94 22732.94 20349.62 22732.94 18374.44 17460.29 21779.62
% change with BC 0.00% 2.33% 2.33% -8.40% 2.33% -17.29% -21.41% -1.96%
Volatile Organic Compounds (VOC) g 33200.27 33957.04 33957.04 30471.14 33957.04 27582.21 26245.15 32562.68
% change with BC 0.00% 2.28% 2.28% -8.22% 2.28% -16.92% -20.95% -1.92%
Persistent Organic Pollutants (POP) ng i-Teq 606179.75 619350.15 619350.15 558683.40 619350.15 508405.83 485136.34 595083.45
% change with BC 0.00% 2.17% 2.17% -7.84% 2.17% -16.13% -19.97% -1.83%
Heavy Metals mg Ni eq. 1614353.54 1648826.27 1648826.27 1490034.70 1648826.27 1358436.18 1297529.68 1585309.64
% change with BC 0.00% 2.14% 2.14% -7.70% 2.14% -15.85% -19.63% -1.80%
PAHs mg Ni eq. 172761.49 176719.92 176719.92 158486.24 176719.92 143375.07 136381.31 169426.45
% change with BC 0.00% 2.29% 2.29% -8.26% 2.29% -17.01% -21.06% -1.93%
Particulate Matter (PM, dust) kg 560.36 571.41 571.41 520.51 571.41 478.32 458.79 551.05
% change with BC 0.00% 1.97% 1.97% -7.11% 1.97% -14.64% -18.13% -1.66%
Emissions (Water)
Heavy Metals mg Hg/20 605261.71 618217.36 618217.36 558539.83 618217.36 509082.09 486192.03 594346.35
% change with BC 0.00% 2.14% 2.14% -7.72% 2.14% -15.89% -19.67% -1.80%
Eutrophication gg PO4 7070.38 7132.16 7132.16 6847.58 7132.16 6611.74 6502.59 7018.33
% change with BC 0.00% 0.87% 0.87% -3.15% 0.87% -6.49% -8.03% -0.74%
Economic indicators
Electricity cost € 727834 744855 744855 666449 744855 601470 571397 713493
% change with BC 0.00% 2.34% 2.34% -8.43% 2.34% -17.36% -21.49% -1.97%
Life-cycle cost € 810022 828218 835262 765075 831153 709490 683526 836776
% change with BC 0.00% 2.25% 3.12% -5.55% 2.61% -12.41% -15.62% 3.30%

46
European Commission, DG ENTR
Preparatory Study for Eco-design Requirements of EuPs
ENTR Lot 1: Refrigerating and freezing equipment – Task 6
May 2011
The combined Scenario B leads to the highest reduction in all environmental indicators
for MT and LT. This is not surprising since the use-phase is the main contributor of
environmental impacts, and all the improvement options increase the energy efficiency
of the Base Case.
Therefore, over the life cycle of a chiller using Scenario B saves 21% of energy for MT
and LT products.
Scenario B also represents the LLCC, having saving of around 15% in the economic
expenditure. These savings are translated into €80,000 for MT process chillers and
around €130,000 for LT process chillers.
The GWP is reduced under the scenario B as well, from 25 to 26% for both temperature
ranges.
The figures below show the comparison between the TEC, the LCC and the electricity
costs of the different options analysed for chillers.
0
10000
20000
30000
40000
50000
60000
70000
0
100000
200000
300000
400000
500000
600000
700000
Base
-ca
se
Op
tio
n 1
Op
tio
n 2
Op
tio
n 3
Op
tio
n 5
Sc
en
ari
o A
Sc
en
ari
o B
We
igh
ted
re
al
BA
T
imp
rov
em
en
t
Pri
mar
y e
ne
rgy
(G
J)
Co
st (
€)
Total Energy (GER) Life-cycle cost
Figure 6-9: MT process chillers Base Case – TEC and LCC

May 2011
European Commission, DG ENTR
Proposal for Preparatory Study for Eco-design Requirements of EuPs
ENTR Lot 1: Refrigerating and freezing equipment – Task 6
47
0
10000
20000
30000
40000
50000
60000
70000
80000
90000
100000
0
100000
200000
300000
400000
500000
600000
700000
800000
900000
Ba
se-c
ase
Op
tio
n 1
Op
tio
n 2
Op
tio
n 3
Op
tio
n 5
Sc
en
ari
o A
Sc
en
ari
o B
We
igh
ted
re
al
BA
T
imp
rov
em
en
t
Pri
ma
ry e
ne
rgy
(G
J)
Co
st (
€)
Total Energy (GER) Life-cycle cost
Figure 6-10: LT chillers Base Case – TEC and LCC
89.8% 89.0% 88.2% 86.0% 88.7%83.4% 82.1% 84.1%
0%
20%
40%
60%
80%
100%
Ba
se-c
ase
Op
tio
n 1
Op
tio
n 2
Op
tio
n 3
Op
tio
n 5
Sc
en
ari
o A
Sc
en
ari
o B
We
igh
ted
re
al
BA
T
imp
rov
em
en
t
Electricity cost Life-cycle cost
Figure 6-11: MT process chillers Base Case – LCC and electricity costs

48
European Commission, DG ENTR
Preparatory Study for Eco-design Requirements of EuPs
ENTR Lot 1: Refrigerating and freezing equipment – Task 6
May 2011
89.9% 89.9% 89.2% 87.1% 89.6%84.8% 83.6% 85.3%
0%
20%
40%
60%
80%
100%
Ba
se-c
ase
Op
tio
n 1
Op
tio
n 2
Op
tio
n 3
Op
tio
n 5
Sc
en
ari
o A
Sc
en
ari
o B
We
igh
ted
re
al
BA
T
imp
rov
em
en
t
Electricity cost Life-cycle cost
Figure 6-12: LT process chillers Base Case – LCC and electricity costs
6.3.5. MT AND LT REMOTE CONDENSING UNIT BASE CASES
The tables below indicate the main impacts and costs of the different improvement
options proposed for the remote condensing unit Base Case, and the analysis of
benefits and costs of the combination of these individual options.
Table 6-21: Summary of the cost and benefit effects of implementing individual
improvement options for the LT remote condensing unit Base Case
Option Option
description
TEC
savings (%)
Cost
increase
(Euros)
Annual Energy
consumption
(kWh)
Total
Electricity
consumptio
n (MWh)*
Total CO2
emissions
(kg eq. CO2)
Electricity
costs (Euros) LCC (Euros)
0 Base Case 50,106 401.01 256.35 40482 49875
Option 1
Increase heat
exchanger
surfaces
5 238 47,600 380.97 247.17 38458 48089
Option 2 ECM
compressor 9 793 45,596 364.93 239.82 36839 47025
Option 3
Digital
modulation for
compressor
10 793 45,095 360.93 237.98 36434 46620
Option 4 Scroll
compressor 10 1,269 45,095 360.93 237.98 36434 47096
Option 5 Variable Speed
drive 10 1,983 45,095 360.93 237.98 36434 47810
Option 6 High efficiency
fan blades 0.5 159 49,855 399.01 255.43 40279 49832
Option 7 ECM for fans 1 397 49,605 397.00 254.51 40077 49867
Option 8 Refrigerant
R290 5 40 47,600 380.97 175.21 38458 47891
Scenario A Options 28 4,086 36,081 288.81 132.98 29151 42630
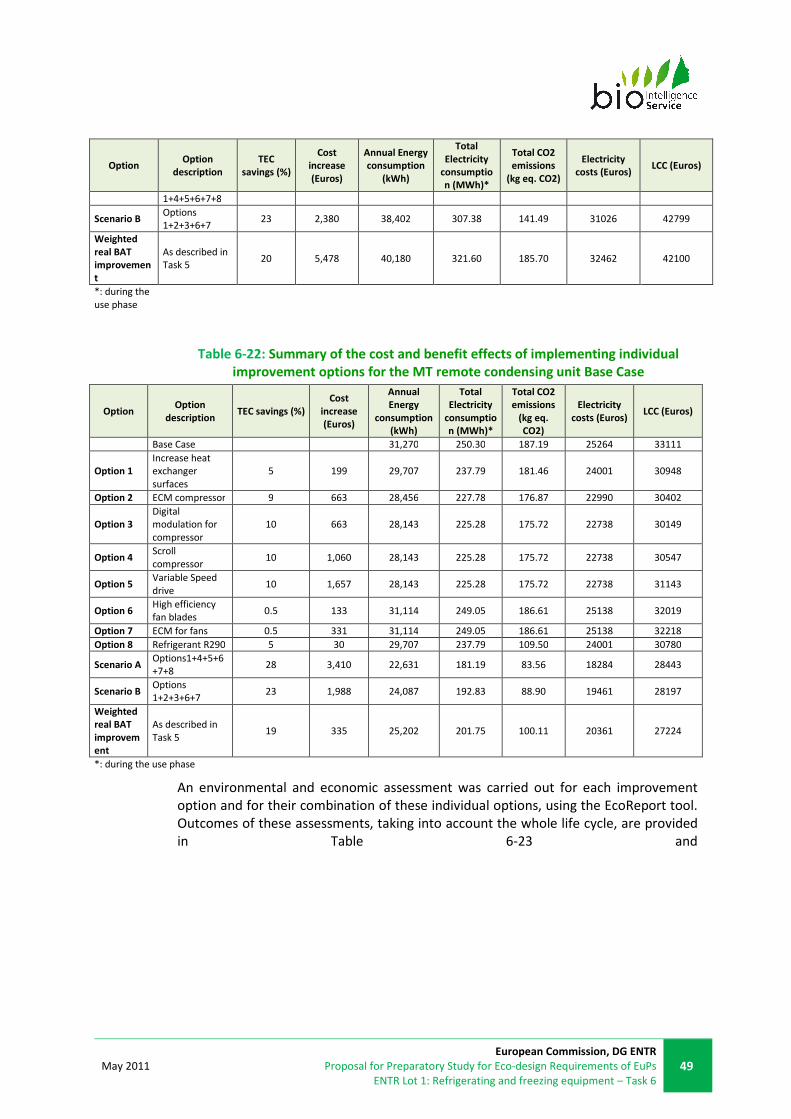
May 2011
European Commission, DG ENTR
Proposal for Preparatory Study for Eco-design Requirements of EuPs
ENTR Lot 1: Refrigerating and freezing equipment – Task 6
49
Option Option
description
TEC
savings (%)
Cost
increase
(Euros)
Annual Energy
consumption
(kWh)
Total
Electricity
consumptio
n (MWh)*
Total CO2
emissions
(kg eq. CO2)
Electricity
costs (Euros) LCC (Euros)
1+4+5+6+7+8
Scenario B Options
1+2+3+6+7 23 2,380 38,402 307.38 141.49 31026 42799
Weighted
real BAT
improvemen
t
As described in
Task 5 20 5,478 40,180 321.60 185.70 32462 42100
*: during the
use phase
Table 6-22: Summary of the cost and benefit effects of implementing individual
improvement options for the MT remote condensing unit Base Case
Option Option
description TEC savings (%)
Cost
increase
(Euros)
Annual
Energy
consumption
(kWh)
Total
Electricity
consumptio
n (MWh)*
Total CO2
emissions
(kg eq.
CO2)
Electricity
costs (Euros) LCC (Euros)
Base Case 31,270 250.30 187.19 25264 33111
Option 1
Increase heat
exchanger
surfaces
5 199 29,707 237.79 181.46 24001 30948
Option 2 ECM compressor 9 663 28,456 227.78 176.87 22990 30402
Option 3
Digital
modulation for
compressor
10 663 28,143 225.28 175.72 22738 30149
Option 4 Scroll
compressor 10 1,060 28,143 225.28 175.72 22738 30547
Option 5 Variable Speed
drive 10 1,657 28,143 225.28 175.72 22738 31143
Option 6 High efficiency
fan blades 0.5 133 31,114 249.05 186.61 25138 32019
Option 7 ECM for fans 0.5 331 31,114 249.05 186.61 25138 32218
Option 8 Refrigerant R290 5 30 29,707 237.79 109.50 24001 30780
Scenario A Options1+4+5+6
+7+8 28 3,410 22,631 181.19 83.56 18284 28443
Scenario B Options
1+2+3+6+7 23 1,988 24,087 192.83 88.90 19461 28197
Weighted
real BAT
improvem
ent
As described in
Task 5 19 335 25,202 201.75 100.11 20361 27224
*: during the use phase
An environmental and economic assessment was carried out for each improvement
option and for their combination of these individual options, using the EcoReport tool.
Outcomes of these assessments, taking into account the whole life cycle, are provided
in Table 6-23 and

50
European Commission, DG ENTR
Preparatory Study for Eco-design Requirements of EuPs
ENTR Lot 1: Refrigerating and freezing equipment – Task 6
May 2011
Table 6-24 below which present the absolute values (in units) and variations with the
Base Case.

May 2011
European Commission, DG ENTR
Proposal for Preparatory Study for Eco-design Requirements of EuPs
ENTR Lot 1: Refrigerating and freezing equipment – Task 6
51
Table 6-23: Environmental impacts of the LT remote condensing unit Base Case and its improvement options
life-cycle indicators per
unit unit Base Case Option 1 Option 2 Option 3 Option 4 Option 5 Option 6 Option 7 Option 8 Scenario A Scenario B Weighted real BAT
Other resources and waste
Total Energy (GER) GJ 4218.95 4008.50 3840.15 3798.06 3798.06 3798.06 4197.90 4176.86 4008.50 3040.87 3235.83 3385.17
% change with BC 0.00% -4.99% -8.98% -9.98% -9.98% -9.98% -0.50% -1.00% -4.99% -27.92% -23.30% -19.76%
of which, electricity
primary GJ 4210.60 4000.16 3831.80 3789.72 3789.72 3789.72 4189.56 4168.51 4000.16 3032.52 3227.49 3376.82
MWh 401.01 380.97 364.93 360.93 360.93 360.93 399.01 397.00 380.97 288.81 307.38 321.60
% change with BC 0.00% -5.00% -9.00% -10.00% -10.00% -10.00% -0.50% -1.00% -5.00% -27.98% -23.35% -19.80%
Water (process) kL 281.88 267.85 256.63 253.82 253.82 253.82 280.48 279.08 267.85 203.34 216.34 226.30
% change with BC 0.00% -4.98% -8.96% -9.95% -9.95% -9.95% -0.50% -1.00% -4.98% -27.86% -23.25% -19.72%
Water (cooling) kL 11225.22 10664.04 10215.09 10102.86 10102.86 10102.86 11169.11 11112.99 10664.04 8083.67 8603.58 9001.81
% change with BC 0.00% -5.00% -9.00% -10.00% -10.00% -10.00% -0.50% -1.00% -5.00% -27.99% -23.35% -19.81%
Waste, non-haz./ landfill kg 5231.11 4987.11 4791.92 4743.12 4743.12 4743.12 5206.71 5182.31 4987.11 3865.19 4091.24 4264.39
% change with BC 0.00% -4.66% -8.40% -9.33% -9.33% -9.33% -0.47% -0.93% -4.66% -26.11% -21.79% -18.48%
Waste, hazardous/
incinerated
kg 100.33 95.48 91.60 90.63 90.63 90.63 99.85 99.36 95.48 73.18 77.68 81.12
% change with BC 0.00% -4.83% -8.70% -9.67% -9.67% -9.67% -0.48% -0.97% -4.83% -27.06% -22.58% -19.15%
Emissions (Air)
Greenhouse Gases in
GWP100
t CO2 eq. 256.35 247.17 239.82 237.98 237.98 237.98 255.43 254.51 175.21 132.98 141.49 185.70
% change with BC 0.00% -3.58% -6.45% -7.16% -7.16% -7.16% -0.36% -0.72% -31.65% -48.12% -44.81% -27.56%
Acidification, emissions kg SO2 eq. 1087.06 1032.87 989.52 978.68 978.68 978.68 1081.64 1076.23 1032.87 783.71 833.91 872.36
% change with BC 0.00% -4.98% -8.97% -9.97% -9.97% -9.97% -0.50% -1.00% -4.98% -27.91% -23.29% -19.75%
Volatile Organic
Compounds (VOC)
g 1627.92 1548.66 1485.25 1469.40 1469.40 1469.40 1619.99 1612.06 1548.66 1184.22 1257.65 1313.89
% change with BC 0.00% -4.87% -8.76% -9.74% -9.74% -9.74% -0.49% -0.97% -4.87% -27.26% -22.74% -19.29%
Persistent Organic
Pollutants (POP)
ng i-Teq 31588.48 30209.10 29105.60 28829.73 28829.73 28829.73 31450.54 31312.60 30209.10 23866.64 25144.55 26123.40
% change with BC 0.00% -4.37% -7.86% -8.73% -8.73% -8.73% -0.44% -0.87% -4.37% -24.45% -20.40% -17.30%
Heavy Metals mg Ni eq. 74319.71 70709.28 67820.94 67098.85 67098.85 67098.85 73958.66 73597.62 70709.28 54108.26 57453.10 60015.20
% change with BC 0.00% -4.86% -8.74% -9.72% -9.72% -9.72% -0.49% -0.97% -4.86% -27.20% -22.69% -19.25%
PAHs mg Ni eq. 8562.35 8147.77 7816.11 7733.20 7733.20 7733.20 8520.89 8479.43 8147.77 6241.52 6625.60 6919.80
% change with BC 0.00% -4.84% -8.72% -9.68% -9.68% -9.68% -0.48% -0.97% -4.84% -27.11% -22.62% -19.18%
Particulate Matter (PM,
dust)
kg 27.74 26.58 25.66 25.43 25.43 25.43 27.62 27.51 26.58 21.26 22.33 23.15
% change with BC 0.00% -4.17% -7.51% -8.34% -8.34% -8.34% -0.42% -0.83% -4.17% -23.36% -19.49% -16.53%
Emissions (Water)
Heavy Metals mg Hg/20 27681.07 26324.19 25238.69 24967.31 24967.31 24967.31 27545.39 27409.70 26324.19 20085.15 21342.22 22305.11
% change with BC 0.00% -4.90% -8.82% -9.80% -9.80% -9.80% -0.49% -0.98% -4.90% -27.44% -22.90% -19.42%
Eutrophication gg PO4 155.02 148.55 143.37 142.08 142.08 142.08 154.37 153.73 148.55 118.80 124.79 129.38
% change with BC 0.00% -4.17% -7.51% -8.35% -8.35% -8.35% -0.42% -0.83% -4.17% -23.37% -19.50% -16.54%
Economic indicators
Electricity cost € 40482 38458 36839 36434 36434 36434 40279 40077 38458 29151 31026 32462
% change with BC 0.00% -5.00% -9.00% -10.00% -10.00% -10.00% -0.50% -1.00% -5.00% -27.99% -23.36% -19.81%
Life-cycle cost € 49875 48089 47025 46620 47096 47810 49832 49867 47891 42630 42799 42100
% change with BC 0.00% -3.58% -5.71% -6.53% -5.57% -4.14% -0.09% -0.02% -3.98% -14.53% -14.19% -15.59%

52
European Commission, DG ENTR
Preparatory Study for Eco-design Requirements of EuPs
ENTR Lot 1: Refrigerating and freezing equipment – Task 6
May 2011
Table 6-24: Environmental impacts of the MT remote condensing unit Base Case and its improvement options
life-cycle indicators per
unit unit Base Case Option 1 Option 2 Option 3 Option 4 Option 5 Option 6 Option 7 Option 8 Scenario A Scenario B Weighted real BAT
Other resources and waste
Total Energy (GER) GJ 2635.08 2503.75 2398.68 2372.41 2372.41 2372.41 2621.95 2621.95 2503.75 1909.41 2031.70 2125.37
% change with BC 0.00% -4.98% -8.97% -9.97% -9.97% -9.97% -0.50% -0.50% -4.98% -27.54% -22.90% -19.34%
of which, electricity
primary GJ 2628.12 2496.78 2391.72 2365.45 2365.45 2365.45 2614.98 2614.98 2496.78 1902.45 2024.74 2118.41
MWh 250.30 237.79 227.78 225.28 225.28 225.28 249.05 249.05 237.79 181.19 192.83 201.75
% change with BC 0.00% -5.00% -9.00% -9.99% -9.99% -9.99% -0.50% -0.50% -5.00% -27.61% -22.96% -19.39%
Water (process) kL 176.19 167.43 160.43 158.68 158.68 158.68 175.31 175.31 167.43 127.81 135.96 142.21
% change with BC 0.00% -4.97% -8.95% -9.94% -9.94% -9.94% -0.50% -0.50% -4.97% -27.46% -22.83% -19.29%
Water (cooling) kL 7005.77 6655.55 6375.37 6305.32 6305.32 6305.32 6970.75 6970.75 6655.55 5070.66 5396.76 5646.55
% change with BC 0.00% -5.00% -9.00% -10.00% -10.00% -10.00% -0.50% -0.50% -5.00% -27.62% -22.97% -19.40%
Waste, non-haz./ landfill kg 3338.13 3185.85 3064.03 3033.58 3033.58 3033.58 3322.90 3322.90 3185.85 2496.76 2638.54 2747.15
% change with BC 0.00% -4.56% -8.21% -9.12% -9.12% -9.12% -0.46% -0.46% -4.56% -25.20% -20.96% -17.70%
Waste, hazardous/
incinerated
kg 63.31 60.29 57.87 57.26 57.26 57.26 63.01 63.01 60.29 46.59 49.41 51.57
% change with BC 0.00% -4.78% -8.60% -9.56% -9.56% -9.56% -0.48% -0.48% -4.78% -26.41% -21.96% -18.55%
Emissions (Air)
Greenhouse Gases in
GWP100
t CO2 eq. 187.19 181.46 176.87 175.72 175.72 175.72 186.61 186.61 109.50 83.56 88.90 100.11
% change with BC 0.00% -3.06% -5.51% -6.12% -6.12% -6.12% -0.31% -0.31% -41.50% -55.36% -52.51% -46.52%
Acidification, emissions kg SO2 eq. 679.10 645.28 618.23 611.47 611.47 611.47 675.72 675.72 645.28 492.24 523.73 547.85
% change with BC 0.00% -4.98% -8.96% -9.96% -9.96% -9.96% -0.50% -0.50% -4.98% -27.52% -22.88% -19.33%
Volatile Organic
Compounds (VOC)
g 1024.90 975.44 935.87 925.98 925.98 925.98 1019.96 1019.96 975.44 751.60 797.66 832.94
% change with BC 0.00% -4.83% -8.69% -9.65% -9.65% -9.65% -0.48% -0.48% -4.83% -26.67% -22.17% -18.73%
Persistent Organic
Pollutants (POP)
ng i-Teq 20551.03 19690.19 19001.52 18829.35 18829.35 18829.35 20464.95 20464.95 19690.19 15794.60 16596.14 17210.11
% change with BC 0.00% -4.19% -7.54% -8.38% -8.38% -8.38% -0.42% -0.42% -4.19% -23.14% -19.24% -16.26%
Heavy Metals mg Ni eq. 46823.70 44570.51 42767.95 42317.31 42317.31 42317.31 46598.38 46598.38 44570.51 34374.02 36472.02 38079.04
% change with BC 0.00% -4.81% -8.66% -9.62% -9.62% -9.62% -0.48% -0.48% -4.81% -26.59% -22.11% -18.68%
PAHs mg Ni eq. 5400.70 5141.97 4934.99 4883.24 4883.24 4883.24 5374.83 5374.83 5141.97 3971.13 4212.04 4396.57
% change with BC 0.00% -4.79% -8.62% -9.58% -9.58% -9.58% -0.48% -0.48% -4.79% -26.47% -22.01% -18.59%
Particulate Matter (PM,
dust)
kg 18.27 17.55 16.97 16.83 16.83 16.83 18.20 18.20 17.55 14.28 14.95 15.47
% change with BC 0.00% -3.95% -7.12% -7.91% -7.91% -7.91% -0.40% -0.40% -3.95% -21.84% -18.16% -15.34%
Emissions (Water)
Heavy Metals mg Hg/20 17388.96 16542.15 15864.71 15695.35 15695.35 15695.35 17304.28 17304.28 16542.15 12710.08 13498.56 14102.51
% change with BC 0.00% -4.87% -8.77% -9.74% -9.74% -9.74% -0.49% -0.49% -4.87% -26.91% -22.37% -18.90%
Eutrophication gg PO4 102.11 98.07 94.84 94.03 94.03 94.03 101.70 101.70 98.07 79.79 83.55 86.43
% change with BC 0.00% -3.95% -7.12% -7.91% -7.91% -7.91% -0.40% -0.40% -3.95% -21.85% -18.17% -15.35%
Economic indicators
Electricity cost € 25264 24001 22990 22738 22738 22738 25138 25138 24001 18284 19461 20361
% change with BC 0.00% -5.00% -9.00% -10.00% -10.00% -10.00% -0.50% -0.50% -5.00% -27.63% -22.97% -19.41%
Life-cycle cost € 33111 30948 30402 30149 30547 31143 32019 32218 30780 28443 28197 27224
% change with BC 0.00% -6.53% -8.18% -8.95% -7.75% -5.94% -3.30% -2.70% -7.04% -14.10% -14.84% -17.78%

February 2011
European Commission, DG ENTR
Proposal for Preparatory Study for Eco-design Requirements of EuPs
ENTR Lot 1: Refrigerating and freezing equipment – Task 6
53
In both Base Cases for low and medium temperature the option which achieves highest
reduction in environmental impacts (hence the BAT option) of all the impact categories
is the Scenario A, which reduces the impact by around 21% to 54%.
In terms of economic impact during the entire lifespan, Scenario A is the LLCC option
for low temperature, with a Life Cycle Cost 14.5% lower than the Base Case and for
medium temperature the Scenario B is the LLCC option, 14.8% lower than the Base
Case.
Figure 6-13 to Figure 6-16 show the comparison between the TEC, the LCC and the
electricity costs of the different options analysed.
Figure 6-13: LT remote condensing unit Base Case – TEC and LCC
Figure 6-14: MT remote condensing unit Base Case – TEC and LCC

54
European Commission, DG ENTR
Preparatory Study for Eco-design Requirements of EuPs
ENTR Lot 1: Refrigerating and freezing equipment – Task 6
February 2011
Figure 6-15: LT remote condensing unit Base Case – LCC and electricity costs
Figure 6-16: MT remote condensing unit Base Case – LCC and electricity costs
6.4. BNAT AND LONG-TERM SYSTEMS ANALYSIS
The full lists of improvement options described for each product group in Task 5 are
not all analysed in section, due to issues such high cost or consideration on their
availability (hence could be described as BNAT). Some of these may therefore become
less costly to manufacturers in the coming years, and be applicable to products on the
market.
Some specific product issues to highlight:
• No real long-term target options have been identified for blast cabinets. The
applicability of the heat exchanger options will depend on the availability of
space for fitting the units due to volume constraints. The further development

February 2011
European Commission, DG ENTR
Proposal for Preparatory Study for Eco-design Requirements of EuPs
ENTR Lot 1: Refrigerating and freezing equipment – Task 6
55
of new heat transfer technologies might overcome this issue. The EEV is not
commonly applied, although it can be found in some products in the market.
The use of natural refrigerant can become an acceptable practice after
overcoming the safety issues. The resulting increase in the cost for the unit is
one of the highest, translated into higher capital cost, possibly the reason for
its lack of application.
• Some of the improvement options identified as BNAT for remote condensing
units are technically feasible but as they are not common technologies the
price is too high to be used in condensing units of all capacity ranges, but they
are expected to become economically viable in around 5 years. This is the case
with some natural refrigerants or water and evaporative cooling systems.
In addition, BNAT technologies, such as magnetic refrigeration, were identified in Task
5, and it is estimated these may also be brought onto the market in the next 5 to 10
years.
Lastly, referring back to Task 2, there are certain trends that may have an impact on
the future development of refrigeration and freezing equipment:
• Centralisation of catering – more remote systems for efficiency.
• Integration of HVAC and refrigeration for Energy Efficiency: the integration of
all cooling requirements of facilities in the same system allows achieving higher
efficiencies using bigger condensing units, and modulating the workload for
each of them. The implementation of heat recovery for air conditioning or
cascade systems is also possible in integral cooling and refrigeration systems,
allowing higher efficiencies when the entire system is considered.
• Transfer to alternative (low GWP) refrigerants: some of the alternative
refrigerants present issues of adapting the systems to their requirements due
to safety reasons and technical requirements. This is the case for carbon
dioxide and hydrocarbons, which could be applied in remote installations or
cascade systems that might enable their use.
6.5. SENSITIVITY ANALYSIS OF THE MAIN PARAMETERS
In the following sections, a sensitivity analysis, covering the following parameters is
carried out and discussed for each Base Case:
• Product price
• Product lifetime
• Annual electricity consumption
• Electricity tariff and discount rate
• Product stock
The robustness of the outcomes of the study depends on the underlying assumptions.
These assumptions have been explicitly mentioned at the relevant steps of the study.

56
European Commission, DG ENTR
Preparatory Study for Eco-design Requirements of EuPs
ENTR Lot 1: Refrigerating and freezing equipment – Task 6
February 2011
In this section, the sensitivity of the results to the most critical parameters and
assumptions is tested.
6.5.1. ASSUMPTIONS RELATED TO THE PRODUCT PRICE
The range of products within each product group is very wide. Products with different
characteristics and different purchase prices exist on the EU market.
Therefore, compared to the product price defined for Base Cases, two scenarios are
defined, to take into account the fact that on the one hand the price may be
underestimated, and on the other that there is often a significant reduction paid by
consumers compared to the list price (if purchased in bulk):
• An increase of 20%
• A decrease of 40%
The variation of the LCC compared to the Base is provided in Figure 6-17 for each Base
Case. The impact of such a variation is quite negligible for chillers, due to the small
share of the product price in the LCC (<10%, see *Including several features within the options for increasing the component efficiency **
Only applicable to air-cooled chillers. Not considered in this analysis, but in task 7 ***
Changes in the system are required. Integrated with a secondary fluid
Table 6-18
).
On the contrary, for blast cabinets, the purchase price has a significant impact on the
LCC: variation of +13%/-25% for the LCC for a variation of +20%/-40% of the purchase
price respectively, and an increase of 24% in the LCC when the transformer is 30%
more expensive. Such variations come from the high share of the product price in the
LCC for this type of transformer (between 50% and 65%, see Figure 6-18).

February 2011
European Commission, DG ENTR
Proposal for Preparatory Study for Eco-design Requirements of EuPs
ENTR Lot 1: Refrigerating and freezing equipment – Task 6
57
-35%
-30%
-25%
-20%
-15%
-10%
-5%
0%
5%
10%
15%
20%
BASE
BASE-40%
BASE+20%
Figure 6-17: Product price - Variation of the LCC compared to the Base
0.0%
10.0%
20.0%
30.0%
40.0%
50.0%
60.0%
70.0%
80.0%
SC HT SC LT BC WICR CH MT CH LT RCU
MT
RCU LT
BASE
BASE-40%
BASE+20%
Figure 6-18: Product price - Share of the product price in the LCC
Impact of any variation in the product price of the Base Case on its LCC and on one of
its improvement options is quite straightforward. Indeed, a constant price (which is the
variation with the base) will be added for all options. For instance, for the Base Case
Service cabinet HT, the scenario BASE+20% implies an increase of 400€ whereas the
scenario BASE-40% implies a decrease of 800€ for all improvement options. Therefore,
the ranking of options in terms of LCC remains similar; only absolute values change.
This is obviously the case for all Base Cases.

58
European Commission, DG ENTR
Preparatory Study for Eco-design Requirements of EuPs
ENTR Lot 1: Refrigerating and freezing equipment – Task 6
February 2011
6.5.2. ASSUMPTIONS RELATED TO THE PRODUCT LIFETIME
Average lifetimes are used in the EcoReport tool to assess environmental and LCC over
the whole life cycle of the Base Cases. However, some products can have a shorter or a
longer lifetime. These extreme values, based on alternatives from the literature and
stakeholder feedback, are presented in Table 6-25 and used in this sensitivity analysis
to analyse the impact of this parameter on the LCC of the Base Cases and their
electricity consumption during the use phase.
Table 6-25: Assumptions related to product lifetime
Base Case Base MIN MAX
Service Cabinet HT 8.5 8 12
Service Cabinet LT 8.5 8 12
Blast Cabinet 8.5 6 10
WICR 10 10 18
Chiller MT 15 15 20
Chiller LT 15 15 20
RCU MT 8 8 12
RCU LT 8 8 12
Figure 6-19 indicates the variation of the electricity consumed during the use phase
according to the lifetime of products.
-40%
-20%
0%
20%
40%
60%
80%
100%
BASE
MIN
MAX
Figure 6-19: Product lifetime - Variation of the electricity consumption compared to
the Base
Figure 6-20 presents for each Base Case the effect on the LCC of extreme lifetimes
compared to the average value used in Task 4. The greater impact is for WICR for which
an extension of 80% in the lifetime (18 years compared to 10 years) implies an increase
of about 60% of the LCC.
This figure has to be analysed carefully, as the relative extension of the lifetime is not
similar for all Base Cases, e.g. +80% for WICR whereas +18% for blast cabinet.

February 2011
European Commission, DG ENTR
Proposal for Preparatory Study for Eco-design Requirements of EuPs
ENTR Lot 1: Refrigerating and freezing equipment – Task 6
59
-20%
-10%
0%
10%
20%
30%
40%
50%
60%
70%
BASE
MIN
MAX
Figure 6-20: Product lifetime - Variation of the LCC compared to the Base
Figure 6-21 to Figure 6-28 present for each Base Case and its improvement options, the
LCC depending on the lifetimes specified in Table 6-25.
The variation in the lifetime does not have any impact on the order of options per Base
Case, except for RCU MT. Indeed, the two proposed options have similar LCC, and
variations in the product lifetime can vary their total life cycle costs. With a shorter
lifetime, scenario A would be the LLCC option, whereas assuming longer lifetime,
Scenario B would be the option with lower consumer expenditure per product.
0
500
1,000
1,500
2,000
2,500
3,000
3,500
BASE € MIN € MAX
Option 1
Option 2
Option 3
Option 4
Option 5
Option 6
Option 7
Scenario A
Scenario B
Figure 6-21: Base Case Service cabinet HT and its improvement options – Impact of
lifetime on the LCC (€)

60
European Commission, DG ENTR
Preparatory Study for Eco-design Requirements of EuPs
ENTR Lot 1: Refrigerating and freezing equipment – Task 6
February 2011
0
1,000
2,000
3,000
4,000
5,000
6,000
7,000
8,000
9,000
10,000
BASE MIN MAX
Option 1
Option 2
Option 3
Option 4
Option 5
Option 6
Option 7
Scenario A
Scenario B
Figure 6-22: Base Case Service cabinet LT and its improvement options – Impact of
lifetime on the LCC (€)
7,500
8,000
8,500
9,000
9,500
10,000
10,500
BASE MIN MAX
Option 1
Option 2
Option 3
Option 4
Option 5
Option 6
Scenario A
Scenario B
Scenario C
Figure 6-23: Base Case Blast cabinet and its improvement options – Impact of
lifetime on the LCC (€)

February 2011
European Commission, DG ENTR
Proposal for Preparatory Study for Eco-design Requirements of EuPs
ENTR Lot 1: Refrigerating and freezing equipment – Task 6
61
0
5,000
10,000
15,000
20,000
25,000
30,000
35,000
BASE MIN MAX
Option 1
Option 2
Option 3
Option 4
Option 5
Option 6
Option 7
Option 8
Option 9
Option 10
Option 11
Option 12
Scenario A
Figure 6-24: Base Case WICR and its improvement options – Impact of lifetime on the
LCC (€)
0
100,000
200,000
300,000
400,000
500,000
600,000
700,000
BASE € MIN € MAX
Option 1
Option 2
Option 3
Option 4
Option 5
Scenario A
Scenario B
Figure 6-25: Base Case Chiller MT and its improvement options – Impact of lifetime
on the LCC (€)

62
European Commission, DG ENTR
Preparatory Study for Eco-design Requirements of EuPs
ENTR Lot 1: Refrigerating and freezing equipment – Task 6
February 2011
0
100,000
200,000
300,000
400,000
500,000
600,000
700,000
800,000
900,000
1,000,000
BASE € MIN € MAX
Option 1
Option 2
Option 3
Option 4
Option 5
Scenario A
Scenario B
Figure 6-26: Base Case Chiller LT and its improvement options – Impact of lifetime on
the LCC (€)
0
5,000
10,000
15,000
20,000
25,000
30,000
35,000
40,000
BASE € MIN € MAX
Option 1
Option 2
Option 3
Option 4
Option 5
Option 6
Option 7
Option 8
Scenario A
Scenario B
Figure 6-27: Base Case RCU MT and its improvement options – Impact of lifetime on
the LCC (€)

February 2011
European Commission, DG ENTR
Proposal for Preparatory Study for Eco-design Requirements of EuPs
ENTR Lot 1: Refrigerating and freezing equipment – Task 6
63
0
5,000
10,000
15,000
20,000
25,000
30,000
35,000
40,000
45,000
BASE € MIN € MAX
Option 1
Option 2
Option 3
Option 4
Option 5
Option 6
Option 7
Option 8
Scenario A
Scenario B
Figure 6-28: Base Case RCU LT and its improvement options – Impact of lifetime on
the LCC (€)
6.5.3. ASSUMPTIONS RELATED TO THE ANNUAL ELECTRICITY CONSUMPTION OF THE BASE CASES
As for all energy-using products, electricity consumption is considered as a major
impact. In Task 4, average electricity consumptions were defined for all Base Cases
based on data provided by manufacturers. Nevertheless, as the range of models is very
wide within each product category, it is worthwhile carrying out a sensitivity analysis
on this parameter.
Therefore, compared to the annual electricity consumption defined for Base Cases in
Task 4, 2 scenarios are defined:
• An increase of 40%
• A decrease of 20%
The variation in the LCC compared to the Base is provided in Figure 6-29 for each Base
Case. The impact of such a variation is quite significant for chillers due to the high share
of the electricity cost in the LCC (>85%, see Figure 6-30).
On the contrary, for blast cabinet, the purchase price has a significant impact on the
LCC: variation of +14%/-7% in the LCC for a variation of +40%/-20% in the electricity
consumption. Such variations come from the high share of the electricity cost in the
LCC for this type of appliance (about 35%, see Figure 6-30).

64
European Commission, DG ENTR
Preparatory Study for Eco-design Requirements of EuPs
ENTR Lot 1: Refrigerating and freezing equipment – Task 6
February 2011
-30%
-20%
-10%
0%
10%
20%
30%
40%Variation of the LCC compared to the Base
BASE
BASE -20%
Base +40%
Figure 6-29: Product electricity consumption - Variation of the LCC compared to the
Base
0%
10%
20%
30%
40%
50%
60%
70%
80%
90%
100%
SC HT SC LT BC WICR CH MT CH LT RCU MT RCU LT
Share of the electricity costs in the LCC
BASE
BASE -
20%Base
+40%
Figure 6-30: Product electricity consumption - Share of the electricity cost in the LCC
Figure 6-31 to Figure 6-38 present the LCC of each Base Case and its improvement
options with different values of electricity consumption for the Base Case. Obviously,
the higher the consumption of the Base Case is, the higher the gap between the Base
Case and the LLCC option.
The improvement option leading to the LLCC remains the same whatever the Base Case
and its annual electricity consumption is, except for the Base Case RCU. Indeed, for this

February 2011
European Commission, DG ENTR
Proposal for Preparatory Study for Eco-design Requirements of EuPs
ENTR Lot 1: Refrigerating and freezing equipment – Task 6
65
Base Case with a high value of electricity consumption, the LCC of each option can vary
slightly, and due to the different payback periods of the different options, the LLCC
option can be the option 5 (VSD) if the electricity consumption is lower than the
estimated for the base case, or Scenario A when the electricity is increased in 40%.
0
500
1,000
1,500
2,000
2,500
3,000
BASE BASE -20% BASE +40%
Option 1 Option 2 Option 3 Option 4 Option 5 Option 6 Option 7 Scenario A Scenario B
Figure 6-31: Base Case Service cabinet HT and its improvement options – Impact of
electricity consumption of the Base Case on the LCC (€)
0
1,000
2,000
3,000
4,000
5,000
6,000
7,000
8,000
BASE BASE -20% BASE +40%
Option 1 Option 2 Option 3 Option 4 Option 5 Option 6 Option 7 Scenario A Scenario B
Figure 6-32: Base Case Service cabinet LT and its improvement options – Impact of
electricity consumption of the Base Case on the LCC (€)

66
European Commission, DG ENTR
Preparatory Study for Eco-design Requirements of EuPs
ENTR Lot 1: Refrigerating and freezing equipment – Task 6
February 2011
0
500
1,000
1,500
2,000
2,500
3,000
3,500
4,000
4,500
BASE BASE -20% BASE +40%
Base-case Option 1 Option 2 Option 3 Option 4
Option 5 Option 6 Scenario A Scenario B Scenario C
Figure 6-33: Base Case Blast cabinet and its improvement options – Impact of
electricity consumption of the Base Case on the LCC (€)
0
5,000
10,000
15,000
20,000
25,000
30,000
BASE BASE -20% BASE +40%
Option 1 Option 2 Option 3 Option 4 Option 5 Option 6 Option 7
Option 8 Option 9 Option 10 Option 11 Scenario A Scenario B Option 12
Figure 6-34: Base Case WICR and its improvement options – Impact of electricity
consumption of the Base Case on the LCC (€)

February 2011
European Commission, DG ENTR
Proposal for Preparatory Study for Eco-design Requirements of EuPs
ENTR Lot 1: Refrigerating and freezing equipment – Task 6
67
0
100,000
200,000
300,000
400,000
500,000
600,000
700,000
BASE BASE -20% BASE +40%
Base-case Option 1 Option 2 Option 3
Option 4 Option 5 Scenario A Scenario B
Figure 6-35: Base Case Chiller MT and its improvement options – Impact of electricity
consumption of the Base Case on the LCC (€)
0
100,000
200,000
300,000
400,000
500,000
600,000
700,000
800,000
900,000
BASE BASE -20% BASE +40%
Base-case Option 1 Option 2 Option 3
Option 4 Option 5 Scenario A Scenario B
Figure 6-36: Base Case Chiller LT and its improvement options – Impact of electricity
consumption of the Base Case on the LCC (€)

68
European Commission, DG ENTR
Preparatory Study for Eco-design Requirements of EuPs
ENTR Lot 1: Refrigerating and freezing equipment – Task 6
February 2011
0
5,000
10,000
15,000
20,000
25,000
30,000
35,000
40,000
45,000
50,000
BASE BASE -20% BASE +40%
Base-case Option 1 Option 2 Option 3 Option 4 Option 5
Option 6 Option 7 Option 8 Scenario A Scenario B
Figure 6-37: Base Case RCU MT and its improvement options – Impact of electricity
consumption of the Base Case on the LCC (€)
0
10,000
20,000
30,000
40,000
50,000
60,000
BASE BASE -20% BASE +40%
Base-case Option 1 Option 2 Option 3 Option 4 Option 5
Option 6 Option 7 Option 8 Scenario A Scenario B
Figure 6-38: Base Case RCU LT and its improvement options – Impact of electricity
consumption of the Base Case on the LCC (€)
6.5.4. ASSUMPTIONS RELATED TO THE ELECTRICITY TARIFF AND THE DISCOUNT RATE
For all Base Cases and their improvement options, an average EU-27 electricity tariff of
0.12 €/kWh was used3. However, if the lowest electricity tariff (i.e. 0.07 €/kWh in
3 Based on the data from Eurostat

February 2011
European Commission, DG ENTR
Proposal for Preparatory Study for Eco-design Requirements of EuPs
ENTR Lot 1: Refrigerating and freezing equipment – Task 6
69
Estonia) and the highest electricity tariff (i.e. 0.21 €/kWh in Denmark) are applied, this
could lead to different LCC for the Base Cases and their improvement options.
In the same way, the discount rate (interest minus inflation rate) influences the LCC
calculation. Higher values than the one used in Tasks 4 & 6 are employed to assess the
impact of this parameter.
Table 6-26: Assumptions related to electricity tariff and discount rate
Average (used in
Tasks 4 and 6) MIN MAX
Electricity tariff (€/kWh) 0.12 0.07
(Estonia)
0.21
(Denmark)
Average (used in
Tasks 4 and 6) MAX MAX+
Discount rate (%) 4 6 2
Figure 6-39 to Figure 6-46 present the LCC of each Base Case and its improvement
options with the basic assumptions and with the extreme values of electricity tariff and
discount rate.
The order of the improvement options whatever the electricity tariff and the discount
rate used remains quite similar.
0 €
500 €
1,000 €
1,500 €
2,000 €
2,500 €
3,000 €
3,500 €
4,000 €
4,500 €
BASE €/kWh MAX €/kWh MIN Discount MIN Discount MAX
Option 1 Option 2 Option 3 Option 4 Option 5 Option 6 Option 7 Scenario A Scenario B
Figure 6-39: Base Case Service cabinet HT and its improvement options – Impact of
the electricity tariff and the discount rate on the LCC (€)

70
European Commission, DG ENTR
Preparatory Study for Eco-design Requirements of EuPs
ENTR Lot 1: Refrigerating and freezing equipment – Task 6
February 2011
0 €
1,000 €
2,000 €
3,000 €
4,000 €
5,000 €
6,000 €
7,000 €
8,000 €
9,000 €
BASE €/kWh MAX €/kWh MIN Discount MIN Discount MAX
Option 1 Option 2 Option 3 Option 4 Option 5 Option 6 Option 7 Scenario A Scenario B
Figure 6-40: Base Case Service cabinet LT and its improvement options – Impact of
the electricity tariff and the discount rate on the LCC (€)
0 €
2,000 €
4,000 €
6,000 €
8,000 €
10,000 €
12,000 €
14,000 €
BASE €/kWh MAX €/kWh MIN Discount MIN Discount MAX
Option 1 Option 2 Option 3 Option 4 Option 5 Option 6 Scenario A Scenario B Scenario C
Figure 6-41: Base Case Blast cabinet and its improvement options – Impact of the
electricity tariff and the discount rate on the LCC (€)
0 €
5,000 €
10,000 €
15,000 €
20,000 €
25,000 €
30,000 €
35,000 €
BASE €/kWh MAX €/kWh MIN Discount MIN Discount MAX
Option 1 Option 2 Option 3 Option 4 Option 5 Option 6 Option 7
Option 8 Option 9 Option 10 Option 11 Option 12 Scenario A Scenario B
Figure 6-42: Base Case WICR and its improvement options – Impact of the electricity
tariff and the discount rate on the LCC (€)

February 2011
European Commission, DG ENTR
Proposal for Preparatory Study for Eco-design Requirements of EuPs
ENTR Lot 1: Refrigerating and freezing equipment – Task 6
71
0 €
200,000 €
400,000 €
600,000 €
800,000 €
1,000,000 €
1,200,000 €
BASE €/kWh MAX €/kWh MIN Discount MIN Discount MAX
Option 1 Option 2 Option 3 Option 4 Option 5 Scenario A Scenario B
Figure 6-43: Base Case Chiller MT and its improvement options – Impact of the
electricity tariff and the discount rate on the LCC (€)
0 €
200,000 €
400,000 €
600,000 €
800,000 €
1,000,000 €
1,200,000 €
1,400,000 €
1,600,000 €
BASE €/kWh MAX €/kWh MIN Discount MIN Discount MAX
Option 1 Option 2 Option 3 Option 4 Option 5 Scenario A Scenario B
Figure 6-44: Base Case Chiller LT and its improvement options – Impact of the
electricity tariff and the discount rate on the LCC (€)
0 €
10,000 €
20,000 €
30,000 €
40,000 €
50,000 €
60,000 €
BASE €/kWh MAX €/kWh MIN Discount MIN Discount MAX
Option 1 Option 2 Option 3 Option 4 Option 5
Option 6 Option 7 Option 8 Scenario A Scenario B
Figure 6-45: Base Case RCU MT and its improvement options – Impact of the
electricity tariff and the discount rate on the LCC (€)

72
European Commission, DG ENTR
Preparatory Study for Eco-design Requirements of EuPs
ENTR Lot 1: Refrigerating and freezing equipment – Task 6
February 2011
0 €
10,000 €
20,000 €
30,000 €
40,000 €
50,000 €
60,000 €
70,000 €
BASE €/kWh MAX €/kWh MIN Discount MIN Discount MAX
Option 1 Option 2 Option 3 Option 4 Option 5 Option 6 Option 7 Option 8 Scenario A Scenario B
Figure 6-46: Base Case RCU LT and its improvement options – Impact of the
electricity tariff and the discount rate on the LCC (€)
6.5.5. ASSUMPTIONS RELATED TO THE PRODUCT STOCK
Estimating the stock of refrigerating and freezing equipments is not an easy task due to
the fragmented nature of the market and also limited availability of corresponding
market data.
In Task 2, stock data was defined based on available information and inputs provided
by stakeholders. These values were used in Task 4 to assess electricity consumption
(and other environmental impacts) at EU level. However, the accuracy of these stock
data is quite limited and a sensitivity analysis on this parameter is therefore desirable.
Figure 6-47 to Figure 6-48 show the electricity consumption of the whole EU stock
(assuming that all products have the same characteristics as the Base Cases) with
different stocks values. Therefore, if the maximum stock values are considered, the
electricity consumption included in the scope of this study would be 19% higher
compared to the Base (2388 TWh vs. 2001 TWh).

February 2011
European Commission, DG ENTR
Proposal for Preparatory Study for Eco-design Requirements of EuPs
ENTR Lot 1: Refrigerating and freezing equipment – Task 6
73
Table 6-27: Assumptions related to product stock (in 2008)
Base Case Base MIN MAX
Service Cabinet HT 2,053,903 -10% 2,053,903 10% 2,510,326
Service Cabinet LT 880,244 -10% 880,244 10% 1,075,854
Blast Cabinet 931,838 -30% 931,838 50% 1,996,795
WICR 1,369,493 -10% 1,369,493 10% 1,673,825
Chiller MT 161,857 -20% 161,857 20% 242,786
Chiller LT 161,857 -20% 161,857 20% 242,786
RCU MT 3,541,819 -10% 2,971,817 10% 4,328,890
RCU LT 885,455 -10% 742,954 10% 1,082,222
0
5
10
15
20
25
SC HT SC LT BC WICR
BASE MIN MAX
Figure 6-47: Electricity consumption (in TWh) of the EU stock (without process
chillers and remote condensing units)

74
European Commission, DG ENTR
Preparatory Study for Eco-design Requirements of EuPs
ENTR Lot 1: Refrigerating and freezing equipment – Task 6
February 2011
0
20
40
60
80
100
120
140
160
CH MT CH LT RCU MT RCU LT
BASE MIN MAX
Figure 6-48: Electricity consumption (in TWh) of the EU stock of process chillers and
remote condensing units

February 2011
European Commission, DG ENTR
Proposal for Preparatory Study for Eco-design Requirements of EuPs
ENTR Lot 1: Refrigerating and freezing equipment – Task 6
75
6.6. CONCLUSIONS
Several improvement options are available for each product group, usually with short
payback times and only very few constraints. Combinations of these improvement
options provide potential for a BAT with significantly reduced electricity consumption,
leading to reduced environmental impact and lower LCC.
Regarding direct emissions from refrigerants, using alternative refrigerants would help
to reduce GWP. But any refrigerant substitution that lowers overall efficiency is likely
to have more adverse environmental impacts than benefits.
There is also potential for current available but high-cost improvement options to
become more affordable over the coming years, however in terms of BNAT options,
some technologies such as magnetic refrigeration are relatively far from market in
these product groups, and likely only to be available in coming 5 to 10 years.
Hence, steadily increasing levels of energy efficiency without significant increase in
other environmental impacts should be achievable. These results will therefore be
discussed in context of potential policy options in Task 7.
However, the overall energy efficiency of a refrigerating system depends much more
on the sensible adjustments of the components to each other than to the energy
efficiency of each component alone. Furthermore, the capability of control and vary
these parameters depending on the workload and the seasonal conditions seems to be
the mean to achieve greater energy savings.
Lastly, the sensitivity analysis demonstrates the importance of certain parameters, the
uncertainty of which has an effect on the results of analysis, such as the impact of blast
cabinets, chillers and remote condensing units stock numbers on total EU electricity
consumption.
Top Related