


Languages
Pages
Legal


National & International Trade Outlook
Paul BinghamManaging Director, Global Commerce and TransportationIHS Global Insight
Cobb Galleria Center, Atlanta April 29, 2010
2010 GEORGIA LOGISTICS SUMMIT
Copyright © 2010 IHS Global Insight. All Rights Reserved.
2
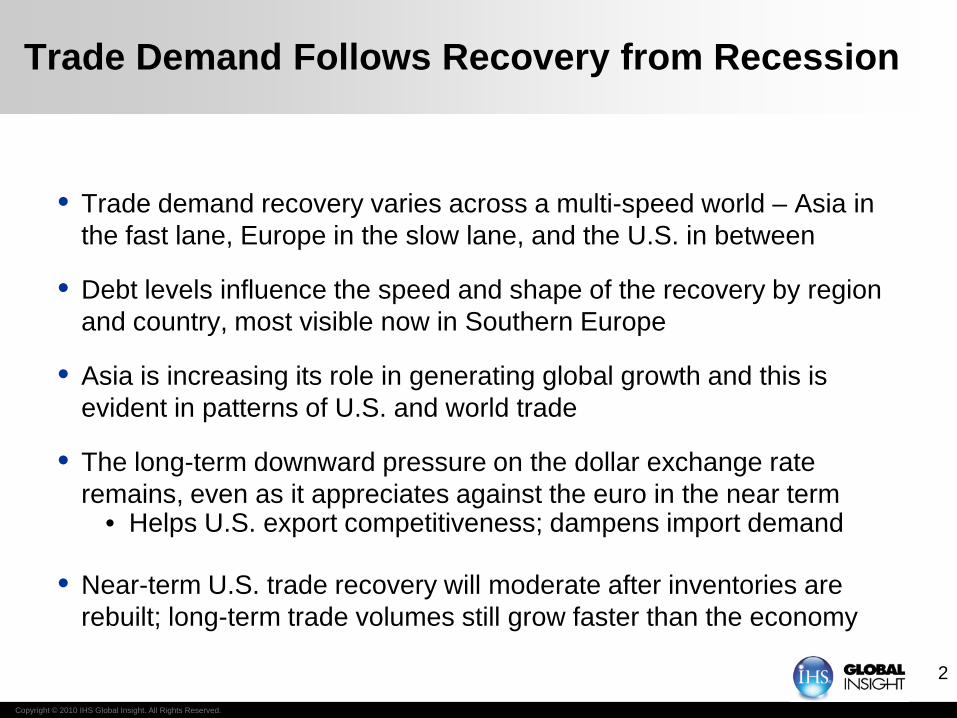
Trade Demand Follows Recovery from Recession
• Trade demand recovery varies across a multi-speed world – Asia in the fast lane, Europe in the slow lane, and the U.S. in between
• Debt levels influence the speed and shape of the recovery by region and country, most visible now in Southern Europe
• Asia is increasing its role in generating global growth and this is evident in patterns of U.S. and world trade
• The long-term downward pressure on the dollar exchange rate remains, even as it appreciates against the euro in the near term
• Helps U.S. export competitiveness; dampens import demand
• Near-term U.S. trade recovery will moderate after inventories are rebuilt; long-term trade volumes still grow faster than the economy

Copyright © 2010 IHS Global Insight. All Rights Reserved.
3
-9
-6
-3
0
3
6
9
1974 1979 1984 1989 1994 1999 2004 2009 2014
Real GDP Industrial Production
(Percent change)
Trade volumes reflect goods production which is more volatile than the economy as a whole
Source: IHS Global Insight

Copyright © 2010 IHS Global Insight. All Rights Reserved.
4
-12
-8
-4
0
4
8
GDP PrivateConsumption
FixedInvestment
GovernmentConsumption
Exports
2009 2010 2011 2012
(Percent change in real value)
In World Economic Growth by Sector, Trade Fell the Most and Comes Back Strongest
Source: IHS Global Insight
Copyright © 2010 IHS Global Insight. All Rights Reserved.
5
-15
-10
-5
0
5
10
15
NAFTA WesternEurope
Asia-Pacific
OtherAmericas
EmergingEurope
Mideast-N.Africa
Sub-Saharan
Africa
2009 2010 2011 2012
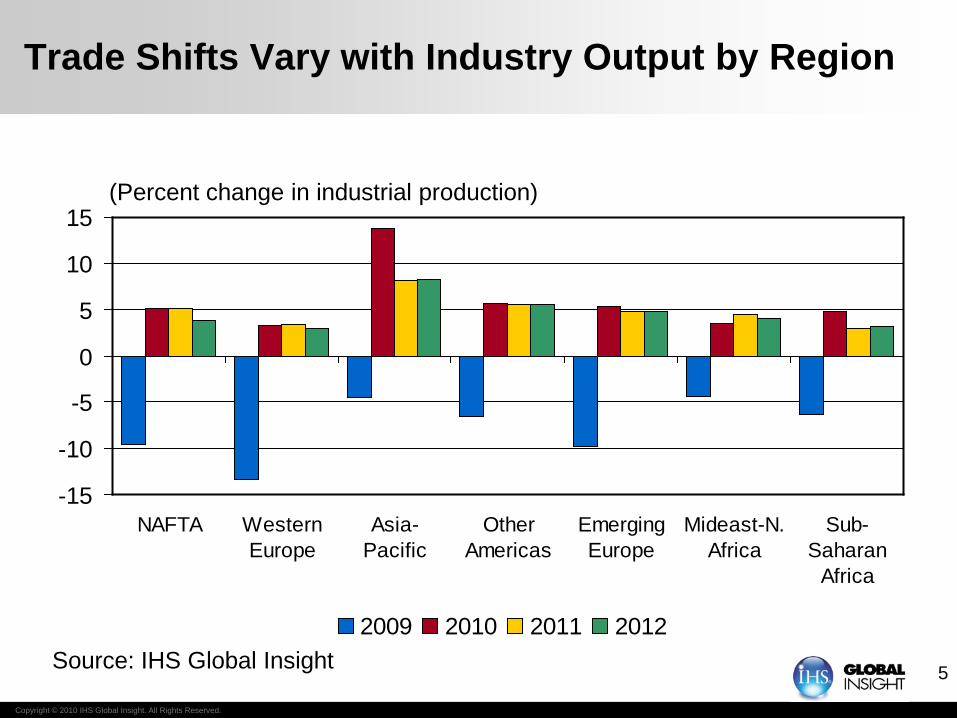
(Percent change in industrial production)
Trade Shifts Vary with Industry Output by Region
Source: IHS Global Insight

Copyright © 2010 IHS Global Insight. All Rights Reserved.
6
Trade Recovery by Commodity is Not Uniform, as Stage of Recovery Varies By Industry Sector
• Manufacturing recovery best for Autos, Metals, Chemicals and Commodities
• Output won’t reach pre-recession levels for several years• High commodity prices challenge sectors that use them
• Strong recovery for Information, Technology and Communications, recovering to former levels and above
• Banking / Finance stabilizes in U.S. (2010) and Europe (2011), but recovery is affected by bad loans and de leveraging
• Commercial / consumer credit availability still constrained• Continued, though select, push for infrastructure supports
trade related to transportation, communications and utilities
• Construction and related trade faces disappointing markets

Copyright © 2010 IHS Global Insight. All Rights Reserved.
77
Global Merchandise Trade Recovers by Next Year
0
50
100
150
200
250
2005 2006 2007 2008 2009 2010 2011 2012 2013 2014 2015
Air Sea Land/Other
(Trillions of U.S. dollars)
Source: IHS Global Insight World Trade Service

Copyright © 2010 IHS Global Insight. All Rights Reserved.
8
The U.S. Recovery: Picking Up Steam
• Underlying 2010 U.S. GDP growth forecast near 3.0%
• Steep recoveries usually follow steep recessions, but recoveries after financial crises are usually slower
• Consumer spending growth faces the headwind of still-high unemployment, but spending is now the strongest in three years
• Business spending on equipment (and services) and inventory rebuilding are boosting growth, as seen in freight and trade
• Non-residential construction and state-and-local spending will be a drag on the recovery of the economy into 2011
• Housing construction will struggle to get off the bottom
• Excess capacity will restrain wage and price inflation

Copyright © 2010 IHS Global Insight. All Rights Reserved.
9
-8
-6
-4
-2
0
2
4
6
8
2001 2002 2003 2004 2005 2006 2007 2008 2009 2010 2011 20123
4
5
6
7
8
9
10
11
Real GDP Growth (Left scale) Unemployment Rate (Right scale)
(Annual percent change) (Percent)
The U.S. Economic Recovery Advances
Source: IHS Global Insight

Copyright © 2010 IHS Global Insight. All Rights Reserved.
10
-10.0
-7.5
-5.0
-2.5
0.0
2.5
5.0
7.5
1990 1993 1996 1999 2002 2005 2008 2011 2014
U.S. Real GDP Industrial Production
(Percent change)
Industrial Production Outpaces Real GDP
Source: IHS Global Insight

Copyright © 2010 IHS Global Insight. All Rights Reserved.
11
Recovery Pace Varies by Business SizeCyclical Indicators Rising; Small Business Lagging
30
35
40
45
50
55
60
2007 2008 2009 201080828486889092949698100
ISM Manufacturing ISM Non-Manufacturing NFIB Small-Business
ISM Diffusion Indexes, 50 = breakeven NFIB Index,1986=100
Source: IHS Global Insight
Copyright © 2010 IHS Global Insight. All Rights Reserved.
12
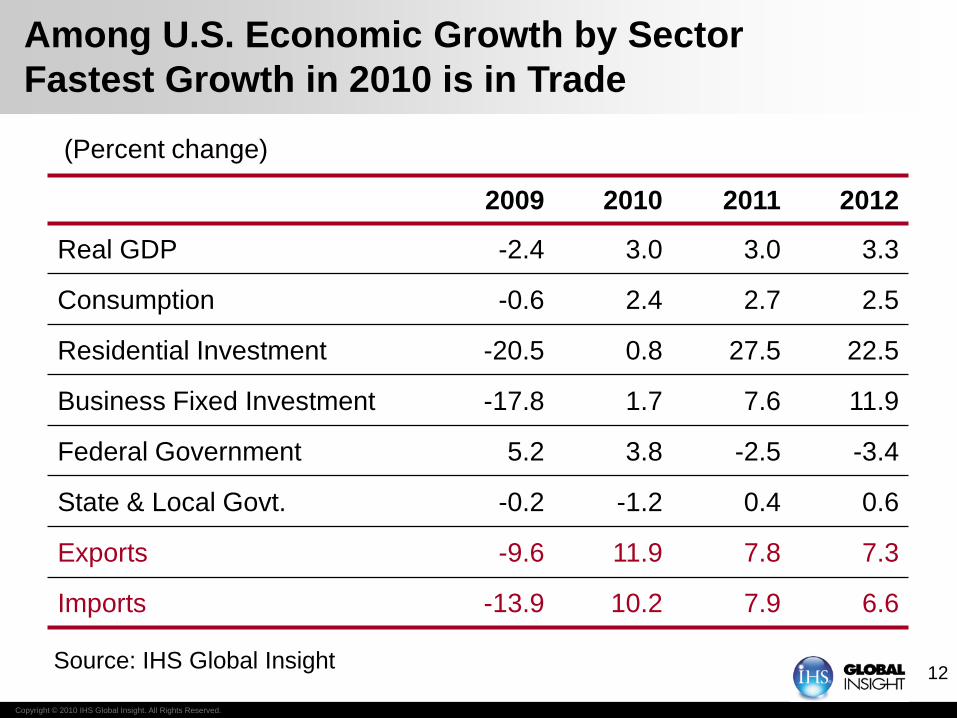
2009 2010 2011 2012
Real GDP -2.4 3.0 3.0 3.3
Consumption -0.6 2.4 2.7 2.5
Residential Investment -20.5 0.8 27.5 22.5
Business Fixed Investment -17.8 1.7 7.6 11.9
Federal Government 5.2 3.8 -2.5 -3.4
State & Local Govt. -0.2 -1.2 0.4 0.6
Exports -9.6 11.9 7.8 7.3
Imports -13.9 10.2 7.9 6.6
(Percent change)
Among U.S. Economic Growth by Sector Fastest Growth in 2010 is in Trade
Source: IHS Global Insight
Copyright © 2010 IHS Global Insight. All Rights Reserved.
13
-6-4
-20
24
68
10
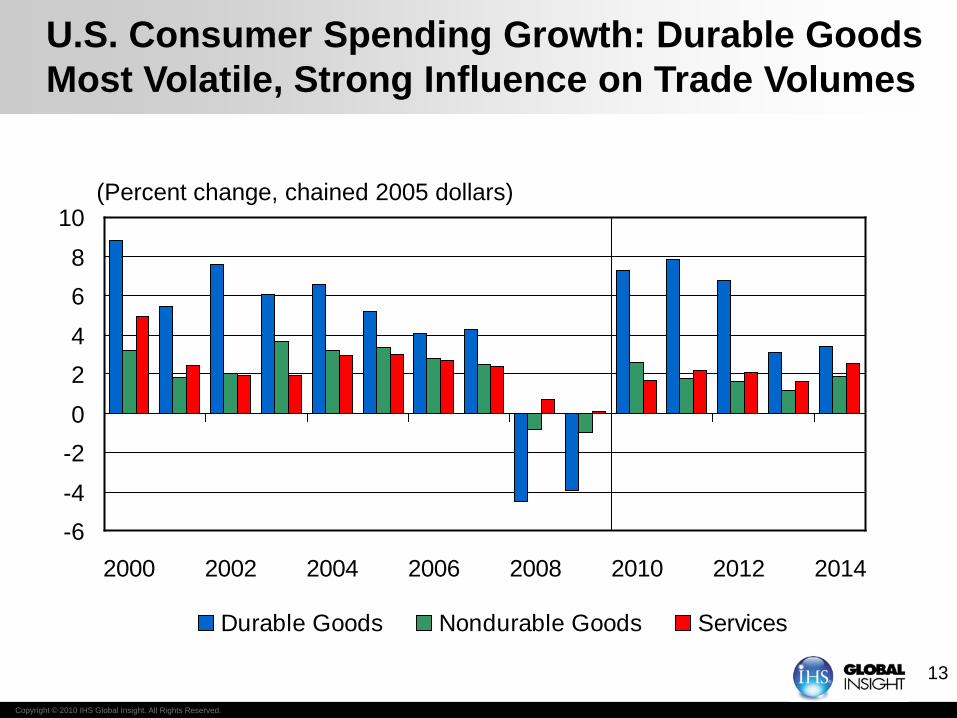
2000 2002 2004 2006 2008 2010 2012 2014
Durable Goods Nondurable Goods Services
(Percent change, chained 2005 dollars)
U.S. Consumer Spending Growth: Durable Goods Most Volatile, Strong Influence on Trade Volumes

Copyright © 2010 IHS Global Insight. All Rights Reserved.
14
(Percent change annualized rate, volumes)
Inventory Cycle Boosts U.S. Exports and Imports
-40
-30
-20
-10
0
10
20
30
2007 2008 2009 2010 2011 2012
Real U.S. Exports Real U.S. ImportsSource: IHS Global Insight

Copyright © 2010 IHS Global Insight. All Rights Reserved.
15
-8
-6
-4
-2
0
2
4
6
2008 2009 2010 2011 2012
GDP Final Sales
(Annualized real rate of growth in U.S., Q/Q, percent)
U.S. Inventory Cycle Led to the Q4 Growth Spurt
Source: IHS Global Insight

Copyright © 2010 IHS Global Insight. All Rights Reserved.
16
Recession Impacts on Logistics
Trade recession led to underutilized U.S. logistics system capacity across seaports, airports, terminals, railroads, trucking, warehousing and labor. Providers reduced deployed capacity where they could.
Consequences:
• Trade recovery faces capacity bottlenecks; vessel and air cargo capacity not back to pre-recession levels, despite size of idled equipment fleet.
• Freight captured by truck from intermodal rail during recession likely to shift back again, as rates and relative costs of trucking increase
• Still-improving intermodal rail service continues to capture line-haul long-distance trucking, reducing trucking average length of haul.
• Continued evolution of trade gateways from shipper demands and carriers optimizing operations and services
Top Related