


Languages
Pages
Legal

1 | Bioenergy Technologies Office eere.energy.gov
BETO’s Leveraging Existing Bioenergy Data Virtual Workshop
Open Forum Presentations (3x5)

www.alston.com© Alston & Bird LLP 2020
Intellectual PropertyTypes, Eligibility, and Protection
Charles A. NaggarAlston & Bird, LLP

© Alston & Bird LLP 2020 3
Intellectual Property
Intellectual Property refers to Creations of the Mind Bioenergy Data and Intellectual Property Ideas or Concepts Methods Standard Operation Procedures Materials Raw Data Analysis and Impressions Ideas for further experiments Devices, machines, processes, applications, etc.

© Alston & Bird LLP 2020 4
Trade Secrets
Copyrights
Trademarks
Patents
Information that can give an opportunity to obtain an economic advantage.Typically includes recipes, customer lists, methodologies, procedures, etc.
Legal rights to a creative work. Includes article publications, books, presentations, and other media.
Used to identify and distinguish the seller of goods or services. For example, brand name or logo.
Must be a “new and useful process, machine, manufacture, or composition of matter.” Requires disclosure of the invention to receive exclusivity. Laws of Nature, physical phenomena, and abstract ideas are not patentable.Examples include application or device, but not raw data or mathematical equation.
© Alston & Bird LLP 2020 5
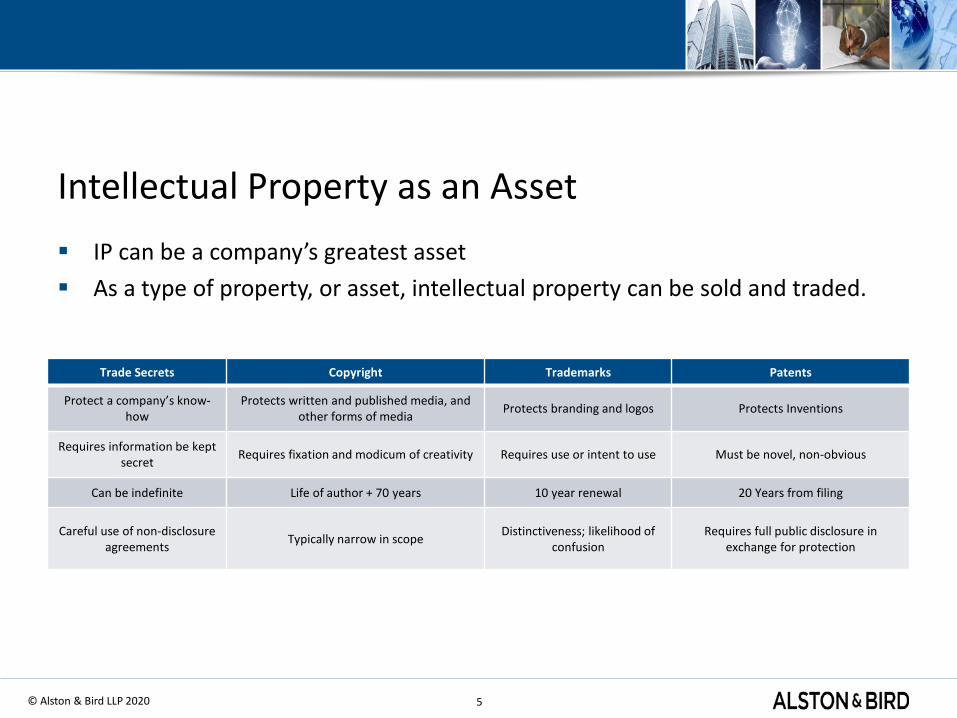
Intellectual Property as an Asset IP can be a company’s greatest asset As a type of property, or asset, intellectual property can be sold and traded.
Trade Secrets Copyright Trademarks Patents
Protect a company’s know-how
Protects written and published media, and other forms of media Protects branding and logos Protects Inventions
Requires information be kept secret Requires fixation and modicum of creativity Requires use or intent to use Must be novel, non-obvious
Can be indefinite Life of author + 70 years 10 year renewal 20 Years from filing
Careful use of non-disclosure agreements Typically narrow in scope Distinctiveness; likelihood of
confusionRequires full public disclosure in
exchange for protection

© Alston & Bird LLP 2020 6
Thank You
Charles Naggar Intellectual Property Litigation Attorney

Fueling the 21st Century
Existing Data 3x5
Bruce Adkins July 2020

Timeline
2007 201720112009
2008 2010 20162012 2014
2013 2015
2Q 2011Columbus Ground-breaking
1Q 2010Pasadena10 TPDDemo Unit
1Q 2009 PasadenaFirst Pilot Plant
3Q 2007KiOR founded
2Q 2012ColumbusMechanical Completion
1Q 2013ColumbusFirst FuelShipment
1Q 2016NameChange
1Q 2013PasadenaSecondPilot Plant
1Q 2014End ofColumbusOperations
2Q 2015Emergence from
Chapter 11
2018
2Q 2010 PasadenaLab Units(PRUs)
Jun 23 2011IPO
Funding: All VC & IPO

Clockwise From Top Left
500 TPD Plant2 KCR Pilot-Plants10 TPD Demo Unit3 PRU Batch Units
Two Hydrotreating Pilot-Plants (not shown)
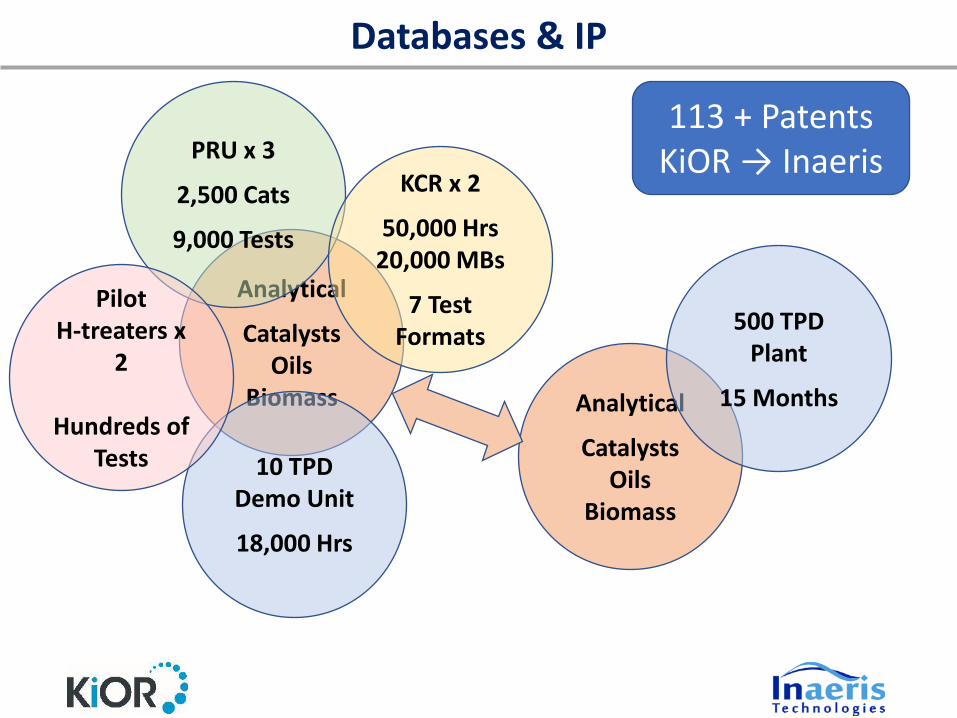
Analytical
CatalystsOils
Biomass
PRU x 3
2,500 Cats
9,000 Tests
10 TPDDemo Unit
18,000 Hrs
KCR x 2
50,000 Hrs20,000 MBs
7 Test Formats
Analytical
CatalystsOils
Biomass
500 TPDPlant
15 Months
113 + PatentsKiOR → Inaeris
Databases & IP
Pilot H-treaters x
2
Hundreds of Tests
Scale-Up Data: A Hidden AssetJoe Sagues, PhD
Assistant ProfessorBiocarbon Utilization & Sequestration (BUS) Lab
Biological & Agricultural EngineeringNorth Carolina State University
11

Lab: 1 gal
Pilot: 80 gal
Demo: 8000 gal
Cellulosic Ethanol Scale-UpTimeline: 2011 – 2015Position: Senior Bioprocess Engineer
12
Lonnie Ingram, PhD

Scale-Up Data: A Hidden Asset
• One techno-economic assessment published• K. Gubicza, Z. Barta, I. U. Nieves, W. J. Sagues, K. T. Shanmugam, L. O. Ingram. 2016. “Techno-economic analysis of ethanol
production from sugarcane bagasse using a Liquefaction plus Simultaneous Saccharification and Co-Fermentation process” Bioresource Technology (IF: 5.807), 208, 42-48Link
• Qualitative and quantitative process data not available to public
• Lessons learned from failed biorefineries – critical for the bioeconomy
• Academic journal, special edition focused on disseminating data from failed biorefinery deployments?
13

• Conversion pathway
• Thermodynamic limitations
• Catalyst design
• Product discovery
• Goal & scope
• Inventory analysis
• Publichealth effects
• Environ-mental impact
• Public perception
Fundamental Research
AppliedResearch
Techno-EconomicAssessment Scale-Up Commercialization
Bio-IndustrialSystem
Modeling
• Capital costs
• Operating costs
• Comprehensive sensitivity & uncertainty
• Technology readiness
• Coproduct validation
• Rate of return
• Policy incentives
• Pilot-scale
• Demo-scale
• Product launch
• Market analysis
• Competing technologies
• Geospatial analysis
• Policy uncertainty
Bioproduct Life-Cycle
Assessment
• Process synthesis and modeling
• Reactor design
• Screening & optimization
• Product development
• Nonideal scenario
Integrated Technology-to-Market Framework
14
[email protected]://www.sagueslab.com/

Knowledge Representation to Capture Lessons
Learned in Bioprocessing
Deepti Tanjore
07/21/2020
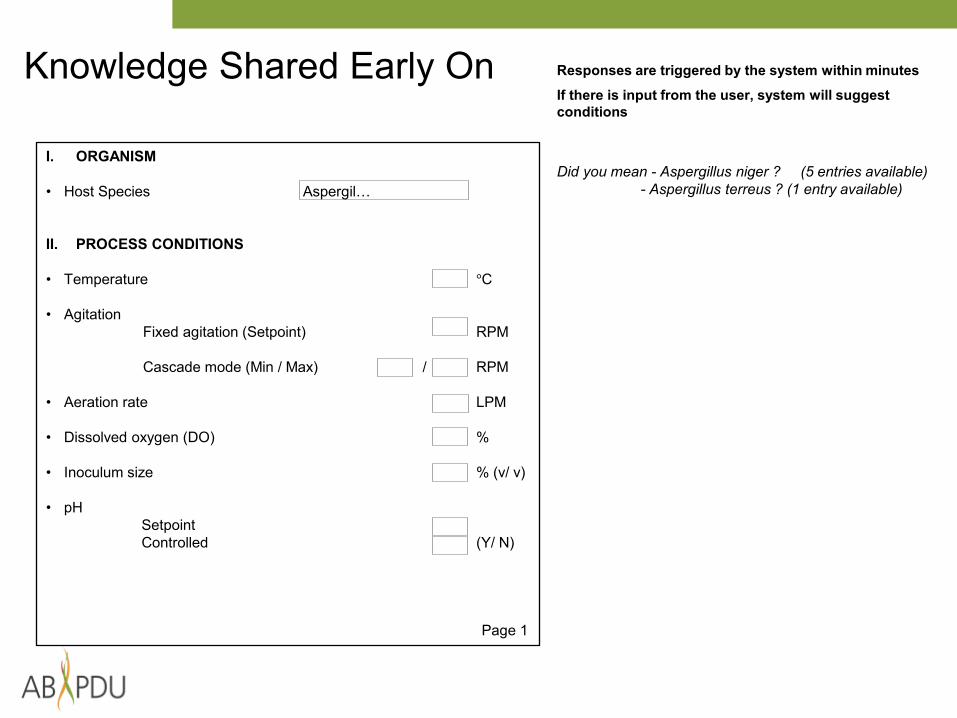
Knowledge Shared Early On Responses are triggered by the system within minutesIf there is input from the user, system will suggest conditions
I. ORGANISM
• Host Species Aspergil…
II. PROCESS CONDITIONS
• Temperature °C
• AgitationFixed agitation (Setpoint) RPM
Cascade mode (Min / Max) / RPM
• Aeration rate LPM
• Dissolved oxygen (DO) %
• Inoculum size % (v/ v)
• pHSetpoint Controlled (Y/ N)
Page 1
Did you mean - Aspergillus niger ? (5 entries available)- Aspergillus terreus ? (1 entry available)

Knowledge Shared Early On Responses are triggered by the system within minutesIf there is input from the user, system will suggest conditions
I. ORGANISM
• Host Species Aspergil…
II. PROCESS CONDITIONS
• Temperature 30 °C
• AgitationFixed agitation (Setpoint) RPM
Cascade mode (Min / Max) 300 / 1200 RPM
• Aeration rate 1 LPM
• Dissolved oxygen (DO) 20 %
• Inoculum size 4 % (v/ v)
• pHSetpoint 4.5Controlled Y (Y/ N)
Page 1
Did you mean - Aspergillus niger ? (5 entries available)- Aspergillus terreus ? (1 entry available)
Great choice!: 4 out of 5 entries chose 30°C for A. nigerOnly 1 used 28 °C
learn more about each processe.g. #1: Carried out by [email protected]
[Link to profile]
Warning (1):4 % (v/v) can result in long lag phase and contamination; 5% or higher inoculum size is recommended (ABPDU study #4)
If Yes, recommendations for Acid/Base + Concentration
e.g. Two entries used 3.5 N H2SO4 and 5 N NaOHThree entries used 3.5 N H2SO4 and 3 N NH4OH

Knowledge Shared Early On Responses are triggered by the system within minutesIf there is input from the user, system will suggest conditions
IV. FEED
• Feed Hydrolysate
IV. MICROBIOLOGY
• Expected By-Products EthanolLactic Acid
Citric Acid
• Morphology Pellets, in varied sizes
• Expected Growth rate Slow Growth
• Biomass Determination Gravimetric (WCW)
V. DOWNSTREAM PROCESSING
Product Protein
• Product recovery desired
• Purity desired
• Exploitable Characteristics
Page 3
Warning (5):Ethanol might serve as carbon source; No DO spike after glucose depletion. Do not overfeed
with glucose (“Crab-Tree Effect”) Consider starvation strategy Review Wehrs et al., 2018 and “Crab-Tree Effect”
Warning (6):Varied: Pay close attention to preculture settings (shaking speed, working volumes) preculture determines morphology
Warning (7): – Two Interacting Parameter LevelsSlow growth and Low Inoculum size: High risk of contamination / Consider larger inoculation size
Warning (8) – Two Interacting Parameter LevelsGravimetic biomass determination: Difficult to take representative samples with A. niger!If hydrolysate feed has any solid content; it may interfere with gravimetrical biomass measurements
Warning (9):Protein titer may be compromised by degradation through proteases; ensure high glucose conc. throughout the run, to prevent protein losses
Recommendations for DSP techniques (DSC, TFF with membrane size, that worked for A. Niger)

Minimizing Repetition of “Failed” studies
Identifying Experiment Process
Conditions and Designing Good
StudiesData acquisition,
including metadata and anecdotal
information
Knowledge Representation to re-use acquired
data

Beyond Designing Experiments
• Operational Lessons more difficult to Preserve – Cannot Publish• No IP associated with them

Data Qualification FrameworkLeveraging Existing Bioenergy Data WorkshopJuly 2020
Rachel Emerson - INL
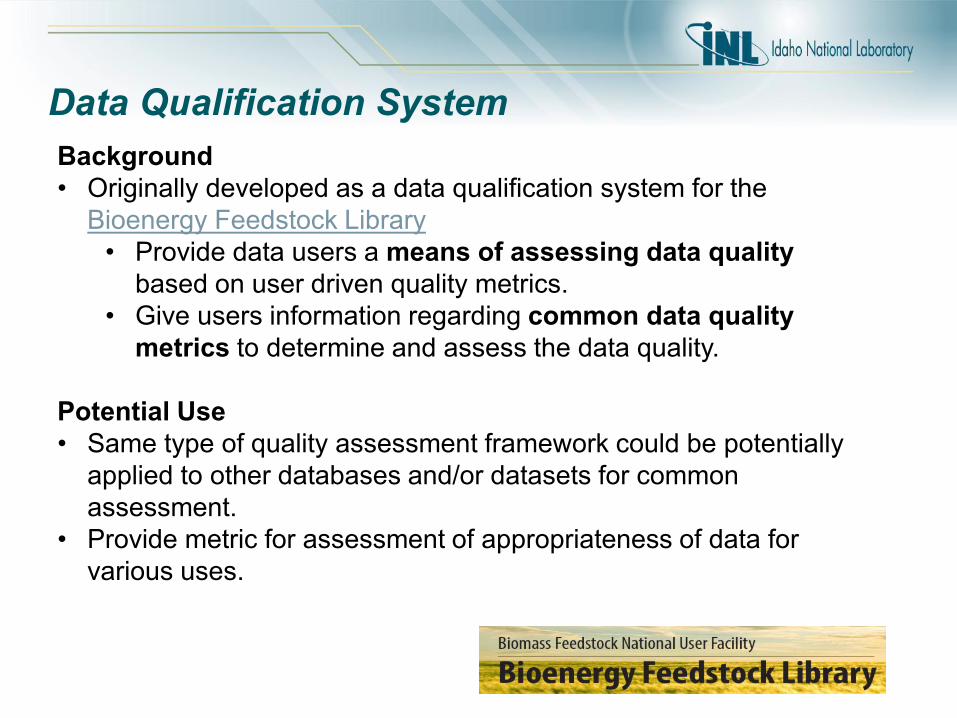
Data Qualification System Background• Originally developed as a data qualification system for the
Bioenergy Feedstock Library• Provide data users a means of assessing data quality
based on user driven quality metrics.• Give users information regarding common data quality
metrics to determine and assess the data quality.
Potential Use • Same type of quality assessment framework could be potentially
applied to other databases and/or datasets for common assessment.
• Provide metric for assessment of appropriateness of data for various uses.

Data Qualification Methodology• Seven data qualifier categories were developed and posed in a
question format in order to generate a True/False response.– Methodology: Assessment of specific analytical methods used – Standards: Availability of standards or controls– Replication: Availability and representation of replicate data– Specification: Availability of method specific specification
requirements– Preparation: Availability of information of samples meeting
method specific preparation (physical formats)– Sample History: Historical metadata for sample origination– Primary Qualification: Data qualification provided by original
researcher or group• Provide data qualification justification along with True/False identifier
for each qualified datapoint.

Data Qualification ExampleSample 1 Justification
Data Point SiO2 (% in Ash)Analytical Methodology ASTM basedMethodology TRUE Standard methodStandards FALSE Not availableReplication FALSE Not availableSpecification FALSE UnknownPreparation TRUE Samples in methodology
specified formatHistory TRUE Ancestry and metadata
availablePrimary Qualifier FALSE Data collected at external lab

Igor Grigoriev Program Head, Fungal and Algal GenomicsUS Department of Energy Joint Genome Institute,Lawrence Berkeley National Laboratory
Building Fungal and Algal Multi-omics
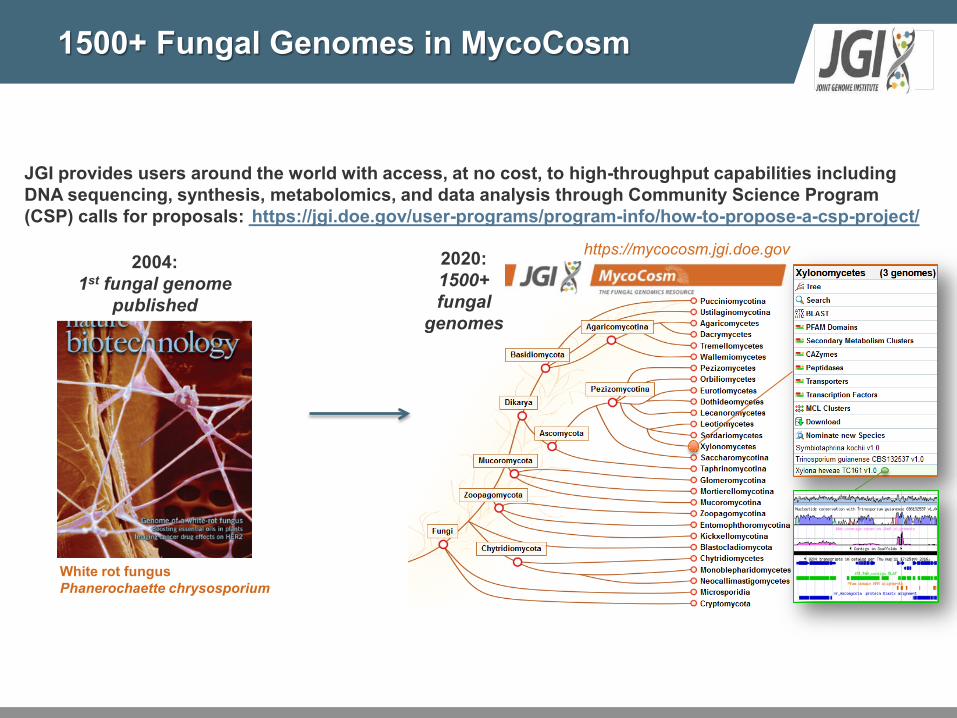
The picture can't be displayed.1500+ Fungal Genomes in MycoCosm
JGI provides users around the world with access, at no cost, to high-throughput capabilities including DNA sequencing, synthesis, metabolomics, and data analysis through Community Science Program (CSP) calls for proposals: https://jgi.doe.gov/user-programs/program-info/how-to-propose-a-csp-project/
2004: 1st fungal genome
published
White rot fungus Phanerochaette chrysosporium
2020:1500+ fungal
genomes
https://mycocosm.jgi.doe.gov

The picture can't be displayed.New Strategic Focus on Algal Genomics
https://phycocosm.jgi.doe.gov 50+ algal genomes
JGI Strategic Plan 2018

The picture can't be displayed.Towards Multi-omics and Predictive Modeling
Calhoun et al, in preparation
Metabolomics
Gene co-expression
network
Gene targets
Metabolic reconstruction
Regulation of carbon metabolism in model fungus Neurospora crassa(KO, ChIP-Seq, RNA-Seq, DAP-Seq)
Gene target identification for algal strain improvement using multi-omics data (genome, transcriptome, metabolome)
Wu et al, PNAS 2020
NREL 46B-D3

Computational Catalyst Property Database and Catalyst Deactivation
Leveraging Existing Bioenergy Data Workshop
Carrie Farberow, Kurt Van Allsburg, NalinratGuba, Nick Wunder, Matt Jankousky, Sean Tacey, Kris Munch, Josh Schaidle

Bioenergy Technologies Office |
Catalysis R&D to Enable Bioenergy
38
Computational Catalysis Data• Expensive: Generated using high-
performance computing resources• Redundant: Typically recalculated by
researchers for application of interest
Evaluating Catalyst Deactivation• Relevance: Catalyst deactivation limits
biorefinery performance• Complexity: Deactivation is a function of
biomass composition and reaction conditions

Bioenergy Technologies Office |
Database Data Acquisition
39
Existing Data Source: • Peer-reviewed scientific journal articles
Tables Figures Plots Text
Data Acquisition Plans and Challenges• Literature mining
• Challenge: time-consuming, accuracy of interpretation• Development of automated tools for extraction and upload
• Challenge: variability in software/file types, variability in researcher workflows• Engage data generators (i.e., researchers) to upload their data
• Compensation in form of data visibility and citations• Challenges: buy-in, data quality
ACS Catal. (2013) 3, 1622; Joule (2019) 3, 2219; Phys. Rev. Lett. (2007) 99, 016105; J. Catal. (2019) 377, 577
Current/Future Data Source: • Direct entry by researchers• Extract and upload from calculation file output• Automate for high-throughput calculations
Computational Catalyst Property Database Web Application

Bioenergy Technologies Office |
Evaluating Catalyst Deactivation
40
Significance: Catalyst deactivation is a cross-cutting challenge in bioenergy applications that hinders biorefinery performance (i.e., onstream time, operating capacity, and cost)
ChemCatBio Goal: Understand and address catalyst deactivation for biomass conversion to extend catalyst lifetime and limit process upsets Develop mitigation strategies and regeneration
protocols
Example of Catalyst Deactivation
D. Ruddy, et al., Nature Catalysis 2 (2019) 632-640.
Challenge: Multiple modes of catalyst deactivation exist, and they are a function of feedstock properties, operating conditions, catalyst formulation, and time on stream Peer-reviewed publications often have limited focus on catalyst deactivation and
do not typically run under realistic operating conditions over long time periods
Key Question: How could we collect datasets from the bioenergy industry regarding catalyst performance under realistic operating conditions to guide and inform our
development of deactivation mitigation strategies and regeneration protocols?

ORNL is managed by UT-Battelle, LLC for the US Department of Energy
Time and the Value of Data
Bruce E. WilsonEnvironmental Sciences Division
Leveraging Existing Bioenergy Data Workshop21 July 2020
4242
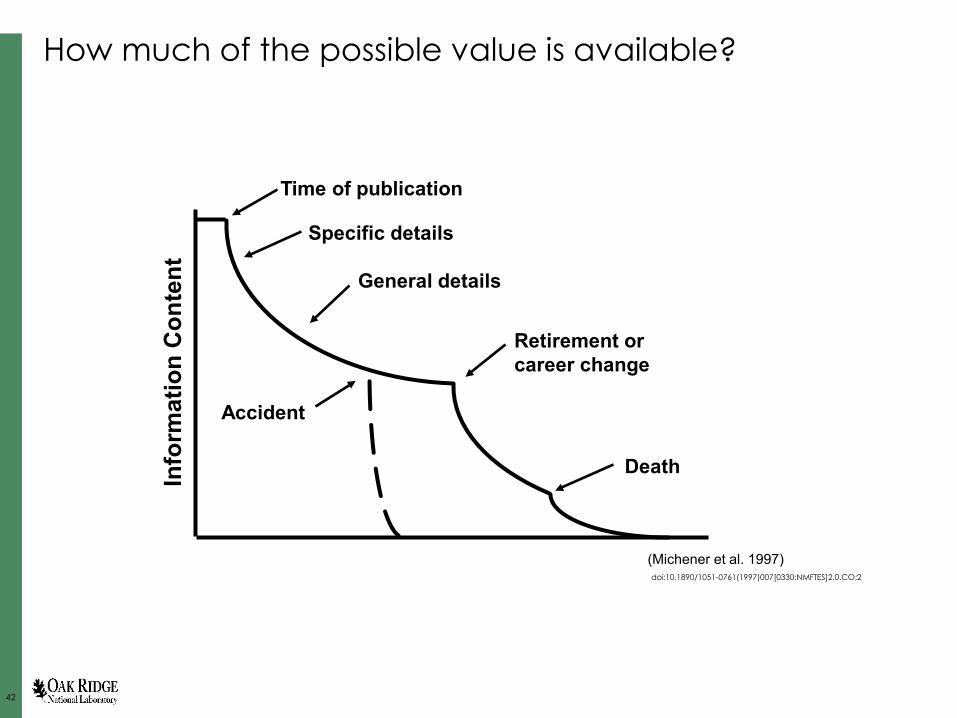
How much of the possible value is available?
Info
rmat
ion
Con
tent
Time of publication
Specific details
General details
Accident
Retirement or career change
Death
(Michener et al. 1997)doi:10.1890/1051-0761(1997)007[0330:NMFTES]2.0.CO;2

4343
How does value change over time?
0
0.1
0.2
0.3
0.4
0.5
0.6
0.7
0.8
0.9
1
0 0.04 0.08 0.12 0.16 0.2 0.24 0.28 0.32 0.36 0.4 0.44 0.48 0.52 0.56 0.6 0.64 0.68 0.72 0.76 0.8 0.84 0.88 0.92 0.96 1
Val
ue
Time
4444
How does value change as the collection grows?
Image Credit: Wikimedia Commons user: BourrichonUsed under Creative Commons Share Alike 3.0

Department of Plant and Soil Sciences271 Agricultural Hall Stillwater, Oklahoma 74078-6028
Prof. Vijaya Gopal [email protected]
OFFICE ofENERGY EFFICIENCY & RENEWABLE ENERGY Leveraging Existing Bioenergy Data Virtual Workshop July 21–23, 2020
Generating and Transferring Technologyto Filling Knowledge Gaps
Vijaya Gopal Kakani Warth Distinguished Professor
Crops, Energy & ClimateOklahoma State University
Stillwater, OK

Department of Plant and Soil Sciences271 Agricultural Hall Stillwater, Oklahoma 74078-6028
Prof. Vijaya Gopal [email protected]
OFFICE ofENERGY EFFICIENCY & RENEWABLE ENERGY Leveraging Existing Bioenergy Data Virtual Workshop July 21–23, 2020
Generating and Transferring Technology
Department of Plant and Soil Sciences271 Agricultural Hall Stillwater, Oklahoma 74078-6028
Prof. Vijaya Gopal [email protected]
OFFICE ofENERGY EFFICIENCY & RENEWABLE ENERGY Leveraging Existing Bioenergy Data Virtual Workshop July 21–23, 2020
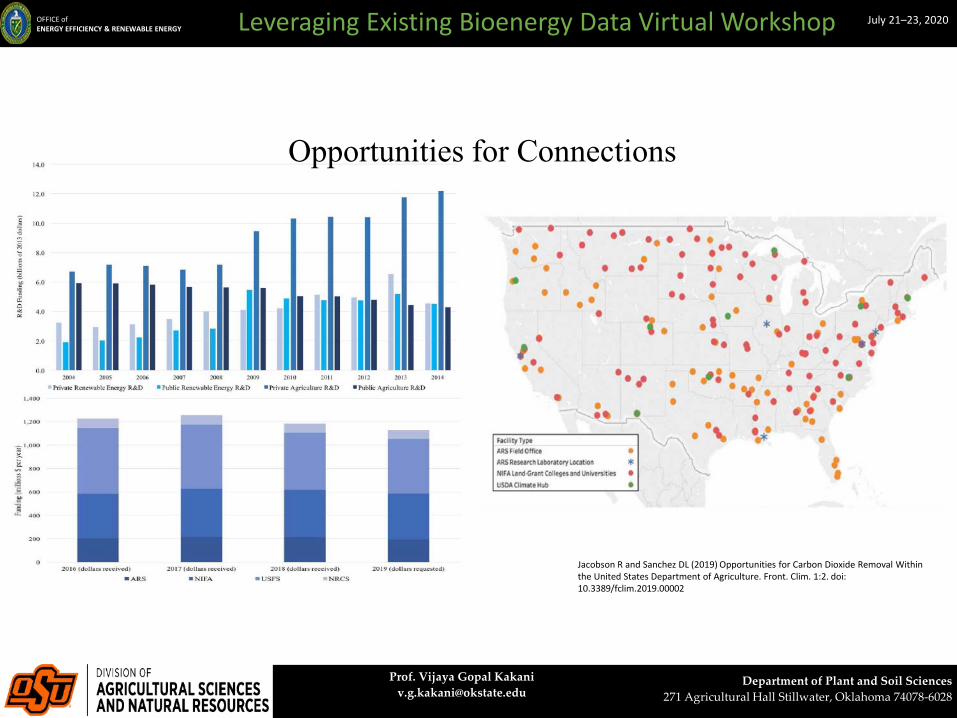
Jacobson R and Sanchez DL (2019) Opportunities for Carbon Dioxide Removal Within the United States Department of Agriculture. Front. Clim. 1:2. doi: 10.3389/fclim.2019.00002
Opportunities for Connections
Department of Plant and Soil Sciences271 Agricultural Hall Stillwater, Oklahoma 74078-6028
Prof. Vijaya Gopal [email protected]
OFFICE ofENERGY EFFICIENCY & RENEWABLE ENERGY Leveraging Existing Bioenergy Data Virtual Workshop July 21–23, 2020
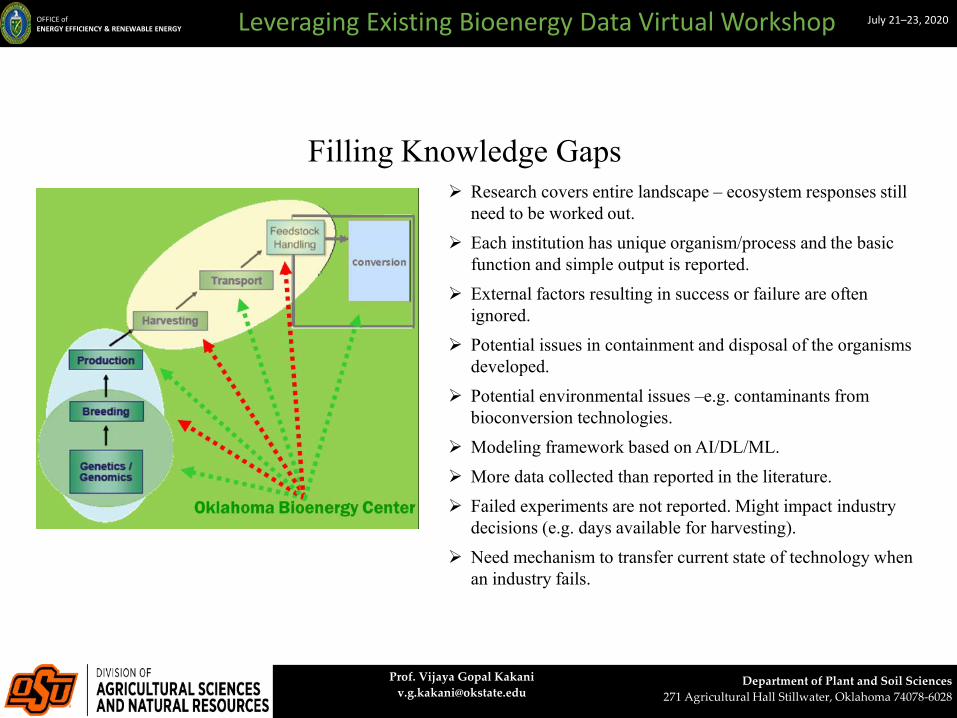
Research covers entire landscape – ecosystem responses still need to be worked out.
Each institution has unique organism/process and the basic function and simple output is reported.
External factors resulting in success or failure are often ignored.
Potential issues in containment and disposal of the organisms developed.
Potential environmental issues –e.g. contaminants from bioconversion technologies.
Modeling framework based on AI/DL/ML. More data collected than reported in the literature. Failed experiments are not reported. Might impact industry
decisions (e.g. days available for harvesting). Need mechanism to transfer current state of technology when
an industry fails.
Filling Knowledge Gaps
Top Related