


Languages
Pages
Legal

Research to Reality in Air Traffic Management
BENEFITS ASSESSMENT OF REDUCED SEPARATIONS IN NORTH ATLANTIC
ORGANIZED TRACK SYSTEM
August 2005
Almira Williams, CSSIIsrael Greenfeld, NASA Glenn
2
Project Objective
• Determine benefits of reduced horizontal separations in the North Atlantic Track System as a function of equipage levels and demand growth for up to 2015
• Determine improvements in flight efficiency through metrics such as fuel and time cost savings, and additional cargo revenue potential (by flight and by airframe)
• Determine improvements in system performance through metrics such as approved alt. change requests, and duration at sub-optimal altitude
3
Project Scenarios
• Three Demand levels: 2005, 2010, and 2015
• Five Equipage levels: 0, 25, 50, 75, and 100
• 2 sets of tracks: early morning eastbound (V-Z) and early afternoon westbound tracks (A-F).
• Three types of track configuration: - Regular: current tracks with mixed equipage operations
- Segregated: some tracks not accessible to non-equipped flights
- Additional Segregated: new tracks established between two adjacent segregated tracks
=> 72 simulation scenarios (+9)
4
Modeling Requirements
• Future traffic generator to determine traffic demand levels, and fleet and equipage for the future years of interest
• Fuel consumption optimization model to determine optimal trajectories, step-climb and speed profiles for each of the flights (ISO atmosphere and forecasted wind data)
• Track selection model to determine user-preferred tracks for the future flights
• Track operations simulation models to impose restrictions due totraffic interactions (modify optimal altitude and speed profiles)
• Fuel consumption model to determine fuel requirements for the constrained trajectories
5
Benefits Mechanisms

6
Benefits Mechanisms
- Improved routes, altitude and speed profiles• Lower fuel consumption• Shorter flight times• Additional cargo potential
- Improved ability to estimate fuel requirements • Contingency fuel reduction• Improved schedules• Additional cargo potential
- Improved system performance• Accommodation of higher demand levels, accommodation of user preferred
choices, including denied alt. change requests, duration at sub-optimal altitude, etc.

7
Benefits Mechanisms:Current Practices in NAT OTS
Each flight is required to maintain its track, altitude and Mach number, as assigned by the oceanic ATSP.
LateralSeparation
Longitudinal Separation
Track A
Track B
Track C
Track D
Track C
LongitudinalSeparation
Vertical Separation
Cruise climb
Step climb
8
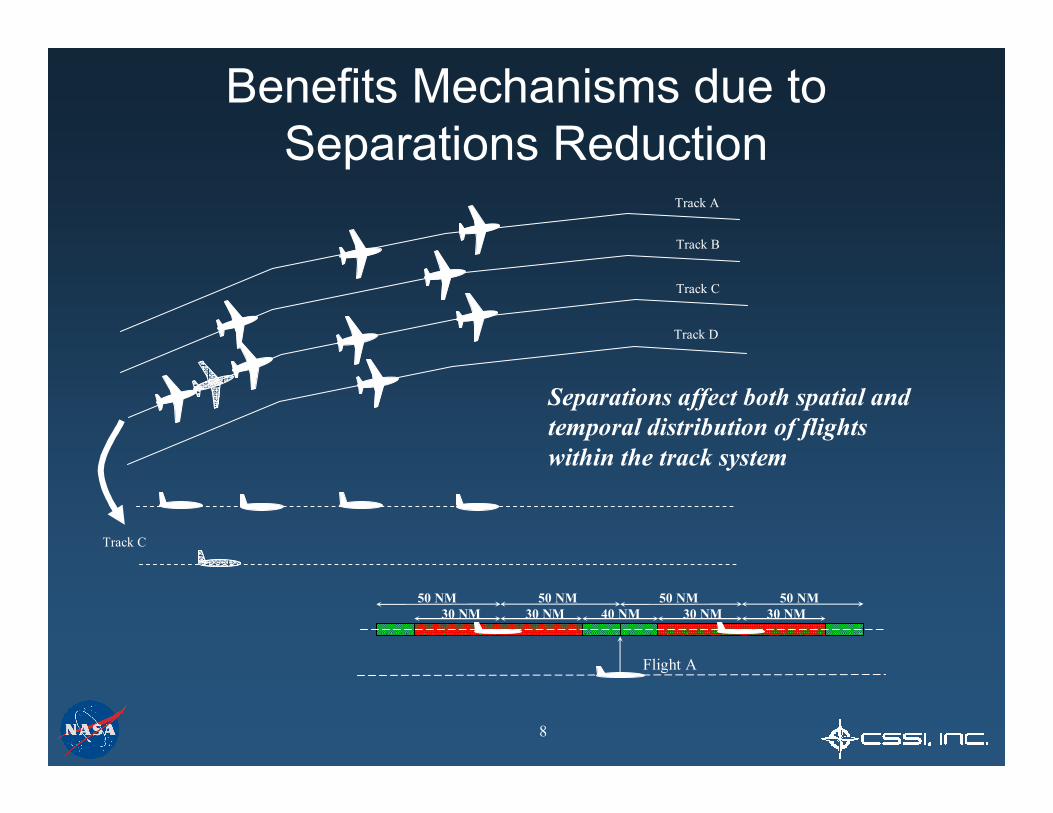
Benefits Mechanisms due toSeparations Reduction
Track A
Track B
Track C
Track D
Track C
Separations affect both spatial and temporal distribution of flights within the track system
30 NM 30 NM50 NM 50 NM
30 NM 30 NM50 NM 50 NM
Flight A
40 NM

9
Benefits Calculations:Regular Tracks
10
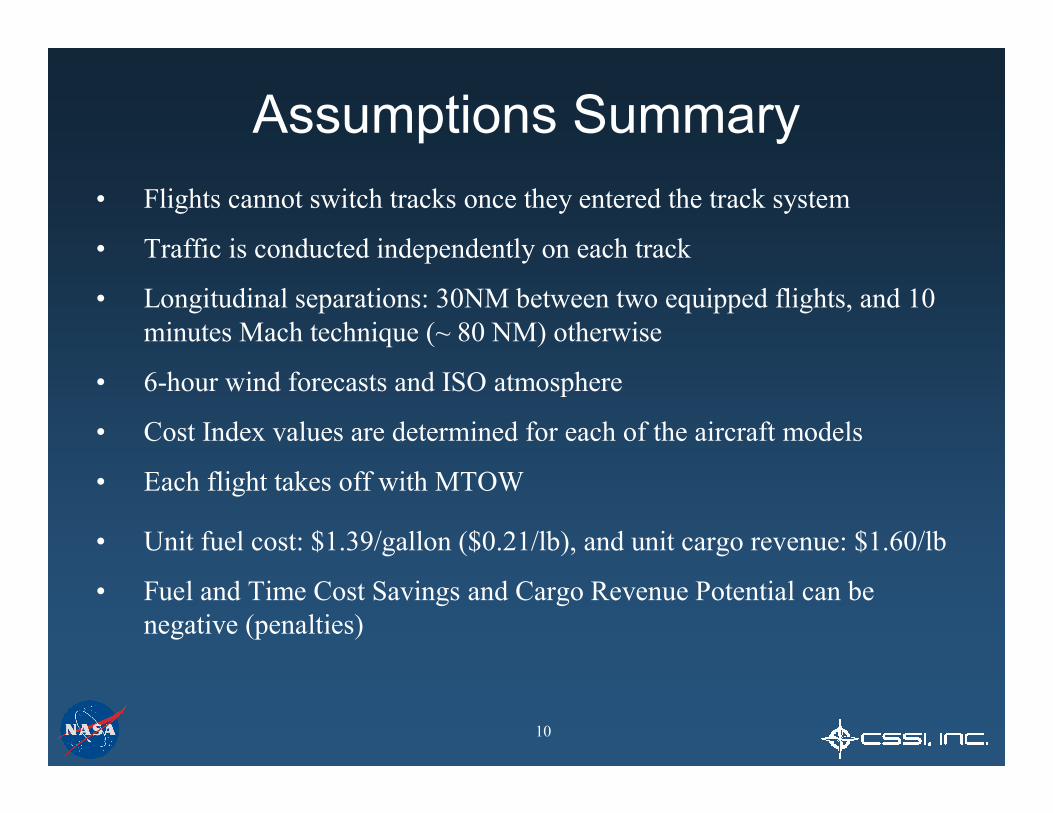
Assumptions Summary• Flights cannot switch tracks once they entered the track system
• Traffic is conducted independently on each track
• Longitudinal separations: 30NM between two equipped flights, and 10 minutes Mach technique (~ 80 NM) otherwise
• 6-hour wind forecasts and ISO atmosphere
• Cost Index values are determined for each of the aircraft models
• Each flight takes off with MTOW
• Unit fuel cost: $1.39/gallon ($0.21/lb), and unit cargo revenue: $1.60/lb
• Fuel and Time Cost Savings and Cargo Revenue Potential can be negative (penalties)

11
NAT OTS – Equipage Considerations
Equipped flights can climb throughout their flights, whereas the non-equipped flights cannot climb while on NATOTS
320
330
340
350
360
2 4 6 8 10 12 14 16
GMT (hr)
Non-equipped Flight
Equipped Flight
Track Segment

12
Regular Tracks: Average Fuel and Time Savings (per flight)
$0
$40
$80
$120
$160
$200
0% 25% 50% 75% 100%
Equipage Level (%)
Avg
. Fue
l and
Ti
me
Savi
ngs
($)
200520102015

13
Regular Tracks – Fuel and Time Savings: Benefits vs. Penalties
0%10%
20%30%
40%50%
60%70%
0% 25% 50% 75% 100%
Equipage Level (%)
Perc
ent F
light
s w
/Ben
efits
0%
10%
20%
30%
40%
50%
0% 25% 50% 75% 100%
Equipage Level (%)
Perc
ent F
light
s w
/Pen
altie
s
$0
$50
$100
$150$200
$250
$300
$350
0% 25% 50% 75% 100%
Equipage Level (%)
Ave
rage
Ben
efits
($)
-$120
-$100
-$80
-$60
-$40
-$20
$00% 25% 50% 75% 100%
Equipage Level (%)
Ave
rage
Pen
altie
s ($
)
2005
2010
2015
14
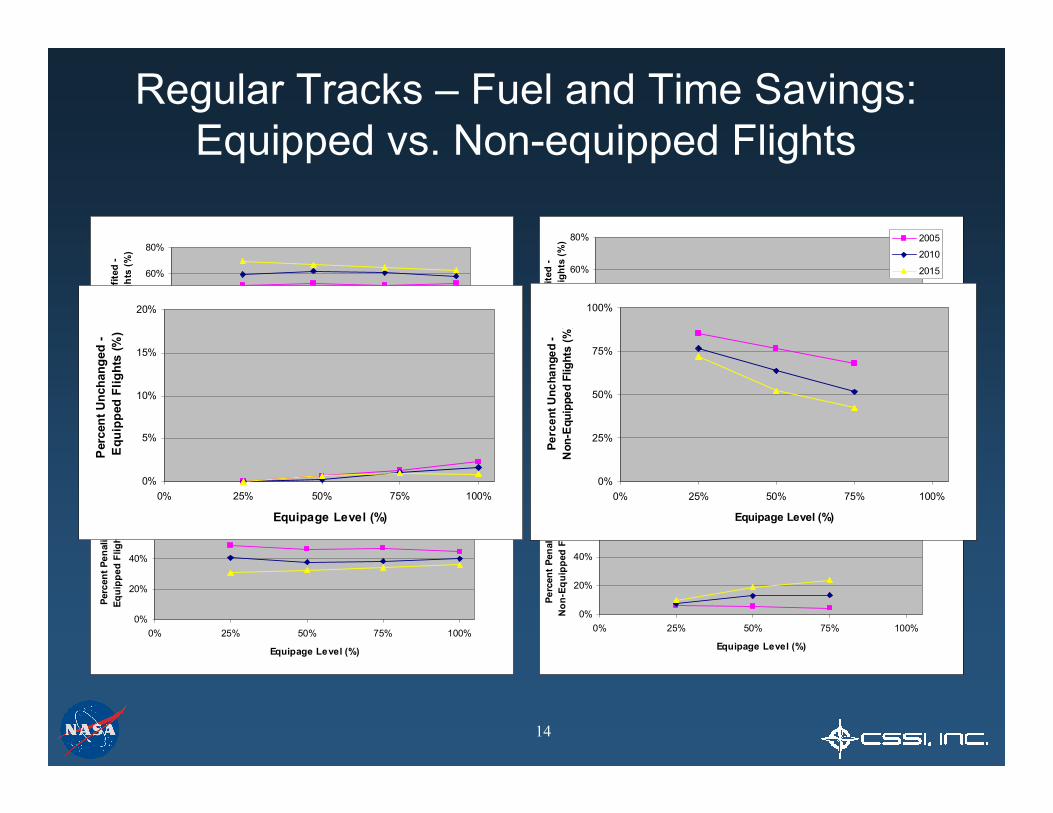
Regular Tracks – Fuel and Time Savings: Equipped vs. Non-equipped Flights
0%
20%
40%
60%
80%
0% 25% 50% 75% 100%
Equipage Level (%)
Perc
ent P
enal
ized
-N
on-E
quip
ped
Flig
hts
(%)
0%
20%
40%
60%
80%
0% 25% 50% 75% 100%
Equipage Level (%)
Perc
ent P
enal
ized
-Eq
uipp
ed F
light
s (%
)
0%
20%
40%
60%
80%
0% 25% 50% 75% 100%
Equipage Level (%)
Perc
ent B
enef
ited
-N
on-E
quip
ped
Flig
hts
(%) 2005
2010
2015
c
0%
20%
40%
60%
80%
0% 25% 50% 75% 100%
Equipage Level (%)
Perc
ent B
enef
ited
-Eq
uipp
ed F
light
s (%
)
0%
25%
50%
75%
100%
0% 25% 50% 75% 100%
Equipage Level (%)
Perc
ent U
ncha
nged
-N
on-E
quip
ped
Flig
hts
(%)
0%
5%
10%
15%
20%
0% 25% 50% 75% 100%
Equipage Level (%)
Per
cent
Unc
hang
ed -
Equ
ippe
d Fl
ight
s (%
)

15
Regular Tracks: Equipped vs. Non-equipped Flights (cont.)
0.0%
0.1%
0.2%
0.3%
0.4%
0.5%
0% 25% 50% 75% 100%
Equipage Level (%)A
vera
ge S
avin
gs p
er
Non
-equ
ippe
d Fl
ight
(%)
2005
2010
2015
0.0%
0.1%
0.2%
0.3%
0.4%
0.5%
0% 25% 50% 75% 100%
Equipage Level (%)
Ave
rage
Sav
ings
per
Equi
pped
Flig
ht (%
)
16
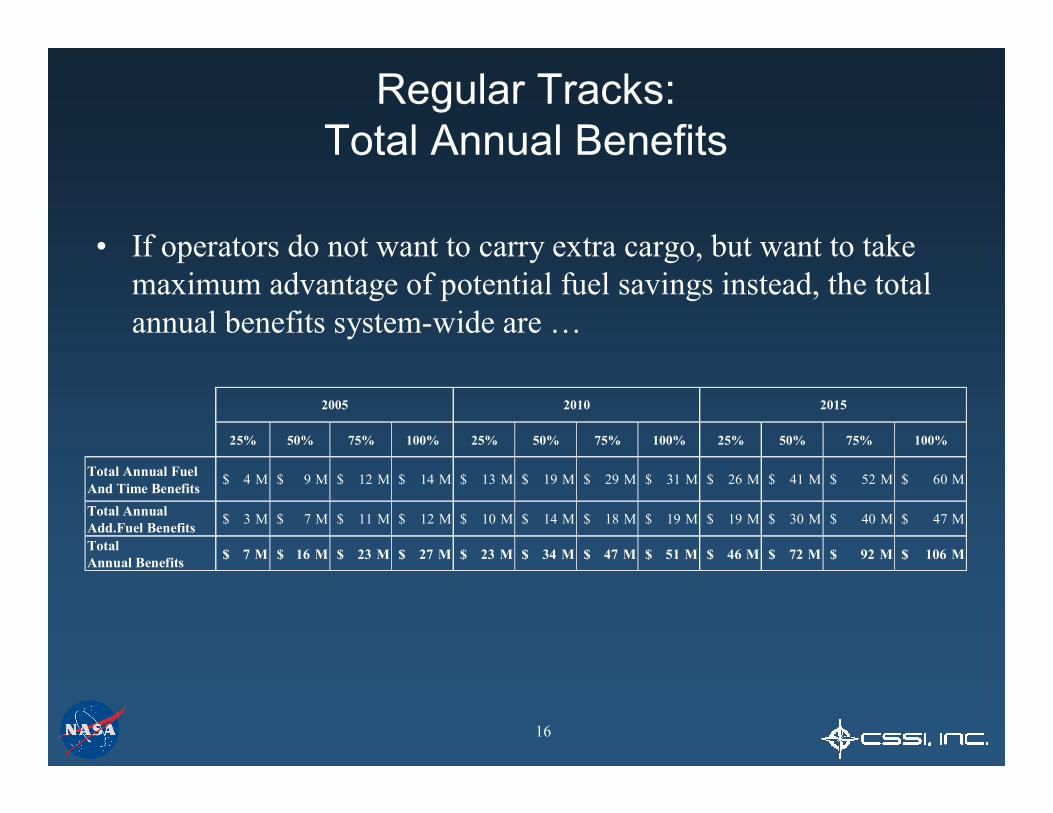
Regular Tracks: Total Annual Benefits
25% 50% 75% 100% 25% 50% 75% 100% 25% 50% 75% 100%
Total Annual Fuel And Time Benefits
4 M$ 9 M$ 12 M$ 14 M$ 13 M$ 19 M$ 29 M$ 31 M$ 26 M$ 41 M$ 52 M$ 60 M$
Total Annual Add.Fuel Benefits 3 M$ 7 M$ 11 M$ 12 M$ 10 M$ 14 M$ 18 M$ 19 M$ 19 M$ 30 M$ 40 M$ 47 M$
Total Annual Benefits 7 M$ 16 M$ 23 M$ 27 M$ 23 M$ 34 M$ 47 M$ 51 M$ 46 M$ 72 M$ 92 M$ 106 M$
2005 2010 2015
• If operators do not want to carry extra cargo, but want to take maximum advantage of potential fuel savings instead, the total annual benefits system-wide are …
17
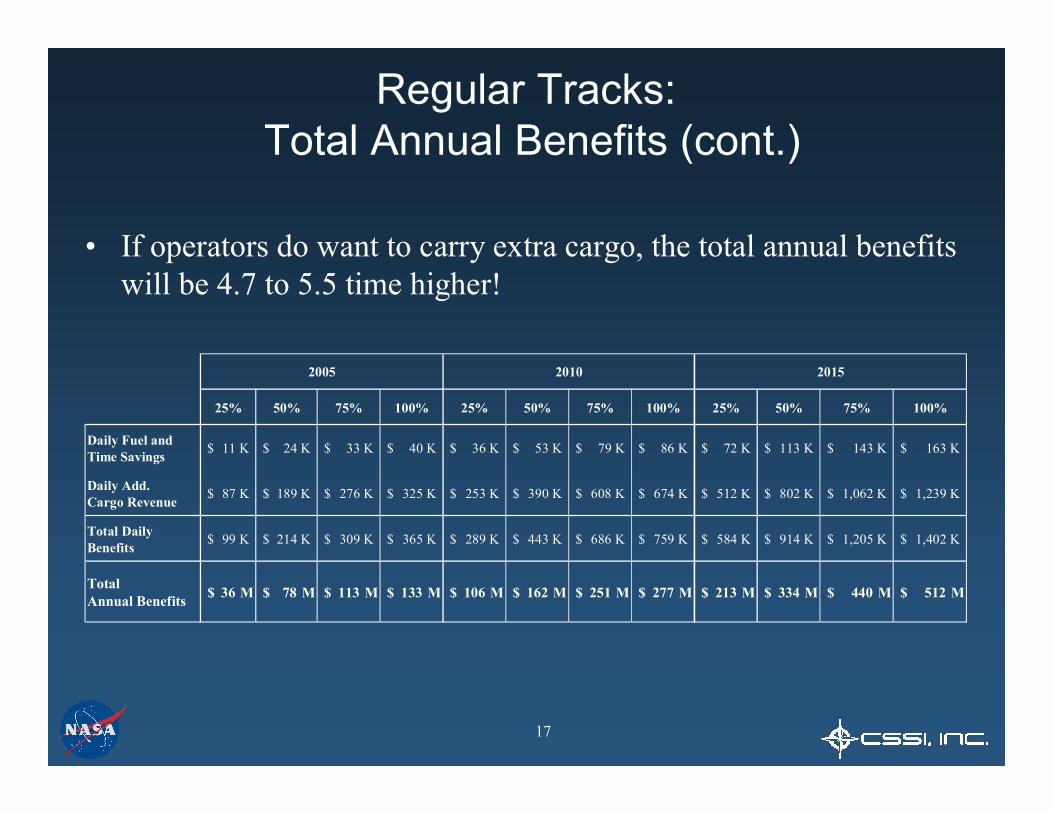
Regular Tracks: Total Annual Benefits (cont.)
25% 50% 75% 100% 25% 50% 75% 100% 25% 50% 75% 100%
Daily Fuel andTime Savings 11 K$ 24 K$ 33 K$ 40 K$ 36 K$ 53 K$ 79 K$ 86 K$ 72 K$ 113 K$ 143 K$ 163 K$
Daily Add.Cargo Revenue 87 K$ 189 K$ 276 K$ 325 K$ 253 K$ 390 K$ 608 K$ 674 K$ 512 K$ 802 K$ 1,062 K$ 1,239 K$
Total DailyBenefits 99 K$ 214 K$ 309 K$ 365 K$ 289 K$ 443 K$ 686 K$ 759 K$ 584 K$ 914 K$ 1,205 K$ 1,402 K$
Total Annual Benefits 36 M$ 78 M$ 113 M$ 133 M$ 106 M$ 162 M$ 251 M$ 277 M$ 213 M$ 334 M$ 440 M$ 512 M$
2010 20152005
• If operators do want to carry extra cargo, the total annual benefits will be 4.7 to 5.5 time higher!

18
Benefits Calculations: Segregated and Additional Segregated Tracks

19
Assumptions
• Segregated Tracks are chosen based on:- Preferences of the equipped flights- Equipage level: 25% equipage - one, 50% equipage – two, and
75% equipage three segregated tracks• Potential candidates for segregated tracks do not include
outside tracks • Additional tracks can be established only between two
adjacent segregated tracks
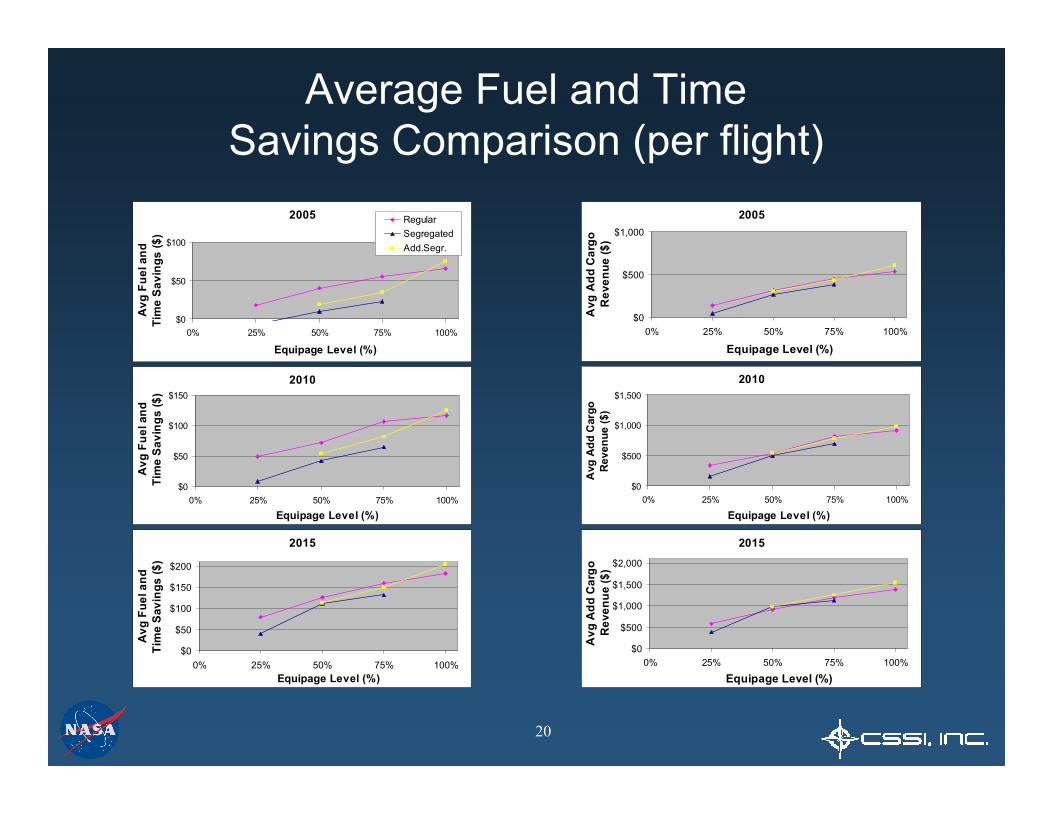
20
Average Fuel and TimeSavings Comparison (per flight)
2015
$0
$50
$100
$150
$200
0% 25% 50% 75% 100%Equipage Level (%)
Avg
Fue
l and
Tim
e S
avin
gs ($
)
2010
$0
$50
$100
$150
0% 25% 50% 75% 100%
Equipage Level (%)
Avg
Fue
l and
Tim
e S
avin
gs ($
)
2005
$0
$50
$100
0% 25% 50% 75% 100%
Equipage Level (%)
Avg
Fue
l and
Tim
e S
avin
gs ($
)
RegularSegregatedAdd.Segr.
2015
$0
$500
$1,000
$1,500
$2,000
0% 25% 50% 75% 100%
Equipage Level (%)
Avg
Add
Car
goR
even
ue ($
)
2010
$0
$500
$1,000
$1,500
0% 25% 50% 75% 100%
Equipage Level (%)
Avg
Add
Car
go
Rev
enue
($)
2005
$0
$500
$1,000
0% 25% 50% 75% 100%
Equipage Level (%)
Avg
Add
Car
go
Rev
enue
($)
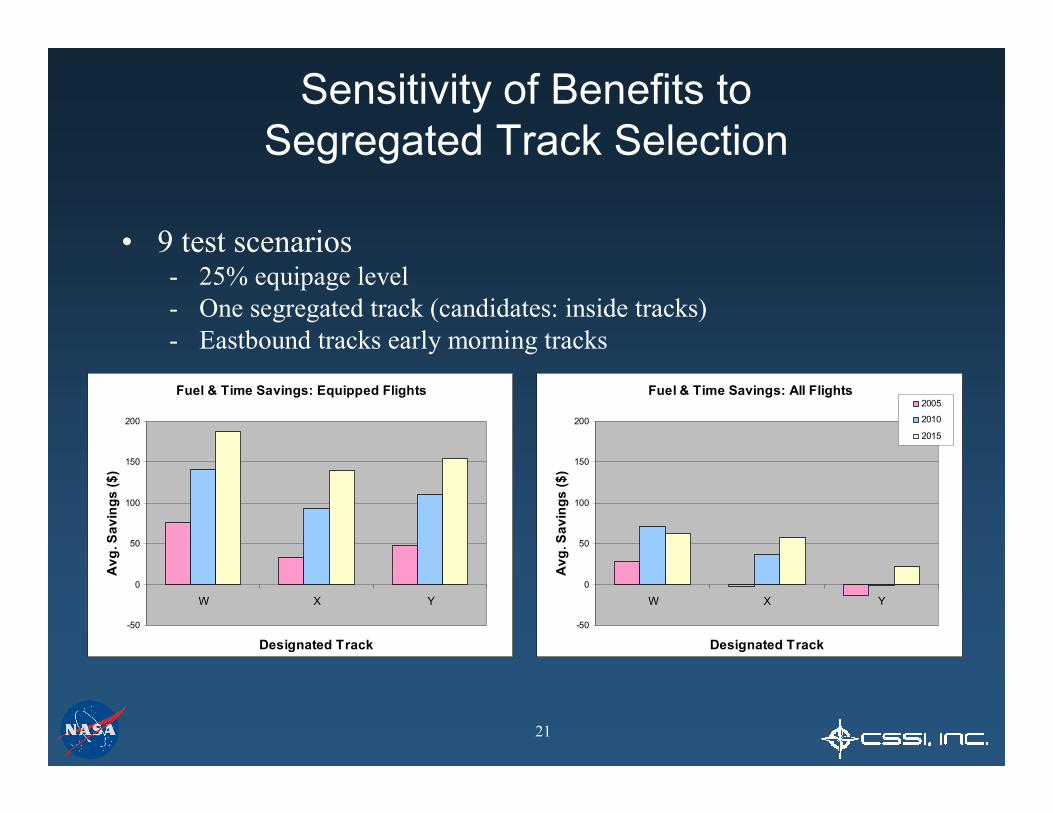
21
Sensitivity of Benefits to Segregated Track Selection
Fuel & Time Savings: Equipped Flights
-50
0
50
100
150
200
W X Y
Designated Track
Avg
. Sav
ings
($)
Fuel & Time Savings: All Flights
-50
0
50
100
150
200
W X Y
Designated Track
Avg
. Sav
ings
($)
2005
2010
2015
• 9 test scenarios- 25% equipage level- One segregated track (candidates: inside tracks)- Eastbound tracks early morning tracks

22
Conclusions

23
25% 50% 75% 100% 25% 50% 75% 100% 25% 50% 75% 100%
Regular Tracks 36 M$ 78 M$ 113 M$ 133 M$ 106 M$ 162 M$ 251 M$ 277 M$ 213 M$ 334 M$ 440 M$ 512 M$
Segregated Tracks 8 M$ 62 M$ 91 M$ 45 M$ 146 M$ 205 M$ 139 M$ 353 M$ 413 M$
Additional Segregated Tracks 71 M$ 105 M$ 151 M$ 160 M$ 233 M$ 300 M$ 354 M$ 459 M$ 569 M$
2005 2010 2015
Conclusions
• Yes, both equipped and non-equipped flights will benefit
• Equipped flights are 2-5 times more likely to experience savings than non-equipped flights, and on average save 1.5-4.6 times more
• The sooner an air carrier equips its fleet, the better off it will be (provided that sufficient overall equipage is reached)
• Designating certain tracks for exclusive use by equipped flights is controversial and will require careful examination

24
Additional Slides
25
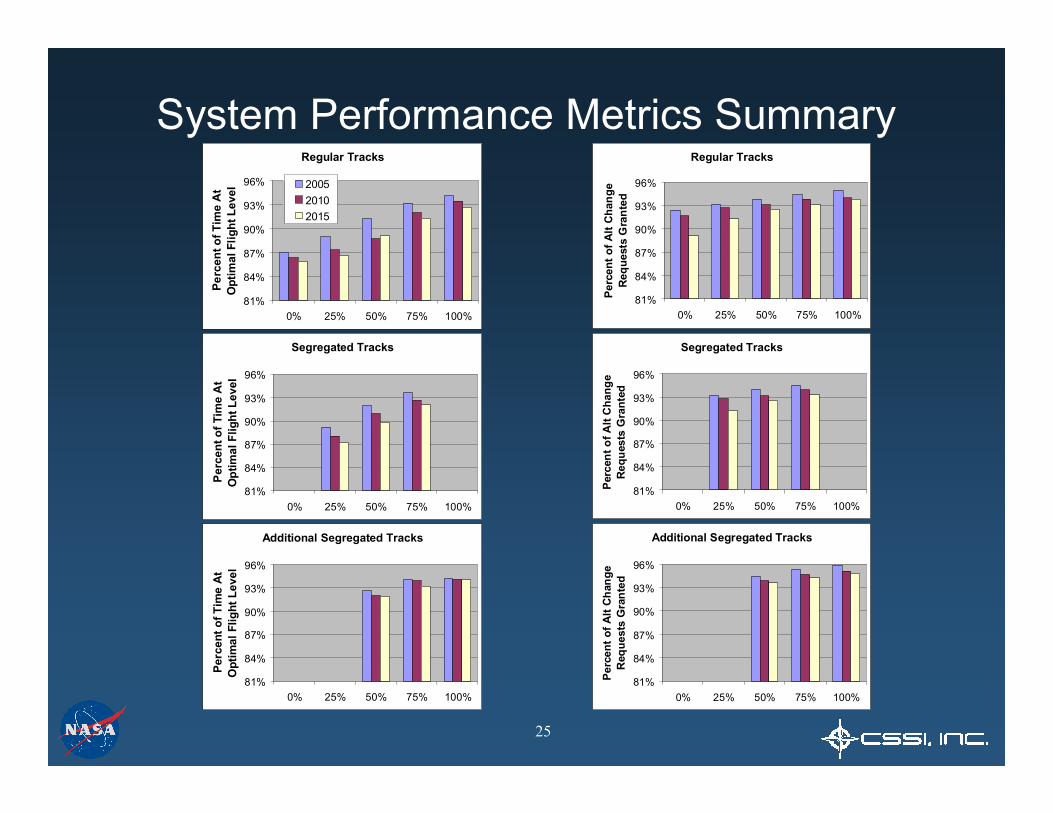
System Performance Metrics SummaryRegular Tracks
81%
84%
87%
90%
93%
96%
0% 25% 50% 75% 100%
Perc
ent o
f Alt
Cha
nge
Req
uest
s G
rant
ed
Segregated Tracks
81%
84%
87%
90%
93%
96%
0% 25% 50% 75% 100%
Perc
ent o
f Alt
Cha
nge
Req
uest
s G
rant
ed
Additional Segregated Tracks
81%
84%
87%
90%
93%
96%
0% 25% 50% 75% 100%
Perc
ent o
f Alt
Cha
nge
Req
uest
s G
rant
ed
Regular Tracks
81%
84%
87%
90%
93%
96%
0% 25% 50% 75% 100%
Perc
ent o
f Tim
e A
tO
ptim
al F
light
Lev
el
200520102015
Segregated Tracks
81%
84%
87%
90%
93%
96%
0% 25% 50% 75% 100%
Per
cent
of T
ime
At
Opt
imal
Flig
ht L
evel
Additional Segregated Tracks
81%
84%
87%
90%
93%
96%
0% 25% 50% 75% 100%
Perc
ent o
f Tim
e A
tO
ptim
al F
light
Lev
el

26
NAT OTS Baseline Traffic DataAB
ZYXWV
FEDC
GANDER OCEANIC FIR SHANWICK OCA
SONDRESTROM FIR REYKJAVIK FIR
SANTA MARIA OCANEW YORK (MNPS)
0%
5%
10%
15%
20%
25%
30%
V W X Y Z A B C D E F
Eastbound tracks[1:00-8:00 GMT]
Westbound tracks[11:30-19:00 GMT]
ADS: 27%
Datalink: 34%
RNP: 99%
Scheduled: 88%
Non-sch.: 6%
Military: 2%
GA: 2%
Cargo:1%
27
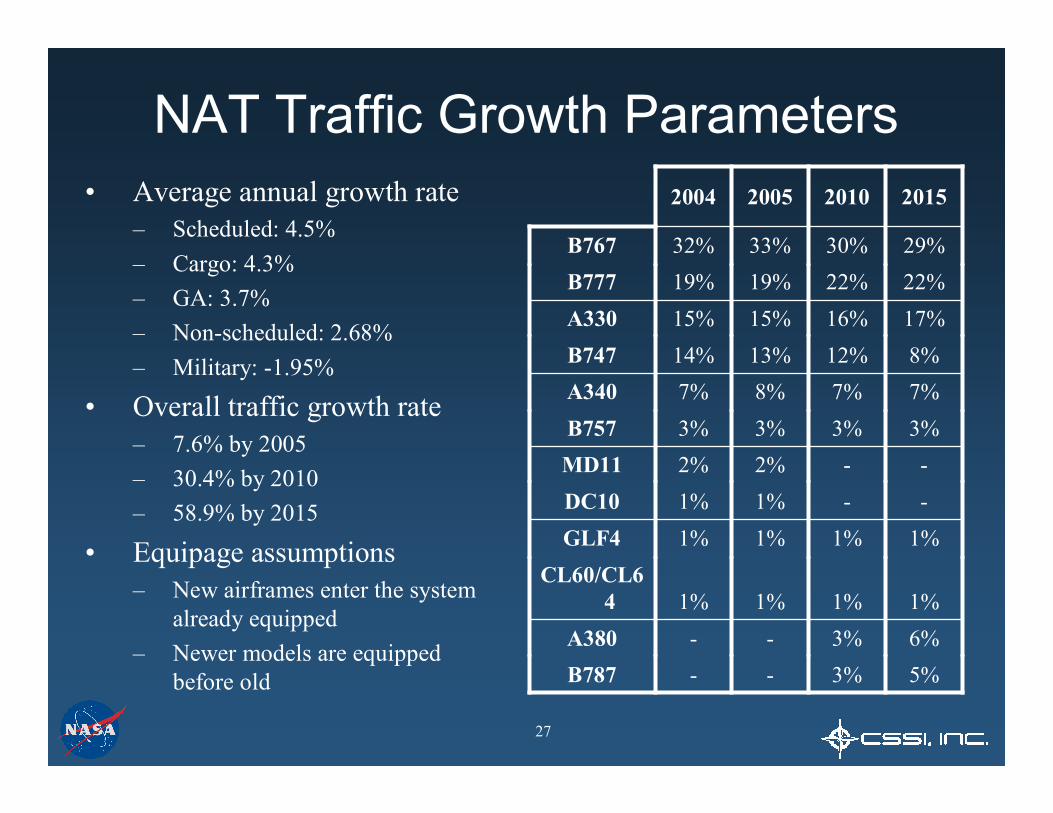
NAT Traffic Growth Parameters• Average annual growth rate
– Scheduled: 4.5%– Cargo: 4.3%– GA: 3.7%– Non-scheduled: 2.68%– Military: -1.95%
• Overall traffic growth rate– 7.6% by 2005– 30.4% by 2010 – 58.9% by 2015
• Equipage assumptions– New airframes enter the system
already equipped– Newer models are equipped
before old 5%3%--B7876%3%--A3801%1%1%1%
CL60/CL64
1%1%1%1%GLF4--1%1%DC10--2%2%MD11
3%3%3%3%B7577%7%8%7%A3408%12%13%14%B747
17%16%15%15%A33022%22%19%19%B77729%30%33%32%B767
2015201020052004
28
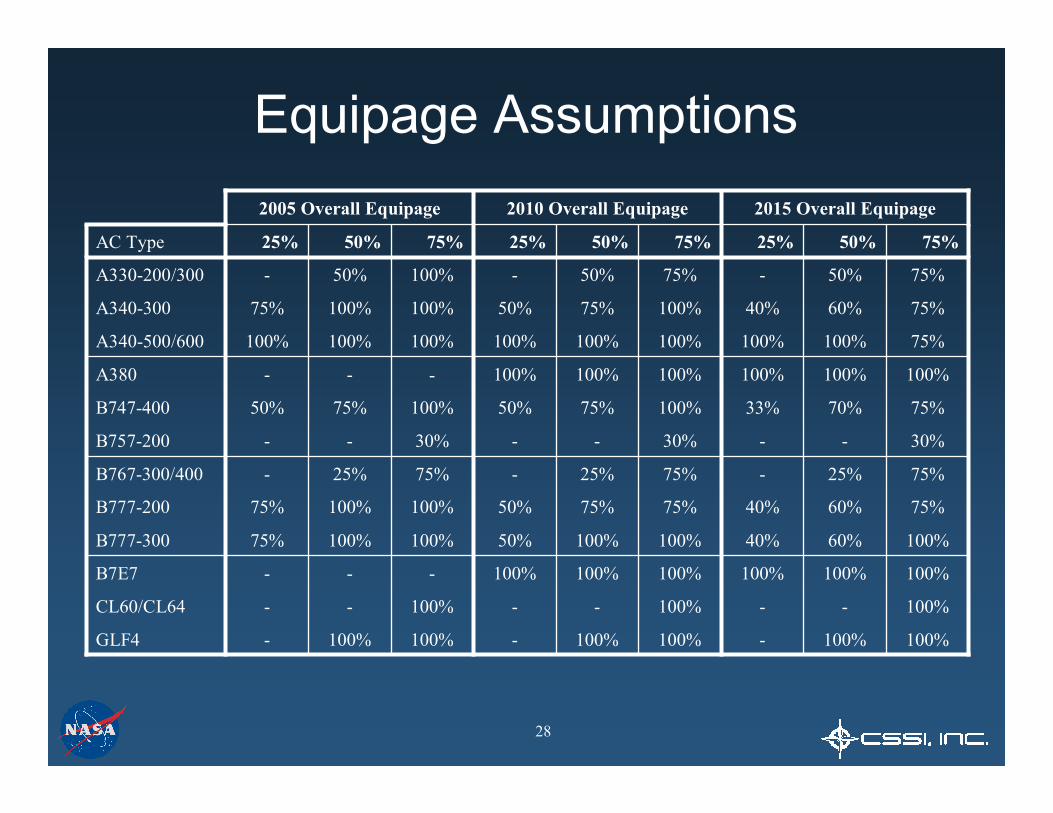
Equipage Assumptions
100%100%-100%100%-100%100%-GLF4
100%--100%--100%--CL60/CL64
100%100%100%100%100%100%---B7E7
100%60%40%100%100%50%100%100%75%B777-300
75%60%40%75%75%50%100%100%75%B777-200
75%25%-75%25%-75%25%-B767-300/400
30%--30%--30%--B757-200
75%70%33%100%75%50%100%75%50%B747-400
100%100%100%100%100%100%---A380
75%100%100%100%100%100%100%100%100%A340-500/600
75%60%40%100%75%50%100%100%75%A340-300
75%50%-75%50%-100%50%-A330-200/300
75%50%25%75%50%25%75%50%25%AC Type
2015 Overall Equipage2010 Overall Equipage2005 Overall Equipage
Top Related