


Languages
Pages
Legal


FTIR Spektroskopie an dynamischen Systemen
New Definition ofProcess Gas
Chromatography
FTIR Spektroskopie an dynamischen Systemen –Beispiele aus Protein- und
Lebensmittelanalytik
Bernhard Lendl
Institut für Chemische Technologien und Analytik, TU Wien, Österreich
FTIR Spektroskopie an dynamischen Systemen
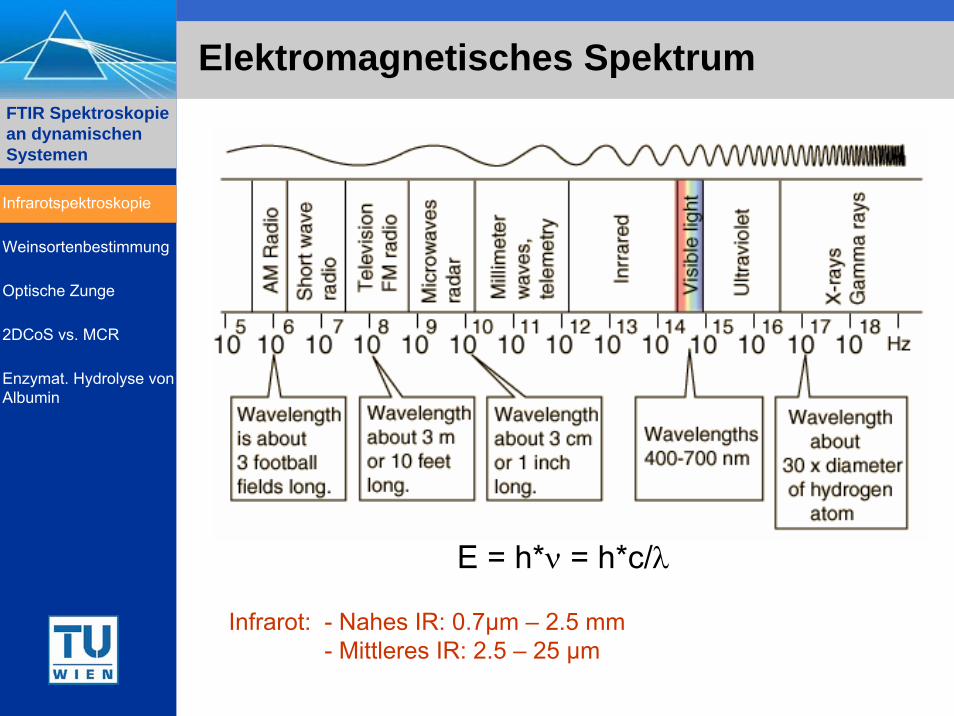
Elektromagnetisches Spektrum
E = h*ν = h*c/λ
Infrarot: - Nahes IR: 0.7µm – 2.5 mm- Mittleres IR: 2.5 – 25 µm
Infrarotspektroskopie
Weinsortenbestimmung
Optische Zunge
2DCoS vs. MCR
Enzymat. Hydrolyse von Albumin
FTIR Spektroskopie an dynamischen Systemen
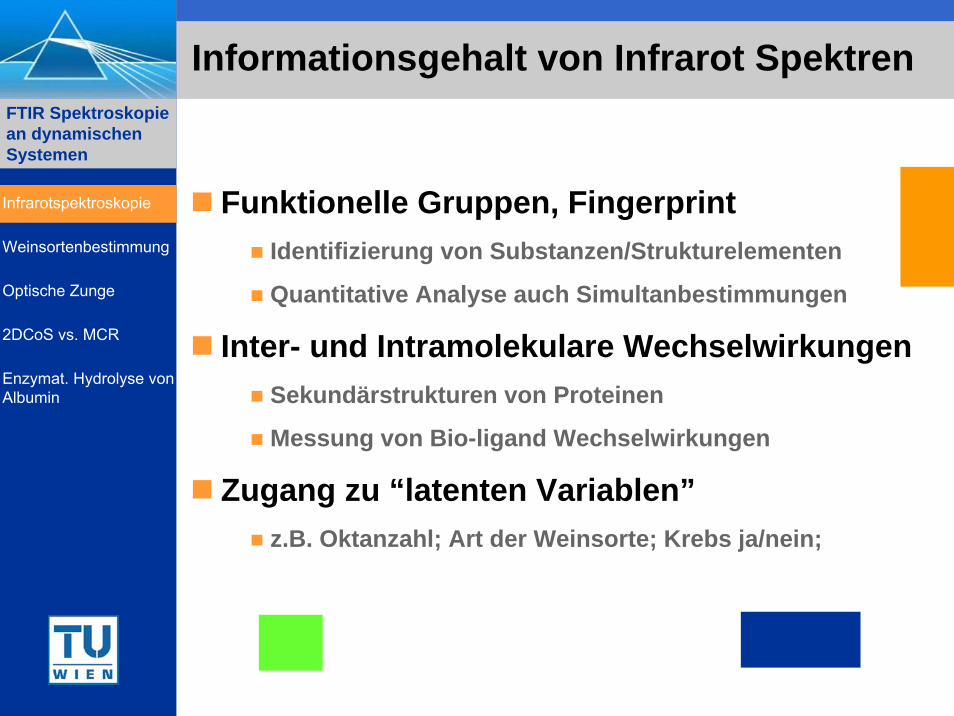
Informationsgehalt von Infrarot Spektren
Funktionelle Gruppen, FingerprintIdentifizierung von Substanzen/Strukturelementen
Quantitative Analyse auch Simultanbestimmungen
Inter- und Intramolekulare WechselwirkungenSekundärstrukturen von Proteinen
Messung von Bio-ligand Wechselwirkungen
Zugang zu “latenten Variablen”z.B. Oktanzahl; Art der Weinsorte; Krebs ja/nein;
Infrarotspektroskopie
Weinsortenbestimmung
Optische Zunge
2DCoS vs. MCR
Enzymat. Hydrolyse von Albumin
FTIR Spektroskopie an dynamischen Systemen
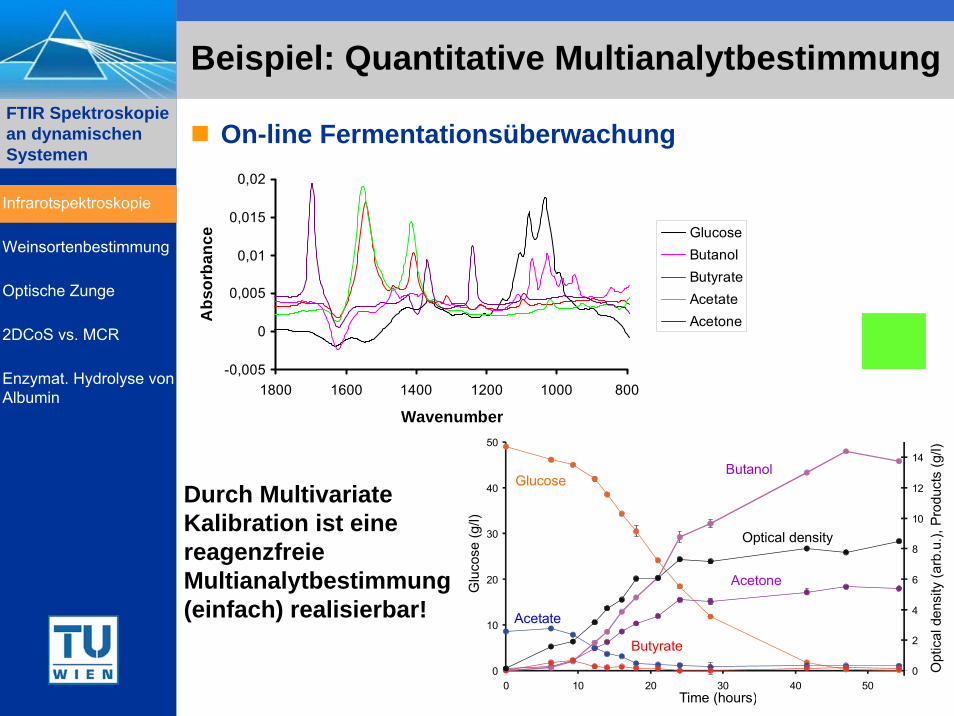
Beispiel: Quantitative Multianalytbestimmung
-0,005
0
0,005
0,01
0,015
0,02
80010001200140016001800
Wavenumber
Abs
orba
nce Glucose
ButanolButyrateAcetateAcetone
0
10
20
30
40
50
0 10 20 30 40 500
2
4
6
8
10
12
14
Glu
cose
(g/l)
Time (hours)
Opt
ical
den
sity
(arb
.u.),
Pro
duct
s (g
/l)
GlucoseButanol
Optical density
Acetone
Butyrate
Acetate
On-line Fermentationsüberwachung
Durch MultivariateKalibration ist eine reagenzfreie Multianalytbestimmung(einfach) realisierbar!
Infrarotspektroskopie
Weinsortenbestimmung
Optische Zunge
2DCoS vs. MCR
Enzymat. Hydrolyse von Albumin
FTIR Spektroskopie an dynamischen Systemen
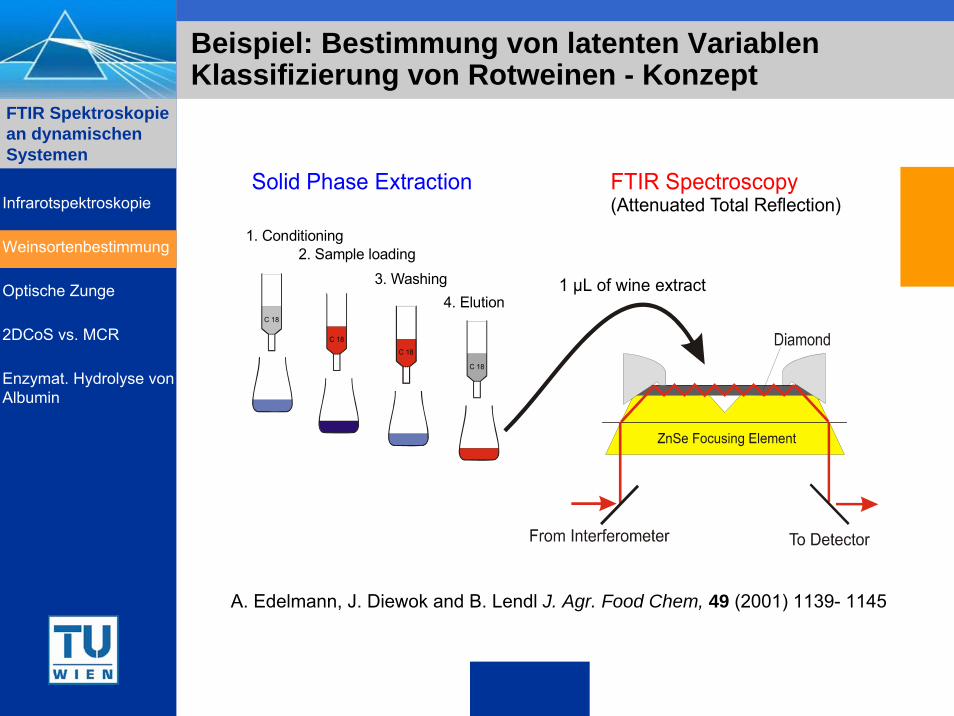
Beispiel: Bestimmung von latenten VariablenKlassifizierung von Rotweinen - Konzept
C 18
C 18
C 18
C 18
1. Conditioning2. Sample loading
3. Washing4. Elution
1 µL of wine extract
Solid Phase Extraction FTIR Spectroscopy(Attenuated Total Reflection)
A. Edelmann, J. Diewok and B. Lendl J. Agr. Food Chem, 49 (2001) 1139- 1145
Infrarotspektroskopie
Weinsortenbestimmung
Optische Zunge
2DCoS vs. MCR
Enzymat. Hydrolyse von Albumin
FTIR Spektroskopie an dynamischen Systemen
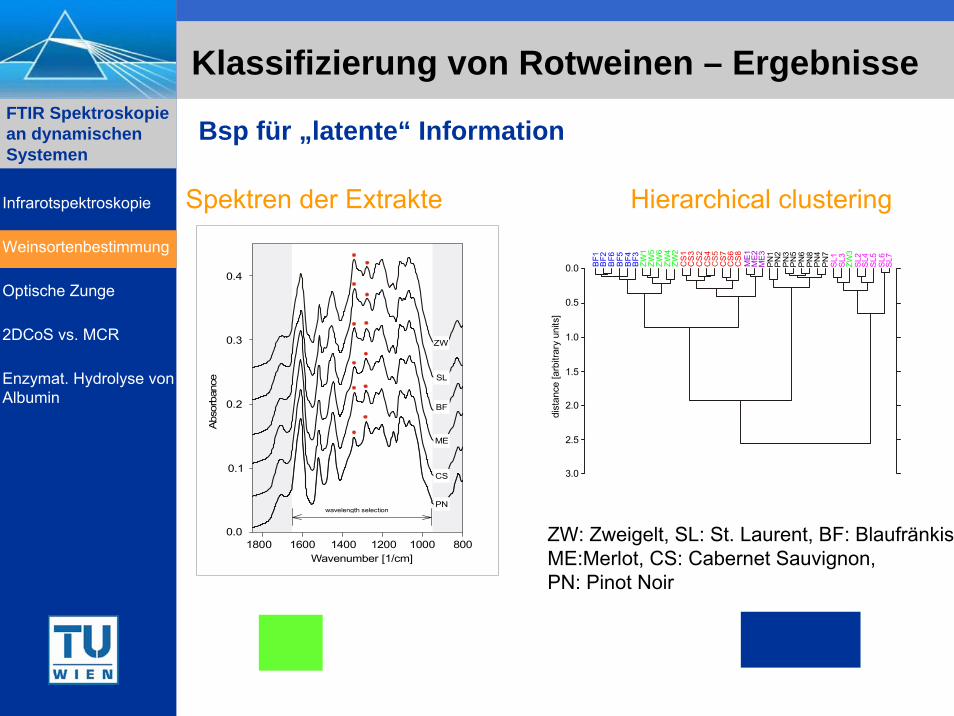
Klassifizierung von Rotweinen – Ergebnisse
Hierarchical clustering
0.5
0.0
1.0
1.5
2.0
2.5
3.0
BF1
BF2
BF6
BF5
BF4
BF3
CS
1C
S3
CS
2C
S4
CS
7C
S6
CS
8M
E1M
E2M
E3
PN
1P
N2
PN
3P
N5
PN
6P
N8
PN
4P
N7
SL1
SL3ZW
1ZW
5ZW
6ZW
4ZW
2
ZW3
SL2
SL4
SL5
SL6
SL7
dist
ance
[arb
itrar
y un
its]
wavelength selection
ZW
SL
BF
ME
CS
PN
Wavenumber [1/cm]1800
0.0
0.1
0.2
0.3
0.4
14001600 1200 1000 800
Abso
rban
ceSpektren der Extrakte
ZW: Zweigelt, SL: St. Laurent, BF: BlaufränkiscME:Merlot, CS: Cabernet Sauvignon,PN: Pinot Noir
Bsp für „latente“ Information
Infrarotspektroskopie
Weinsortenbestimmung
Optische Zunge
2DCoS vs. MCR
Enzymat. Hydrolyse von Albumin
FTIR Spektroskopie an dynamischen Systemen
Die „Optische Zunge“
Idee: Entwicklung eines „objetiven“Geschmacksensors zur Unterstützung
sensorischer Analysen
Adstringenz die Fähigkeit eines Weines, ein rauhes, pelzigesMundgefühl zu verursachen
Infrarotspektroskopie
Weinsortenbestimmung
Optische Zunge
2DCoS vs. MCR
Enzymat. Hydrolyse von Albumin
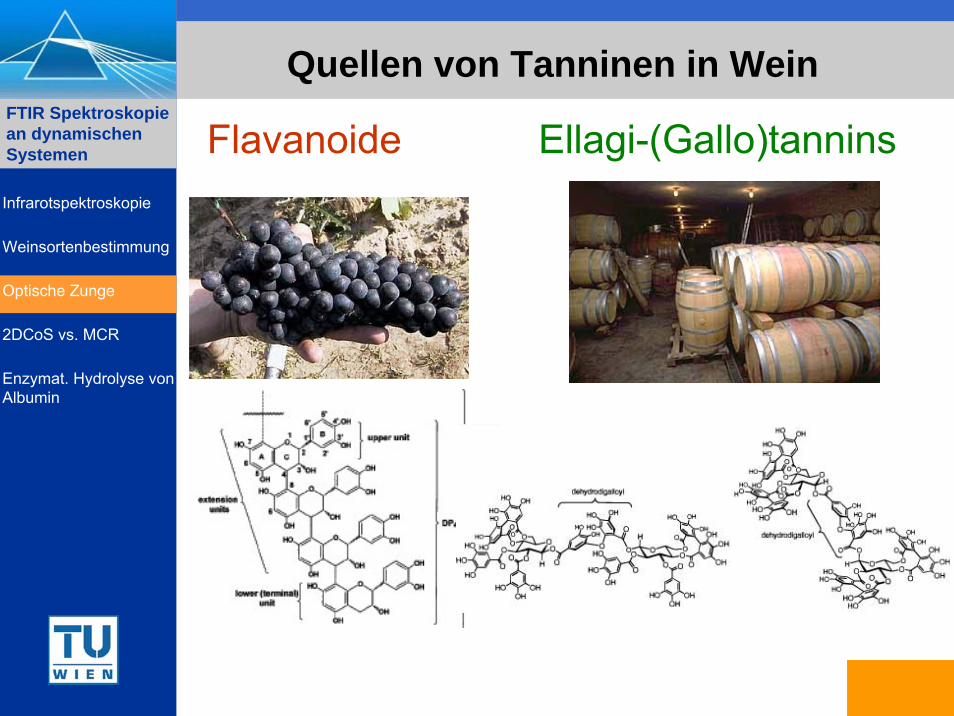
FTIR Spektroskopie an dynamischen Systemen Flavanoide Ellagi-(Gallo)tannins
Quellen von Tanninen in Wein
Infrarotspektroskopie
Weinsortenbestimmung
Optische Zunge
2DCoS vs. MCR
Enzymat. Hydrolyse von Albumin
FTIR Spektroskopie an dynamischen Systemen
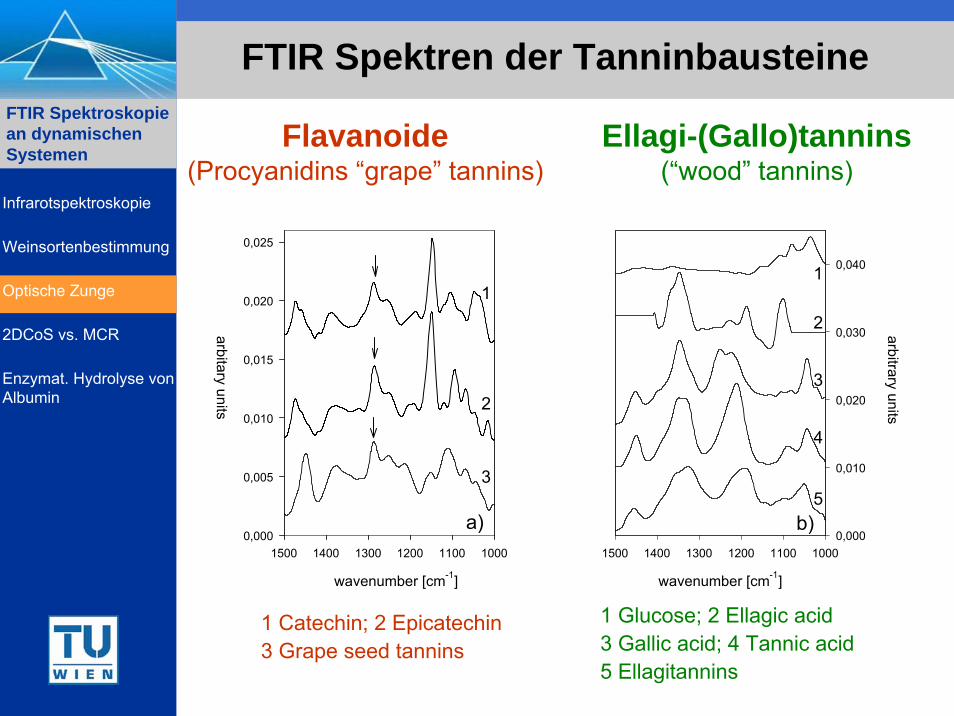
Flavanoide(Procyanidins “grape” tannins)
Ellagi-(Gallo)tannins(“wood” tannins)
1 Glucose; 2 Ellagic acid 3 Gallic acid; 4 Tannic acid5 Ellagitannins
1 Catechin; 2 Epicatechin3 Grape seed tannins
FTIR Spektren der Tanninbausteine
wavenumber [cm-1]
100011001200130014001500
arbitaryunits
0,000
0,005
0,010
0,015
0,020
0,025
1
2
3
a)
wavenumber [cm-1]
100011001200130014001500
arbitraryunits
0,000
0,010
0,020
0,030
0,040
4
b)
1
2
3
5
Infrarotspektroskopie
Weinsortenbestimmung
Optische Zunge
2DCoS vs. MCR
Enzymat. Hydrolyse von Albumin
FTIR Spektroskopie an dynamischen Systemen
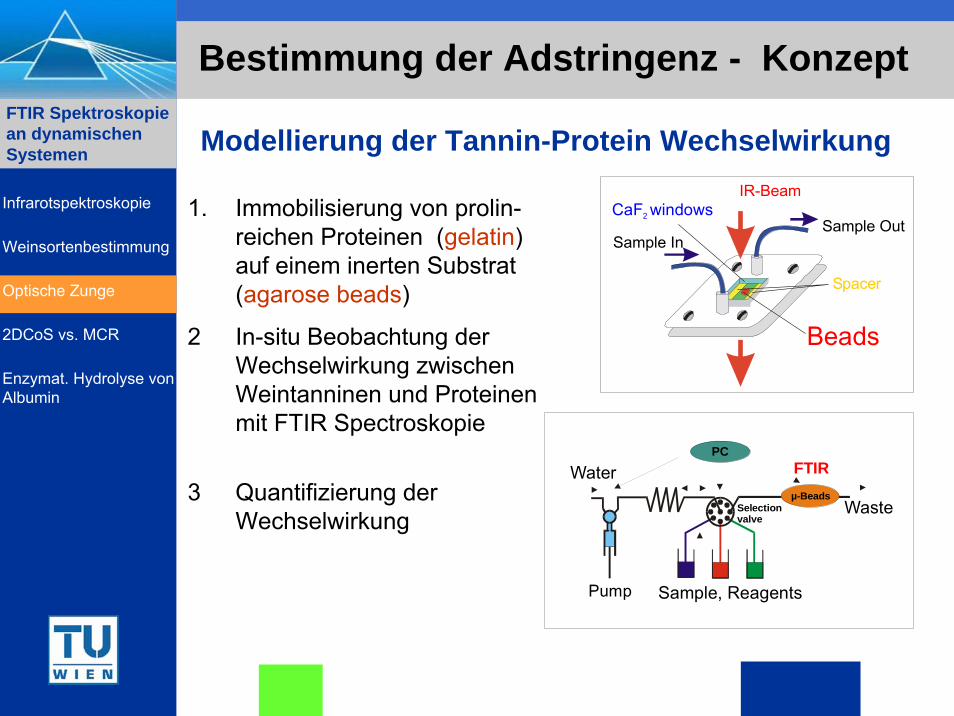
Bestimmung der Adstringenz - Konzept
1. Immobilisierung von prolin-reichen Proteinen (gelatin) auf einem inerten Substrat(agarose beads)
Modellierung der Tannin-Protein Wechselwirkung
Pump
Selection valve
µ-Beads
FTIR
Waste
WaterPC
Sample, Reagents
Spacer
CaF windows2
Sample InSample Out
Beads
IR-Beam
2 In-situ Beobachtung derWechselwirkung zwischenWeintanninen und Proteinenmit FTIR Spectroskopie
3 Quantifizierung derWechselwirkung
Infrarotspektroskopie
Weinsortenbestimmung
Optische Zunge
2DCoS vs. MCR
Enzymat. Hydrolyse von Albumin
FTIR Spektroskopie an dynamischen Systemen
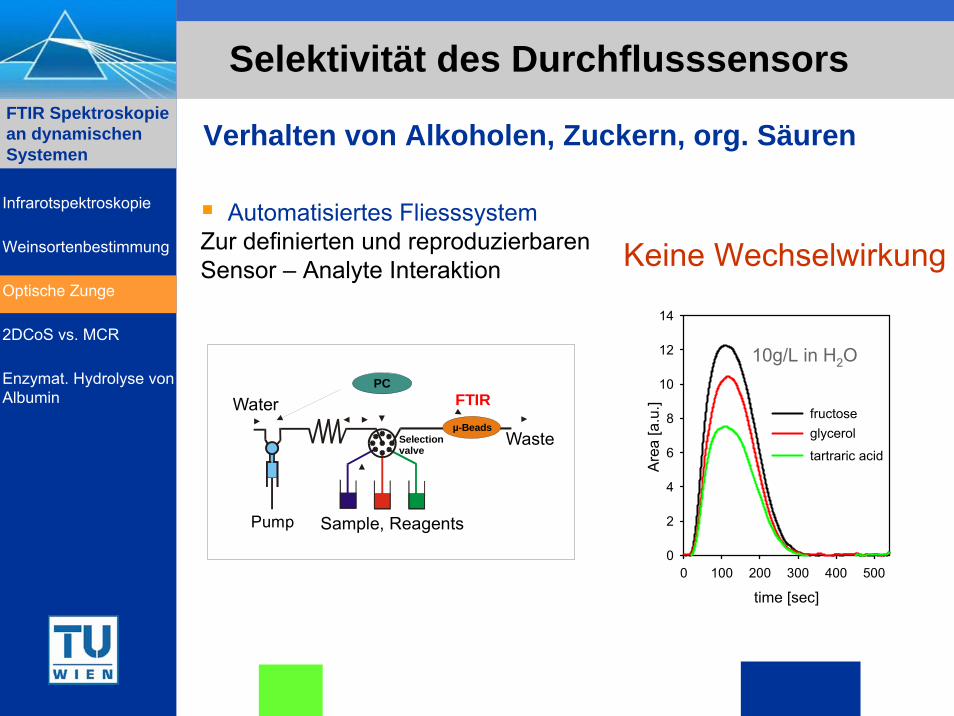
Selektivität des Durchflusssensors
time [sec]0 100 200 300 400 500
Are
a [a
.u.]
0
2
4
6
8
10
12
14
fructose glycerol
tartraric acid
Keine Wechselwirkung
Pump
Selection valve
µ-Beads
FTIR
Waste
WaterPC
Sample, Reagents
Automatisiertes FliesssystemZur definierten und reproduzierbaren Sensor – Analyte Interaktion
Verhalten von Alkoholen, Zuckern, org. Säuren
Infrarotspektroskopie
Weinsortenbestimmung
Optische Zunge
2DCoS vs. MCR
Enzymat. Hydrolyse von Albumin
10g/L in H2O
FTIR Spektroskopie an dynamischen Systemen
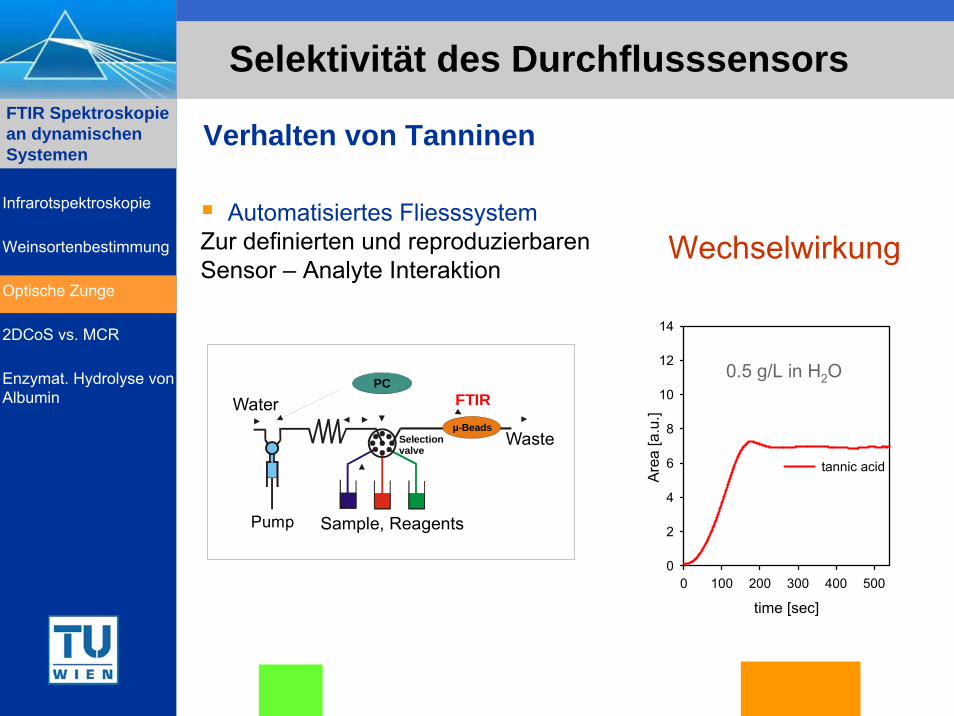
Selektivität des Durchflusssensors
Pump
Selection valve
µ-Beads
FTIR
Waste
WaterPC
Sample, Reagents
Automatisiertes FliesssystemZur definierten und reproduzierbaren Sensor – Analyte Interaktion
Wechselwirkung
Verhalten von Tanninen
time [sec]0 100 200 300 400 500
Are
a [a
.u.]
0
2
4
6
8
10
12
14
tannic acid
0.5 g/L in H2O
Infrarotspektroskopie
Weinsortenbestimmung
Optische Zunge
2DCoS vs. MCR
Enzymat. Hydrolyse von Albumin
FTIR Spektroskopie an dynamischen Systemen
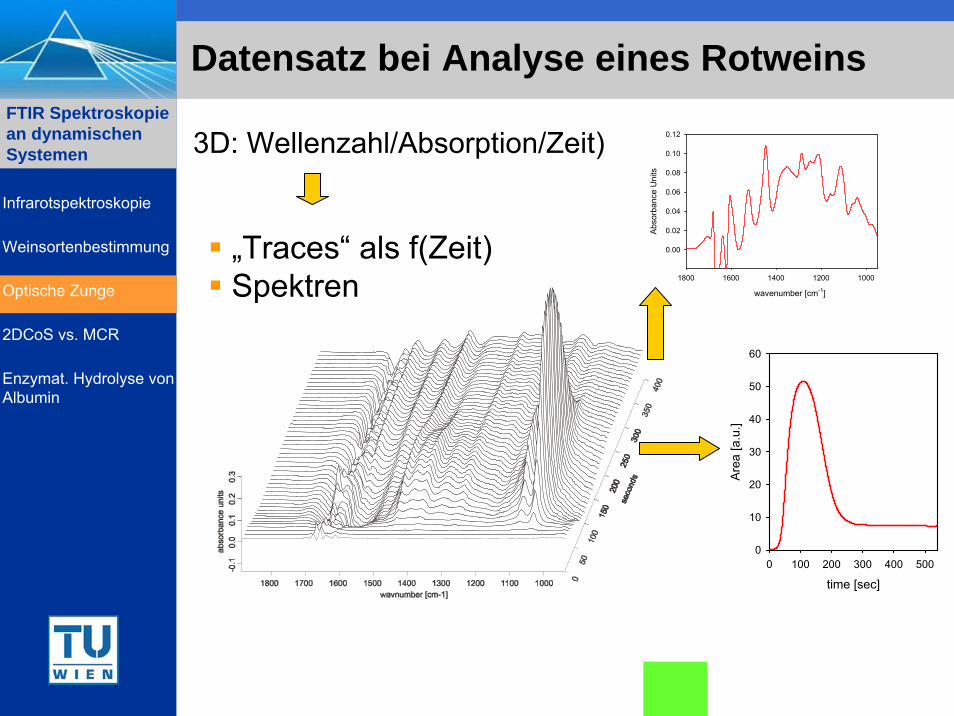
Datensatz bei Analyse eines Rotweins
3D: Wellenzahl/Absorption/Zeit)
wavenumber [cm-1]
10001200140016001800
Abso
rban
ce U
nits
0.00
0.02
0.04
0.06
0.08
0.10
0.12
„Traces“ als f(Zeit)Spektren
time [sec]0 100 200 300 400 500
Are
a [a
.u.]
0
10
20
30
40
50
60
Infrarotspektroskopie
Weinsortenbestimmung
Optische Zunge
2DCoS vs. MCR
Enzymat. Hydrolyse von Albumin
FTIR Spektroskopie an dynamischen Systemen
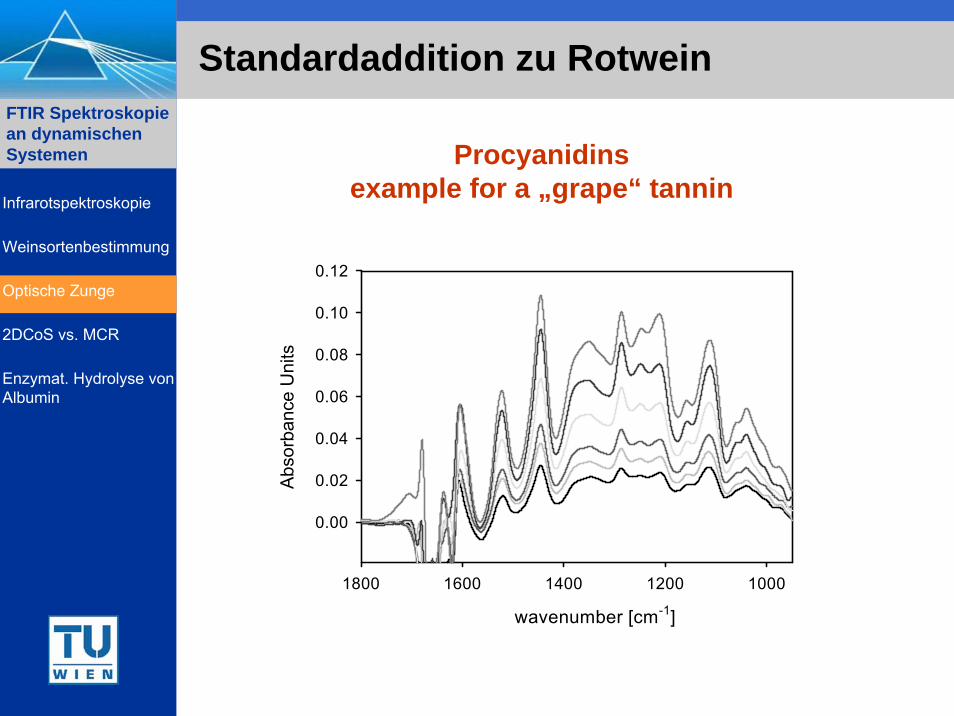
Standardaddition zu Rotwein
wavenumber [cm-1]
10001200140016001800
Abso
rban
ce U
nits
0.00
0.02
0.04
0.06
0.08
0.10
0.12
Procyanidinsexample for a „grape“ tanninInfrarotspektroskopie
Weinsortenbestimmung
Optische Zunge
2DCoS vs. MCR
Enzymat. Hydrolyse von Albumin
FTIR Spektroskopie an dynamischen Systemen
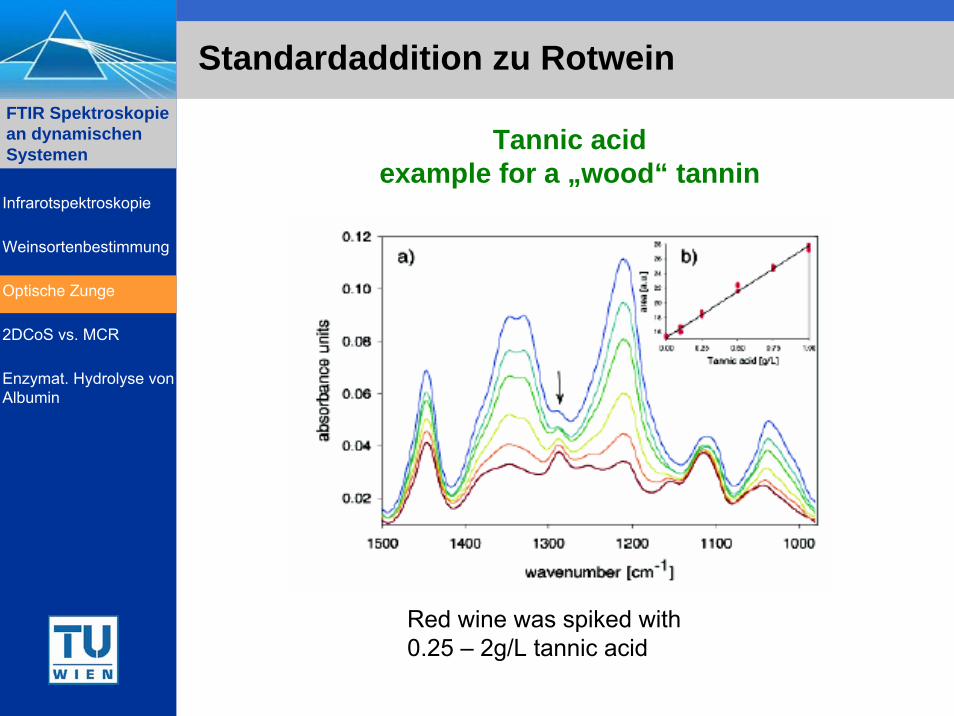
Red wine was spiked with0.25 – 2g/L tannic acid
Tannic acidexample for a „wood“ tannin
Infrarotspektroskopie
Weinsortenbestimmung
Optische Zunge
2DCoS vs. MCR
Enzymat. Hydrolyse von Albumin
Standardaddition zu Rotwein

FTIR Spektroskopie an dynamischen Systemen
Messung unterschiedlicher Rotweine
A) Cabernet Sauvignon(1 month in new oak),
B) Merlot table wine (2 years)C) Zweigelt during fementationD) Zweigelt
(9 month aged in new oak andtannin treatment)
E) grape seed tannin 0.5 g/Lin 10% ethanolic solution
F) Blauer Portugieser(9 month, tannin treatment,already bottled).
JACS, (2002) 124, 14741-14747
Infrarotspektroskopie
Weinsortenbestimmung
Optische Zunge
2DCoS vs. MCR
Enzymat. Hydrolyse von Albumin
FTIR Spektroskopie an dynamischen Systemen
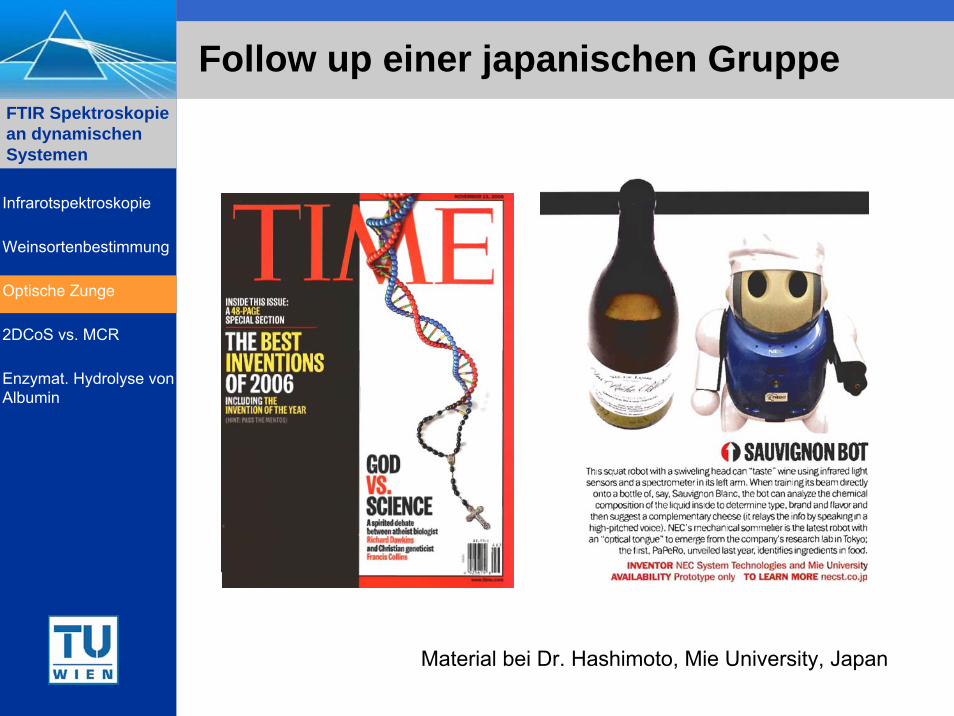
Follow up einer japanischen Gruppe
Infrarotspektroskopie
Weinsortenbestimmung
Optische Zunge
2DCoS vs. MCR
Enzymat. Hydrolyse von Albumin
Material bei Dr. Hashimoto, Mie University, Japan

FTIR Spektroskopie an dynamischen Systemen
Enzymatischen Hydrolyse von BSA mitProteinase K
Sekundärstruktur: 67% α-Helix,10% β-Turn23% Extended chain,kein β-sheet
Erwärmung von BSA:Bis 50°C reversible KonformationsänderungenEntfalten der α-Helix irreversibel von 52 - 60°CWeitere Temperaturerhöhung:Beginn einer β-AggregationAb 70°C Gelbildung
Proteinase KFamilie der Subtilisin ProteinasenKeine besonderen Selektivität für best. ASHohe Aktivität bei 50 – 60°C
Die enzymatische Reaktion erfordert eineerhöhte Temperatur
Infrarotspektroskopie
Weinsortenbestimmung
Optische Zunge
2DCoS vs. MCR
Enzymat. Hydrolyse von Albumin
FTIR Spektroskopie an dynamischen Systemen
Experimentelle Bedingungen – Daten
15201540156015801600162016401660168017000
0.05
0.1
0.15
0.2
0.25
0.3
0.35
0.4
Wavenumber (cm-1)
Abs
orba
nce
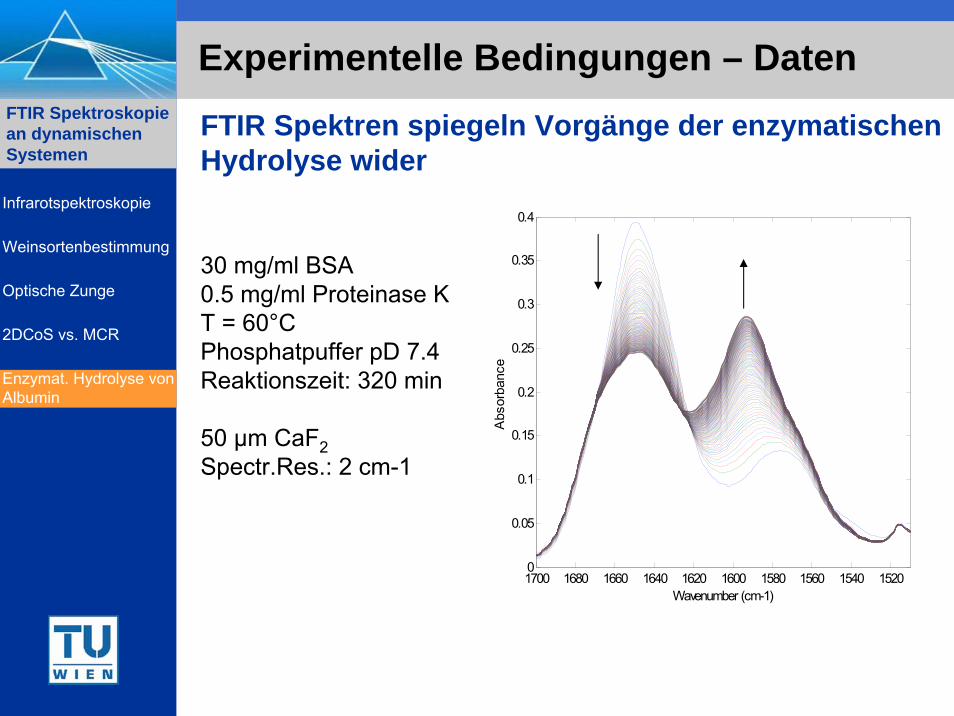
30 mg/ml BSA0.5 mg/ml Proteinase KT = 60°CPhosphatpuffer pD 7.4Reaktionszeit: 320 min
50 µm CaF2Spectr.Res.: 2 cm-1
FTIR Spektren spiegeln Vorgänge der enzymatischenHydrolyse wider
Infrarotspektroskopie
Weinsortenbestimmung
Optische Zunge
2DCoS vs. MCR
Enzymat. Hydrolyse von Albumin
FTIR Spektroskopie an dynamischen Systemen
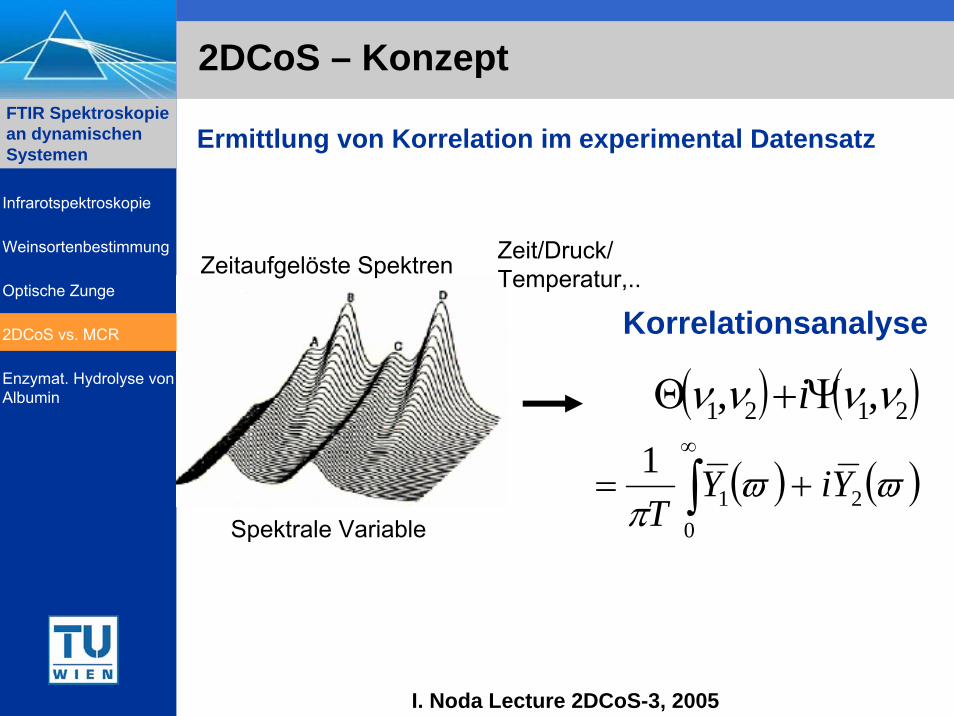
2DCoS – Konzept
( ) ( )2121 ,, νννν Ψ+Θ i
( ) ( )ϖϖπ 2
01
1 YiYT
+= ∫∞
Zeitaufgelöste Spektren Zeit/Druck/Temperatur,..
Korrelationsanalyse
Spektrale Variable
I. Noda Lecture 2DCoS-3, 2005
Ermittlung von Korrelation im experimental Datensatz
Infrarotspektroskopie
Weinsortenbestimmung
Optische Zunge
2DCoS vs. MCR
Enzymat. Hydrolyse von Albumin
FTIR Spektroskopie an dynamischen Systemen
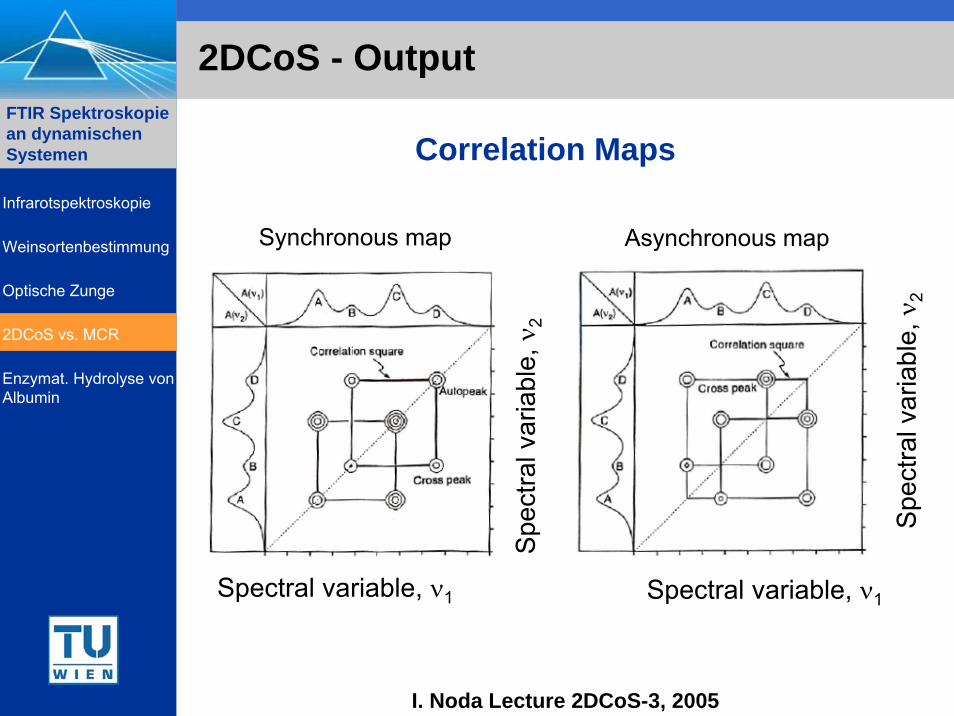
2DCoS - Output
I. Noda Lecture 2DCoS-3, 2005
Correlation Maps
Spectral variable, ν1
Spe
ctra
lvar
iabl
e, ν
2
Spectral variable, ν1
Spe
ctra
lvar
iabl
e, ν
2
Synchronous map Asynchronous mapInfrarotspektroskopie
Weinsortenbestimmung
Optische Zunge
2DCoS vs. MCR
Enzymat. Hydrolyse von Albumin
FTIR Spektroskopie an dynamischen Systemen
Multivariate Curve Resolution (MCR-ALS)
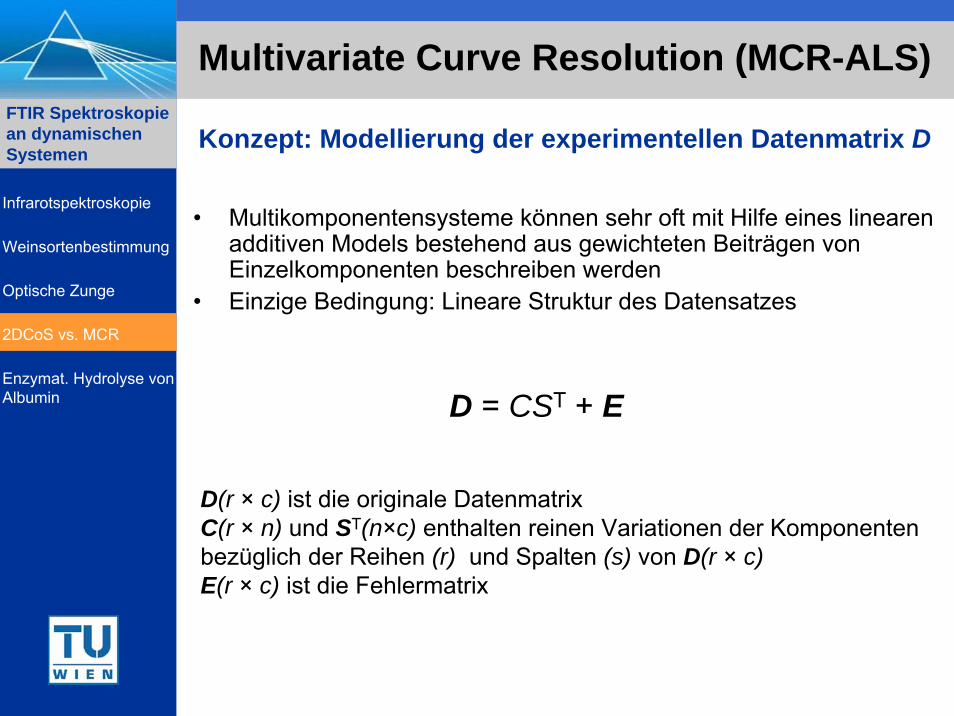
Konzept: Modellierung der experimentellen Datenmatrix D
D = CST + E
• Multikomponentensysteme können sehr oft mit Hilfe eines linearenadditiven Models bestehend aus gewichteten Beiträgen vonEinzelkomponenten beschreiben werden
• Einzige Bedingung: Lineare Struktur des Datensatzes
D(r × c) ist die originale Datenmatrix C(r × n) und ST(n×c) enthalten reinen Variationen der Komponenten bezüglich der Reihen (r) und Spalten (s) von D(r × c)E(r × c) ist die Fehlermatrix
Infrarotspektroskopie
Weinsortenbestimmung
Optische Zunge
2DCoS vs. MCR
Enzymat. Hydrolyse von Albumin
FTIR Spektroskopie an dynamischen Systemen
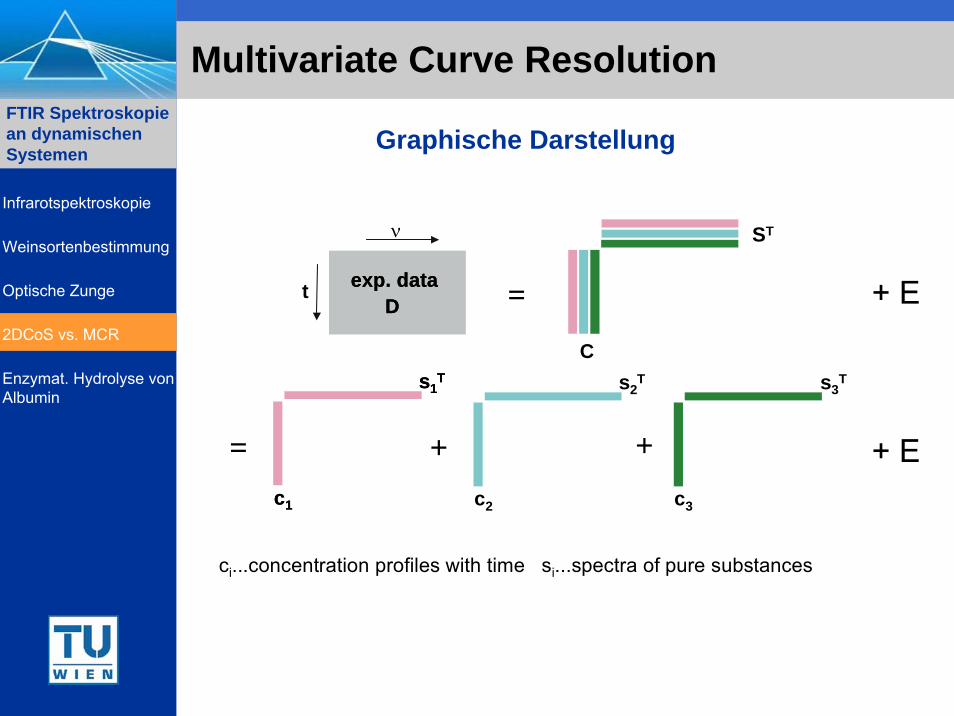
Multivariate Curve Resolution
ci...concentration profiles with time si...spectra of pure substances
= ++c1
s1T
c3
s3T
c2
s2T
=C
ST
exp. dataD
ν
t =
ci...concentration profiles with time si...spectra of pure substances
= ++c1
s1T
c1
s1T
c3
s3T
c2
s2T
=C
ST
exp. dataD
exp. dataD
exp. dataD
ν
t = + E
+ E
Graphische Darstellung
Infrarotspektroskopie
Weinsortenbestimmung
Optische Zunge
2DCoS vs. MCR
Enzymat. Hydrolyse von Albumin
FTIR Spektroskopie an dynamischen Systemen
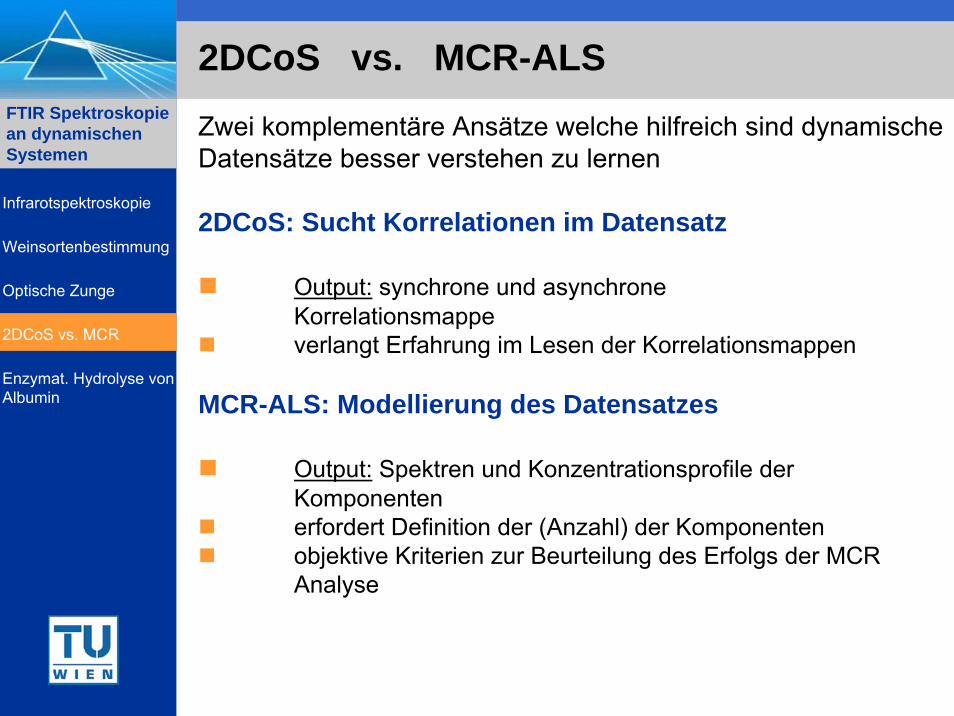
2DCoS vs. MCR-ALS
Zwei komplementäre Ansätze welche hilfreich sind dynamischeDatensätze besser verstehen zu lernen
2DCoS: Sucht Korrelationen im Datensatz
Output: synchrone und asynchroneKorrelationsmappeverlangt Erfahrung im Lesen der Korrelationsmappen
MCR-ALS: Modellierung des Datensatzes
Output: Spektren und Konzentrationsprofile derKomponentenerfordert Definition der (Anzahl) der Komponentenobjektive Kriterien zur Beurteilung des Erfolgs der MCR Analyse
Infrarotspektroskopie
Weinsortenbestimmung
Optische Zunge
2DCoS vs. MCR
Enzymat. Hydrolyse von Albumin
FTIR Spektroskopie an dynamischen Systemen
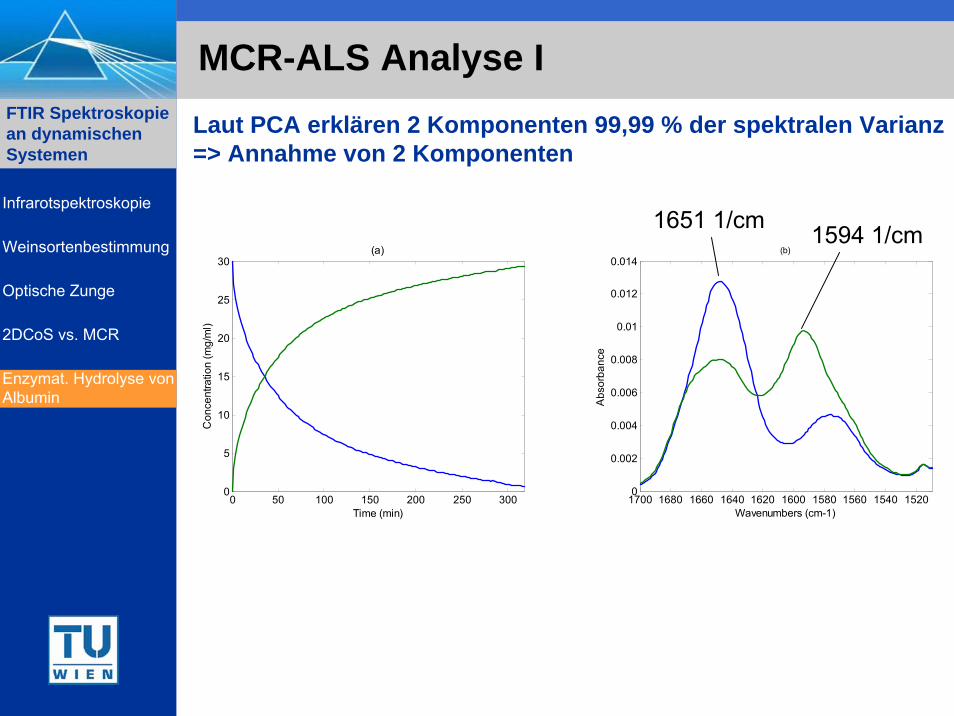
MCR-ALS Analyse I
0 50 100 150 200 250 3000
5
10
15
20
25
30
Time (min)
Con
cent
ratio
n (m
g/m
l)
(a)
15201540156015801600162016401660168017000
0.002
0.004
0.006
0.008
0.01
0.012
0.014
Wavenumbers (cm-1)
Abs
orba
nce
(b)1594 1/cm
Laut PCA erklären 2 Komponenten 99,99 % der spektralen Varianz=> Annahme von 2 Komponenten
1651 1/cmInfrarotspektroskopie
Weinsortenbestimmung
Optische Zunge
2DCoS vs. MCR
Enzymat. Hydrolyse von Albumin
FTIR Spektroskopie an dynamischen Systemen
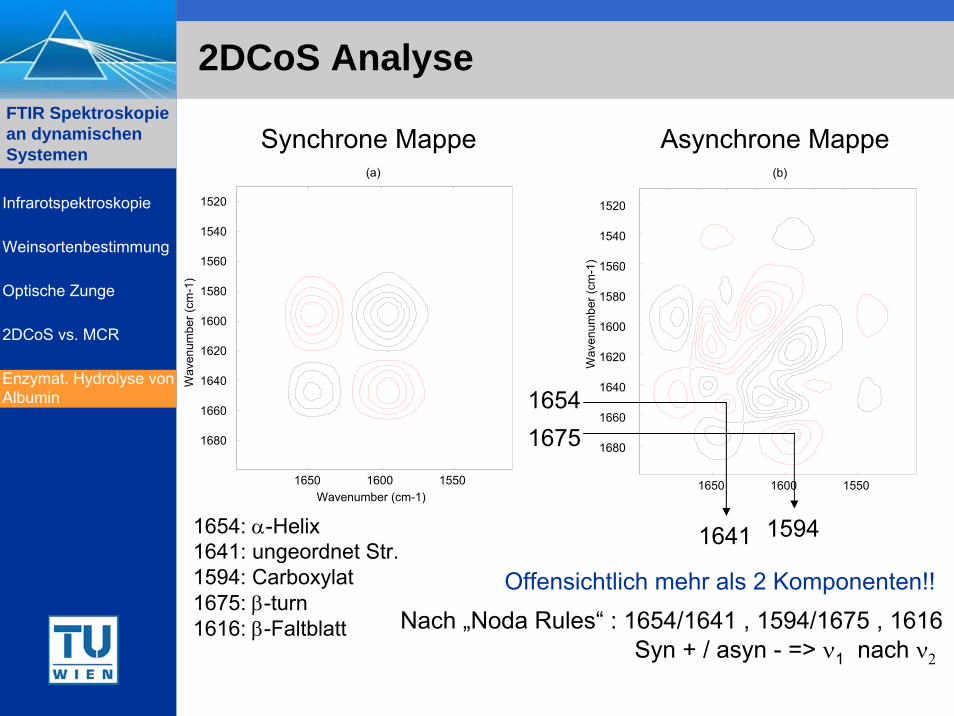
2DCoS Analyse
(a)W
aven
umbe
r(cm
-1)
Wavenumber (cm-1)155016001650
1520
1540
1560
1580
1600
1620
1640
1660
1680
(b)
Wav
enum
ber(
cm-1
)
1520
1540
1560
1580
1600
1620
1640
1660
1680
Wavenumber (cm-1)155016001650
Synchrone Mappe Asynchrone Mappe
Nach „Noda Rules“ : 1654/1641 , 1594/1675 , 1616Syn + / asyn - => ν1 nach ν2
1654
1641
1675
15941654: α-Helix1641: ungeordnet Str.1594: Carboxylat1675: β-turn1616: β-Faltblatt
Offensichtlich mehr als 2 Komponenten!!
Infrarotspektroskopie
Weinsortenbestimmung
Optische Zunge
2DCoS vs. MCR
Enzymat. Hydrolyse von Albumin
FTIR Spektroskopie an dynamischen Systemen
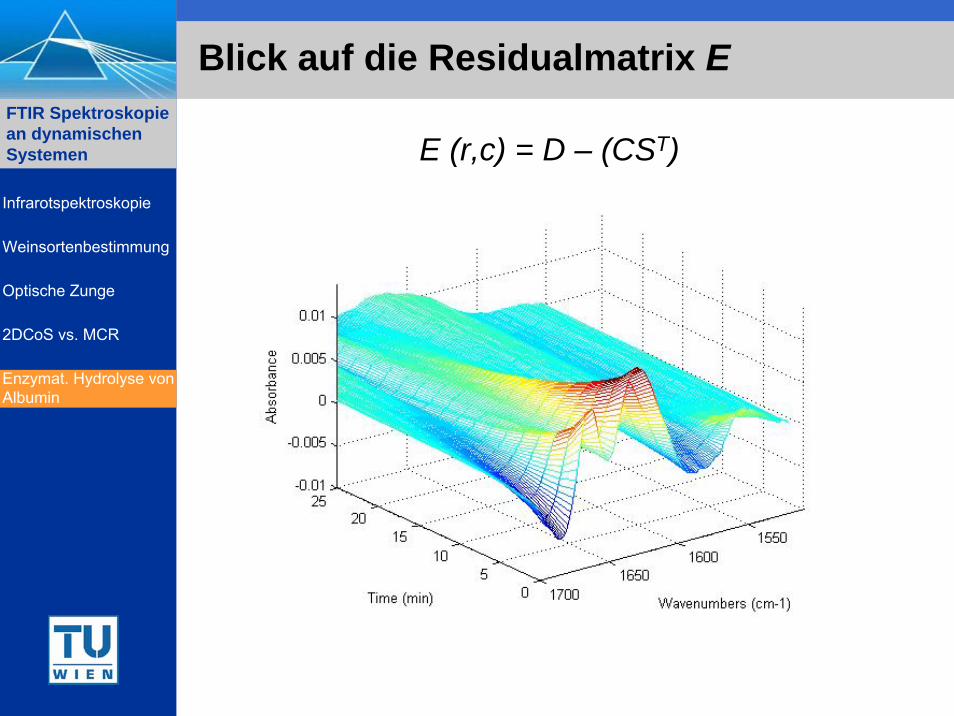
Blick auf die Residualmatrix E
E (r,c) = D – (CST) Infrarotspektroskopie
Weinsortenbestimmung
Optische Zunge
2DCoS vs. MCR
Enzymat. Hydrolyse von Albumin
FTIR Spektroskopie an dynamischen Systemen
(a)W
aven
umbe
r (cm
-1)
Wavenumber (cm-1)155016001650
1520
1540
1560
1580
1600
1620
1640
1660
1680
(b)
Wav
enum
ber (
cm-1
)
Wavenumber (cm-1)155016001650
1520
1540
1560
1580
1600
1620
1640
1660
1680
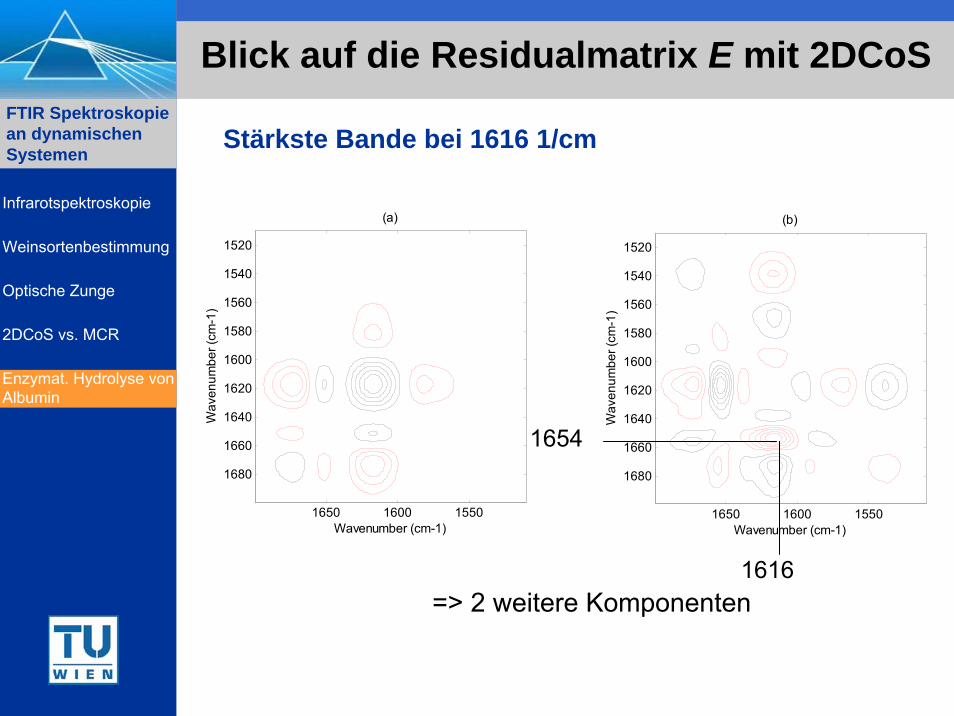
Stärkste Bande bei 1616 1/cm
1654
1616=> 2 weitere Komponenten
Blick auf die Residualmatrix E mit 2DCoS
Infrarotspektroskopie
Weinsortenbestimmung
Optische Zunge
2DCoS vs. MCR
Enzymat. Hydrolyse von Albumin
FTIR Spektroskopie an dynamischen Systemen
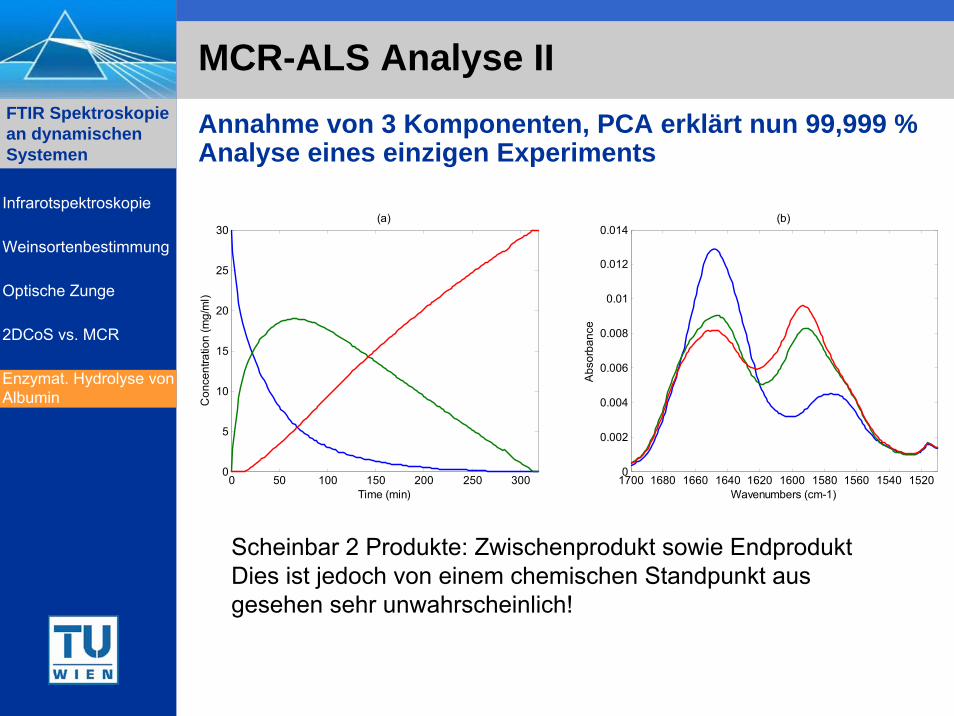
MCR-ALS Analyse IIAnnahme von 3 Komponenten, PCA erklärt nun 99,999 %Analyse eines einzigen Experiments
15201540156015801600162016401660168017000
0.002
0.004
0.006
0.008
0.01
0.012
0.014
Wavenumbers (cm-1)
Abs
orba
nce
(b)
0 50 100 150 200 250 3000
5
10
15
20
25
30
Time (min)
Con
cent
ratio
n (m
g/m
l)(a)
Scheinbar 2 Produkte: Zwischenprodukt sowie EndproduktDies ist jedoch von einem chemischen Standpunkt ausgesehen sehr unwahrscheinlich!
Infrarotspektroskopie
Weinsortenbestimmung
Optische Zunge
2DCoS vs. MCR
Enzymat. Hydrolyse von Albumin
FTIR Spektroskopie an dynamischen Systemen
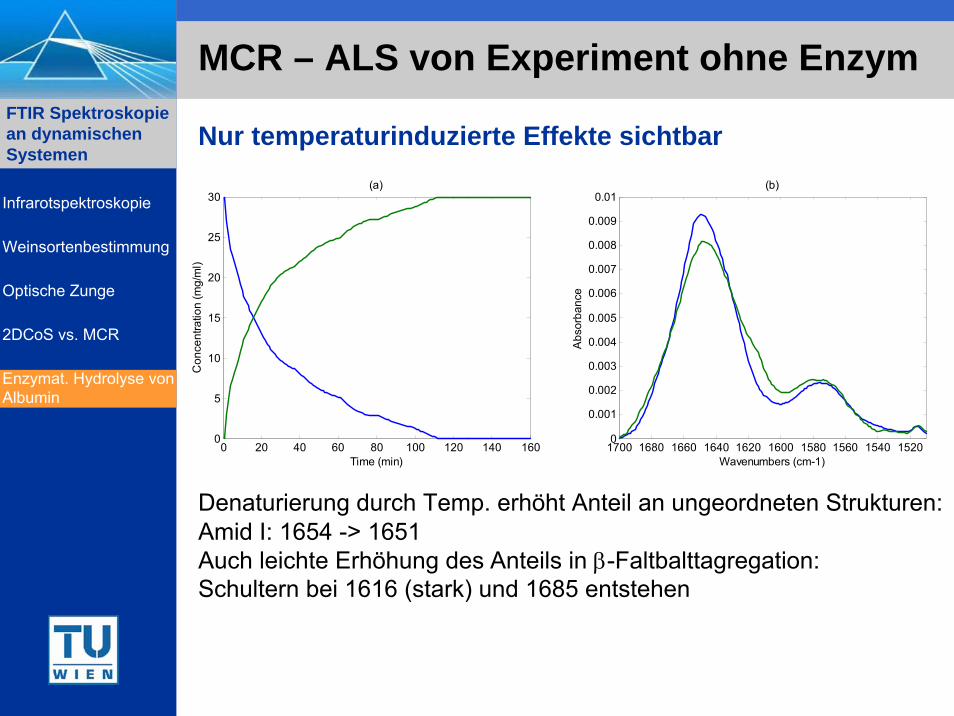
MCR – ALS von Experiment ohne Enzym
Nur temperaturinduzierte Effekte sichtbar
15201540156015801600162016401660168017000
0.001
0.002
0.003
0.004
0.005
0.006
0.007
0.008
0.009
0.01(b)
Wavenumbers (cm-1)
Abs
orba
nce
0 20 40 60 80 100 120 140 1600
5
10
15
20
25
30
Time (min)
Con
cent
ratio
n (m
g/m
l)(a)
Denaturierung durch Temp. erhöht Anteil an ungeordneten Strukturen:Amid I: 1654 -> 1651Auch leichte Erhöhung des Anteils in β-Faltbalttagregation:Schultern bei 1616 (stark) und 1685 entstehen
Infrarotspektroskopie
Weinsortenbestimmung
Optische Zunge
2DCoS vs. MCR
Enzymat. Hydrolyse von Albumin
FTIR Spektroskopie an dynamischen Systemen
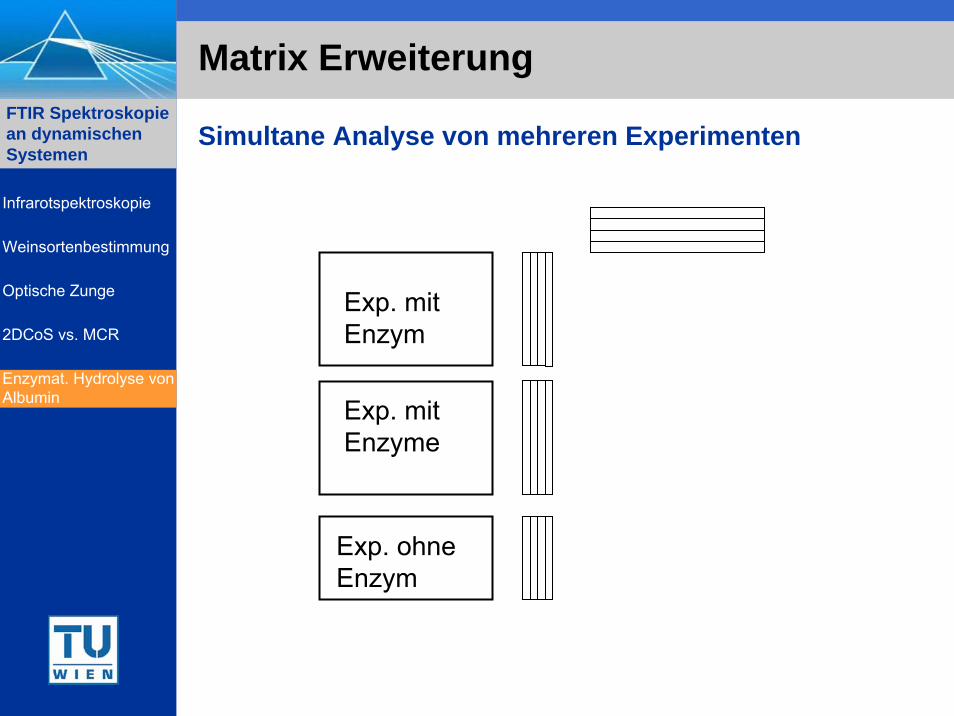
Matrix Erweiterung
Simultane Analyse von mehreren Experimenten
Exp. mitEnzym
Exp. ohneEnzym
Exp. withEnzymeExp. mitEnzyme
Infrarotspektroskopie
Weinsortenbestimmung
Optische Zunge
2DCoS vs. MCR
Enzymat. Hydrolyse von Albumin
FTIR Spektroskopie an dynamischen Systemen
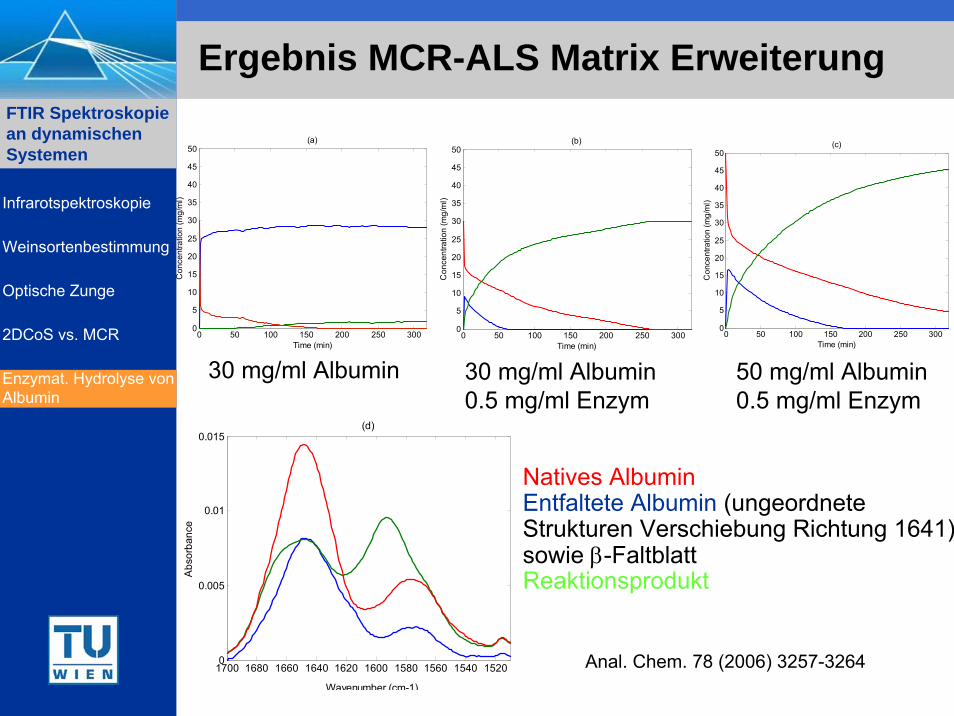
Ergebnis MCR-ALS Matrix Erweiterung
Natives AlbuminEntfaltete Albumin (ungeordneteStrukturen Verschiebung Richtung 1641)sowie β-FaltblattReaktionsprodukt
0 50 100 150 200 250 3000
5
10
15
20
25
30
35
40
45
50
Time (min)
Con
cent
ratio
n (m
g/m
l)
(a)
0 50 100 150 200 250 3000
5
10
15
20
25
30
35
40
45
50
Time (min)
Con
cent
ratio
n (m
g/m
l)
(b)
0 50 100 150 200 250 3000
5
10
15
20
25
30
35
40
45
50
Time (min)
Con
cent
ratio
n (m
g/m
l)
(c)
15201540156015801600162016401660168017000
0.005
0.01
0.015(d)
Wavenumber (cm-1)
Abs
orba
nce
30 mg/ml Albumin0.5 mg/ml Enzym
30 mg/ml Albumin
Anal. Chem. 78 (2006) 3257-3264
50 mg/ml Albumin0.5 mg/ml Enzym
Infrarotspektroskopie
Weinsortenbestimmung
Optische Zunge
2DCoS vs. MCR
Enzymat. Hydrolyse von Albumin
FTIR Spektroskopie an dynamischen Systemen
Zusammenfassung
„Take home messages“
Breite Anwendungsmöglichkeiten der FTIR Spektroskopie zur quantitativen als auch qualitativen Analyse
(Erstaunlich) hoher Informationsgehalt in MIR Spektren welcher durch moderne Datenauswertetechniken auch leicht zugänglich ist
Infrarotspektroskopie
Weinsortenbestimmung
Optische Zunge
2DCoS vs. MCR
Enzymat. Hydrolyse von Albumin
FTIR Spektroskopie an dynamischen Systemen
Danksagung
Maria JoseAyora Canada
Ana Dominguez Vidal Andrea Edelmann
Bruker Optics,insb. Frau Dr. Dietl für die nette und immer hilfreicheBetreuung unserer Aktivitäten auf dem Gebiet derIR- und Raman- Spektroskopie
Infrarotspektroskopie
Weinsortenbestimmung
Optische Zunge
2DCoS vs. MCR
Enzymat. Hydrolyse von Albumin
Top Related