


Languages
Pages
Legal


IOSR Journal of Mechanical and Civil Engineering (IOSR-JMCE) e-ISSN: 2278-1684,p-ISSN: 2320-334X, Volume 12, Issue 4 Ver. II (Jul. - Aug. 2015), PP 74-96 www.iosrjournals.org
DOI: 10.9790/1684-12427496 www.iosrjournals.org 74 | Page
Behavior of R.C. Beams with Inclined Cantilever
Ass.Prof.Dr.Aly Abdel Zaher Elsayed1; Dr. Mohamed Noaman
2;
Ali Mohamed Abdallah3 Mahmoud Ahmed Ali abdelrahim
4
1staff in Civil Engineering Department, Faculty of Engineering, Assiut University, Assiut, Egypt. 2Civil Engineering Department, Faculty of Engineering, ALazhar University,
3Civil Engineering Department, Faculty of Engineering, Kafrelsheikh University, 4Civil Engineer, Al-azharUniversity, 2010.
Abstract: In this study, equilibrium configurations of a cantilever beam subjected to an end load with angle of
inclination is investigated. It is shown analytically that if the beam is sufficiently flexible, there are multiple
equilibrium solutions for a specific beam and loading condition. A method is also presented for the determination of these deflected configurations. The cantilever beam studied in this research is considered to be
initially straight andprismatic in addition to being homogeneous, elastic, and isotropic. The procedure outlined
in this paper is utilized to show that for each combination of load and beam parameters, there is certain number
of equilibrium configurations for a cantilever beam. The ranges of these combinations, along with some
examples of the deflected shapes of the beams, are provided for several load inclination angles.
I. Introduction
A cantilever beam is a beam that is only supported on one of its ends. Cantilever construction is
popular in many kinds of architectural design and in other kinds of engineering, where professionals use terms
like end load, intermediate load, and end moment to identify how much a cantilever beam will hold. The term
moment is related to torque and to a theoretical load on a beam.
In residential architecture, cantilever beam design is often used for creating balconies and other extensions above ground level. Famous architects like Frank Lloyd Wright (3) were known to take advantage of
cantilever beam construction to provide for parts of a building that protrude from a supported section. The use
of cantilever beam setups and similar cantilever engineering is also often seen in bridges and similar projects.
Carpenters might think of cantilever beam design in terms of wooden beams, but in other kinds of projects a
cantilever design is applied to a concrete slab or a metal girder.
A specific use of cantilever beam construction is often part of a temporary construction project. While
a bridge or other project is in transition, cantilever design provides for structural integrity while only one side of
a beam is supported Later, that beam may be supported on both sides. Engineers can show diagrams of how
cantilever design will help ensure stability mid-way through a building project as part of a safety study.
Architects and engineers also use cantilever beam structures for the overhangs that are often a part of
various buildings. Airports, university campuses, office complexes, and other areas will often include exterior structures that use cantilever beam construction for different intentions in building design. These overhanging
elements can provide shelter from the elements or a decorative aspect to a building. In some cases, an "open
style" cantilever design fits into a modern or artistic design for a space, where planners have blended
practicality with aesthetic appeal.
Those who are interested in observing how cantilever design is used in modern engineering can easily
find many visible instances of this engineering method at work in their local communities. A detailed study of
this kind of design can better prepare a student for entrance into an engineering or architectural program. It can
also increase a student's understanding of how professionals implement this kind of design to both residential
and commercial projects.
The ultimate load considered as the ultimate capacity of the section to carrying bending or shears which is
critical equ. The theoretical values of the cracking shear load (Qcrth) can be determined according to (Egyptian code 2002) (1).
Q th= 0.75√fc/γc kg/cm2 (1)
qush = 2.2√fc/γc kg/cm2 (2)
The equation is according ACI Code (1995&2002) (2) the theoretical values of the ultimate load (Puth) can be
determined according to the smallest value of the following cases (a), or (b) as follows.
(a) - Due to bending by (ACI Code 1995&2002)
Puth = 2.7 fy (1 – 0.9 fy/105) (3)

Behavior of R.C. beams with inclined cantilever
DOI: 10.9790/1684-12427496 www.iosrjournals.org 75 | Page
(b) Due to shear by (ACI Code 1995&2002)
Puth =1.6 * √ ƒ/c * b * d (4)
Then the critical theoretical values of the ultimate load (Puth) can be determined due to bending. The theoretical values of the cracking load (Pcrth) can be determined
According to (ACI Code 318-1995& 2002) & ACI 363R-92.
Where Pcth = 2.5Mcr, Mcr = (fctr .Ig)/yct, fctr =0.94√ƒ/ c Mpa.
I. Experimental Work Experimental tests have been carried out on rectangular reinforced concrete beams under static loading
up to failure. The study takes into consideration the following parameters:
1-Percentage of longitudinal tension reinforcement (ρ)
2- Inclination (α) of cantilever in tested beam The above mentioned parameters were chosen to declare and to determine their effects on the general
behavior of strength reinforced concrete beams under static loading particularly on their shear, flexural and
torsion states in the well-known stages of the loading up to failure.
Ten reinforced concrete beams were prepared. They have normal strength of concrete ( fc = 250) and
with straight cantilever (α=0.0°) and inclined cantilevers (α= 30°, 45°, 60°,90° )the main steel percentage of
tested beam were As1 = 2Φ16mm (ρ = 1.24) and As2 = 4Φ16mm( ρ = 1.24) for all beam.
II. Materials 2.1 Concrete Concrete mixes design was made to produce concrete having 28 days' strengths of about 250kg/cm2. The mix
proportions by weight are represented in table (1).
For normal strength concrete (fc = 250 kg/cm2), the constituent materials were:
a- Ordinary Portland cement, its properties agree with ECP 203.
b- Local gravel; the used gravel was 20 mm nominal maximum size, 2.65 specific gravity, and 1.66 t/m3
volume weight.
c- Local sand; the used sand is a medium type one which has a specific gravity and volume weight of 2.65 and
1.65 t/m3 respectively. The sieve analysis of the used sand and gravel are given in tables(1)
d- Potable water was used.
Table (1), Concrete mix proportion. Amount of constituent materials/m
3
concrete fcu(kg/cm
2)
Water
( liter ) Gravel.
(kg) Sand ( kg)
Cement ( kg)
28days 7days 286 200 140 1350 650 350 C
2.2 Tested beams Tested beams consisted of ten simply supported concrete beams with cantilever. These beams were
arranged in five groups (A, B, C, Dand E) Beams of groups A, B, C, D and E having a variable length resulting
the cantilever inclination (α). All beams having an overall depth of 30 cm and 12 cm width. The beam width
was deliberately kept constant at 12cm to maintain the same fracture energy for all beam specimens. This is
because the surface layer of a beam contains a lower content of large aggregates and a relatively higher content
of mortar. Therefore, the crack propagation will occur farther in the surface than in the interior.
Group (A, B, C, D And E)
This group includes ten beams having the same concrete compressive strength ( fc28 ), horizontal web
reinforcement ratio (ρh), and vertical web reinforcement ratio (ρv) group (A) includes two beams having straight
cantilever(α=0.0°) and groups (B,C,D and E) having different inclined cantilever with angle (α) equal to (30°,
45°, 60°and 90°)respectively .All groups (A, B, C, D and E) having pairs of beam with different longitudinal
steel ratio (ρ) As1 = 2Φ16mm (ρ = 1.24) and As2 = 4Φ16mm( ρ = 1.24).
Complete details for all the tested beams are presented in table (2) as well as in Figs. from (1) to (10
Behavior of R.C. beams with inclined cantilever
DOI: 10.9790/1684-12427496 www.iosrjournals.org 76 | Page
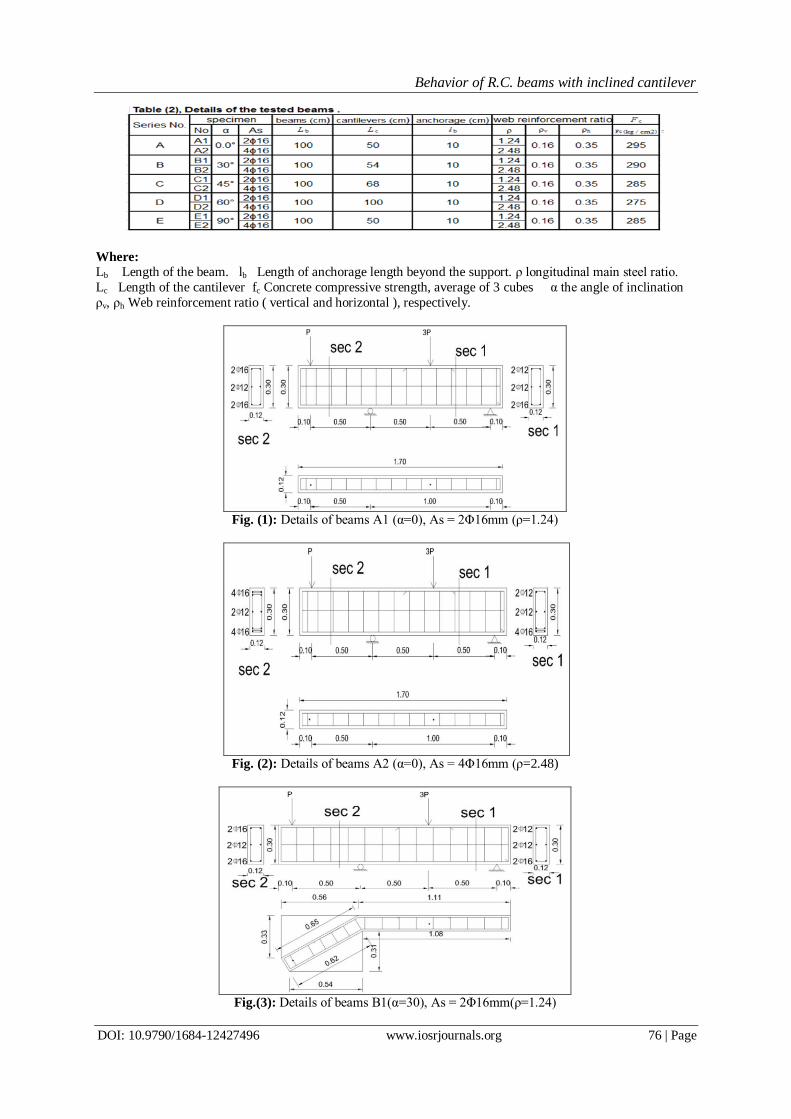
Where:
Lb Length of the beam. lb Length of anchorage length beyond the support. ρ longitudinal main steel ratio.
Lc Length of the cantilever fc Concrete compressive strength, average of 3 cubes α the angle of inclination
ρv, ρh Web reinforcement ratio ( vertical and horizontal ), respectively.
Fig. (1): Details of beams A1 (α=0), As = 2Φ16mm (ρ=1.24)
Fig. (2): Details of beams A2 (α=0), As = 4Φ16mm (ρ=2.48)
Fig.(3): Details of beams B1(α=30), As = 2Φ16mm(ρ=1.24)

Behavior of R.C. beams with inclined cantilever
DOI: 10.9790/1684-12427496 www.iosrjournals.org 77 | Page
Fig.(4): Details of beams B2(α=30), As = 4Φ16mm(ρ=2.48)
Fig. (5): Details of beams C1 (α=45), As = 2Φ16mm (ρ=1.24)
Fig. (6): Details of beams C2 (α=45), As = 4Φ16mm (ρ=2.48)
Fig. (7:) Details of beams D1 (α=60) As = 2Φ16mm, ρ=1.24

Behavior of R.C. beams with inclined cantilever
DOI: 10.9790/1684-12427496 www.iosrjournals.org 78 | Page
Fig. (8): Details of beams D2 (α=60) As = 4Φ16mm, ρ=2.48
Fig. (9): Details of beams E1 (α=90) As = 2Φ16mm, ρ=1.24
Fig. (10): Details of beams E2 (α=90) As = 4Φ16mm, ρ=2.48
2.3 Test procedure
All beams with cantilever were tested under two point static loading one of the loads at cantilever end
and other load effect on the mid span of tested beams the loads was increased up to (0.5, 1.5) tons respectively then; the load were applied in increments each of (0.5, 1.5) ton for the tested beam with cantilever concrete the
load was kept constant every two successive increments for five minutes. During this period, the mid span
deflection was recorded, cracks propagation was traced, and reading of strain gauges were recorded. For each
beam, the total duration of loading up to failure was different depending upon the inclination beam cantilever
(α), percentage of longitudinal reinforcement ratios (ρ).
2.3 Measured deformation of beams:
Strains of concrete and steel were measured by means of electrical strain gauges at the shown positions
in Fig (11).The gauge length was 52mm, and the 800mm resistance was 600 ohms and gauge factor
(2 ± 0.75%) . Strain gauges were connected to strain indicator with its box resistance.

Behavior of R.C. beams with inclined cantilever
DOI: 10.9790/1684-12427496 www.iosrjournals.org 79 | Page
Fig. (11). Method of measuring deformation of beams.
III. Test Result 3.1 Crack pattern and mode of failure
The crack pattern and mode of failure are explained for the tested reinforced concrete beams with
inclined cantilever.
All beams failed in shear, in spite of the different amount of reinforcement(ρ) that considered in the
tests, in the early stages of loading, no flexural cracks were observed in the region of bending moment as the
applied load increased. With a further increase of load, diagonal cracks formed in the shear span area and
developed towards the loading points and supports.
It is worth mentioning that for all beams which failed in diagonal tension, the inclination of the major
crack making an angle between 38° to 63° for all beams.
The failure modes of beams in groups A to E are presented in table (3); the most common failure for
the tested beams is a diagonal tension failure. The shear failure in beams is always initiated by splitting action
Diagonal tension was observed in beams of groups (A, B, C, D, and E) at critical shear zone between the cantilever span and mid span of beams .
The amount of longitudinal steel ratio (ρ) has no effect on final mode of failure. The presence of
stirrups is very essential to resist shearing stresses. Consequently, it has a considerable effect on pattern of
cracks and modes of failure. The stirrups importance once already appeared at instant of the first inclined crack
formation.
Therefore, stirrups must be arranged in such a way that any probable diagonal tension crack should be
encountered with at least more than one stirrup. I.e. to ensure that any potential diagonal tension crack
encounters a stirrup and does not open excessively and consequently the risk of the beam at the level of tension
steel or the sudden failure without warning is prevented.
The observed failure which accompanied by a vertical displacement as well as vertical sliding between the two
adjacent portions of the beam just to the load points preceded by diagonal crack is denoted by diagonal tension failure.
The cracking and ultimate loads were recorded in table (3) and the deflection and strain for concrete were given
in Table (4). Mode of failure for each beam was as follow:
Fig (12) Crack pattern of beam (A1)
Fig (13) Crack pattern of beam (A2)
Fig (14) Crack pattern of beam (B1)

Behavior of R.C. beams with inclined cantilever
DOI: 10.9790/1684-12427496 www.iosrjournals.org 80 | Page
Fig (15) Crack pattern of beam (B2)
Fig (16) Crack pattern of beam (C1)
Fig (17) Crack pattern of beam (C2)
Fig (18) Crack pattern of beam (D1)
Fig (19) Crack pattern of beam (D2)
Fig (20) Crack pattern of beam (E1)
Fig (21) Crack pattern of beam (E2)
Table (3), Test results of reinforced concrete tested beams.
D.T Diagonal tension. D.T&S.C Diagonal tension and shear compression.

Behavior of R.C. beams with inclined cantilever
DOI: 10.9790/1684-12427496 www.iosrjournals.org 81 | Page
3.2 Deflection characteristics.
The measured values of maximum deflection are plotted versus the applied load from starting the
loading up to failure as shown in Fig. (22) To Fig. (27).

Behavior of R.C. beams with inclined cantilever
DOI: 10.9790/1684-12427496 www.iosrjournals.org 82 | Page
3.3 Concrete Strain Distribution.
Figures (28) to fig (30), shows the behavior of the concrete strain in compression for all beams. The
results indicated that all specimens presented almost have the same trend where the load increased, the strain also increased.
3.4 Load-Slope characteristics
The maximum measured slope at the center of roller support of the beams is plotted versus the applied
load from zero loading up to failure as Shown in Fig. (31). generally the load –slope curve of the tested beams
can be divided into three distinct stages As follows:

Behavior of R.C. beams with inclined cantilever
DOI: 10.9790/1684-12427496 www.iosrjournals.org 83 | Page
a- a-The first stage: The un-cracked beams had relatively high flexural Rigidity. Consequently the slope of the
load-slope curve in this stage was Steeper than the other stages.
b- b-The second stage: The shear cracks started to form. As the applied Loads was increased, cracks propagated and their width and length Increased. Hence, the slope of the load-slope curve became flatter
than the First stage.
c- c-The third stage: The beams started to fail and the slope of the load-slope Curve became flatter than the
second stage.
IV. Discussion of Test Result This item describes and interprets the analysis of the obtained test results of the beams with inclined
cantilever. The analysis includes the relationship between the value of cracking and ultimate loads, deflection;
and concrete strain for tested beams. The characteristic of tested beams at cracking, ultimate load, deflection and strain are given in tables (3). The values of the experimental measured parameters of beams are shown in
figures (12) to (31).From item (3); it is obvious that, all beams failed in shear or shear compression. In the early
stages of loading, no flexural cracks were observed in the region of bending moment or shear zone as the
applied load increased. With a further increase of load, diagonal cracks formed in the shear span area; and
bending moment area and developed towards the loading points.
The failure modes of beams in groups A to E are presented in tables (3) the most common failure for
the tested beams is a diagonal tension crack. The shear failure in beams is always initiated by splitting action.
The amount of longitudinal steel ratio (ρ) has no effect on final mode of failure. The presence of inclination of
angle (α) it has a considerable effect on pattern of cracks and modes of failure. The shear load was observed
zone between the mid span load and the roller support. i.e. (through the critical shear zone) equal to double
shear load on the cantilever beams. The effect of each parameter individually can be explained as follows:
4.1 Cracking and ultimate load (pcr, pu).
4.1.1 Effect of cantilever inclination (α): With respect to steel reinforcement As =2Φ16 (ρ= 1.24) and As
=4Φ16 (ρ= 2.48) at span of cantilever and beams respectively.
4.1.1. 1-The shear cracking loads (Qcr) when the increasing of angle of inclination(α) has a slight effect on
decreasing both the shear cracking load as follows:
From (α= 0.0°to 30°) the shear cracking load decreasing by (12.5, 20, 6.25and11 %)
From (α= 30°to 45°) the shear cracking load decreasing by (7.1, 2.5, 13.3 and1.1%)
From (α= 45°to 60°) the shear cracking load decreasing by (30, 23, 23 and24%)
Finally the increasing inclination of angle from (α= 60°to90°) increasing the shear cracking load by (30, 16.7,30
and16.7) Shown in fig (32 to fig 35).
4.1.1.2- The ultimate loads (Pu) when the increasing of angle of inclination (α) has a slight effect on
decreasing both the ultimate load as follows:
From (α= 0.0°to 30°) the ultimate load decreasing by (16.25, 14.1, 16.7 and13.7)
From (α= 30°to 45°) the ultimate load decreasing by (25.3, 22.6, 25 and 22.7)
From (α= 45°to 60°) the ultimate load is constant
Finally the increasing inclination of angle from (α= 60°to90°) increasing ultimate load by (20, 18.6, 20 and17.6)
Shown in fig (32 to fig 35).
4.1.1.3- The flexural cracking loads (Pcr) at span of beams when the increasing of angle of inclination (α)
has a slight effect on decreasing both the flexural cracking load as follows:
From (α= 0.0°to 30°) the flexural cracking load decreasing by (10 and 5%) From (α= 30°to 45°) the flexural cracking load decreasing by (27 and 16.8%)
From (α= 45°to 60°) the flexural cracking load decreasing by (7.7 and 11.4%)
Finally the increasing inclination of angle from (α= 60°to90°) increasing the flexural cracking load by (16.6 and
14.3%) Shown in fig (34 and 35).

Behavior of R.C. beams with inclined cantilever
DOI: 10.9790/1684-12427496 www.iosrjournals.org 84 | Page
4.1.2 Effect of longitudinal steel ratio (ρ) 4.1.2.1 When the increasing of main longitudinal bars on cantilever the diagonal cracking load (Qcrb) and
ultimate load (Pu) are increasing respectively as follows:
For (α=0.0°) the values of loads increasing by (25 and 6.2%)
For (α=30°) the values of loads increasing by (14.3and 9%)
For (α=45°) the values of loads increasing by (20and 13%)
For (α=60°) the values of loads increasing by (20and 13 %)
Finally the increasing inclination of angle from (90°) the values of loads increasing by (7.7 and 11.7 %) Shown
in fig (36).
4.1.2.2 When the increasing of main longitudinal bars on beams the diagonal cracking load (Qcrb) flexural cracking load (Pcrb) and ultimate load (Pu) are increasing respectively as follows:
For (α=0.0°) the values of loads increasing by (12.5, 12.5 and 2%)
For (α=30°) the values of loads increasing by (6.7, 5.5 and 10%)
For (α=45°) the values of loads increasing by (21.5, 21.5 and 13.3%)
For (α=60°) the values of loads increasing by (20, 16.7 and 13.3 %)
Finally the increasing inclination of angle from (α=90°) the values of loads increasing by (7.7, 14.3 and11.1 %)
Shown in fig (37).

Behavior of R.C. beams with inclined cantilever
DOI: 10.9790/1684-12427496 www.iosrjournals.org 85 | Page
4.2 Maximum measured deflection (δ).
4.2.1. Effect of beams cantilever inclination (α) With respect to steel reinforcement As = 2Φ16
(ρ= 1.24) and As 4Φ16 (ρ =2.48) at span of cantilever and beams respectively.
4.2.1.1. The crack deflection (δcr) when the increasing of angle of inclination (α) has a slight effect on
increasing the deflection of cracking load as follows:
From (α = 0.0°to 30°) the deflection crack increasing by (17.8, 16.7, 15.4 and 7.7%)
From (α = 30°to 45°) the deflection crack increasing by (4, 2.9, 6.7 and 3.6%) From (α = 45°to 60°) the deflection crack increasing by (3.9, 8.3, 12.5 and 6.9%)
Finally the increasing inclination of angle from (α = 60°to90°) increasing the deflection cracking load by (3.8,
2.6, 5.5 and 9.7%) Shown in fig (38 to fig 41).
4.2.1. 2-The ultimate deflection (δu) when the increasing of angle of inclination has a slight effect on
increasing the deflection ultimate load as follows:
From (α = 0.0°to 30°) the ultimate deflection increasing by (12, 16.7, 15.4 and 16.7%)
From (α = 30°to 45°) the ultimate deflection is (constant, constant, 6.7 and 7.1%)
From (α = 45°to 60°) the ultimate deflection increasing by (14.3, 3.6, 12.5 and 6.7%)
Finally the increasing inclination of angle from (α = 60°to90°) increasing the ultimate deflection by (3, 3.4, 5.5,
13.8%) Shown in fig (38 to fig 41).

Behavior of R.C. beams with inclined cantilever
DOI: 10.9790/1684-12427496 www.iosrjournals.org 86 | Page
4.2.2 Effect of longitudinal steel ratio (ρ) 4.2.2.1 When the increasing of main longitudinal bars on cantilever the deflection at cracking load (δcr) and
deflection at ultimate load (δu) are increasing respectively as follows:
For (α=0.0°) the values of deflection decreasing by (3.2and 4%)
For (α=30°) the values of deflection decreasing by (4.1% and constant)
For (α=45°) the values of deflection decreasing by (5.2% and constant)
For (α=60°) the values of deflection decreasing by (1.25 and 9.4 %) Finally the increasing inclination of angle from (α= 90°) the values of deflection decreasing by (2.4and 6 %)
Shown in fig (42).
4.2.2.2 When the increasing of main longitudinal bars on beams the deflection at cracking load (δcr) and
deflection at ultimate load (δu) are increasing respectively as follows:
For (α=0.0°) the values of deflection decreasing by (7and 7.7%)
For (α=30°) the values of deflection decreasing by (3.4and 6.7%)
For (α=45°) the values of deflection decreasing by (3.3 and 6.2%)
For (α=60°) the values of deflection decreasing by (6 and 11 %)
Finally the increasing inclination of angle from (α = 90°) the values of deflection decreasing by (5.5and 4 %)
Shown in fig (43).
4.3 Ultimate concrete compressive strains (ξc)
4.3.1 Effect of beams cantilever inclination (α): With respect to steel reinforcement at span of cantilever
having As = 2Φ16 (ρ= 1.24) and As = 4Φ16 (ρ=2.48)
4.3.1.1 The ultimate concrete compressive strains (ξc): When the increasing of angle of inclination (α) has a
slight effect on decreasing the ultimate concrete compressive strains (ξc) as follows:
From (α= 0.0°to 30°) the ultimate concrete compressive strains decreasing by (16.7 and 18.2%)
From (α= 30°to 45°) the ultimate concrete compressive strains decreasing by (20% and constant) From (α= 45°to 60°) the ultimate concrete compressive strains decreasing by (constant and 5.5%)
Finally the increasing inclination of angle from (α= 60°to90°) increasing the ultimate deflection by (33 and
5.9%) Shown in fig (44).
4.3.1.2 With respect to steel reinforcement at span of beams having As = 2Φ16 (ρ= 1.24) and As 4Φ16

Behavior of R.C. beams with inclined cantilever
DOI: 10.9790/1684-12427496 www.iosrjournals.org 87 | Page
(ρ =2.48)
The ultimate concrete compressive strains (ξc) when the increasing of angle of inclination has a slight effect
on decreasing the ultimate concrete compressive strains (ξc) as follows: From (α= 0.0°to 30°) the ultimate concrete compressive strains decreasing by (10.6 and 9.6%)
From (α= 30°to 45°) the ultimate concrete compressive strains decreasing by (14.3 and 14%)
From (α= 45°to 60°) the ultimate concrete compressive strains decreasing by (2.7 and 2.7%)
Finally the increasing inclination of angle from (α= 60°to90°) increasing the ultimate deflection by (14.3 and
16.6%) Shown in fig (45).
4.3.2 Effect of longitudinal steel ratio (ρ)
4.3.2.1 Effect of longitudinal steel ratio (ρ) at span of cantilever:
For (α=0.0°) the values of concrete compressive strains increasing by (22.2%)
For (α=30°) the values of concrete compressive strains increasing by (16.7%)
For (α=45°) the values of concrete compressive strains increasing by (50%)
For (α=60°) the values of concrete compressive strains increasing by (41.7%)
Finally the increasing inclination of angle from (90°) the values of concrete compressive strains increasing by
(12.5 %) shown in fig (46).
4.3.2.2 Effect of longitudinal steel ratio (ρ) at span of beam:
For (α=0.0°) the values of concrete compressive strains increasing by (1.27) For (α=30°) the values of concrete compressive strains increasing by (2.38%)
For (α=45°) the values of concrete compressive strains increasing by (2.7%)
For (α=60°) the values of concrete compressive strains increasing by (2.85%)
Finally the increasing inclination of angle from (α = 90°) the values of concrete compressive strains increasing
by (5 %) shown in fig (47).
4.4 Maximum Slope of Beams at the Support
4.4.1 Effect of beams cantilever inclination (α)

Behavior of R.C. beams with inclined cantilever
DOI: 10.9790/1684-12427496 www.iosrjournals.org 88 | Page
The values of slope at different loads increase with the increase of the cantilever inclination (α) having
As = 2Φ16 (ρ= 1.24) and As = 4Φ16 (ρ=2.48) the compared values of (θcr) and (θu) respectively:
From (α =0.0° to30°) the compared values were (80 and 75%) ( 43 and 50 %). From (α =30° to 45°) the compared values were (44.4 and 42.9% ) (25 and 20.8 %).
From (α =45° to 60°) the compared values were (23 and 5% ) (16 and 13.8%).
From (α =60° to 90°) the compared values were (43.75and 31.6% ) (20.7 and 21.2%) shown in fig (48 and 49).
4.4.2Effect of longitudinal steel ratio (ρ)
For (α=0.0°) the values of slope increasing by 60 and 6.25%.
For (α=30°) the values of slope increasing by 8.9 and 20 %.
For (α=45°) the values of slope increasing by 27 and 16 %.
For (α=60°) the values of slope increasing by 25 and 13.8%.
For (α=90°) the values of slope increasing by 8.7 and 14.3% shown in fig (50)
4.5 Comparison between beam A1 (Ref) and tested beams.
Results for beams with cantilever have different in main reinforcement ratio and inclined cantilever (α)
in shear region or in flexural zone with respect to results for beam(A1)are included in table (4) and shown in Figs (37)to figs (42).
Table (4): Comparison between A1 (Ref) and tested beams results.

Behavior of R.C. beams with inclined cantilever
DOI: 10.9790/1684-12427496 www.iosrjournals.org 89 | Page
4.5.1 Effect of beams cantilever inclination (α)
4.5.1.1 With respect to steel reinforcement As = 2Φ16 (ρ= 1.24) and As 4Φ16 (ρ =2.48) at span of beams.
1-The shear cracking loads (Qcr) when the increasing of angle of inclination (α) has a slight effect on
decreasing the shear cracking load were respectively as follows:
From (α= 0.0°to 30°) the compared values were (6% and constant) From (α= 30°to 45°) the compared values were (19 and 1 %)
From (α= 45°to 60°) the compared values were (37 and 25 %)
Finally the increasing inclination of angle from (α= 60°to90°) the compared values were (19 and 12 %) Shown
in fig (50 and 51).
2- The flexural cracking loads (Pcr) when the increasing of angle of inclination (α) has a slight effect on
decreasing both the flexural cracking load as follows:
From (α = 0.0°to 30°) the compared values were (10 and 5 %)
From (α = 30°to 45°) the compared values were (35and 21%)
From (α = 45°to 60°) the compared values were (40 and 30%)
Finally the increasing inclination of angle from (α = 60°to90°) the compared values were (30 and 20 %) Shown
in fig (50 and 51).
3- The ultimate loads (Pu) when the increasing of angle of inclination (α) has a slight effect on decreasing both
the ultimate load as follows:
From (α = 0.0°to 30°) the compared values were (17 and 8 %)
From (α = 30°to 45°) the compared values were (37 and 29%)
From (α = 45°to 60°) the compared values were (37 and 29%)
Finally the increasing inclination of angle from (α = 60°to90°) the compared values were (25 and 17 %) Shown
in fig (50 and 51).
4.5.1.2With respect to steel reinforcement having As = 2Φ16 (ρ= 1.24) and As = 4Φ16 (ρ=2.48) at span of
cantilever beams.

Behavior of R.C. beams with inclined cantilever
DOI: 10.9790/1684-12427496 www.iosrjournals.org 90 | Page
1-The shear cracking loads (Qcr) when the increasing of angle of inclination has a slight effect on decreasing
the shear cracking load as follows:
From (α = 0.0°to 30°) the compared values were (12% and constant) From (α = 30°to 45°) the compared values were (35 and 2%)
From (α = 45°to 60°) the compared values were (37 and 25 %)
Finally the increasing inclination of angle from (α = 60°to90°) the compared values were (19 and 12 %) Shown
in fig (52 and 53).
2- The ultimate loads (Pu) when the increasing of angle of inclination has a slight effect on decreasing both
the ultimate load as follows:
From (α = 0.0°to 30°) the compared values were (16 and 9%)
From (α = 30°to 45°) the compared values were (37 and 29 %)
From (α =45°to 60°) the compared values were (37 and 29 %)
Finally the increasing inclination of angle from (α = 60°to90°) the compared values were (25 and 16 %) Shown in fig (52 and 53).
4.6 Comparison between cracking and ultimate deflection.
4.6.1With respect to steel reinforcement As = 2Φ16 (ρ= 1.24) and As = 4Φ16 (ρ=2.48) at span of beams.
4.6.1.1-The deflection at cracking loads (δcr) when the increasing of angle of inclination (α) has a slight
effect on increasing the deflection as follows:
From (α = 0.0°to 30°) the compared values were (4%and constant)
From (α = 30°to 45°) the compared values were (7and 4%)
From (α = 45°to 60°) the compared values were (18and 10%)
Finally the increasing inclination of angle from (α = 60°to90°) the compared values were (28and 20%) Shown
in fig (54and 55).
4.6.1.2- The deflection at ultimate loads (δu) when the increasing of angle of inclination (α) has a slight effect
on increasing both the deflection as follows:
From (α = 0.0°to 30°) the compared values were (15and8 %)
From (α = 30°to 45°) the compared values were (23and15 %)
From (α = 45°to 60°) the compared values were (38and 23%)
Finally the increasing inclination of angle from (α = 60°to90°) the compared values were (46and40 %) Shown
in fig (54and 55).

Behavior of R.C. beams with inclined cantilever
DOI: 10.9790/1684-12427496 www.iosrjournals.org 91 | Page
4.6.2With respect to steel reinforcement (As = 2Φ16 (ρ= 1.24) and As = 4Φ16 (ρ=2.48) at span of
cantilever beams.
4.6.2.1-The deflection at cracking loads (δcr) when the increasing of angle of inclination (α) has a slight
effect on decreasing the deflection as follows:
From (α = 0.0°to 30°) the compared values were (18and 13%)
From (α = 30°to 45°) the compared values were (23and16 %)
From (α = 45°to 60°) the compared values were (27and 26%) Finally the increasing inclination of angle from (α = 60°to90°) the compared values were (32and 29%) Shown
in fig (56and 57).
4.6.2.2- The deflection at ultimate loads (δu) when the increasing of angle of inclination (α) has a slight effect
on increasing both the deflection as follows:
From (α = 0.0°to 30°) the compared values were (12and 12%)
From (α = 30°to 45°) the compared values were (12and 12%)
From (α = 45°to 60°) the compared values were (28and 16%)
Finally the increasing inclination of angle from (α = 60°to90°) the compared values were (32and20 %) Shown
in fig (56and 57).
4.7 Comparison between the concrete strains due to ultimate load.
4.7.1With respect to steel reinforcement (As = 2Φ16 (ρ= 1.24) and As = 4Φ16 (ρ=2.48) at span of
cantilever beams.
1- The concrete strains at ultimate loads (£u) when the increasing of angle of inclination (α) has a slight
effect on increasing the concrete strains as follows:
From (α = 0.0°to 30°) the compared values were (17%and constant)
From (α = 30°to 45°) the compared values were (33%and constant)
From (α = 45°to 60°) the compared values were (33and6 %)
Finally the increasing inclination of angle from (α = 60°to90°) the compared values were (11%and constant) Shown in fig (58).

Behavior of R.C. beams with inclined cantilever
DOI: 10.9790/1684-12427496 www.iosrjournals.org 92 | Page
4.7.2With respect to steel reinforcement (As = 2Φ16 (ρ= 1.24) and As = 4Φ16 (ρ=2.48) at span of beams.
1- The concrete strains at ultimate loads (£u) when the increasing of angle of inclination (α) has a slight
effect on increasing the concrete strains as follows: From (α = 0.0°to 30°) the compared values were (11and 9%)
From (α = 30°to 45°) the compared values were (21and23 %)
From (α = 45°to 60°) the compared values were (26and 23%)
Finally the increasing inclination of angle from (α = 60°to90°) the compared values were (15and 11%) Shown
in fig (59).
4.8 Effect of stresses due to Mx and Mt.
Beams with cantilever have different in inclined cantilever (α) and main reinforcement ratio (ρ) in shear region or in flexural zone. Included in table (5) and shown in Fig (60) and (61).
Table (5): stresses due to bending moment (Mx) and torsion (Mt).
4.8.1 With respect to steel reinforcement As =2Φ16 (ρ= 1.24) at span of cantilever and beams
respectively:
4.8.1.1- The cracking stresses (σcr) when the increasing of angle of inclination (α)
from (α = 0.0°to 30°) the compared values were (7.4 and 22.7%)
From (α = 30°to 45°) the compared values were (17.4 and 21.9%)
From (α = 45°to 60°) the compared values were (45.8and 66.8 %)
Finally the increasing inclination of angle from (α = 60°to90°) the compared values were (56.3 and 53.4)
Shown in fig (60).
4.8.1.2- The ultimate stresses (σu) when the increasing of angle of inclination (α)
Behavior of R.C. beams with inclined cantilever
DOI: 10.9790/1684-12427496 www.iosrjournals.org 93 | Page
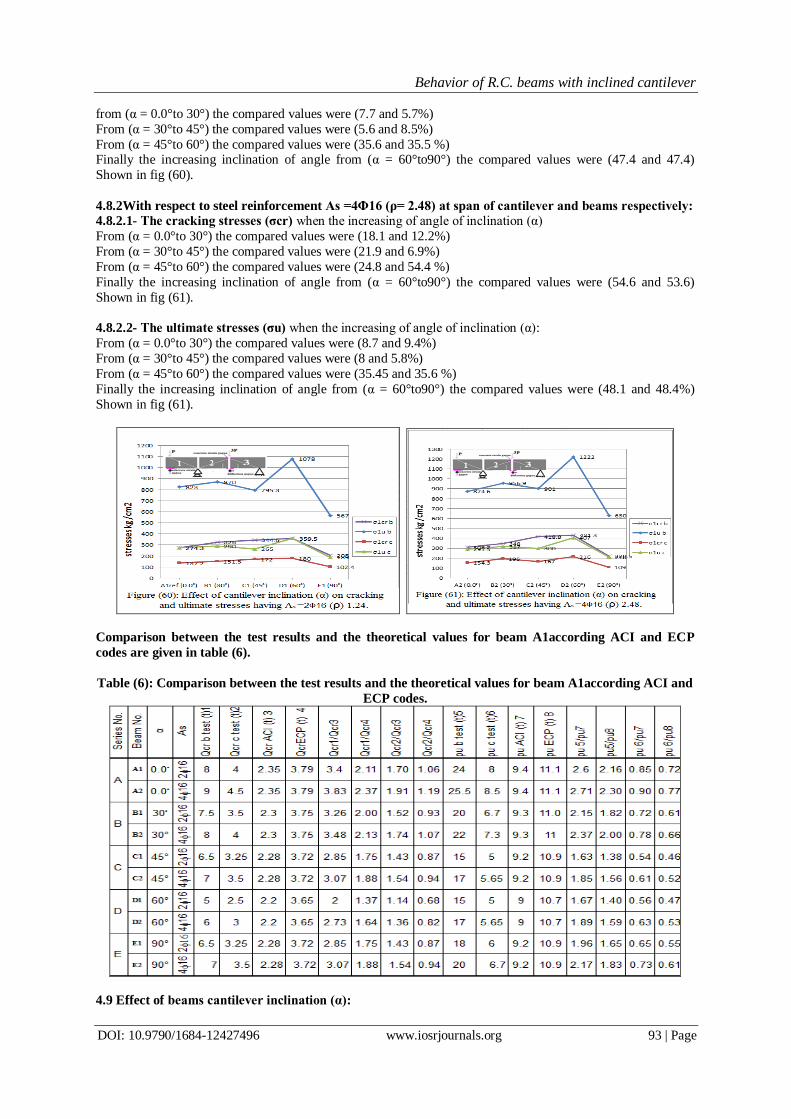
from (α = 0.0°to 30°) the compared values were (7.7 and 5.7%)
From (α = 30°to 45°) the compared values were (5.6 and 8.5%)
From (α = 45°to 60°) the compared values were (35.6 and 35.5 %) Finally the increasing inclination of angle from (α = 60°to90°) the compared values were (47.4 and 47.4)
Shown in fig (60).
4.8.2With respect to steel reinforcement As =4Φ16 (ρ= 2.48) at span of cantilever and beams respectively:
4.8.2.1- The cracking stresses (σcr) when the increasing of angle of inclination (α)
From (α = 0.0°to 30°) the compared values were (18.1 and 12.2%)
From (α = 30°to 45°) the compared values were (21.9 and 6.9%)
From (α = 45°to 60°) the compared values were (24.8 and 54.4 %)
Finally the increasing inclination of angle from (α = 60°to90°) the compared values were (54.6 and 53.6)
Shown in fig (61).
4.8.2.2- The ultimate stresses (σu) when the increasing of angle of inclination (α):
From (α = 0.0°to 30°) the compared values were (8.7 and 9.4%)
From (α = 30°to 45°) the compared values were (8 and 5.8%)
From (α = 45°to 60°) the compared values were (35.45 and 35.6 %)
Finally the increasing inclination of angle from (α = 60°to90°) the compared values were (48.1 and 48.4%)
Shown in fig (61).
Comparison between the test results and the theoretical values for beam A1according ACI and ECP
codes are given in table (6).
Table (6): Comparison between the test results and the theoretical values for beam A1according ACI and
ECP codes.
4.9 Effect of beams cantilever inclination (α):

Behavior of R.C. beams with inclined cantilever
DOI: 10.9790/1684-12427496 www.iosrjournals.org 94 | Page
4.9.1 With respect to steel reinforcement at span of beams having As =2Φ16 (ρ= 1.24)
4.9.1.1- The cracking loads (Qcr) when the increasing of angle of inclination (α) from the test results and the
predicted values by ACI Code and ECP equations respectively. From (α = 0.0°to 30°) the compared values were (6.25, 2.12 and 1.05%)
From (α = 30°to 45°) the compared values were (13.3, 0.87 and 0.8%)
From (α = 45°to 60°) the compared values were (23, 3.5 and 1.9 %)
Finally the increasing inclination of angle from (α = 60°to90°) the compared values were (30, 3.65 and 1. 9%)
Shown in fig (62).
4.9.1.2- The ultimate loads (Pu) when the increasing of angle of inclination (α) from the test results and the
predicted values by ACI. Code and ECP equations respectively.
From (α = 0.0°to 30°) the compared values were (16.7, 1.06 and 0.9%)
From (α = 30°to 45°) the compared values were (25, 1.07 and 0.9%)
From (α = 45°to 60°) the compared values were (25, 2.18 and 1.84 %) Finally the increasing inclination of angle from (α = 60°to90°) the compared values were (20, 2.2 and 1.87%)
Shown in fig (63).
4.9.2 With respect to steel reinforcement at span of beams having As =4Φ16 (ρ= 2.48) 1- The cracking loads (Qcr) when the increasing of angle of inclination (α) from the test results and the
predicted values by ACI. Code and ECP equations respectively.
From (α = 0.0°to 30°) the compared values were (11.1, 2.12 and 1.05%)
From (α = 30°to 45°) the compared values were (12.5, 0.87 and 0.8%)
From (α = 45°to 60°) the compared values were (14.3, 3.5 and 1.9 %)
Finally the increasing inclination of angle from (α = 60°to90°) the compared values were (16.7, 3.65 and
1. 9%) Shown in fig (64).
2- The ultimate loads (Pu) when the increasing of angle of inclination (α) from the test results and the
predicted values by ACI Code and ECP equations respectively.
From (α = 0.0°to 30
°) the compared values were (14, 1.06 and 0.9%)
From (α = 30°to 45°) the compared values were (29, 1.07 and 0.9%) From (α = 45°to 60°) the compared values were (constant, 2.18 and 1.84 %)
Finally the increasing inclination of angle from (α = 60°to90°) the compared values were (17.7, 2.2 and 1.87%)
Shown in fig (65).
4.9.3 With respect to steel reinforcement at span of cantilever having As =2Φ16 (ρ= 1.24)

Behavior of R.C. beams with inclined cantilever
DOI: 10.9790/1684-12427496 www.iosrjournals.org 95 | Page
4.9.3.1- The cracking loads (Qcr) when the increasing of angle of inclination (α) from the test results and the
predicted values by ACI. Code and ECP equations respectively.
From (α = 0.0°to 30°) the compared values were (12.5, 2.12 and 1.05%) From (α = 30°to 45°) the compared values were (7.1, 0.87 and 0.8%)
From (α = 45°to 60°) the compared values were (23, 3.5 and 1.9 %)
Finally the increasing inclination of angle from α = (60°to90°) the compared values were (30, 3.65 and 1. 9%)
Shown in fig (66).
4.9.3.2- The ultimate loads (Pu) when the increasing of angle of inclination (α) from the test results and the
predicted values by ACI. Code and ECP equations respectively.
From (α = 0.0°to 30°) the compared values were (16.25, 1.06 and 0.9%)
From (α = 30°to 45°) the compared values were (25.4, 1.07 and 0.9%)
From (α = 45°to 60°) the compared values were (constant, 2.18 and 1.84 %)
Finally the increasing inclination of angle from (α = 60°to90°) the compared values were (20, 2.2 and 1.87%) Shown in fig (67).
4.9.4 With respect to steel reinforcement at span of cantilever having As =4Φ16 (ρ= 2.48)
4.9.4. 1-The cracking loads (Qcr) when the increasing of angle of inclination (α) from the test results and the
predicted values by ACI Code and ECP equations respectively.
From (α = 0.0°to 30°) the compared values were (11.1, 2.12 and 1.05%)
From (α = 30°to 45°) the compared values were (12.5, 0.87 and 0.8%)
From (α = 45°to 60°) the compared values were (14.28, 3.5 and 1.9 %) Finally the increasing inclination of angle from (α = 60°to90°) the compared values were (16.7, 3.65 and
1. 9%) Shown in fig (68).
2- The ultimate loads (Pu) when the increasing of angle of inclination (α) from the test results and the
predicted values by ACI. Code and ECP equations respectively.
From (α = 0.0°to 30°) the compared values were (14.1, 1.06 and 0.9%)
From (α = 30°to 45°) the compared values were (22.6, 1.07 and 0.9%)
From (α = 45°to 60°) the compared values were (constant, 2.18 and 1.84 %)
Finally the increasing inclination of angle from (α = 60°to90°) the compared values were (18.6, 2.2 and 1.87%)
Shown in fig (69).
V. Conclusions

Behavior of R.C. beams with inclined cantilever
DOI: 10.9790/1684-12427496 www.iosrjournals.org 96 | Page
An experimental work was under taken to investigate the effectiveness of cantilever Inclination (α) and
longitudinal steel ratio (p) on the shear strength of reinforced concrete beams with cantilever under static loading. The following conclusions can be made from the experimental results.
(1) When the angle of cantilever beam (α) equal to (0.0) has a slight effect on increasing both the cracking and
ultimate loads.
(2) The increasing of angle of inclination from (30°to 45°) has a slight effect on decreasing both the cracking
and ultimate loads but have an important effect on the maximum deflections, maximum strains and the over
all stiffness of beams without any noticeable change in its mode of failure.
(3) The increasing of angle of inclination from (45°to 60°) has a slight effect on decreasing both the cracking
and ultimate loads but have an important effect on the maximum deflections, maximum strains and the over all stiffness of beams without any noticeable change in its mode of failure.
(4) The increasing of angle of inclination from (60 to 90) has a slight effect on increasing both the cracking and
ultimate loads but have an important effect on the maximum deflections, maximum strains and the over all
stiffness of beams without any noticeable change in its mode of failure.
(5) The maximum measured deflection increases, with the increase of the angle of inclination (α) Also the
cracking and ultimate deflection decrease.
(6) The addition of main longitudinal bars had a significant effect on the diagonal cracking load, and ultimate
load. (7) The ultimate shear strength is increased by the increase of main longitudinal bars.
(8) Horizontal reinforcement ratio has a pronounced effect in controlling torsion.
(9) The shear load (Qcr) was observed at zone (2) between the mid span load and the roller support. i.e.
(through the critical shear zone) equal to double shear load on the cantilever beams.
(10) The best values of results occurred at angle of cantilever inclination (α) for (α=45°) than other cases of the
tested beams.
(11) The values of the cracking shear strength of the tested beams show more save in comparison with the
corresponding recommended values given in ACI code equation and Egyptian code equation
References [1]. Arabic code for design and construction of concrete structure 2012.
[2]. ACI (318-83) Building Code Requirements for Reinforced concrete.
[3]. Frank Lloyd Wright preserving significance an Architect, his Innovation, and achieving the organic. [4]. Mashhour Ahmed Gohneim, design of reinforced concrete structures (volume 1) professor of concrete structures Cairo University.
Torsion CB110 and ACI318 codes compared.
الخرسانية الوسلحة رات الكىابيل الوائلة سلىك الكورات
اىيخض اىعشب
رىل ىذساست ذ حأثش (90,60,45,30)مابو ائيت بذسجت (0.0)حخاه ز اىشساىت دساست عيت ىعشش مشاث راث مابو سخقت
. ه اىنابى عي اىنشة ع اخخالف صات اىو
اىذف اىشئس زا اىبحث دساست اىسيك اىخاص باىنشاث راث اىنابو اىائيت رىل ححج حأثش االحاه االسخاحنت اىنبشة بذات
سبت حذذ اىخسيح اىشئس ف اىنشاث صات و : ا اىخغشاث اىخ ح دساسخا ف زا اىبحث . اىشحيت اىش خت بحذ االاس .اىنابى
جع اىنشاث ح حظعا حجضا ىالخخباس ححج حأثش حي االه اعي خظف اىنشة اىثا اعي طشف اىنابى حظو قخت ثيث قت
.2س/ مج250جع اىنشاث ح حظعا اىخشسات راث قات. اىحو عي اىنشة
:قذ اظشث اىخائج ا ي
.فا رىل ىت حاثش اضح عي صادة اقظ حو ف اىنشة اىنابى (0.0)ف حاىت صات و اىنابى حسا (1)
فا صىل ىت حاثش اضح عي قض قت االحاه عي اىنشة عي اىشغ صادة ق (60 اى 0.0)ف حاىت صادة صات و اىنابى (2)
.اىخشخ االفعاه ف اىنشة اىنابى
.بذاث قت االحاه عي اىنشة اىنابى ف اىضادة شة اخش (90 اى 60)ف حاىت صادة صات و اىنابى (3) .اىنشاث عي ق اقظ حو ف اضافت حذذ اىخسيح اىشئس ف اىنشاث ىت حاثش اضح عي اىششخ ( 4)
. اضافت حذذ اىخسيح اىجاب ف اىنشاث ىت حاثش اضح عي قات عض اىي(5)
.اقظ اجاد ىينشاث ضداد بضادة حذذ اىخسيح اىشئس (6)
:حطاث اىبحث اىذساست
عاىت اىقات ثو حأثش االىاف راث اىنابو اىائيت دساست ذ حأثش بعض اىعاو األخش عي سيك اىقض ىينشاث اىخشسات اىسيحت -1
. دسجت اىحشاسة اىشطبت
سن/ كجن1200دراسة نفس العىاهل الحالية هع استخذام أنىاع أخري هن الخرسانة عالية الوقاوهة والت تصل هقاوهتها إل -22
.
Top Related