


Languages
Pages
Legal


BeSmar
t
BeFast
BeConnecte
d
Be in
Control
Be What’s Next
Microsoft Business Intelligence
Yossi Elkayam , Sr. BI ConsultantMicrosoft [email protected]

Strategic Consulting
ArchitectureCloud Computing, BI, SharePoint, CRM, System Center, ALM, Private Cloud
Best PracticesDirectly from the Product Groups
Ensure the success of strategic IT initiatives
Microsoft Consulting Services

Smart
Data
SmartInsights
SmartActions
Smart
People
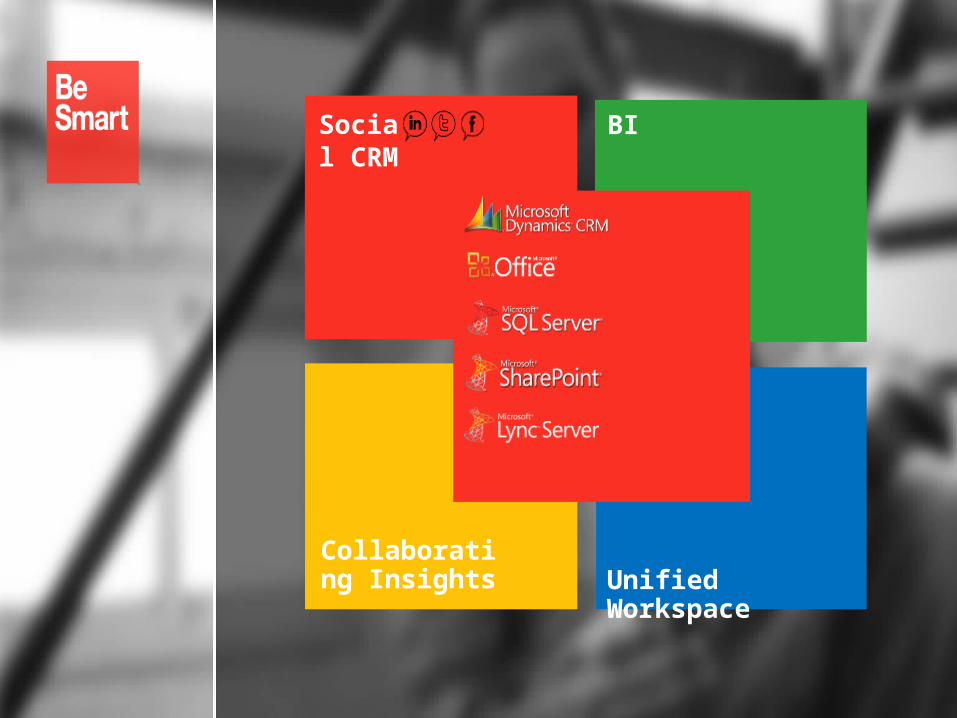
BISocial CRM
Collaborating Insights Unified
Workspace

• BI Current State – 2 minutes….
• BI - What’s next with SQL Server “Denali” – 43
minutes…

Category Metric
Largest single database 70 TB
Largest table 20 TB
Biggest total data 1 application
88 PB
Highest database transactions per second 1 db (from Perfmon)
130,000
Fastest I/O subsystem in production (SQLIO 64k buffer)
18 GB/sec
Fastest “real time” cube 5 sec latency
data load for 1TB 7 minutes
Largest cube 24 TB


• Complete and integratedBI and PerformanceManagement offering
• Agile products that adapt tohow your need the information
• Built on a trusted partof your IT backbone
Improving organizations by Improving organizations by providing business insights providing business insights to to allall employees leading to employees leading to
better, faster, more better, faster, more relevant decisionsrelevant decisions

Empowering End UserMicrosoft Business Intelligence Enhances Organizational Capabilities by Providing:
10
1. Analysis and query
2. Self-service reporting
3. Sharing and collaboration
4. Self Service Alerting (Denali)

And Business Intelligence Can Bring It All Together
Scorecards
Slide decks
Meetings
Analytic applications
Presentations
Financial reports
Dashboards
Webcasts
Charts and graphs
Internet
Project plans
Documents
Spreadsheets
Intranet
Blogs
Portals
RSS feeds
Business books
Television reportsMagazines
Newspapers
IM/chat
ScorecardsScorecards
Slide decksSlide decks
MeetingsMeetings
Analytic applicationsAnalytic applications
PresentationsPresentations
Financial reports Financial reports
DashboardsDashboards
WebcastsWebcasts
Charts and graphsCharts and graphsInternetInternet
Project plansProject plans
DocumentsDocuments
SpreadsheetsSpreadsheets
IntranetIntranet
BlogsBlogs
PortalsPortals
RSS feedsRSS feeds
Business booksBusiness books
Television reportsTelevision reports
MagazinesMagazines
NewspapersNewspapers
IM/chatIM/chat
EmailEmail

Excel 2010 and Excel ServicesExcel 2010 and Excel ServicesInteractive slicers enable users to look at the data from various directions in Excel 2010 and Interactive slicers enable users to look at the data from various directions in Excel 2010 and
in the browser through PowerPivot for SharePoint and Excel Services.in the browser through PowerPivot for SharePoint and Excel Services.


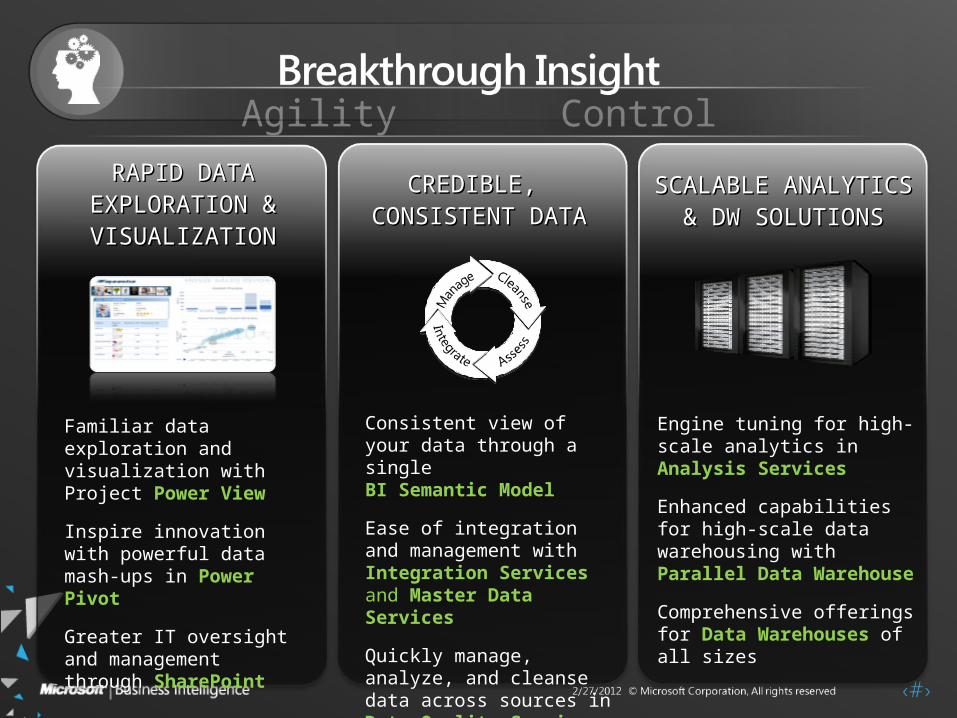
CREDIBLE, CREDIBLE, CONSISTENT DATACONSISTENT DATA
RAPID DATA RAPID DATA EXPLORATION & EXPLORATION & VISUALIZATIONVISUALIZATION
Consistent view of your data through a single BI Semantic Model
Ease of integration and management with Integration Services and Master Data Services
Quickly manage, analyze, and cleanse data across sources in Data Quality Services
SCALABLE ANALYTICS SCALABLE ANALYTICS & DW SOLUTIONS& DW SOLUTIONS
Engine tuning for high-scale analytics in Analysis Services
Enhanced capabilities for high-scale data warehousing with Parallel Data Warehouse
Comprehensive offerings for Data Warehouses of all sizes
Familiar data exploration and visualization with Project Power View
Inspire innovation with powerful data mash-ups in Power Pivot
Greater IT oversight and management through SharePoint
Agility Control

18

• SSIS Toolbox• Favorites and Common• Flexible Authoring in the Data Flow Designer
• Data Path Errors
• Resolve References Editor• Source and Destination Assistants
• Launching Source Assistant and Destination Assistant
• Undo and Redo• Collapsible Grouping in the Data Flow Designer• Simplified Data Viewer Configuration• Parameters , Variables , Project Parameters , Environment
Parameters• And more…


24© 2010 Microsoft Corporation. Microsoft Materials - Confidential. All rights reserved.

Batch Cleansing - Using SSIS
Source + Mapping
Data correction
Component
SSIS Package
Destination
DQS Server
Reference Data Services
Not CorrectNot Correct
Correct recordsCorrect records
Corrected recordsCorrected records
Suggested correctionSuggested correctionValues/Rules
Reference Data Definition
Matching Policy

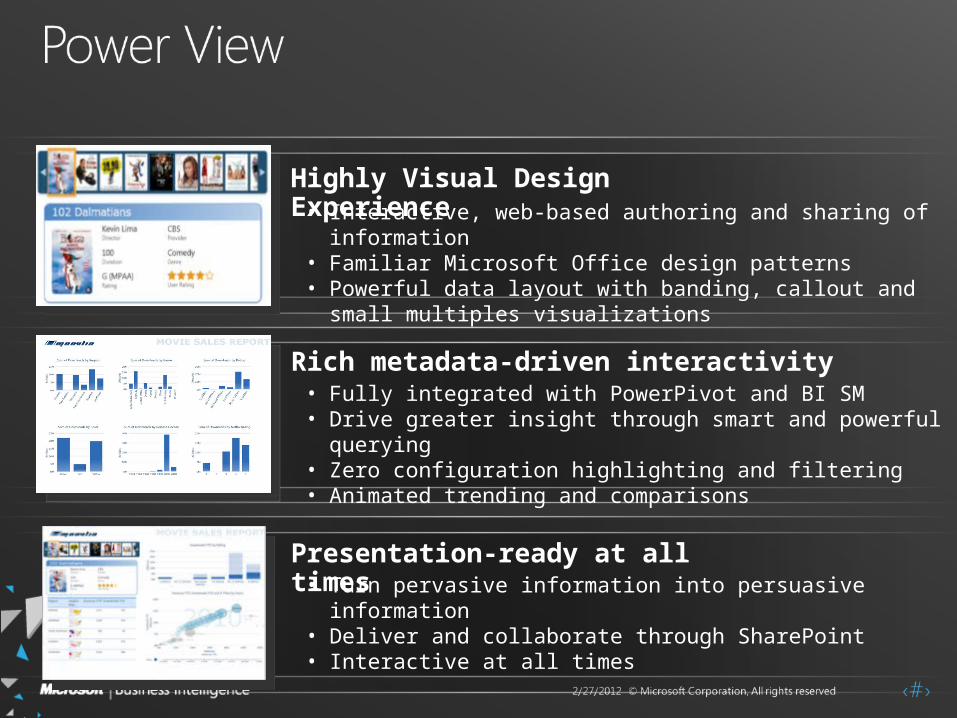
Highly Visual Design Experience
Presentation-ready at all times
Rich metadata-driven interactivity
• Turn pervasive information into persuasive information• Deliver and collaborate through SharePoint• Interactive at all times
• Fully integrated with PowerPivot and BI SM• Drive greater insight through smart and powerful querying• Zero configuration highlighting and filtering• Animated trending and comparisons
• Interactive, web-based authoring and sharing of information
• Familiar Microsoft Office design patterns• Powerful data layout with banding, callout and small
multiples visualizations


BeSmart
BeFast
BeConnecte
d
Be in
Control
Top Related