


Languages
Pages
Legal


1
Bayesian Networks of Customer Satisfaction Survey Data
Silvia Salini*
University of Milan, Italy
Ron S. Kenett
KPA Ltd., Raanana, Israel and University of Torino, Torino, Italy
Abstract: A Bayesian Network is a probabilistic graphical model that represents a set of variables and
their probabilistic dependencies. Formally, Bayesian Networks are directed acyclic graphs whose nodes
represent variables, and whose arcs encode the conditional dependencies between the variables. Nodes
can represent any kind of variable, be it a measured parameter, a latent variable or a hypothesis. They are
not restricted to representing random variables, which forms the "Bayesian" aspect of a Bayesian
network. Efficient algorithms exist that perform inference and learning in Bayesian Networks. Bayesian
Networks that model sequences of variables are called Dynamic Bayesian Networks. Harel et. al (2007)
provide a comparison between Markov Chains and Bayesian Networks in the analysis of web usability
from e-commerce data. A comparison of regression models, SEMs, and Bayesian networks is presented
Anderson et. al (2004). In this paper we apply Bayesian Networks to the analysis of Customer
Satisfaction Surveys and demonstrate the potential of the approach. Bayesian Networks offer advantages
in implementing models of cause and effect over other statistical techniques designed primarily for testing
hypotheses. Other advantages include the ability to conduct probabilistic inference for prediction and
diagnostic purposes with an output that can be intuitively understood by managers.
Keywords: Bayesian Networks, Customer Satisfaction, Eurobarometer, Service Quality
* Address for correspondence: Silvia Salini, Department of Economics, Business and Statistics. University of
Milan. Via Conservatorio 7. 20122 Milan Italy.
e-mail: [email protected]

2
1. Introduction
A Bayesian Network is a probabilistic graphical model that represents a set of variables and
their probabilistic dependencies. Formally, Bayesian Networks are directed acyclic graphs
whose nodes represent variables, and whose arcs encode the conditional dependencies
between the variables. Nodes can represent any kind of variable, be it a measured parameter, a
latent variable or a hypothesis. They are not restricted to representing random variables,
which forms the "Bayesian" aspect of a Bayesian network. Efficient algorithms exist that
perform inference and learning in Bayesian Networks. We begin with some theoretical
background on Bayesian Networks (BN) and proceed with two applications of BN to
customer satisfaction survey data analysis. The first example is from a survey of customers of
a complex electronic product combining software, electronics and mechanical features. The
product requires support at different levels and the survey is assessing satisfaction levels of
customers from different features of the product and related services. The second example is
from the Eurobarometer public opinion surveys conducted on behalf of the Directorate-
General for Education and Culture of the European Commission each Spring and Autumn.
We focus on four services: fixed telephone, electricity supply, gas supply, water supply and,
for each service, examine three aspects: accessibility, price and quality. we conclude with a
discussion and some direction for further research.
2. Theoretical Background: Bayesian Network
Bayesian networks, also known as Belief Networks belong to the family of probabilistic
Graphical Models (GM). These graphical structures are used to represent knowledge about an
uncertain domain. In particular, each node in the graph represents a random variable, while
the edges between the nodes represent probabilistic dependencies among the corresponding

3
random variables. These conditional dependencies in the graph are often estimated by using
known statistical and computational methods. Hence, Bayesian networks combine principles
from graph theory, probability theory, computer science and statistics.
Bayesian networks (BN) correspond to another GM structure known as a directed acyclic
graph (DAG) that is popular in the Statistics, the Machine Learning and the Artificial
Intelligence societies. BN are both mathematically rigorous and intuitively understandable.
They enable an effective representation and computation of the joint probability distribution
over a set of random variables (Pearl, 2000).
The structure of a directed acyclic graph is defined by two sets: the set of nodes (vertices)
and the set of directed edges. The nodes represent random variables and are drawn as circles
labelled by the variables names. The edges represent direct dependence among the variables
and are drawn by arrows between nodes. In particular, an edge from node Xi to node Xj
represents a statistical dependence between the corresponding variables. Thus, the arrow
indicates that a value taken by variable Xj depends on the value taken by variable Xi, or
roughly speaking that variable Xi 'influences' Xj. Node Xi is then referred to as a 'parent' of Xj
and, similarly, Xj is referred to as the 'child' of Xi. An extension of these genealogical terms is
often used to define the sets of 'descendents' – the set of nodes that can be reached on a direct
path from the node, or 'ancestors' nodes – the set of nodes from which the node can be
reached on a direct path. The structure of the acyclic graph guarantees that there is no node
that can be its own ancestor or its own descendent. Such a condition is of vital importance to
the factorization of the joint probability of a collection of nodes as seen below. Note that
although the arrows represent direct causal connection between the variables, the reasoning
process can operate on BN by propagating information in any direction.
A Bayesian network reflects a simple conditional independence statement. Namely that each
variable is independent of its non-descendents in the graph given the state of its parents. This

4
property is used to reduce, sometimes significantly, the number of parameters that are
required to characterize the joint probability distribution (JPD) of the variables. This reduction
provides an efficient way to compute the posterior probabilities given the evidence (Lauritzen
et al, 1988, Pearl, 2000, Jensen, 2001).
In addition to the DAG structure, which is often considered as the "qualitative" part of the
model, one needs to specify the "quantitative" parameters of the model. The parameters are
described in a manner which is consistent with a Markovian property, where the conditional
probability distribution (CPD) at each node depends only on its parents. For discrete random
variables, this conditional probability is often represented by a table, listing the local
probability that a child node takes on each of the feasible values – for each combination of
values of its parents. The joint distribution of a collection of variables can be determined
uniquely by these local conditional probability tables (CPT).
Formally, a Bayesian network B is an annotated acyclic graph that represents a joint
probability distribution over a set of random variables V. The network is defined by a pair
Θ= ,GB , where G is the directed acyclic graph whose nodes nXXX ,...,, 21 represents
random variables, and whose edges represent the direct dependencies between these variables.
The graph G encodes independence assumptions, by which each variable iX is independent
of its non-descendents given its parents in G. The second componentΘ denotes the set of
parameters of the network. This set contains the parameter ( )iiBx xPii
πθ π = for each
realization ix of iX conditioned on iπ , the set of parents of iX in G. Accordingly, B defines
a unique joint probability distribution over V, namely:
( ) ( )iiX
niiiB
ninB XPXXXP πθπ 1121 ,...,, == ∏=∏=
For simplicity of representation we omit the subscript B henceforth.
If Xi has no parents, its local probability distribution is said to be unconditional, otherwise it is

5
conditional. If the variable represented by a node is observed, then the node is said to be an
evidence node, otherwise the node is said to be hidden or latent.
The complexity of a domain may be reduced by models and algorithms that describe an
approximated reality. When variable interactions are too intricate for application of an
analytic model, we may represent current knowledge about the problem, such as a cause
generating at least one effect (Pearl, 2000), where the final effect is the target of the analysis;
for example in Figure 1 the network topology (Lauritzen and Spiegelhalter, 1988) of cause
and effect is built by choosing a set of variables (i.e. “Visit Africa”, “Smoking”) that describe
the domain (a patient presents some problems and the physician wants to identify his/her
disease and the correct therapy).
The domain knowledge allows experts to draw an arc to a variable from each of its direct
causes (i.e. visiting Africa may cause tuberculosis).
Given a BN that specified the JPD in a factored form, one can evaluate all possible
inference queries by marginalization, i.e., summing out over 'irrelevant' variables. Two types
of inference support are often considered: predictive support for node iX , based on evidence
nodes connected to Xi through its parent nodes (called also top-down reasoning), and
diagnostic support for node iX , based on evidence nodes connected to iX through its
children nodes (called also bottom-up reasoning). In general, the full summation (or
integration) over discrete (continuous) variables is called exact inference and known to be an
NP-hard problem. Some efficient algorithms exist to solve the exact inference problem in
restricted classes of networks. In many practical settings the BN is unknown and one needs to
learn it from the data. This problem is known as the BN learning problem, which can be stated
informally as follows: Given training data and prior information (e.g., expert knowledge,
causal relationships), estimate the graph topology (network structure) and the parameters of
the JPD in the BN.

6
Learning the BN structure is considered a harder problem than learning the BN parameters.
Moreover, another obstacle arises in situations of partial observablity when nodes are hidden
or when data is missing. In the simplest case of known BN structure and full observability, the
goal of learning is to find the values of the BN parameters (in each CPD) that maximize the
(log)likelihood of the training dataset. This dataset contains m cases that are often assumed to
be independent. Given training dataset { }mxxΣ ,...,1111
= , where ( )Tlnl x,...,x 1=lx , and the
parameter set ( )nθθΘ ,...,1111
= , where iθ is the vector of parameters for the conditional
distribution of variable iX (represented by one node in the graph), the log-likelihood of the
training dataset is a sum of terms, one for each node:
( ) ( )iilim nxPL θπ , loglog ∑ ∑=ΣΘ
The log-likelihood scoring function decomposes according to the graph structure, hence, one
can maximize the contribution to the log-likelihood of each node independently. Another
alternative is to assign a prior probability density function to each parameter vector and use
the training data to compute the posterior parameter distribution and the Bayes estimates. To
compensate for zero-occurrences of some sequences in the training dataset, one can use
appropriate (mixtures of) conjugate prior distributions, e.g., the Dirichlet prior for the
multinomial case as in the above backache example or the Wishart prior for the Gaussian
case. Such an approach results in a maximum a-posteriori estimate and known also as the
equivalent sample size (ESS) method.
============================================================
Figure 1: An example of a causal network (Lauritzen and Spiegelhalter, 1988).
=============================================================
Bayesian Networks are gaining popularity within a wide range of application areas such as
risk management (Cornalba et al, 2007), web data analysis (Harel et al, 2008) and
management science in general (Rugerri et al, 2007, Kenett et al, 2008). Availability of

7
software for analyzing Bayesian Networks is further expanding their role in decision analysis
and decision support systems (Jensen, 2001).
3. Application to Customer Satisfaction Data Analysis
3.1. The Annual Customer Satisfaction Survey
In this Section a BN is implemented in order to analyze customer satisfaction survey data
from a complex electronic product combining software, electronics, and mechanical features,
The product requires support at different levels. The survey is assessing satisfaction levels of
customers from different features of the product and related services. An important issue in
product customer satisfaction surveys is to find which aspects of the product and services
influence overall satisfaction, the recommendation levels and the repurchasing intentions. BN
is a useful tool to analyze such impact with the advantage that it produces graphical output
that are easy to understand and make it simple to conduct probabilistic inference for
prediction.
In order to show these advantages, a BN has been applied to data collected from 266
companies (customers) participating in an Annual Customer Satisfaction Survey. The data
refers to a questionnaire composed of 81 questions. The dataset and the questionnaire are
available on http://www.economia.unimi.it/projects/CSProject/.
For each customer we have several demographic variables such as: Country, Segmentation,
Age of equipment and Profitability.
A basic frequency analysis shows that the majority of customers come from Germany, do
not belong to a specific industry sector and have a Break-Even Profitability; while age of
equipment and customer seniority have an heterogeneous distribution.
The first part of the questionnaire evaluates Overall Satisfaction, with a score going from 1
(very low satisfaction) to 5 (very high satisfaction) and two specific variables (questions): 1)

8
repurchasing intention and recommendation level measured with a score going from 1 (very
unlikely) to 5 (very likely). We observe that 64.9% are very likely to repurchase products.
In the second part of the questionnaire, there is a set of questions (items) grouped according
to different dimensions: Equipment, Sales Support, Technical Support, Training, Supplies and
Media,, Customer Portal, Administrative Support, Terms-Conditions and Prices and Site
Planning and Installation. For each question we have two types of scores: the item evaluation
score, going from 1 (Strongly disagree) to 5 (Strongly agree), and the item importance level
(low=1, medium=2, high=3, and Not Applicable). For each dimension, there is an overall
evaluation. The dimension with the highest level of satisfaction is Training and the one with
the lowest level is Terms-Condition and Prices. We consider the overall evaluation for each
dimensions.
The data is analyzed with a basic BN presented in Figure 2. The network combines
background information with a learned network generated using the Greedy Thick Thinning
algorithm implemented in the GeNIe version 2.0 software (http://genie.sis.pitt.edu).
============================================================
Figure 2: Bayesian Network from Customer Satisfaction Survey data
============================================================
Note that the dimensions that influence Overall Satisfaction, Recommendation level and
Repurchasing intention are Suppliers, Equipment and Technical Support. The other
dimensions appear independent to each other. Moreover Overall Satisfaction,
Recommendation and Repurchasing are influenced by the country of the customer. A bar plot
representation of the nodes of the BN is shown in Figure 3.
============================================================
Figure 3: Bar chart of Bayesian Network on Customer Satisfaction Survey data
=============================================================

9
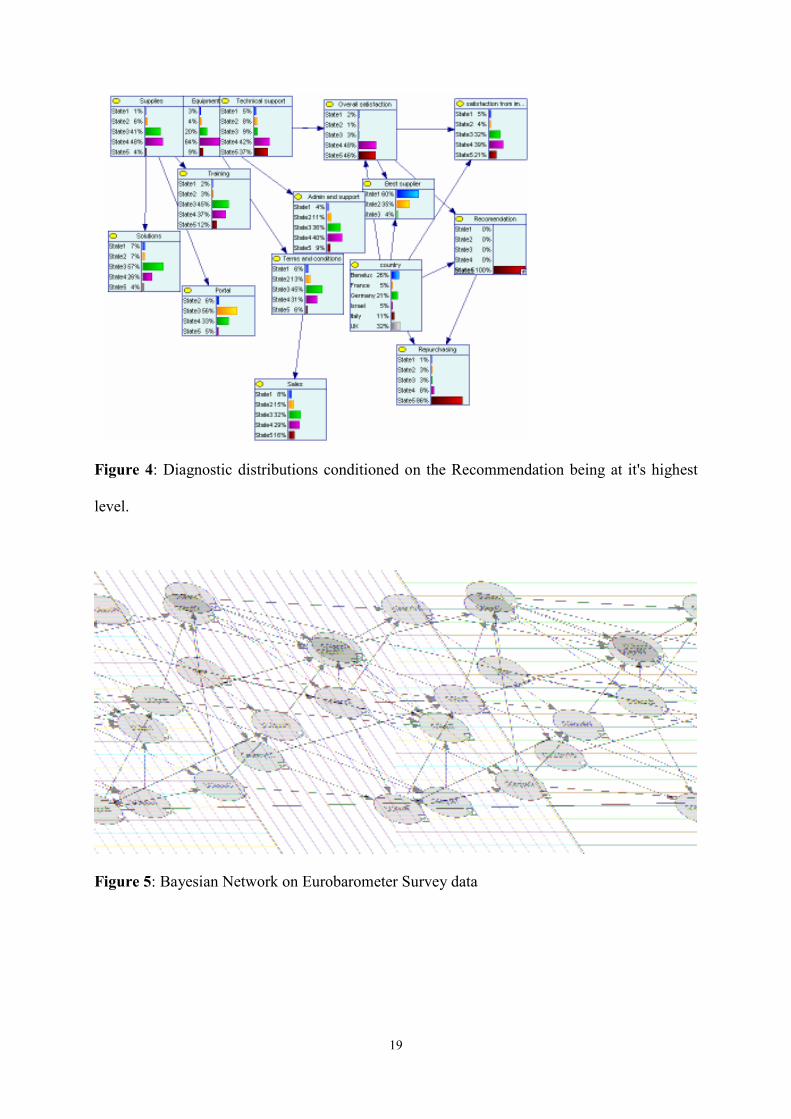
On the basis of the network we can perform various diagnostic checks. Figure 4 presents
distributions of various variables conditioned on the Recommendation being at it's highest
level.
============================================================
Figure 4: Diagnostic distributions conditioned on the Recommendation being at its highest
level.
=============================================================
It is important to observe that Overall Satisfaction and Repurchasing change in the same
direction than Recommendation. Note also that the percentages of Technical Support are 7%,
13%, 16%, 38% and 26% in Figure 3 and 5%, 8%, 9%, 42% and 37% in Figure 4, so high
level of Recommendation correspond to high satisfaction level from Technical Support. This
information has a practical relevance, an intervention to improve the Technical support may
increase Repurchase, Recommendation and Overall Satisfaction.
3.2. Service Quality: Europeans Opinion about Utilities
In this Section we use BNs to analyse the opinion of Europeans about Utilities that emerges
from Eurobarometer Survey. The satisfaction of citizen depends on the country macro
variables, on the year considered, on the privatization level of the service, on the social and
demographical characteristics of the consumer (Fiorio et. al 2007). Moreover various aspects
of service can be evaluated in different way and can influenced each other. The same services
do not seem to be independent between them, in fact they have been proposals for indices of
total satisfaction that combine the services (Ferrari and Salini, 2007). In this complex
situation, characterized by a high number of variable, with nonlinear relationships and
combined dependencies, a BN is an appropriate model. Again, BNs provide a causal
explanation using observable variables within a single multivariate model and analysis of
nonlinear relationships contained in ordinal measurements.

10
In the next subsection we present the Eurobarometer Survey data. In the second part we
construct a BN analysis and comment on the results.
3.2.1. Eurobarometer Survey Data
Eurobarometer public opinion surveys (henceforth, EB) have been conducted on behalf of
the Directorate General for Education and Culture of the European Commission each Spring
and Autumn, since the Autumn of 1973. They have included Greece, since the Autumn of
1980, Portugal and Spain, since the Autumn of 1985, the former German Democratic
Republic, since the Autumn of 1990 and Austria, Finland and Sweden, from the Spring of
1995 onwards.
An identical set of questions is asked to a representative sample of the population over
fifteen years old in each Member State. In each household, the respondent is drawn at
random. All interviews are face-to-face in people's homes and in the appropriate national
language. A detailed analysis of the Eurobarometer data can be found on the official
Eurobarometer Web site.1 The questions concern various aspects, including support and
benefit for EU membership, support for an EU constitution, satisfaction with EU democracy
and the single currency, general outlook on life and so on.
The regular sample in standard Eurobarometer surveys is 1000 people per country except
Luxembourg (600) and the United Kingdom (1000 in Great Britain and 300 in Northern
Ireland). In order to monitor the integration of the five new Länder into unified Germany and
the European Union, 2000 persons have been sampled in Germany since the Eurobarometer
34: 1000 in East Germany and 1000 in West Germany.
In each of the 15 Member States, the survey is carried out by national institutes associated
with the “INRA (Europe) European Coordination Office”. This network of institutes was
1 http://europa.eu.int/comm/public_opinion/

11
selected by tender. All institutes are members of the “European Society for Opinion and
Marketing Research” (ESOMAR) and comply with its standards.
Each survey comes with a set of weights obtained, using marginal and intercellular
weighting, carried out on the basis of the population description provided by EUROSTAT in
the Regional Statistics Yearbook (data for 1997 or 1996).
In the years 2000, 2002 and 2004 the Eurobarometer surveys included some questions
relating to Services of General Interest (henceforth, SGI). The SGI considered are mobile
telephone services, fixed telephone services, electricity supply services, gas supply services,
water supply services, postal services, transport services within towns/cities and rail services
between towns/cities. The criteria used to analyse these services are accessibility, the price of
the services, the quality of the services, the clarity of the information aimed at EU Consumers,
how fair the terms and conditions of the contracts applied to the services are, Consumer
complaints and how they are handled and Customer Service.
In this application we consider four Services: fixed telephone, electricity supply, gas supply,
water supply and, for each service, examine three aspects: accessibility, price and quality.
The data from three years (2000, 2002, 2004) is pooled, and the analysis is carried out on the
entire data set in order to obtain a comparison between countries and years. Hence the final
data set is structured in the following way: the rows (near 47.000) represent the respondents
belonging to different Countries (near 15.000 for each year in each question), the columns
refer to items (12 dimensions): the accessibility of the fixed telephone service (SGIaccT), the
accessibility of the electricity supply service (SGIaccE), the accessibility of the gas supply
service (SGIaccG), the accessibility of the water supply (SGIaccW), the price of the fixed
telephone service (SGIpriT), the price of the electricity supply service (SGIpriE), the price of
the gas supply service (SGIpriG), the price of the water supply (SGIaccW), the quality of the
fixed telephone service (SGIquaT), the quality of the electricity supply service (SGIquaE), the

12
quality of the gas supply service (SGIquaG), the quality of the water supply (SGIquaW). We
have three levels for accessibility (not accessible, difficult to access, easy to access), three
levels for price (excessive, unfair, fair) and four levels for quality (very bad, fairly bad, fairly
good, very good).
3.2.2. Bayesian Network on Eurobarometer Data
The data was analyzed using a basic BN presented in Figure 5 The network combines
background information with a learned network generated using the Greedy Thick Thinning
algorithm implemented in the GeNIe version 2.0 software.
============================================================
Figure 5: Bayesian Network on Eurobarometer Survey data
============================================================
It is important to notice that "country" seems to influence only electricity supply service,
which affects all the other services. "Year" influences electricity supply service and fixed
telephone service. Relating to the aspects of service, accessibility is connected to quality and
price and quality is connected to price for all services. Moreover, it is evident that services are
not independent from each other. Looking as an example to the price of fixed telephone
service (SGIpriT), it also depends on access, quality and price of all the other services. A bar
plot representation of the node of BN is shown in Figure 6.
============================================================
Figure 6: Bar plot BN on Eurobarometer Survey data
============================================================
One the basis of the network, as in the previous case, we can perform various diagnostic
checks. Figures 7 and 8 present distributions of various variables conditioned on the Country,
Italy and Ireland respectively.

13
============================================================
Figure 7: Evidence for Italy
=============================================================
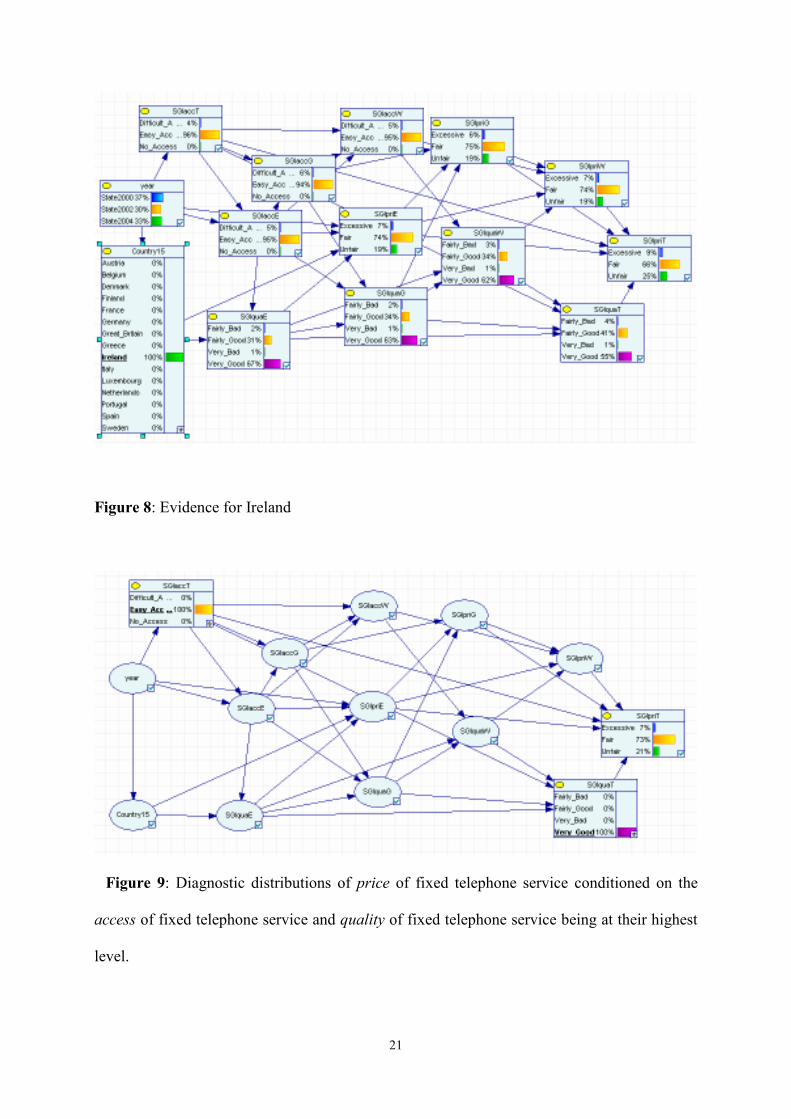
============================================================
Figure 8: Evidence for Ireland
============================================================
Generally, the opinion in Ireland is better than in Italy. For example the percentage of "Fair"
for the price of gas service is 75% in Ireland versus 52% for Italy. Also for the price of fixed
telephone, 66% "Fair" in Ireland and 46% in Italy. For the quality of water, it happens that
only the 19% of Italian think that it is "very good" versus 62% in Ireland. Figure 9 presents
distributions of price of fixed telephone conditioned on the quality and access of fixed
telephone being at their highest level.
============================================================
Figure 9: Diagnostic distributions of price of fixed telephone service conditioned on the
access of fixed telephone service and quality of fixed telephone service being at their highest
level.
=============================================================
Good quality and easy access positively influence the opinion about price, in fact the
distribution of price of fixed telephone service change from 58% of Fair, 31% of Unfair and
11% of Excessive (see Figure 6) to 73% of Fair, 21% of Unfair and 7% of Excessive. This is
importance evidence for suppliers and legislators. Figure 10 presents distributions of price of
fixed telephone conditioned on the price of the other services being at its highest level.
Unfair prices on the other services make to get worse the judgment on prices also of the
fixed telephone. Probably the dissatisfaction generates a hostile climate and greater
expectations. With 100% of prices considered "unfair" in the other services, the distribution of

14
price considerations of fixed telephone will be 19% as Fair, 76% of Unfair and 5% of
Excessive.
============================================================
Figure 10: Diagnostic distributions of price of fixed telephone service conditioned on the
price of electricity supply service, price of water supply service and price of gas supply
service being at their lowest level
============================================================
4. Conclusions
Bayesian Networks have been rarely used so far in analyzing customer satisfaction data. In
this paper we demonstrate the advantages of the approach and, hopefully, raise awareness to
such possibilities. Other techniques include Rasch models, Decision Trees, Structural
Equation Models, Neural Networks and Analytical Hierarchical Processes. Hopefully this
paper will trigger further research and applications of such techniques in analyzing data from
customer satisfaction surveys.
Acknowledgements
The Eurobarameter data for this work has been provided by the 6th Framework Programme
project Understanding Privatisation Policy: Political Economy and Welfare Effects of the
European Union. The ABC customer satisfaction survey data is from a benchmarking project
initiated in 2005 by the authors and several other partners from the University of Torino under
the Diego de Castro foundation, to promote the application of advanced statistical techniques
to the analysis of customer satisfaction data. for more on the project look at
http://www.economia.unimi.it/projects/CSProject%20/.

15
References
Cornalba, C., Kenett, R. and Giudici, P. (2007) "Sensitivity Analysis of Bayesian Networks
with Stochastic Emulators", ENBIS-DEINDE proceedings, University of Torino, Turin,
Italy.
Cowell, R.G., Dawid, A. P., Lauritzen S.L., & Spiegelhalter D.J. (1999). Probabilistic
Networks and Expert Systems. New York, USA: Springer.
Ferrari P.A. and Salini S. (2007), Measuring Service Quality: the opinion of Europeans about
Utilities, FEEM working papers, Milan, Italy.
Fiorio C.V., Florio M., Salini S., Ferrari P.A. (2007), Consumers’ Attitudes on Services of
General Interest in the EU: Accessibility, Price and Quality 2000-2004 - In: Servizi
Pubblici: Nuove Tendenze nella Regolamentazione, nella Produzione e nel Finanziamento ;
[a cura di] M. Marrelli, F. Padovano, I. Rizzo. - [s.l.] : Franco Angeli.
Harel, A. Kenett, R. and Ruggeri, F. (2008) "Modeling Web Usability Diagnostics on the
basis of Usage Statistics" in Statistical Methods in eCommerce Research, W. Jank and G.
Shmueli editors, Wiley.
Heckerman, D., (1995). A tutorial on learning with Bayesian networks. Microsoft Research
tech. report MSR-TR-95-06. Revised November 1996, from http://research.microsoft.com.
Jensen , F.V., (2001). Bayesian networks and decision graphs. New York, USA: Springer.
Kenett, R.S. (2006). "On the Planning and Design of Sample Surveys", Journal of Applied
Statistics Vol. 33, No. 4, 405–415.
Kenett, R., De Frenne, A., Tort-Martorell, X. and McCollin, C. (2008), The Statistical
Efficiency Conjecture, to appear in Applying Statistical Methods in Business and Industry –
the state of the art, Coleman, S., Greenfield, T., and Montgomery, D. (editors), Wiley.

16
Lauritzen, S.L. (1995). The EM algorithm for graphical association models with missing
data. Computational Statistics and Data Analysis 19, 191–201.
Lauritzen, S. L., Spiegelhalter, D. J. (1988), "Local computations with probabilities on
graphical structures and their application to expert systems". Journal of the Royal
Statistical Society, Series B (Methodological), 50(2):157-224.
Murphy K.P. (2001). An introduction to graphical models. A Brief Introduction to Graphical
Models and Bayesian Networks . May 10, from http://www.cs.ubc.ca.
Pearl, J. 91995) Causal diagrams for empirical research, Biometrika, 1995, pp. 669-710.
Pearl, J. (2000) Causality: Models, Reasoning, and Inference, Cambridge University Press
Rugerri, F., Kenett, R. and Faltin F. (2007). The Encyclopaedia of Statistics in Quality and
Reliability, Wiley.

17
Figure 1: An example of a causal network (Lauritzen and Spiegelhalter, 1988).

18
Figure 2: Bayesian Network from Customer Satisfaction Survey data
Figure 3: Bar chart of Bayesian Network on Customer Satisfaction Survey data
19
Figure 4: Diagnostic distributions conditioned on the Recommendation being at it's highest
level.
Figure 5: Bayesian Network on Eurobarometer Survey data

20
Figure 6: Bar chart Bayesian Network on Eurobarometer Survey data
Figure 7: Evidence for Italy
21
Figure 8: Evidence for Ireland
Figure 9: Diagnostic distributions of price of fixed telephone service conditioned on the
access of fixed telephone service and quality of fixed telephone service being at their highest
level.

22
Figure 10: Diagnostic distributions of price of fixed telephone service conditioned on the
price of electricity supply service, price of water supply service and price of gas supply
service being at their lowest level

23
Silvia Salini holds a degree in Statistics from Catholic University of Milan and Phd in
Statistics from University of Milan Bicocca. Currently she is Assistant Professor of Statistics
at the Department of Economics, Business and Statistics of the University of Milan. Her main
research interests are multivariate statistical analysis, data mining and statistical for social
science.
Department of Economics, Business and Statistics,
University of Milan. Via Conservatorio 7, 20122 Milan (Italy)
Email: [email protected]
Tel. +39(0)2 503 21538
Fax +39(0)2 503 21450
Ron S. Kenett is CEO of KPA Ltd., a management consulting firm with offices in Raanana,
Israel and Professor at the University of Turin, Turin, Italy. He has written 4 books on
applications of Statistics, is an Editor in Chief of the Wiley Encyclopaedia of Statistics in
Quality and Reliability and published over 130 papers in scientific journals. His main research
interests are multivariate analysis, industrial statistics, strategic analysis models, change
management and risk management. Ron is past president of ENBIS, the European Network of
Business and Industrial Statistics and Fellow of the Royal Statistical Society.
KPA Ltd., P.O.Box 2525,
Raanana 43100, ISRAEL
Email: [email protected]
Phone:+972(0)97408442
Fax: +972(0)97408443
Top Related