


Languages
Pages
Legal


Market Outlook Updates
& Commodities Tactical Allocation:
Base/Precious Metals, Energy, Agri
Robert P. Balan, Senior Market Strategist
Alessandro Gelli, Energy Analyst
Marion Megel, Base/Precious Metals Analyst
Created: May 28, 2012 v.1

2 DCM SA is authorised and regulated by the Swiss Financial Market Supervisory Authority (FINMA).
DCM UK LLP is authorised and regulated by the FSA
Please refer to the risk and legal disclaimer at the end of the document.
Summary of Key Market Views
Copper, crude oil, SPX troughs looking for confirmation soon
� EQUITIES: S&P 500 Index® may have found a trough near 1300. SPX could slowly rise from here, build a base as Greece goes into another election by mid-June, and the EU may implement fiscal measures after a June 28 summit. We expect a new SPX high sometime in July, but Q3 might be a weak period.
� BONDS: The 10yr Treasury yield may have completed a pullback lower to-wards the 1.67% base. Yields should be broadly higher thereafter and could rise towards 2.20% - 2.40% in the medium-term.
� CURRENCIES: DXY did rise to circa 82.00, but breach of 81.00 indicates a new decline phase. We keep our modal forecast that extension of risk-taking will have the DXY falling again to the area of 74.00—73.00 in the longer-term.
� BASE METALS: Copper finds a base near $7500 and probably heads for $9000—$9200 by late July. But later-than-expected China stimulus implemen-tation may help find these targets by year-end.
� PRECIOUS METALS: Gold may have bottomed near $1525 then may head back up for another test of $1800 by year-end, or by Q1 2013 if central bank stimulus comes later than expected.
� AGRICULTURE: July Corn did stabilize above 550 area. Corn is getting some benefit from resurgent wheat prices, and is heading for 700 –750.
� ENERGY: June Brent is still looking for confirmation with a move above $110/bbl., then may rally towards $120.00/bbl further out. Our more optimis-tic $127.00/bbl—$132/bbl targets may have to wait for year-end or Q1 2013.

3 DCM SA is authorised and regulated by the Swiss Financial Market Supervisory Authority (FINMA).
DCM UK LLP is authorised and regulated by the FSA
Please refer to the risk and legal disclaimer at the end of the document.
Summary - Global Outlook/Markets
Eurozone, China slowdown key issues; ECB may wait till July
Global markets are being driven primarily by European events and, to a lesser ex-tent, by the evolution of the Chinese slowdown, and concerns of a possible hard-landing. The near-term outlook for Europe appears cloudy. The markets’ main concern is the possibility that after Greek presidential elections on June 17, an ex-treme leftwing coalition headed by the Syriza party is formed and decides to can-cel austerity polices, renege on plans to reduce public employment, and default (again) on debt. The recent opinion polls show a new sentiment tilt towards the pro-memorandum factions led by the New democracy (ND), which now lead.
Beyond Europe, China is also a source of global uncertainty. Currently, the coun-try is going through a moderate slowdown. The recent battery of data was the weakest since 2009 and certainly below market expectations. Flash manufacturing PMI released on last week suggested weak demand coming from the external sec-tor. However, absent a crash in Europe we do not think China is heading toward a hard landing. Indeed, we expect economic activity to pickup in Q2. Probably the most important factor behind our view is that part of the slowdown has been poli-cy-induced as authorities battle real-estate bubble and overheating in general. Po-licymakers have the tools to reverse tightening. Various finetuning measures were implemented as early as March and we expect more in the near future.
The ECB is conducting a comprehensive review of all its policy tools and has no immediate plans to increase stimulus. The review intends to assess the effective-ness of its measures, including the SMP bond-buying program and long-term refi-nancing operations LTRO. The review is scheduled to be completed in June or Ju-ly. The ECB may not consider taking any further policy action until July as they will await the outcome of the next Greek election, and also want to see the central bank's new economic projections in June and a European Banking Authority re-port on bank recapitalizations, which is due to be published at the end of June.

4 DCM SA is authorised and regulated by the Swiss Financial Market Supervisory Authority (FINMA).
DCM UK LLP is authorised and regulated by the FSA
Please refer to the risk and legal disclaimer at the end of the document.
Eurozone GDP to contract again; BoE may ease; BoJ on hold
� The latest set of euro area business activity data for May suggest that, after the stable GDP recorded in Q1, euro area GDP is likely to contract again in Q2. This is apparent, for example, in considering indicators which imply that the current level of confidence in Germany is consistent with around stable GDP, while signalling that French GDP is at risk of contracting in Q2. Behind the deterioration in business confidence is likely to be greater uncertainty and financial market pressures. Such pressures have clearly emanated from a re-appraisal by businesses and investors of the risk that Greece could leave the euro, possibly in the near term.
� The minutes of the UK May MPC meeting showed that David Miles was the only dissenter, voting to extend QE by £25bn, while the rest of the committee thought that “no further asset purchases were necessary at this point”. The decision was described as “finely balanced”, but we believe that QE will be extended unless there is a further marked improvement in the economic out -look. Although the latter cannot be ruled out, given the risks emanating from the euro area, we do consider that further QE is something to expect in the near-term. The recent news on the economy has strengthened the case for more monetary support. CPI inflation fell more than expected in April, to 3.0% y/y (from 3.5%), and Q1 GDP growth was revised down, with the eco-nomy now estimated to have contracted 0.3% q/q (-0.1% y/y).
� The BoJ was clear in its assessment of current conditions: “It has become in-creasingly evident that Japan's economy is shifting toward a pick-up phase” – wording first introduced on 27 April and subsequently supported by strong Jan-Mar GDP figures. We see that assessment of imminent growth and be-lieve this week’s data, both hard and soft, lend support to such a view. Unless growth takes another dive, the BoJ may not be in an easing mood near-term.
Summary - G7 (ex-US) Economy/Macro

5 DCM SA is authorised and regulated by the Swiss Financial Market Supervisory Authority (FINMA).
DCM UK LLP is authorised and regulated by the FSA
Please refer to the risk and legal disclaimer at the end of the document.
Summary - China/Emerging Markets
China HSBC flash PMI weakens; most of EM Asia GDP rose
� The China HSBC Flash Manufacturing PMI retreated to 48.7 in May from the final April reading of 49.3 (March: 48.3). The production index rose to a se-ven-month high of 50.5 from 49.3, suggesting some recovery in activity among SMEs. However, the new export orders index fell to 47.8 from 50.2, pointing to further weakness in external demand and export growth.
� China economic activity may have remained soft in May. Media reported weak new lending by the four largest banks during the first 20 days of May. There are however signs of increase in new medium- to long-term corporate loans, which will be a key to watch for a further pick-up in infrastructure in-vestment growth, which is already apparent in some industries (chart above).
� It should also be noted that, while the China overall macro picture is much better than it was in 2008-09, the latest slowdown has been uneven across in-dustries, as a result of divergent policies. Also, expect the recovery to be une-ven. The government is maintaining the restrictions on home purchases and sectors that suffer from overcapacity. On the other hand, it has rolled out poli-cies to support energy-saving consumption and industries, as well as to en-courage first-home purchases and speed up infrastructure investment.
� Most of EM Asia has reported Q1 GDP which was generally better than ex-pected. The consistent theme was an increase in investment, as the global backdrop and market conditions improved. Across the region, household consumption generally picked up, given relatively healthy labor markets and positive wealth effects from the Q1 rally in equity markets. However, strong domestic demand amid continued weakness in exports (due to supply dis-ruptions, product launch delays and a slower-than-expected turnaround in electronics) has meant that the contribution from net exports generally worse-ned. Electronics exports – crucial for the region – will turn around soon.

6 DCM SA is authorised and regulated by the Swiss Financial Market Supervisory Authority (FINMA).
DCM UK LLP is authorised and regulated by the FSA
Please refer to the risk and legal disclaimer at the end of the document.
U.S. GDP data: Q1, Q2 2012 GDP now tracking 1.9%, 2.4%
� Recent data revisions have been on the downside but incoming Q2 data are fairly solid. We expect unemployment to continue its downward trend, al-though at a moderate pace. Relative stability in US data means it is becoming less of a driver of financial markets, given the volatility in PIIGS-land. Q1 and Q2 GDP growth are now tracking 1.9%and 2.4%, respectively.
� The University of Michigan's index of consumer confidence was revised up in the final May reading, to 79.3, from 77.8 in the preliminary and 76.4 in the fi-nal April, the highest reading since October 2007. This was above the consen-sus forecast (77.8). The increase was driven by the economic outlook index, revised up to 74.3 from 71.7. The current conditions index was basically un-changed at 87.2. The outlook for domestic fiscal policy and uncertainty abroad, particularly if it weighs on financial markets, provide downside risks to sentiment measures in the coming months, but lower gasoline prices and further modest gains in employment and declines in unemployment should work in the opposite direction.
� ‘Hard’ activity data for Q2 have been mixed so far. Manufacturing output and core retail sales posted solid gains in April (0.6% m/m and 0.4% respectively) but last week’s durable goods report revealed sharp declines in core orders (-1.9%) and core shipments (-1.4%). This reduced our Q2 GDP tracking esti-mate to 2.4% q/q (saar), but we expect both to rebound in May and June.
� Market concerns in the eurozone led to a worsening of financial market conditions in the US. The recent widening in the spread between investment grade and high yield corporate bond yields and comparable maturity US Treasuries; investment grade corporate bond spreads have risen about 25bp, and high yield spreads have widened 85bp since the beginning of May.
�
Summary - U.S. Economy/Markets

7 DCM SA is authorised and regulated by the Swiss Financial Market Supervisory Authority (FINMA).
DCM UK LLP is authorised and regulated by the FSA
Please refer to the risk and legal disclaimer at the end of the document.
OUTLOOK ON EQUITY MARKETS
SPX may have found support at 1300 and could make new highs
Action on equities last week finished on a strong note. Stocks then managed to muster gains that ranged from only incremental to modest during the course of the next few sessions. Still, it was enough to give the S&P 500 a weekly gain of 1.7%, which snapped a streak of three straight weekly slides. Perhaps most im-pressive about the stock market’s weekly advance is that it came in the face of continued concerns about persistently precarious conditions in the eurozone. Most of this week’s gain was earned, when a blend of bargain hunting and short covering drove the S&P 500 to its strongest performance in two months to snap a six-session losing streak. However, stocks had a hard time building on that bounce with the euro communicating serious concerns about the eurozone by dropping to a near two-year low. Stocks were helped later on by some short cove-ring, which helped the broad market reverse out of the red as many market parti-cipants were prompted to exit their positions so as to take profits or protect against additional upside action once stocks had stabilized.
� S&P 500 Index® may have found a trough at circa 1300 and has shown initial recovery characteristics. The SPX could slowly rise from here, build a base as Greece goes into another election and the EU implements stop-gap measures. We expect a new SPX high sometime in July, but Q3 might be a weak period.
OUTLOOK ON BOND MARKETS
10yr yield troughs at 1.68%, but expect a move to 2.30% longer term
Market concerns about imbalances in Spain and a possible disorderly exit of Greece from the EU have led to a worsening of financial market conditions in the US. The recent widening in the spread between investment grade and high yield corporate bond yields and comparable maturity US Treasuries; investment grade corporate bond spreads have risen about 25bp, and high yield spreads have wide-ned 85bp since the beginning of May. The widening in investment grade bonds has mainly been driven by lower US Treasury yields, as yields on the corporate bonds have not increased appreciably. In the high yield market, however, the spread widening has come from lower Treasury yields and higher corporate bond yields. That said, the spread widening that has occurred is not as significant as was observed prior to the implementation of QE2 in late 2010 and the maturity ex-tension program (ie, Operation Twist) in 2011.
� The 10yr Treasury yield may have completed a pullback lower towards the 1.67% area. No change in the longer term view—yields should broadly higher thereafter and yields could rise towards 2.20% - 2.40% medium-term.
Summary - Market Outlooks

8 DCM SA is authorised and regulated by the Swiss Financial Market Supervisory Authority (FINMA).
DCM UK LLP is authorised and regulated by the FSA
Please refer to the risk and legal disclaimer at the end of the document.
OUTLOOK ON CURRENCIES/U.S. DOLLAR
DXY rose to circa 82.00; losses below 81.00 indicate a new decline
The dollar is proving scarce, even after the Federal Reserve flooded the financial system with an extra $2.3 trillion, as the amount of the highest-quality assets avai-lable worldwide shrinks. From last year’s low on July 27, the greenback has risen against all 16 of its major peers. The Dollar Index surged 12 percent, higher now than when the Fed began creating dollars to buy bonds under its extraordinary stimulus measures at the end of 2008. International investors and financial institu-tions that are required to own only the highest quality assets to meet investment guidelines or new regulations are finding fewer options beyond dollar-denominated assets. The U.S. is one of only five major economies with credit-default swaps on their debt trading at less than 100 basis points, meaning they are viewed as almost risk free. A year ago, eight Group-of-10 nations fit that category. The dollar is gaining mainly at the expense of the euro, which has depreciated al-most 5 percent in the past six months against a basket of nine major currencies as the PIIGS see their credit ratings downgraded amid the region’s sovereign crisis.
� DXY did rise to circa 82.00, but breach of 81.00 indicates a new decline phase.
� We keep our modal forecast that extension of risk-taking from there will have the U.S. dollar (DXY) falling again to the area of 74.00—73.00 longer-term
OUTLOOK ON COMMODITIES —ENERGY
Brent Crude still looking to confirm a base at circa $105.00 soon
Oil prices continue to remain under pressure despite improving fundamentals, as weakening macroeconomic sentiment remains the focus, with the lack of concrete measures from European policymakers to address the Greek issue weighing hea-vily on the market. Energy fundamentals, though in the backseat for now, are on an improving trajectory, underpinned by the recent turnaround in US demand, which has helped to remove the weight from the OECD. A series of upward revi-sions to past demand data has meant that the market was tighter than what consensus expected. Further, sanctions proved to be the key stumbling block at this week's key P5+1 nuclear negotiations in Baghdad and the outlook for the up-coming June 18 talks in Moscow looks uncertain. This has supported crude oil.
� Our energy analyst forecasts Brent to average $115 - $120/bbl in H1 2012.
� June Brent is still looking for confirmation with a move above $110/bbl. , then could rally towards a barrier at $120.00/bbl further out. Our more optimistic $127.00/bbl—$132/bbl targets may have to wait for year-end or Q1 2013.
Summary - Market Outlooks
9 DCM SA is authorised and regulated by the Swiss Financial Market Supervisory Authority (FINMA).
DCM UK LLP is authorised and regulated by the FSA
Please refer to the risk and legal disclaimer at the end of the document.
OUTLOOK ON COMMODITIES —BASE METALS
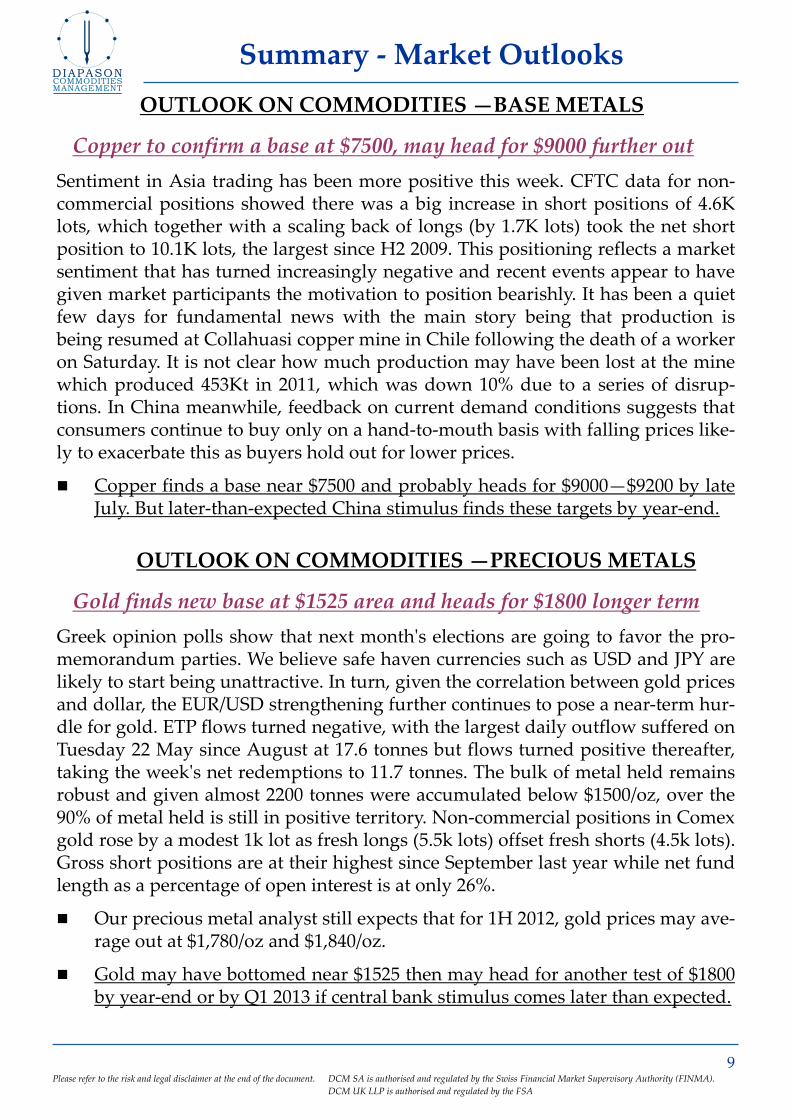
Copper to confirm a base at $7500, may head for $9000 further out
Sentiment in Asia trading has been more positive this week. CFTC data for non-commercial positions showed there was a big increase in short positions of 4.6K lots, which together with a scaling back of longs (by 1.7K lots) took the net short position to 10.1K lots, the largest since H2 2009. This positioning reflects a market sentiment that has turned increasingly negative and recent events appear to have given market participants the motivation to position bearishly. It has been a quiet few days for fundamental news with the main story being that production is being resumed at Collahuasi copper mine in Chile following the death of a worker on Saturday. It is not clear how much production may have been lost at the mine which produced 453Kt in 2011, which was down 10% due to a series of disrup-tions. In China meanwhile, feedback on current demand conditions suggests that consumers continue to buy only on a hand-to-mouth basis with falling prices like-ly to exacerbate this as buyers hold out for lower prices.
� Copper finds a base near $7500 and probably heads for $9000—$9200 by late July. But later-than-expected China stimulus finds these targets by year-end.
OUTLOOK ON COMMODITIES —PRECIOUS METALS
Gold finds new base at $1525 area and heads for $1800 longer term
Greek opinion polls show that next month's elections are going to favor the pro-memorandum parties. We believe safe haven currencies such as USD and JPY are likely to start being unattractive. In turn, given the correlation between gold prices and dollar, the EUR/USD strengthening further continues to pose a near-term hur-dle for gold. ETP flows turned negative, with the largest daily outflow suffered on Tuesday 22 May since August at 17.6 tonnes but flows turned positive thereafter, taking the week's net redemptions to 11.7 tonnes. The bulk of metal held remains robust and given almost 2200 tonnes were accumulated below $1500/oz, over the 90% of metal held is still in positive territory. Non-commercial positions in Comex gold rose by a modest 1k lot as fresh longs (5.5k lots) offset fresh shorts (4.5k lots). Gross short positions are at their highest since September last year while net fund length as a percentage of open interest is at only 26%.
� Our precious metal analyst still expects that for 1H 2012, gold prices may ave-rage out at $1,780/oz and $1,840/oz.
� Gold may have bottomed near $1525 then may head for another test of $1800 by year-end or by Q1 2013 if central bank stimulus comes later than expected.
Summary - Market Outlooks

10 DCM SA is authorised and regulated by the Swiss Financial Market Supervisory Authority (FINMA).
DCM UK LLP is authorised and regulated by the FSA
Please refer to the risk and legal disclaimer at the end of the document.
OUTLOOK ON COMMODITIES —GRAINS
July Corn found support above 550, and heads for 700 further out
Latest weekly CFTC data shows tactical investors held a mixed view on agricultu-ral commodities, increasing positive exposure to corn, CBOT wheat, soybeans, coffee and sugar while reducing it in soybean products, cocoa, and cotton. Grains price gains were led by wheat which has been buoyed by weather concerns. Front month corn prices closed flat on the day while deferred contracts posted gains. Soybeans prices closed on a firmer note, with the new crop November contract leading gains. We continue to view new crop soybean contracts prior to the 2012-13 South American harvest positively.
Following South American supply losses, the US is the key source of meeting im-port demand till next year’s South American harvest which is likely to tighten the 2012-13 US soybean market balance, taking ending stocks lower. Across the grains, the most notable change was in CBOT wheat where non-commercial net fund positions went from -60.8K lots to -6.1K lots – this is the smallest net short position in CBOT wheat since early June 2011 when net fund positions were in po-sitive territory. The 54.6K lot rise in net fund positions was primarily attributable to short-covering activity (52.6K lots).
� July Corn did stabilize above 550 area and has been very volatile on account of conflcting supply-demand issues. Nonetheless, Corn is getting some bene-fit from resurgent wheat prices, and is heading for 700 –750 in the near term.
OUTLOOK ON COMMODITIES —SOFTS
July Sugar could bounce back to 20.00, but may still be 18.00 bound
Across the ICE soft commodities, net fund positions in ICE cocoa fell further into negative territory by another 2.2K lots, at -7.9K lots on the addition of fresh short positions. However, the net short position in coffee declined by 1.6K lots to -1.5K lots. Non-commercial net fund positions in sugar rose by 10K lots to 69K lots on a combination of the establishment of fresh long positions (7.5K lots) and short co-vering activity (2.6K lots). Finally, net fund positions in cotton fell further into ne-gative territory, by another 3.9K lots to -7.5K lots.
� July Sugar is due a small recovery to the 20.00 area in a few days, but the short-term outlook (fundamental and technical) is still bearish, with 18.00 ob-jective further out. But the longer term issues will benefit sugar, and by the end of the year/Q1 2013, sugar may recover towards the area of 23.00-25.00.
Summary - Market Outlooks
11 DCM SA is authorised and regulated by the Swiss Financial Market Supervisory Authority (FINMA).
DCM UK LLP is authorised and regulated by the FSA
Please refer to the risk and legal disclaimer at the end of the document.
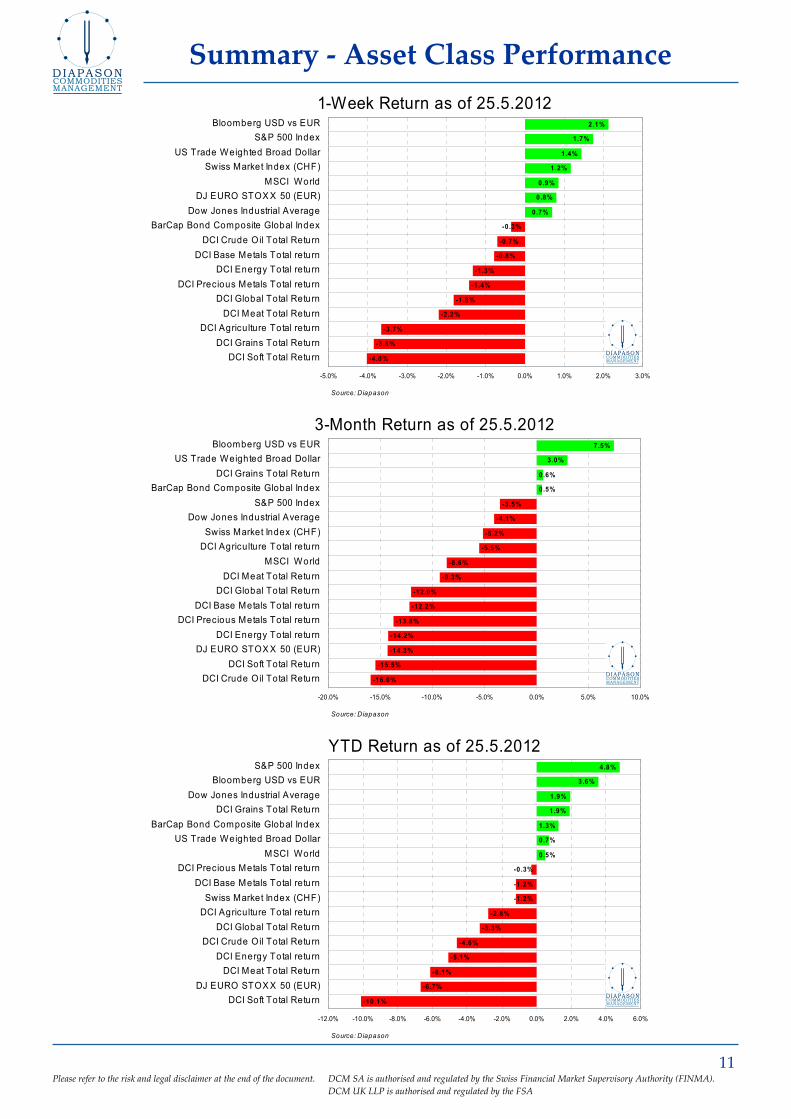
Summary - Asset Class Performance
1-Week Return as of 25.5.2012
-4.0%
-3.8%
-3.7%
-2.2%
-1.8%
-1.4%
-1.3%
-0.8%
-0.7%
-0.3%
0.7%
0.8%
0.9%
1.2%
1.4%
1.7%
2.1%
-5.0% -4.0% -3.0% -2.0% -1.0% 0.0% 1.0% 2.0% 3.0%
DCI Soft Total Return
DCI Grains Total Return
DCI Agriculture Total return
DCI Meat Total Return
DCI Global Total Return
DCI Precious Metals Total return
DCI Energy Total return
DCI Base Metals Total return
DCI Crude Oil Total Return
BarCap Bond Composite Global Index
Dow Jones Industrial Average
DJ EURO STOXX 50 (EUR)
MSCI World
Swiss Market Index (CHF)
US Trade Weighted Broad Dollar
S&P 500 Index
Bloomberg USD vs EUR
Source: Diapason
3-Month Return as of 25.5.2012
-16.0%
-15.5%
-14.3%
-14.2%
-13.8%
-12.2%
-12.0%
-9.3%
-8.6%
-5.5%
-5.2%
-4.1%
-3.5%
0.5%
0.6%
3.0%
7.5%
-20.0% -15.0% -10.0% -5.0% 0.0% 5.0% 10.0%
DCI Crude Oil Total Return
DCI Soft Total Return
DJ EURO STOXX 50 (EUR)
DCI Energy Total return
DCI Precious Metals Total return
DCI Base Metals Total return
DCI Global Total Return
DCI Meat Total Return
MSCI World
DCI Agriculture Total return
Swiss Market Index (CHF)
Dow Jones Industrial Average
S&P 500 Index
BarCap Bond Composite Global Index
DCI Grains Total Return
US Trade Weighted Broad Dollar
Bloomberg USD vs EUR
Source: Diapason
YTD Return as of 25.5.2012
-10.1%
-6.7%
-6.1%
-5.1%
-4.6%
-3.3%
-2.8%
-1.2%
-1.2%
-0.3%
0.5%
0.7%
1.3%
1.9%
1.9%
3.6%
4.8%
-12.0% -10.0% -8.0% -6.0% -4.0% -2.0% 0.0% 2.0% 4.0% 6.0%
DCI Soft Total Return
DJ EURO STOXX 50 (EUR)
DCI Meat Total Return
DCI Energy Total return
DCI Crude Oil Total Return
DCI Global Total Return
DCI Agriculture Total return
Swiss Market Index (CHF)
DCI Base Metals Total return
DCI Precious Metals Total return
MSCI World
US Trade Weighted Broad Dollar
BarCap Bond Composite Global Index
DCI Grains Total Return
Dow Jones Industrial Average
Bloomberg USD vs EUR
S&P 500 Index
Source: Diapason

12 DCM SA is authorised and regulated by the Swiss Financial Market Supervisory Authority (FINMA).
DCM UK LLP is authorised and regulated by the FSA
Please refer to the risk and legal disclaimer at the end of the document.
Summary - Commodities Performance
3-Month Return as of 25.5.2012
-20.0%
-19.3%
-18.8%
-18.5%
-18.3%
-17.3%
-17.2%
-17.0%
-15.8%
-15.7%
-15.1%
-14.6%
-13.4%
-12.0%
-11.9%
-11.8%
-11.5%
-10.1%
-9.9%
-8.7%
7.0%
3.8%
-25.0% -20.0% -15.0% -10.0% -5.0% 0.0% 5.0% 10.0%
COMEX Silver ICE Sugar
ICE Coffee ICE Cotton
NYMEX Crude Oil LME Tin
NYMEX Palladium
NYMEX Platin ium LME Nickel
NYMEX Natural LME Aluminium NYMEX Heating ICE Brent Crude
LME Lead RBOB Gasoline
COMEX Gold NYBOT Cocoa LME Copper
CBOT Corn LME Zinc
CBOT Wheat CBOT Soybean
Source: Diapason Note: Commodity returns are excess returns
1-Week Return as of 25.5.2012
-9.0%
-7.2%
-6.9%
-6.3%
-5.6%
-4.2%
-2.8%
-2.3%
-2.2%
-2.2%
-1.6%
-1.4%
-1.1%
-1.0%
-0.8%
-0.3%
-0.1%
-0.1%
0.4%
0.7%
1.3%
0.8%
-10.0% -8.0% -6.0% -4.0% -2.0% 0.0% 2.0%
CBOT Corn NYBOT Cocoa
NYMEX Natural Gas ICE Coffee
ICE Cotton ICE Sugar
LME Aluminium
NYMEX Palladium NYMEX Platinium
CBOT Wheat CBOT Soybean
COMEX Gold COMEX Silver
NYMEX Crude Oil LME Lead
ICE Brent Crude LME Copper
NYMEX Heating Oil
RBOB Gasoline LME Tin
LME Zinc LME Nickel
Source: Diapason Note: Commodity returns are excess returns
YTD Return as of 25.5.2012
-28.0%
-27.7%
-20.6%
-11.1%
-10.6%
-10.3%
-9.7%
-9.5%
-5.1%
-3.3%
-2.4%
-1.9%
-0.2%
-0.2%
1.1%
1.3%
1.3%
2.0%
2.5%
2.6%
13.1%
6.1%
-35.0% -30.0% -25.0% -20.0% -15.0% -10.0% -5.0% 0.0% 5.0% 10.0% 15.0% 20.0%
ICE Coffee NYMEX Natural
ICE Cotton CBOT Corn
ICE Sugar
NYMEX Palladium NYMEX Crude Oil
LME Nickel LME Lead
LME Aluminium NYBOT Cocoa NYMEX Heating
CBOT Wheat
COMEX Gold LME Copper
NYMEX Platinium COMEX Silver
ICE Brent Crude
LME Zinc LME Tin
RBOB Gasoline CBOT Soybean
Source: Diapason Note: Commodity returns are excess returns

13 DCM SA is authorised and regulated by the Swiss Financial Market Supervisory Authority (FINMA).
DCM UK LLP is authorised and regulated by the FSA
Please refer to the risk and legal disclaimer at the end of the document.
Supply-Demand Factors: ENERGY
The oil glut is gradually moving toward the US Gulf Coast
• The infrastructure bottleneck in the US Midwest, which led to a large pre-mium of Brent and other Atlantic grades over landlocked WTI, is likely to move to the US Gulf Coast thanks to the start of the Seaway pipeline.
Since the end of 2010, the US Midwest faced an infrastructure bottleneck because
of growing output from North Dakota and higher imports from Canada. This led
to a sharp reduction of WTI relative to Brent.
The reversal of the 150’000 b/d Seaway pipeline on May 17 is likely to ease the in-
frastructure bottleneck in the Midwest. Transportation costs (reflected in the
spreads) between the Midwest and the US Gulf Coast are likely to fall.
Thus, an important amount of crude oil is heading towards the Gulf Coast. This
could trigger a reduction of light sweet crude oil imports from the US Gulf Coast.
Furthermore, another oil boom is occurring in Texas thanks to liquid-rich shales
such as the Eagle Ford Shale.
However, additional crude oil supplies from the Midwest and from local wells
won’t prevent refineries to completely halt crude oil imports. Some refineries are
indeed bound in long term agreements to import crude oil. Furthermore, PDVSA
and Saudi Aramco own some refineries on the US Gulf Coast, which tend to
mainly use Venezuelan and Saudi crudes.
Finally, the crude oil surplus on the US Gulf Coast cannot be exported because of
legal restrictions. Thus, we could see the oil glut moving from the Midwest to the
Gulf Coast. This is likely to lead to lower input costs for refiners. Higher margins
mean higher refinery activity. While US crude oil cannot be exported, US refiners
are likely to boost significantly petroleum products exports.
WTI and Brent Crude Spread
with Light Lousinia Sweet (LLS)
-$20
-$10
$0
$10
$20
$30
$40
Jan-06 Jul-06 Jan-07 Jul-07 Jan-08 Jul-08 Jan-09 Jul-09 Jan-10 Jul-10 Jan-11 Jul-11 Jan-12
Dollars per Barrel
LLS-Brent
LLS-WTI
Brent-WTI
Hurricane Ike
Sources: Diapason, Platts The Midwest oil glut has reached the US Gulf Coast

14 DCM SA is authorised and regulated by the Swiss Financial Market Supervisory Authority (FINMA).
DCM UK LLP is authorised and regulated by the FSA
Please refer to the risk and legal disclaimer at the end of the document.
Supply-Demand Factors: ENERGY
Gasoline fundamentals are weakening
• The US gasoline market already faced a turbulent market this year. Gasoline prices were supported by expected closures of several refineries in the Atlantic basin that would have reduced refining capacity by more than 1.6 million b/d.
These expected closures led to the fear of a gasoline supply shortages on the US
East Coast, which accounts for 36 percent of US gasoline consumption, as logisti-
cal constraints prevented the latter to be supplied by the US Gulf Coast, forcing
the region to increase gasoline imports from distant regions such as India.
Gasoline crack spreads rose significantly, leading to increased interest for these re-
fineries. At least 3 refineries have been purchased, while 2 others are currently un-
der discussion. The restart of these refineries is likely to ease the gasoline market,
especially on the US East Coast.
The situation is bearish for gasoline because the restart of these refineries and the
end of the refinery maintenance season. Furthermore, refineries on the US Gulf
Coast are likely to boost production this summer thanks to cheaper crude oil from
the Midwest. Would US domestic demand manage to meet growing output?
While leading indicators are suggesting a recovery of US gasoline demand, the
latter remained weak, negatively affected by high gasoline prices and high unem-
ployment. US gasoline exports to Latin America could remain important. Never-
theless, we are likely to see a smaller decrease in inventories than usual during the
driving season. Thus, the tightness in the gasoline market is likely to ease in the
coming weeks.
US Gasoline Crack (Brent) Spread
-10
-5
0
5
10
15
20
25
30
Jan-12 Feb-12 Mar-12 Apr-12 May-12 Jun-12 Jul-12 Aug-12 Sep-12 Oct-12 Nov-12 Dec-12
Gasoline Crack (Brent) Spread Average 2004-20082009201020112012
Source: Diapason

15 DCM SA is authorised and regulated by the Swiss Financial Market Supervisory Authority (FINMA).
DCM UK LLP is authorised and regulated by the FSA
Please refer to the risk and legal disclaimer at the end of the document.
Supply-Demand Factors: BASE METALS
Most base metals (ex Copper) are currently below marginal cost of production
� Base metals have continued to suffer this week, leading to a 5% drop in aver-age on the LME complex in the past 30 days. Consequently, most base metals (except copper, tin) are currently traded at or below the marginal cost of pro-duction, which could provide some support to prices in the medium term.
Aluminium provides a good example of how the relationship between prices and costs of production can influence one metal’s fundamentals, as its price has dropped below the marginal cost of production in the fourth quarter of last year. The marginal cost of production usually acts as an incentive price level for pro-ducers, who will not be encouraged to increase capacity run rates or launch new projects if expected margins are negative. On the contrary, producers tend to re-duce output in times in that case, in order to limit losses and reduce inventories. Regarding aluminium, the poor margins have led to strong curtailments across the sector worldwide (except in China, where official interventions to secure jobs have limited the downside trend): according to the latest IAI stats, aluminium production in the World ex-China dropped by 4.2% from October 2011 to April 2012. These supply cuts are contributing to the improvement of the global supply/demand balance and should prove supportive to prices.
Despite worries over China’s industrial activity, the country’s imports of copper remained strong in April, above the consensus’ expectations. As SHFE inventories have continued to fall, partly on rising exports, it is possible that this imported material may is meant for consumption (and not for stockpiling). On the other hand, LME inventories remain at their lowest level since October 2008, suggesting that the world-ex China remains short of copper.
On the supply side, production still appears tight in Chile, the world’s top copper producing country, as Codelco’s production (n.1 producer) was down 10% in Q1.
Base Metals Price/Marginal Cost Ratio
1.00
2.31
0.95
0.86
-
0.50
1.00
1.50
2.00
2.50
Aluminium Zinc Nickel Copper
Sources: DiapasonCopper > the only base metal traded far
above its marginal cost of production (2.3x)
* Price: May 17 - May 24 Average Weekly LME 3-mth
** Cost: 2011 C1 Cash Marginal Cost

16 DCM SA is authorised and regulated by the Swiss Financial Market Supervisory Authority (FINMA).
DCM UK LLP is authorised and regulated by the FSA
Please refer to the risk and legal disclaimer at the end of the document.
Supply-Demand Factors: PRECIOUS METALS
India’s gold demand continue to disappoint; Central Banks remain strong buyers
� The improving confidence in the macro economy should lower gold invest-ments, especially ETF holdings in Western markets. Physical purchases should remain strong though, especially in China, which should become the world’s top gold market this year, outpacing India.
India’s physical gold demand has remained poor this week, despite the Akshaya Tritiya festival, one of the most auspicious times of the year for gold purchases. According to the Indian Bullion Association, gold purchases may have totalled just 10-12 tonnes during this festival week, compared with approximately 30-35 tonnes bought in the same celebrations last year. The low value of the rupee, which has significantly lowered Indian‘s purchaing power, is probably the main reason to these weak sales. In the meantine, demand for gold paper surged: the trade value of gold ETFs on India‘s National Stock Exchange surged by 44% on April 23, from 4.23 to to 6.08 billion rupees (US$115.8 million).
On the other hand, China‘s physical demand for gold has been remarkable (January-February combined imports from HK jumped 6-fold y/y), outpacing India‘s. Regarding silver, the Middle Kingdom‘s appetite is not as strong as for the yellow metal, but is improving. In March, total silver imports were 179t, much higher than the 27t reported in March 2011. Most of the imported material has probably been stockpiled in expectation of higher future demand.
Central banks remained active buyers of gold in March, according to latest IMF data. This time again, Mexico took the lead (+16.8 tonnes added to reserves, now at 120 tonnes), followed by Russia (+16 tonnes to 869 tonnes of reserves).
World ETF demand has narrowed further this week. Gold holdings fell 0.13Moz in the week to April 25 to 81.31Moz. In the world’s largest fund, SPRD, investors cut back holdings by 135,950 oz. Silver ETF holdings also declined this week, by 3Moz to 483.15Moz, mainly on the back of outflows from iShares Trust (-2.7Moz).
Holdings at the largest Gold and Silver ETFs, Tonnes
1'100
1'150
1'200
1'250
1'300
1'350
Jan-10
Mar-10
May-10
Jul-10
Oct-10
Dec-10
Feb-11
May-11
Jul-11
Sep-11
Dec-11
Feb-12
8'800
9'300
9'800
10'300
10'800
11'300
11'800
Silver Holdings at IShares Silver Trust ETF(RHS)Gold Holdings at ETF SPDR Gold Shares (LHS)
Sources: Diapason, SPDR Gold Shares ETF, Ishares Silver Trust ETF

17 DCM SA is authorised and regulated by the Swiss Financial Market Supervisory Authority (FINMA).
DCM UK LLP is authorised and regulated by the FSA
Please refer to the risk and legal disclaimer at the end of the document.
Supply-Demand Factors: Agriculture
Dryness in Russia threaten wheat crop
• Wheat prices soared 20 percent in Chicago to their highest since September, amid continued concerns over the dry weather threatening a range of produc-ing countries.
The dryness in southern Russia is a major concern for the country's grain produc-
tion prospects. There are downside risks to estimates of a grains harvest of 90m-
95m tonnes if the dry and hot weather in May persists. The dryness may cut local
production by 27 percent. Some areas are even being compared to the 2003 crop
which was southern Russia's smallest harvest in a decade.
Rabobank cut its forecast for wheat production this year by 2m tonnes to 53m
tonnes, below the US Department of Agriculture's forecast of a 56m tonne har-
vest. Moreover, Russia's grain exports could fall by more than one-quarter in the
forthcoming season, a deeper decline than forecast in the last USDA report, ac-
cording to SovEcon. The influential analysis group pegged Russia's grain ship-
ments, which mainly comprise wheat, in 2012-13 at 20m tonnes, a drop of 28 per-
cent on its estimate for the current - unusually strong - season.
And weather conditions did not seem to improve. A massive ridge of high pres-
sure block off rainfall from central and southern Russia while raising tempera-
tures frequently above 30 degrees Celsius and proving persistently 5-10 degrees
above average.
The new forecast shows high pressure keeping a grip on European Russia in the
upcoming week. Thus, heat and dryness would continue along with ultra-low
humidity. Furthermore, even if rains do appear, some crop damage already looks
irreparable.
Russian Wheat Production
30,000
35,000
40,000
45,000
50,000
55,000
60,000
65,000
70,000
2001 2002 2003 2004 2005 2006 2007 2008 2009 2010 2011 2012
Rabo ba nk F o re c a s t S o urces : Diapas o n, US DA , R abo bank
2 0 10

18 DCM SA is authorised and regulated by the Swiss Financial Market Supervisory Authority (FINMA).
DCM UK LLP is authorised and regulated by the FSA
Please refer to the risk and legal disclaimer at the end of the document.
U.S. gasoline prices continue to fall, boosting consumer sentiment
A seventh straight fall has brought the cumulative reduction in US retail gasoline prices since the early-April peak to 22.7 cents, providing some boost to consumer sentiment and retail sales data. Over the past week, the US national average for regular unleaded gasoline fell by 4 cents to 371.4 cents per gallon, with the m/m rate of decrease standing at 4% and the y/y decrease standing at 3.5%. The overall fall in prices over the past two months has not been distributed very equally. The US national average price of diesel fell by 4.8 cents to 395.6 cents per gallon, with the y/y decrease standing at 1%.
SECTORS: There are changes in the allocations
� Energy: 39 pct
� Base Metals: 36 pct
� Precious Metals: 10 pct (-3 pct)
� Agriculture: 15 pct (+3 pct)
� Cash: 0 pct
ENERGY: There are changes in the allocations
� Crude Oil WTI: 40 pct (+25 pct)
� Crude Oil Brent: 35 pct (- 25 pct)
� Gasoline: 5 pct
� Heating Oil: 15 pct
� Natural Gas: 5 pct
BASE METALS : There are NO changes in the allocations
� Tin: 10 pct
� Aluminium: 30 pct
� Copper: 40 pct
� Nickel: 5 pct
� Lead: 10 pct
� Zinc: 5 pct
Recommended Allocations (Virtual Portfolio)
Base Metals Allocations
10%
30%
40%
5%
10% 5%Tin
Aluminium
Copper
Nickel
Lead
Zinc
Sectors Allocations
39%
36%
10%
0%15%
Energy Base Metals Precious Metals Agriculture Cash
Energy Allocations
40%
5%
5%
15%
35%
WTI
Brent
Gasoline
Heating Oil
Natural Gas

19 DCM SA is authorised and regulated by the Swiss Financial Market Supervisory Authority (FINMA).
DCM UK LLP is authorised and regulated by the FSA
Please refer to the risk and legal disclaimer at the end of the document.
Recommended Allocations (Virtual Portfolio)
PRECIOUS METALS: There are no changes in the allocations
� Palladium: 20 pct
� Silver: 25 pct
� Platinum: 20 pct
� Gold: 35 pct
AGRICULTURE: There are no changes in the allocations
� Grains: 56 pct
� Corn: 25 pct
� Soybean: 20 pct
� Wheat: 11 pct
� Soft: 40 pct
� Sugar: 12 pct
� Cocoa: 17 pct
� Coffee: 5 pct
� Cotton: 10 pct
DCI® and Sectors’ Performance 2009-2011
Precious Metals Allocations
20%
20%
35%
25%
Palladium
Silver
Platinum
Gold
Agriculture Allocations
11%
17%
5%10% 25%
20%12%
Corn
Soybean
Wheat
Sugar
Cocoa
Coffee
Cotton
50
75
100
125
150
175
200
225
250
Jan-09 Apr-09 Jul-09 Oct-09 Jan-10 Apr-10 Jul-10 Oct-10 Jan-11 Apr-11 Jul-11 Oct-11 Jan-12 Apr-12
Jan-09 = 100
DCI® Agriculture Total return DCI® Base Metals Total return
DCI® Energy Total return DCI® Precious Metals Total return
DCI® Total return
Source: Diapason

20 DCM SA is authorised and regulated by the Swiss Financial Market Supervisory Authority (FINMA).
DCM UK LLP is authorised and regulated by the FSA
Please refer to the risk and legal disclaimer at the end of the document.
Contact Information
Diapason Commodities Management S.A
Malley Lumières
Chemin du Viaduc 1
Case Postale 225
1000 Lausanne 16
Switzerland
+41 21 621 13 00
www.diapason-cm.com
Diapason Commodities Management UK LLP
18 Upper Brook Street
5th floor
London
W1K 7PU
United Kingdom
+44 207 290 2260
www.diapason-cm.com
Sales Team _ _____ _
Salvatore Miserendino
Head, Marketing & Business
Development
Tel : +44 207 290 2264
Mark McDonnell
Institutional Sales
Tel: +44 207 290 2263
Waleed Albahr
Sales
Tel: +44 207 290 2262
Research and Indices Team
Sean Corrigan
Chief Investment Strategist
Robert Balan
Sr. Market Strategist
Fabien Espic
Indices and Quantitative Research
Alessandro Gelli
Energy Fundamental Research
Edouard Mouton
Head of Quantitative Desk
Marion Megel
Metals Fundamental Research
Xavier Gendre
Sales
Tel: +41 21 621 13 12
Chiharu-Claire Nishida
Sales
Tel: +41 21 621 13 14
Sébastien Max
Sales
Tel: +41 21 621 13 15
Victor Neamtu
Indices and Quantitative Research

21 DCM SA is authorised and regulated by the Swiss Financial Market Supervisory Authority (FINMA).
DCM UK LLP is authorised and regulated by the FSA
Please refer to the risk and legal disclaimer at the end of the document.
Disclaimer
General Disclosure
This document or the information contained in does not constitute an offer or a solicitation, or a rec-
ommendation to purchase or sell any investment instruments, to effect any transactions, or to con-
clude any legal act of any kind whatsoever. The information contained in this document is issued for
information only. An offer can be made only by the approved offering memorandum. The investments
described herein are not publicly distributed. This document is confidential and submitted to selected
recipients only. It may not be reproduced nor passed to non-qualifying persons or to a non professional
audience. For distribution purposes in the USA, this document is only intended for persons who can
be defined as “Major Institutional Investors” under U.S. regulations. Any U.S. person receiving this
report and wishing to effect a transaction in any security discussed herein, must do so through a U.S.
registered broker dealer. The investment described herein carries substantial risks and potential inves-
tors should have the requisite knowledge and experience to assess the characteristics and risks associ-
ated therewith. Accordingly, they are deemed to understand and accept the terms, conditions and risks
associated therewith and are deemed to act for their own account, to have made their own independent
decision and to declare that such transaction is appropriate or proper for them, based upon their own
judgment and upon advice from such advisers as they have deemed necessary and which they are
urged to consult. Diapason Commodities Management S.A. (“Diapason”) disclaims all liability to
any party for all expenses, lost profits or indirect, punitive, special or consequential damages or losses,
which may be incurred as a result of the information being inaccurate or incomplete in any way, and
for any reason. Diapason, its directors, officers and employees may have or have had interests or long
or short positions in financial products discussed herein, and may at any time make purchases and/or
sales as principal or agent.
This document is issued by Diapason and may be distributed by both entities Diapason or Diapason
Commodities Management UK LLP (“Diapason UK”). Diapason is regulated by the Swiss Financial
Market Supervisory Authority (FI�MA) and Diapason UK is authorised and regulated by the Finan-
cial Services Authority (“FSA”).
Certain statements in this presentation constitute “forward-looking statements”. These statements
contain the words “anticipate”, “believe”, “intend”, “estimate”, “expect” and words of similar mean-
ing. Such forward-looking statements are subject to known and unknown risks, uncertainties and as-
sumptions that may cause actual results to differ materially from the ones expressed or implied by
such forward-looking statements. These risks, uncertainties and assumptions include, among other
factors, changing business or other market conditions and the prospects for growth. These and other
factors could adversely affect the outcome and financial effects of the plans and events described herein.
Consequently, any prediction of gains is to be considered with an equally prominent risk of loss. More-
over, past performance or results does not necessarily guarantee future performance or results. As a
result, you are cautioned not to place undue reliance on such forward-looking statements.
These forward-looking statements speak only as at the date of this presentation. Diapason expressly
disclaims any obligation or undertaking to disseminate any updates or revisions to any forward-
looking statements contained herein to reflect any change in Diapason’s expectations with regard
thereto or any change in events, conditions or circumstances on which any such statement is based.
The information and opinions contained in this document are provided as at the date of the presenta-
tion and are subject to change without notice.
22 DCM SA is authorised and regulated by the Swiss Financial Market Supervisory Authority (FINMA).
DCM UK LLP is authorised and regulated by the FSA
Please refer to the risk and legal disclaimer at the end of the document.
Trademarks
All rights reserved. “DIAPASO, COMMODITIES I,DEX” “DCI”, “DIAPASO, COMMODITIES
MA,AGEME,T” and “DIAPASO,” are trademarks and service marks of Diapason. Diapason has
all proprietary rights with respect to the DCI®. In no way does Diapason make any representation or
warranty, express or implied, to the holders of the investment described herein or any member of the
public regarding the advisability of investing therein or in commodities generally or in futures par-
ticularly, or as to results to be obtained from the use of the DCI®. Diapason disclaims any liability to
any party for any inaccuracy in the data on which the DCI® is based, for any errors, omissions, or
interruptions in the calculation and/or dissemination of the DCI®, or for the manner in which it is
applied in connection with the issue and offering of a financial product. Diapason makes no warranty,
express or implied, as to results to be obtained by investors from the use of the DCI®, any data in-
cluded therein or linked therewith. Diapason does not make any express or implied warranties and
expressly disclaims all warranties of merchantability or fitness for a particular purpose or use with
respect to the DCI® and any data included therein. Without limiting any of the foregoing, in no event
shall Diapason have any liability for any lost profits or indirect, punitive, special or consequential
damages or losses, even if notified of the possibility thereof.
Electronic Communication (E-mail)
In the case that this document is sent by E-mail, the E-mail is considered as being confidential and
may also be legally privileged. If you are not the addressee you may not copy, forward, disclose or use
any part of it. If you have received this message in error, please delete it and all copies from your sys-
tem and notify the sender immediately by return E-mail. The sender does not accept liability for any
errors, omissions, delays in receipt, damage to your system, viruses, interruptions or interferences.
Copyright
© Diapason Commodities Management SA 2012
Any disclosure, copy, reproduction by any means, distribution or other action in reliance on the con-
tents of this document without the prior written consent of Diapason is strictly prohibited and could
lead to legal action.
Last update on 13 January 2012.
Compliance approved on May 29, 2012
Top Related